the Creative Commons Attribution 4.0 License.
the Creative Commons Attribution 4.0 License.
 | 02 Nov 2018
Impacts of shipping emissions on PM2.5 pollution in China
Zhaofeng Lv
Qi Ying
Mingliang Fu
Zhihang Meng
Yue Wang
Wei Wei
Huiming Gong
Kebin He
With the fast development of seaborne trade and relatively more efforts on reducing emissions from other sources in China, shipping emissions contribute more and more significantly to air pollution. In this study, based on a shipping emission inventory with high spatial and temporal resolution within 200 nautical miles (Nm) to the Chinese coastline, the Community Multiscale Air Quality (CMAQ) model was applied to quantify the impacts of the shipping sector on the annual and seasonal concentrations of PM2.5 for the base year 2015 in China. Emissions within 12 Nm accounted for 51.2 %–56.5 % of the total shipping emissions, and the distinct seasonal variations in spatial distribution were observed. The modeling results showed that shipping emissions increased the annual averaged PM2.5 concentrations in eastern China up to 5.2 µg m−3, and the impacts in YRD (Yangtze River Delta) and PRD (Pearl River Delta) were much greater than those in BTH (Beijing–Tianjin–Hebei). Shipping emissions influenced the air quality in not only coastal areas but also the inland areas hundreds of kilometers (up to 960 km) away from the sea. The impacts on the PM2.5 showed obvious seasonal variations, and patterns in the north and south of the Yangtze River were also quite different. In addition, since the onshore wind can carry ship pollutants to inland areas, the daily contributions of shipping emissions in onshore flow days were about 1.8–2.7 times higher than those in the rest of the days. A source-oriented CMAQ was used to estimate the contributions of shipping emissions from maritime areas within 0–12, 12–50, 50–100 and 100–200 Nm to PM2.5 concentrations. The results indicated that shipping emissions within 12 Nm were the dominant contributor, with contributions 30 %–90 % of the total impacts induced by emissions within 200 Nm, while a relatively high contribution (40 %–60 %) of shipping emissions within 20–100 Nm was observed in the north of the YRD region and south of Lianyungang, due to the major water traffic lanes far from land. The results presented in this work implied that shipping emissions had significant influence on air quality in China, and to reduce its pollution, the current Domestic Emission Control Area (DECA) should be expanded to at least 100 Nm from the coastline.
- Article
(10116 KB) -
Supplement
(1735 KB) - BibTeX
- EndNote


The marine transport sector is regarded as an important source of air pollutants, emitting carbon monoxide (CO), sulfur oxides (SOx), nitrogen oxides (NOx), particulate matter (PM), volatile organic compounds (VOCs) and greenhouse gas (Corbett and Fischbeck, 1997). The pollutants emitted from ships can be carried in the atmosphere over several hundreds of kilometers inland by the onshore flow and significantly affect the inland air quality, especially with higher aerosol concentrations. In recent years, shipping emissions have become one of the fast-growing sources due to the increase in global shipping business in the long term. It is expected to contribute to 17 % of global CO2 emissions in 2050 (Cames et al., 2015). Liu et al. (2016) found that shipping emissions in East Asia caused 14 500–37 500 premature deaths in 2013, the amount of which had doubled since 2005. In China, the severe haze pollution remains a significant concern because of its high frequency of occurrence, especially in megacities, where ships can contribute 20 %–30 % of the total PM2.5 during ship-plume-influenced periods (Fu and Chen, 2017; Liu et al., 2017b). Therefore, it is necessary to quantify the effects of shipping emissions on the air quality at local and regional scale.
The influence of ship traffic on air quality varies in different areas, due to differences in many complicated factors, such as meteorological conditions and emission intensities from ships and land-based sources. In Europe, although the increase in PM2.5 concentrations caused by emissions from ships is quite small, their relative contribution is large because of the low background PM2.5 concentrations in these regions (Viana et al., 2009; Aksoyoglu et al., 2016; Marelle et al., 2016). In China, although high concentrations of reactive air pollutants probably cause higher secondary PM (e.g., sulfate, nitrate) concentrations from shipping emissions, their relative contributions are lower due to larger emissions of land-based sources (Lang et al., 2017). However, the studies in China only focus on the impacts of shipping emissions on a small scale, typically located in Bohai Rim area, YRD (Yangtze River Delta) and PRD (Pearl River Delta) regions including several ports and limited surrounding areas, which are not available to comprehensively determine the characteristics of PM2.5 pollution caused by shipping emissions in the entire eastern coastal areas of China (Fan et al., 2016; Chen et al., 2017; Tao et al., 2017; Liu et al., 2017b, 2018a, b)
While reducing emissions from land-based sources, such as on-road vehicles and power plants, requires only provincial and national legislation and regulations, legislation to effectively control shipping emissions is a big challenge due to international maritime trade. The International Maritime Organization (IMO) is devoted to protecting the marine environment through prevention of sea pollution caused by ships. It has published the International Convention for the Prevention of Marine Pollution from Ships (MARPOL) Annex VI (IMO, 2017), in which four typical maritime regions are designated as Emission Control Areas (ECAs). The North and Baltic seas in Europe are defined as Sulfur Emission Control Areas (SECAs), where only low-sulfur-content fuel (<0.1 %) has been allowed to be used since 1 January 2015. Additionally, both SO2 and NOx emissions from vessels should be seriously controlled in areas within 200 nautical miles (Nm) of the coastline of North America and within 50 Nm of the included islands in the United States Caribbean Sea. In China, the Domestic Emission Control Area (DECA) is approved as a 12 Nm zone along the coastline in Bohai Rim, YRD and PRD regions, and the sulfur content of any oil used on-board vessels entering the DECA should not exceed 0.5 % after 2019. Whether reducing shipping emissions in the 12 Nm DECA alone is enough to prevent ship-related air pollution or not becomes an important issue. A study reported that even if the DECA along the coast of PRD were expanded to 200 Nm, it would not obviously reduce the air pollution from shipping emissions compared with the effects of a 12 Nm DECA (Liu et al., 2018a). However, for other coastal regions or cities in China, the rationality of the current DECA policy is unknown.
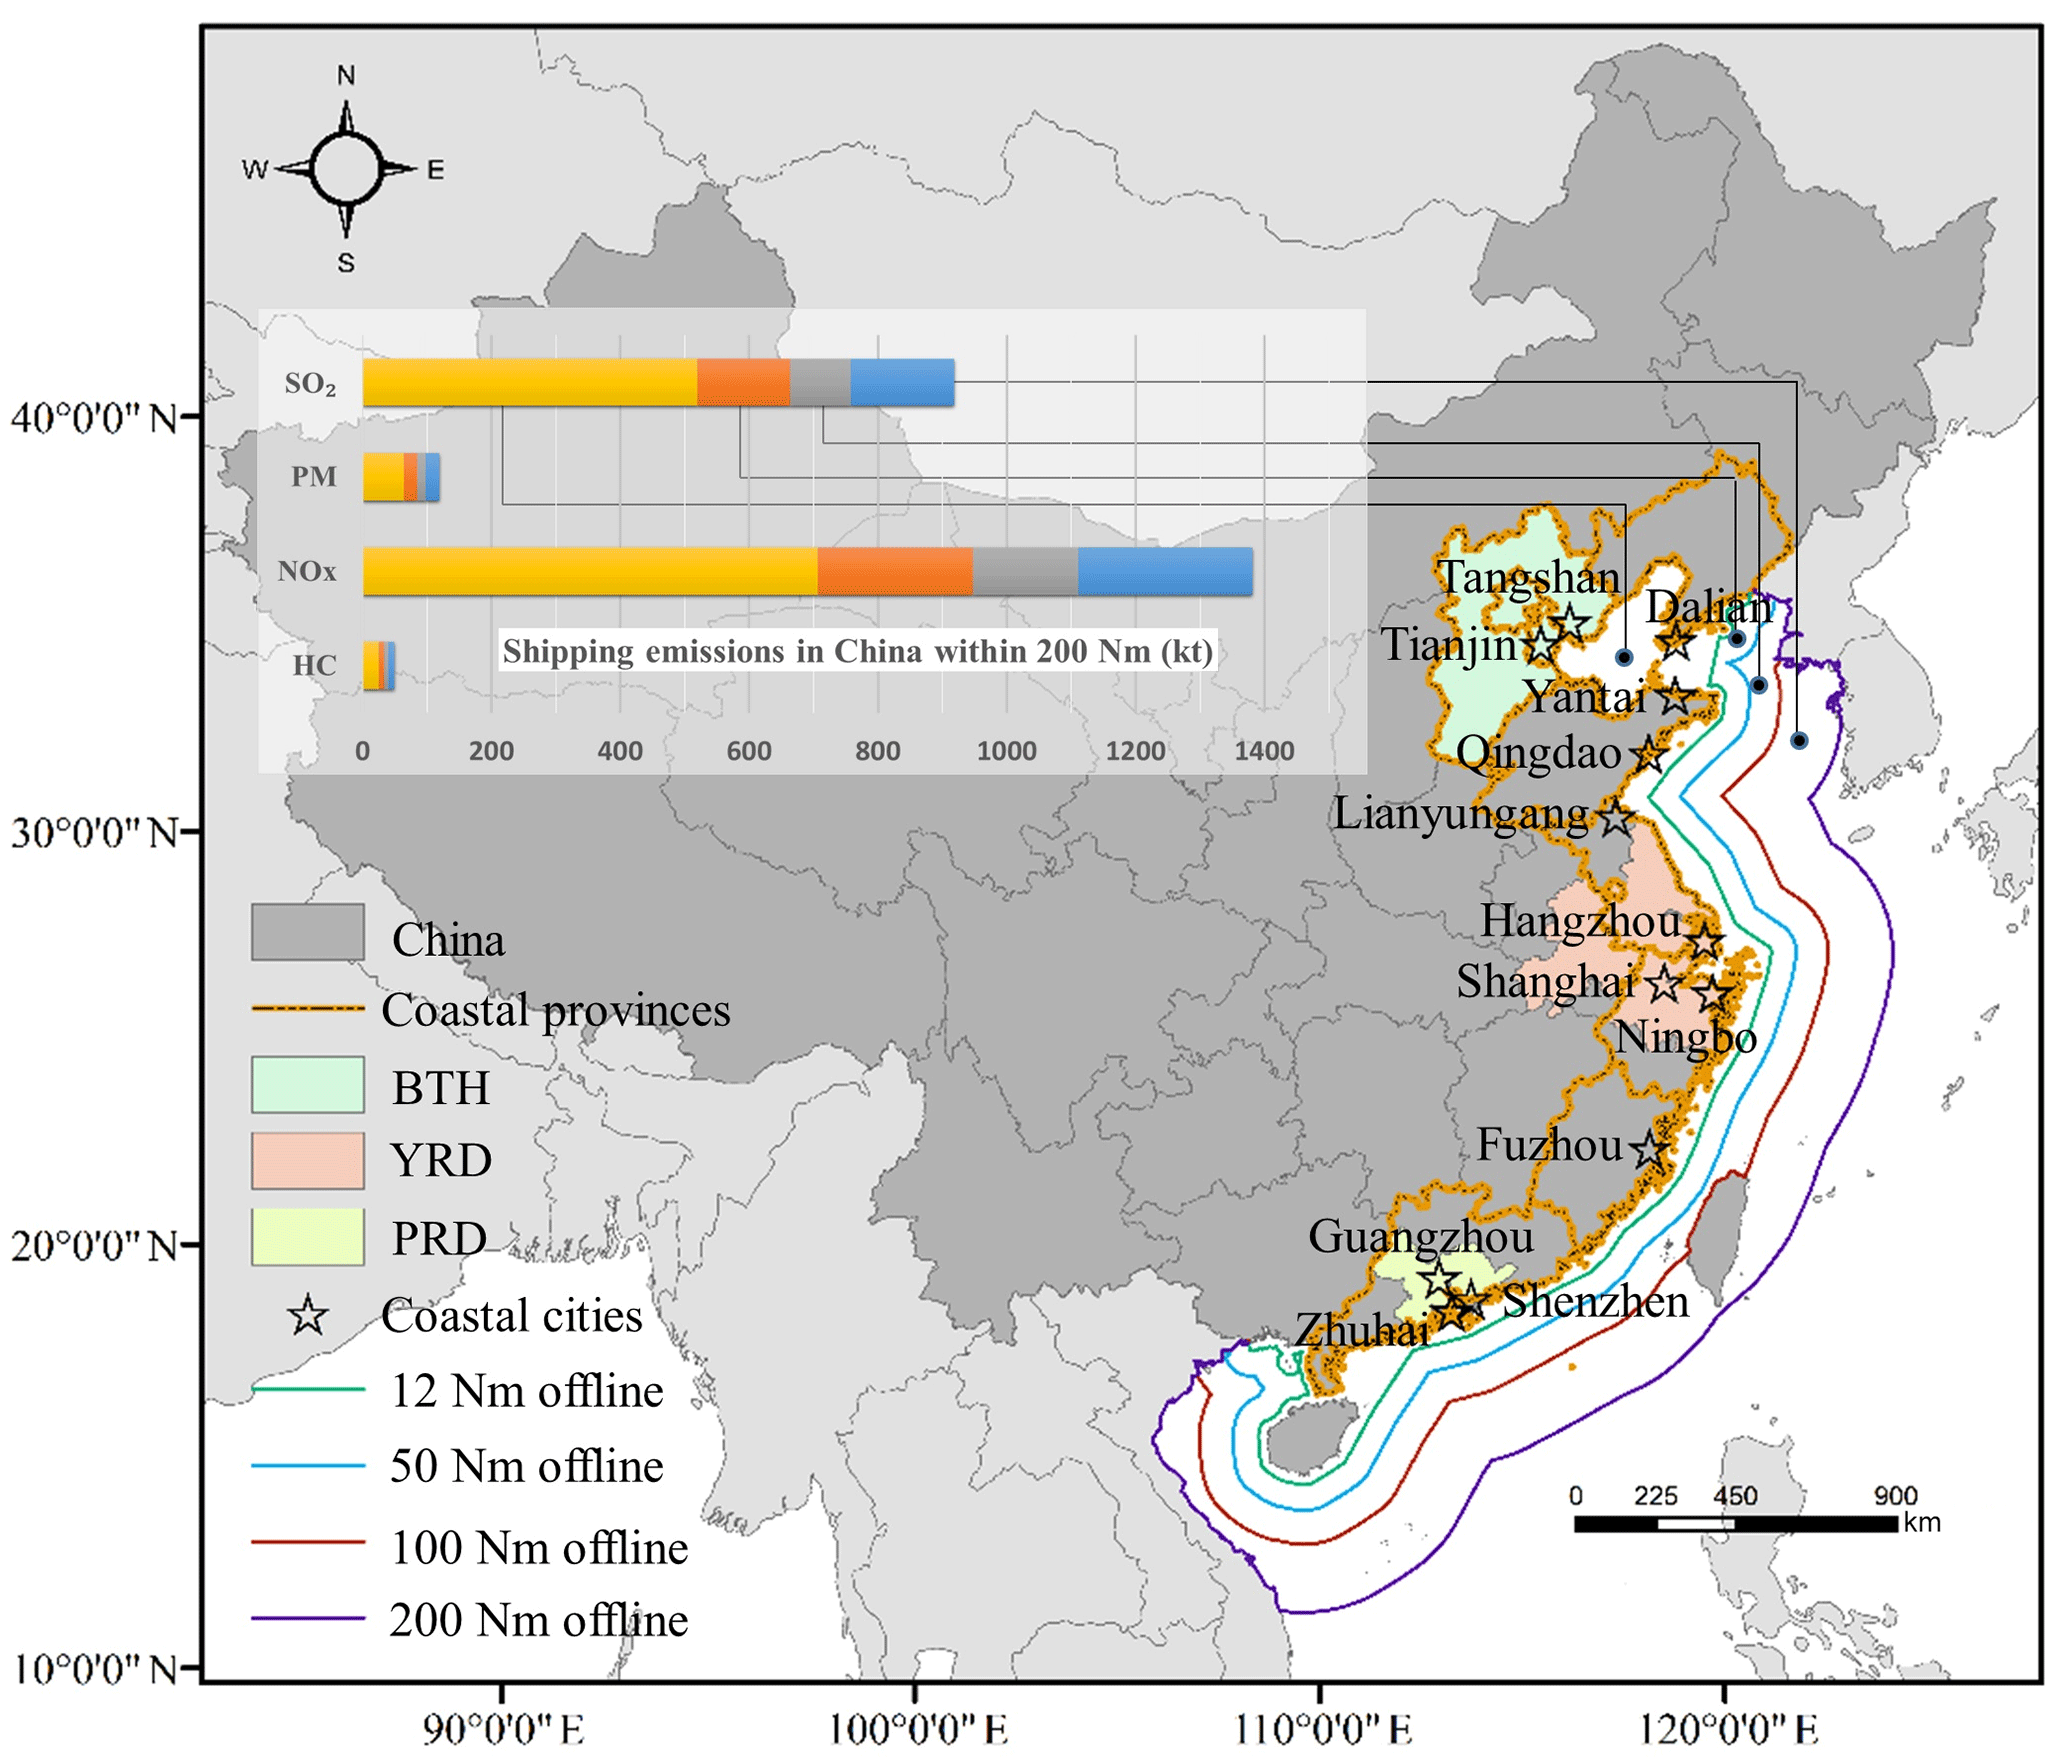
Figure 1Study area and the contributions of different maritime areas for the total shipping emissions. The yellow, red, gray and blue columns represent the amount of shipping emissions in the areas within 12, 12–50, 50–100 and 100–200 Nm of the Chinese coastline, respectively.
In this study, based on the shipping emission inventory with a high spatial and temporal resolution within 200 Nm of the Chinese coast, the annual and seasonal impacts of shipping emissions on PM2.5 concentrations in eastern areas and some key regions and cities of China were investigated in detail. The impacts of metrological conditions on PM2.5 pollution induced by shipping emissions were further analyzed. In addition, a source-oriented chemical transport model was applied to estimate contributions of shipping emissions emitted from different maritime areas, including within 12, 12–50, 50–100 and 100–200 Nm of the coastline, to the inland PM2.5 concentrations. The results of this work provided several suggestions for the development of DECA and related policies.
The models used in this study were the Weather Research and Forecasting Model (WRF) with version 3.8.1 and the Community Multiscale Air Quality (CMAQ) model with version 5.2, which were developed by US NCAR (National Center for Atmospheric Research) and US EPA (Environmental Protection Agency), respectively. To assess the influences of shipping emissions on air quality, the WRF–CMAQ system was applied to simulate the PM2.5 with (base case) and without shipping emissions (no ship case) during January, April, July and October 2015, which represented winter, spring, summer and fall, respectively, with 3 days of spin-up time for each run. As shown in Fig. 1, the modeling domain covered all of China and some parts of East Asia with a horizontal resolution of 36 km × 36 km, including three highly developed city clusters (BTH, YRD, PRD). A total of 13 highly populated coastal cities were selected to further discuss their air quality impacts from shipping emissions, including Dalian, Tangshan (in BTH), Tianjin (in BTH), Yantai, Qingdao, Lianyungang, Hangzhou (in YRD), Shanghai (in YRD), Ningbo (in YRD), Fuzhou, Shenzhen (in PRD), Guangzhou (in PRD) and Zhuhai (in PRD), and most of them had core ports. The first guess field and boundary conditions for WRF were generated from the 6 h NCEP FNL Operational Model Global Tropospheric Analyses dataset. The four-dimensional data assimilation (FDDA) was enabled using the NCEP ADP global surface and upper air observational weather data (http://rda.ucar.edu, last access: 25 October 2018). WRF and CMAQ used 32 vertical layers up to 100 hPa, and the lowest layer had a thickness of approximately 37 m. The major physical options in WRF included a Morrison two-moment microphysics scheme (Morrison et al., 2009), a Kain–Fritsch cumulus cloud parameterization (Kain, 2004), the Rapid Radiative Transfer Model (RRTM) longwave and shortwave radiation scheme (Iacono et al., 2008), the Pleim–Xiu Land Surface Model (Xiu and Pleim, 2001), and the Asymmetric Convective Model version 3.0 for the PBL parameterization (Pleim, 2007). In the latest version 5.2 of CMAQ the aerosol module version 6 (AERO6) was updated to reflect the recent advances in the formation of PM especially for secondary organic compounds. In this study, the CMAQ model was configured to use the CB05 gas-phase mechanism and the AERO6 aerosol module with aqueous chemistry.
A source-oriented CMAQ based on version 5.0.1 was also used in this study to determine source contributions to inland PM2.5 concentrations from shipping emissions of different maritime areas within 0–12, 12–50, 50–100 and 100–200 Nm to the coastline. This model tracked primary PM (PPM) and sulfate–nitrate–ammonium (SNA) ions and their precursors from different sources or source regions using tagged model species. Details of the source-oriented approach for PPM and SNA have been documented in Ying et al. (2008) and Ying and Kleeman (2006), respectively. The source-oriented CMAQ models have been applied successfully to study source and source region contributions in China (Zhang et al., 2012; Ying et al., 2014b; Hu et al., 2015, 2017; Shi et al., 2017; Qiao et al., 2018). In this study, the source-oriented CMAQ was configured to use SAPRC-07 as the gas phase mechanism and AERO6 as the aerosol module. Updates were made to the aerosol model to improve predictions of sulfate and secondary organic aerosol (SOA) (Ying et al., 2014a, 2015; Li et al., 2015). Shipping emissions from different distance ranges to the coastline, as determined using a geographic information system (GIS), were tracked with different tagged species to quantify their contributions. Emissions from other anthropogenic and biogenic sources were represented by non-tagged model species. The same emission inventories used to generate the base case simulations in CMAQv5.2 were also applied for the emissions in the source-oriented CMAQ model so emission totals at each grid cell remained the same.
A bottom-up shipping emission inventory within 200 Nm of China was used with a high horizontal resolution of for the base year of 2013, including four main reactive species: SO2, NOx, PM and hydrocarbon (HC) (Liu et al., 2016). The ocean-going vessels considered in this study were classified by 10 classification schemes, and lumped into four main types by cargo types, including cargo ship, container, tanker and others, as described in Table S1 in the Supplement. The distinct spatial characteristics of shipping emissions in this inventory can be accurately depicted in both regional and port scales (Liu et al., 2016; Fu et al., 2017). To capture the seasonal variation of shipping emissions more accurately, based on the timestamp of each Automatic Identification System (AIS) data and the shipping emission inventory model (SEIM) introduced in Liu et al. (2016), the monthly emissions from ships were recalculated, then used in the air quality models. Moreover, the HC emissions from ships were assigned to specific VOC species based on the measurement of VOC source profiles in our previous work (Xiao et al., 2018), then mapped into CB05 and SAPRC-07 lumped species, respectively, shown in Tables S2–S3. For PM speciation, the composition of the PM at 2.7 % sulfur in fuel was used reported by Buhaug et al. (2009), and the black carbon (BC), organic carbon (OC) and primary sulfate () fractions were set to 5.1 %, 10.0 % and 45.1 %, which was consistent with the work of Eyring (2005).
The land-based anthropogenic emission inventory for mainland China was from the Multi-resolution Emission Inventory for China (MEIC) data at a resolution of for the base year of 2015 (MEIC, http://www.meicmodel.org/, last access: 25 October 2018), but the vehicular evaporation emissions were not included, which were responsible for 39.20 % of total VOC emissions from the on-road sector (Liu et al., 2017a). Therefore, in this study, the vehicular evaporation emissions at a provincial level in China calculated in Liu et al. (2017a) were allocated to gridded emissions based on the spatial distribution of the road network. The MIX inventory was selected to characterize the emissions of anthropogenic sources from other countries in our domain (Li et al., 2017). For emissions from natural sources, the Model of Emissions of Gases and Aerosols from Nature (MEGAN) version 2.04 was used (Guenther et al., 2006). Open burning emissions used in this work were developed by Cai et al. (2017). Emissions from windblown dust and sea salt were calculated inline during the CMAQ run.
Model evaluation
In this work, the meteorological data at every 1 or 3 h (most at 3 h) from 14 meteorological stations, which were located in or near the core coastal cities mentioned above (Fig. S1), were obtained from the National Climate Data Center (NCDC, ftp://ftp.ncdc.noaa.gov/pub/data/noaa/, last access: 25 October 2018) integrated surface database. The model performance of four major meteorological parameters was evaluated: temperature at 2 m (T2), wind speed at 10 m (WS10), wind direction at 10 m (WD10) and relative humidity (RH). The criteria proposed by Emery et al. (2001) was used to judge the meteorological performance (the mean bias (MB) K for T2, MB m s−1 for WS10 and MB ∘ for WD10). High correlation coefficients (R, 0.5–0.9) and low normalized mean errors (NMEs, 6 %–38 %) proved that the model performances were acceptable, although the MB of T2 and WS10 were a litter higher than the suggested goal (Table S4).
We also estimated the model performance of CMAQ v5.2 in predicting the PM2.5 concentrations by comparing the modeled results with observations at 280 monitoring sites of 32 provincial capital cities in China, as described in Table S5. The real-time hourly observations were from the China National Environmental Monitoring Center (CNEMC, http://106.37.208.233:20035/, last access: 25 October 2018), which began to be released since January 2013. The simulated hourly PM2.5 agreed well with observations, with the overall model performance within the performance criteria suggested by Boylan and Russell (2006) (mean fractional bias (MFB) % and mean fractional error (MFE) %), while the model overestimated PM2.5 a little, mainly due to uncertainties in emission inventory and unavoidable deficiencies during meteorological and air quality simulation. In order to verify the spatial accuracy of the simulation, the observed annual mean concentrations of PM2.5 at all sites in the domain were compared with modeling results, as shown in Fig. S2. Model performance was better in coastal areas of eastern China where the economy was more developed and the air quality suffered more serious impacts from shipping emissions, compared to the less developed regions such as western China, due to more accurate emission inventories in the more developed regions. Furthermore, the differences in predicted concentrations of PM2.5 and its components from CMAQ v5.2 and the source-oriented CMAQ were investigated (Fig. S3). In general, the simulated PM2.5 were very similar, but slightly higher concentrations in CMAQ v5.2 were found compared with that in the source-oriented CMAQ. The differences were mostly caused by the difference in the SOA predictions as CMAQ v5.2 included additional SOA formation pathways that were not included in CMAQ 5.0.1 (Woody et al., 2016; Murphy et al., 2017). The predicted secondary inorganic aerosol concentrations showed excellent agreement between the two models, which provided confidence in the predicted source region contributions as described in the results section.
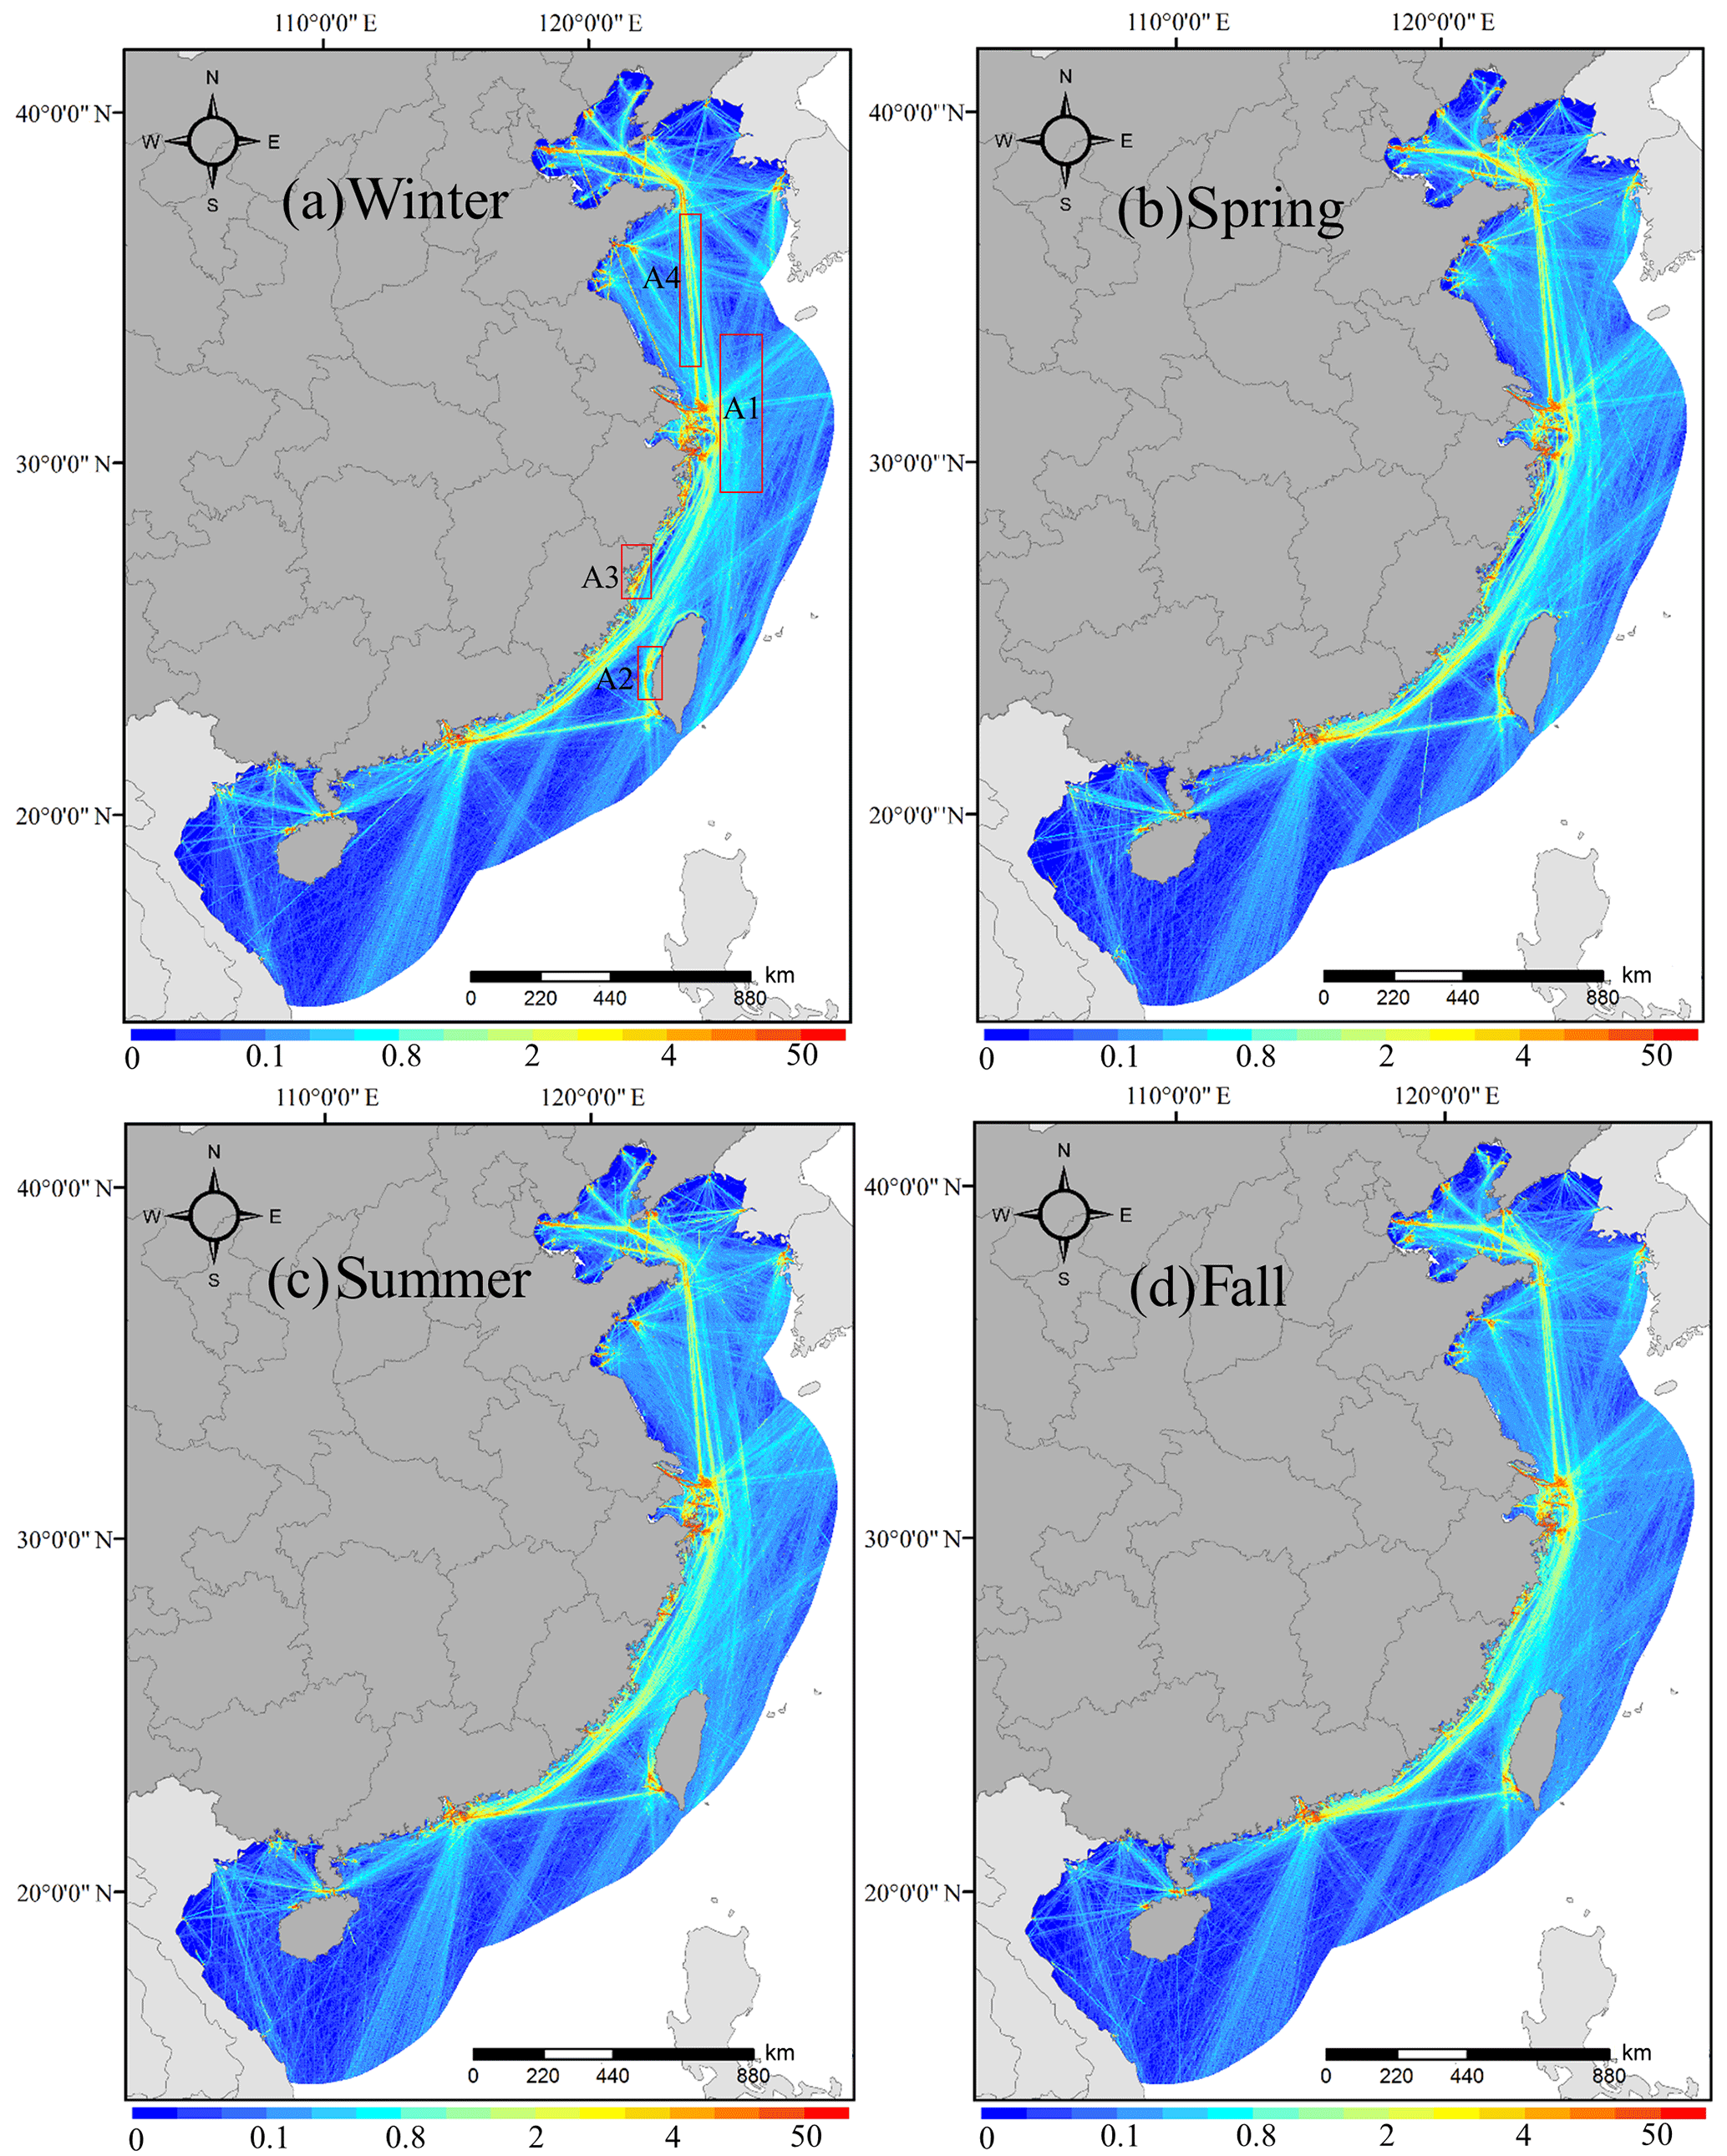
Figure 2Spatial distributions of SO2 emissions from ships at a resolution of 3 km × 3 km (unit, tonnes per grid) in (a) winter, (b) spring, (c) summer and (d) fall.
3.1 Shipping emission inventory with high resolution
The annual SO2, PM, NOx and HC emissions from ships within 200 Nm of the coastline of China in 2013 were 918.4, 119.3, 1380.9 and 49.3 kt. The emissions were slightly lower than those reported by Li et al. (2018), probably due to the differences in emission factors, AIS data and ship registration databases. The increase in shipping emissions near the coast of China was probably small from 2013 to 2015, because the global CO2 emissions from ships only increased by 2.5 % over that period (Olmer et al., 2017). SO2 and NOx emissions from ships accounted for 20.0 % and 13.5 % of the inland emissions from all sectors in coastal provinces of the MEIC inventory. The cargo ships were the most important contributor to the total shipping emissions, accounting for 43.7 %, 43.4 %, 41.9 % and 40.5 % of SO2, PM, NOx and HC emissions. The container and tanker also contributed 24.7 %–28.4 % and 17.5 %–19.7 % of the total shipping emissions. However, emissions from fishing boats were probably underestimated in this study (approximately 1.0 % of the totals) since most of them had no AIS data, which could affect the air quality significantly (Zhang et al., 2018). The emissions from ships within 12, 12–50, 50–100 and 100–200 Nm were further calculated to identify their contributions (Fig. 1). The emissions within 12 Nm of the shore were the dominant contributors of all pollutants, accounting for 51.2 %–56.5 % of the total shipping emissions. Emissions within 50–100 Nm only accounted for 10.2 %–11.9 % of the totals, which was the least among the four regions. The areal emission rates of SO2, PM, NOx and HC within 12 Nm were 1494.4, 185.7, 2033.5 and 73.3 kg km−2, respectively, approximately 5.1–6.3 times higher than those within 100–200 Nm.
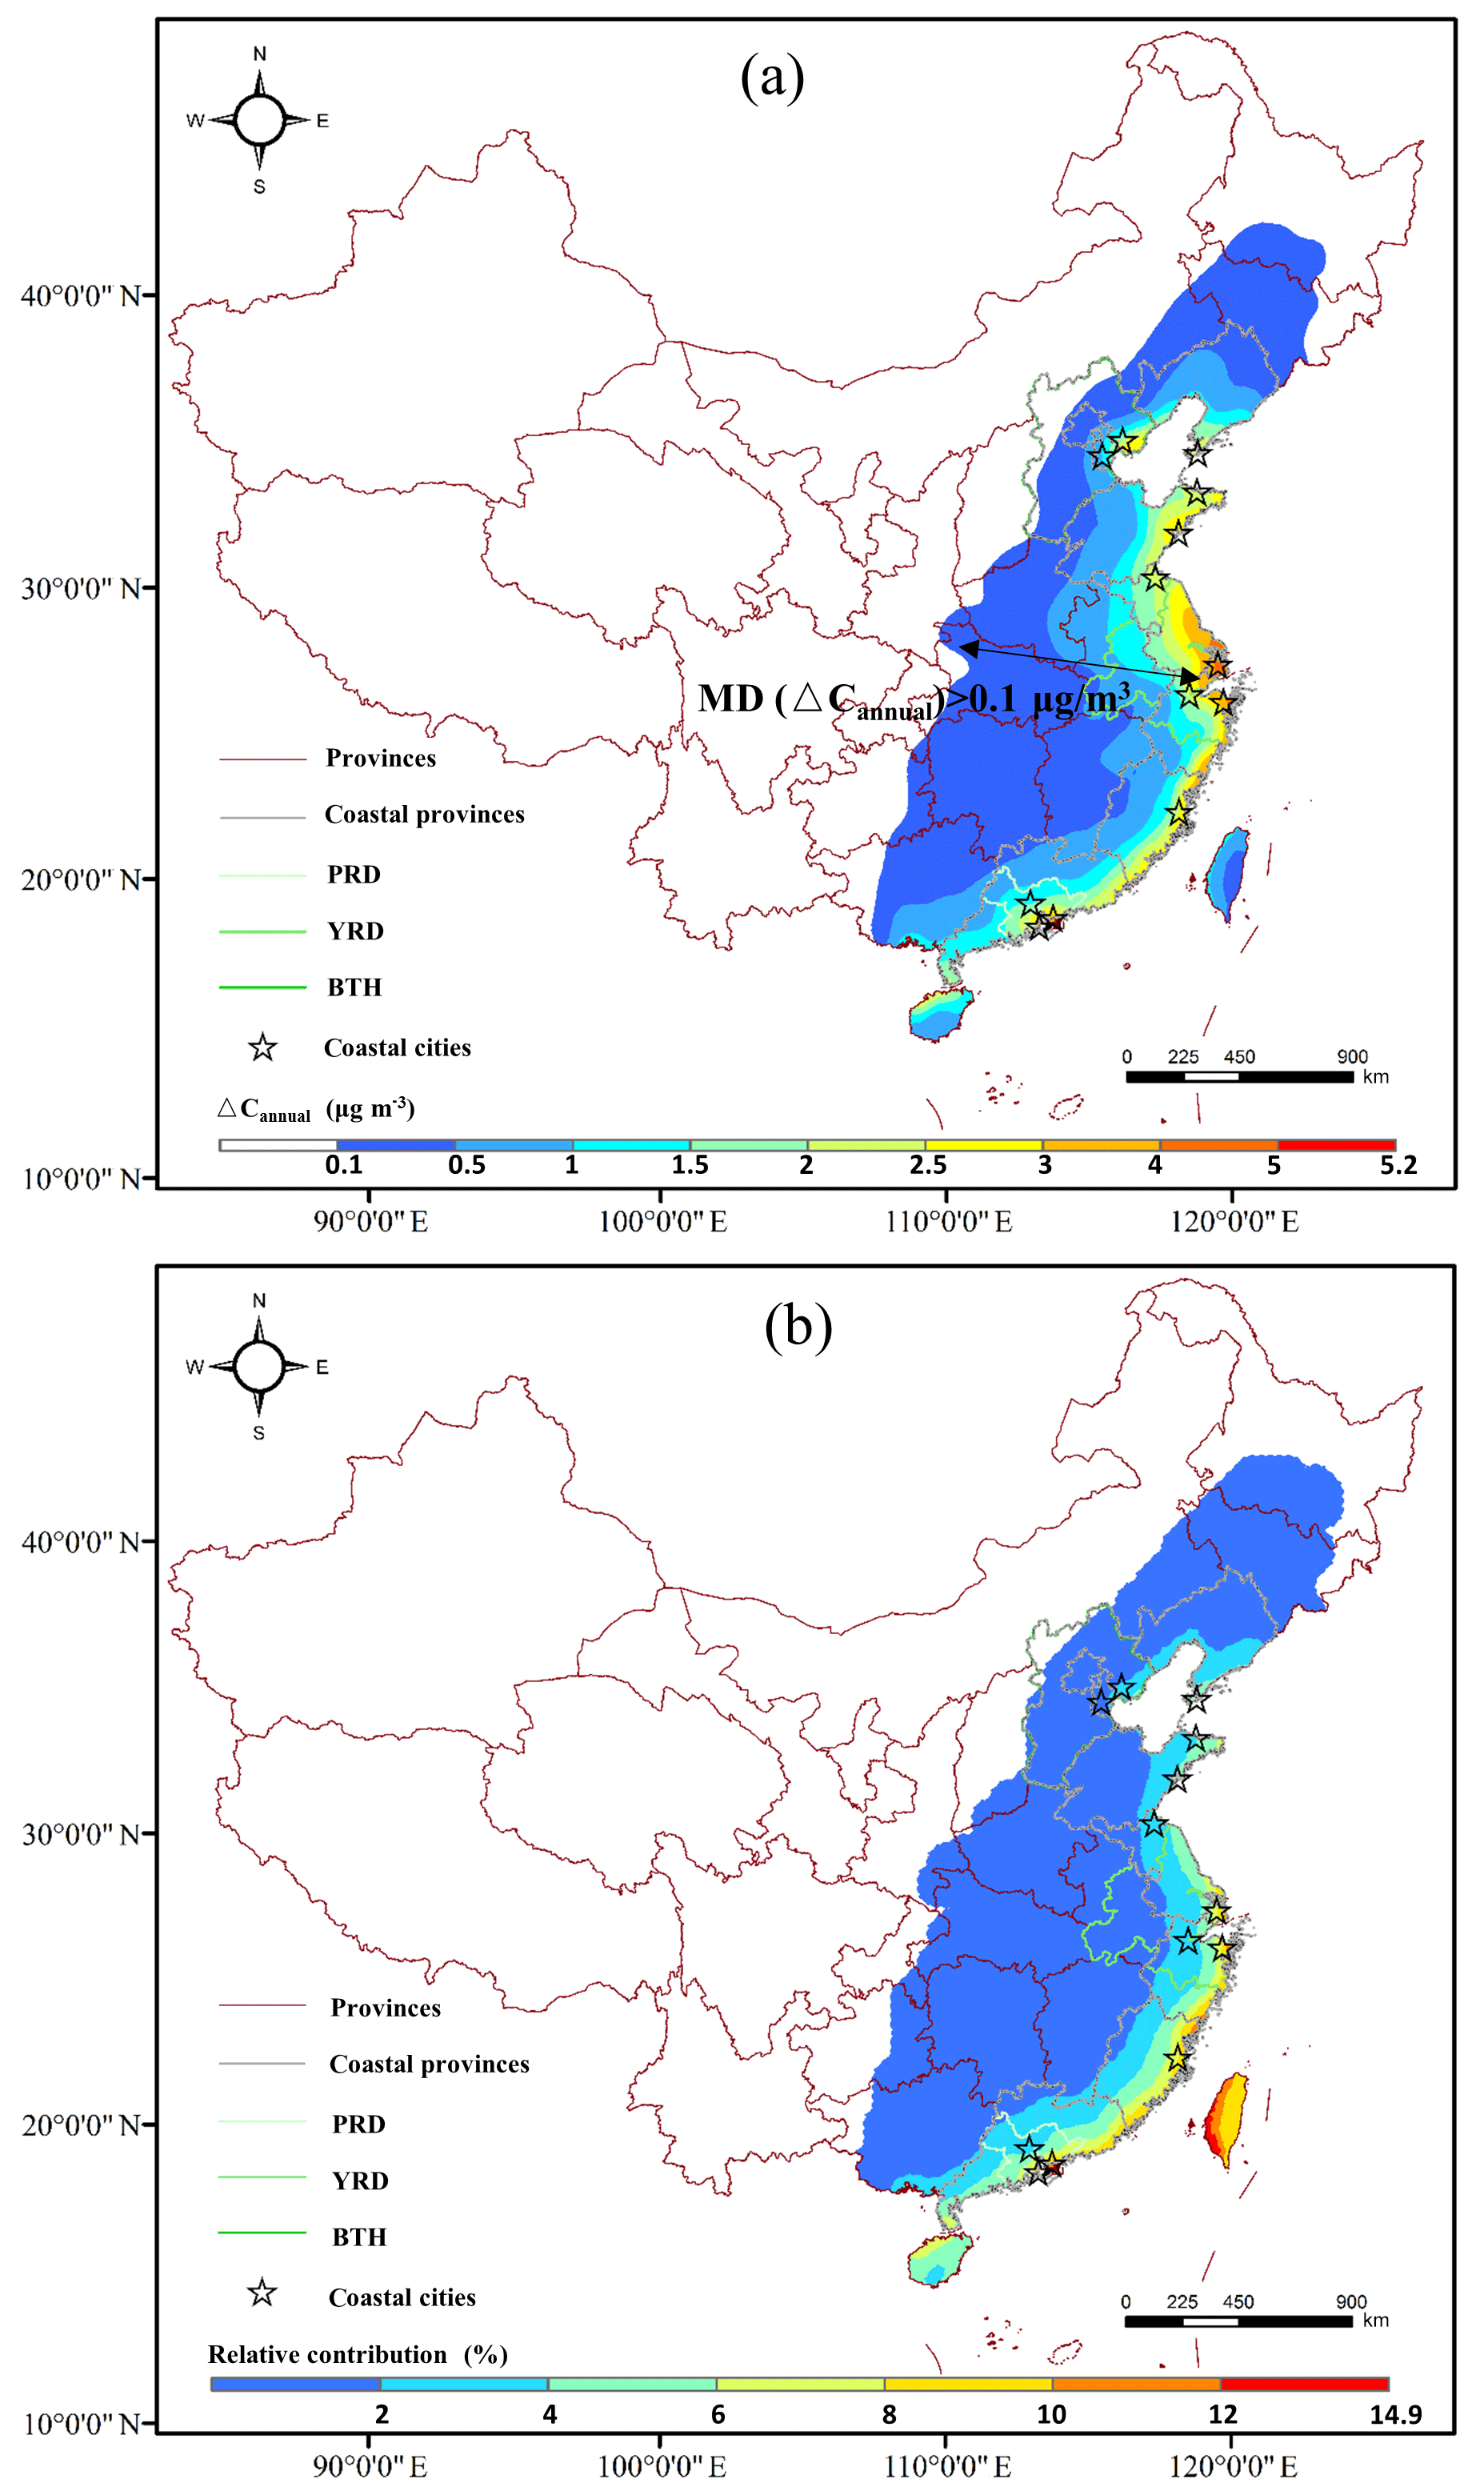
Figure 3Contributions of shipping emissions to the annual mean PM2.5 concentrations, including (a) absolute contributions (base case – no ship case) and (b) relative differences (relative to the base case concentrations).
The seasonal variation of shipping emissions was analyzed using the monthly data from January (winter), April (spring), July (summer) and October (fall). The highest shipping emissions of all pollutants were observed in winter, which was on average 1.04, 1.06 and 1.16 times higher than those in spring, summer and fall, respectively. Generally, the changes of total shipping emissions quantities in different seasons were quite small. This pattern was consistent with other studies with similar conclusions (Corbett et al., 1999; Fan et al., 2016; Li et al., 2016). The season variations in the spatial distribution of shipping emissions were also investigated as presented in Fig. 2. Overall, in winter, the shipping emissions were more concentrated along the major lanes between ports than those in other seasons. In addition, the distinct changes were observed in three areas, including the maritime area about 150 km away from the YRD harbors (A1), the southeast of the Taiwan Strait (A2) and the vicinity of Fuzhou port (A3). These seasonal changes were closely related to the activity variations of different ship types (Figs. S4–S6). In spring and summer, mainly due to the increase in long-distance cargo ships, significant emissions occurred in water traffic lanes far from the YRD region (A1). The decrease of cargo ship activities in Fuzhou port during summer and fall also resulted in the obviously reduced shipping emissions in A2. The emissions in A3 were lower in summer and fall because of the decreased activities of all ship types, including cargo ships, containers and tankers. The variations in spatial distribution indicated that monthly shipping emissions used in the air quality model of this work would capture the seasonal impacts more accurately than annual emissions without considering monthly variations.
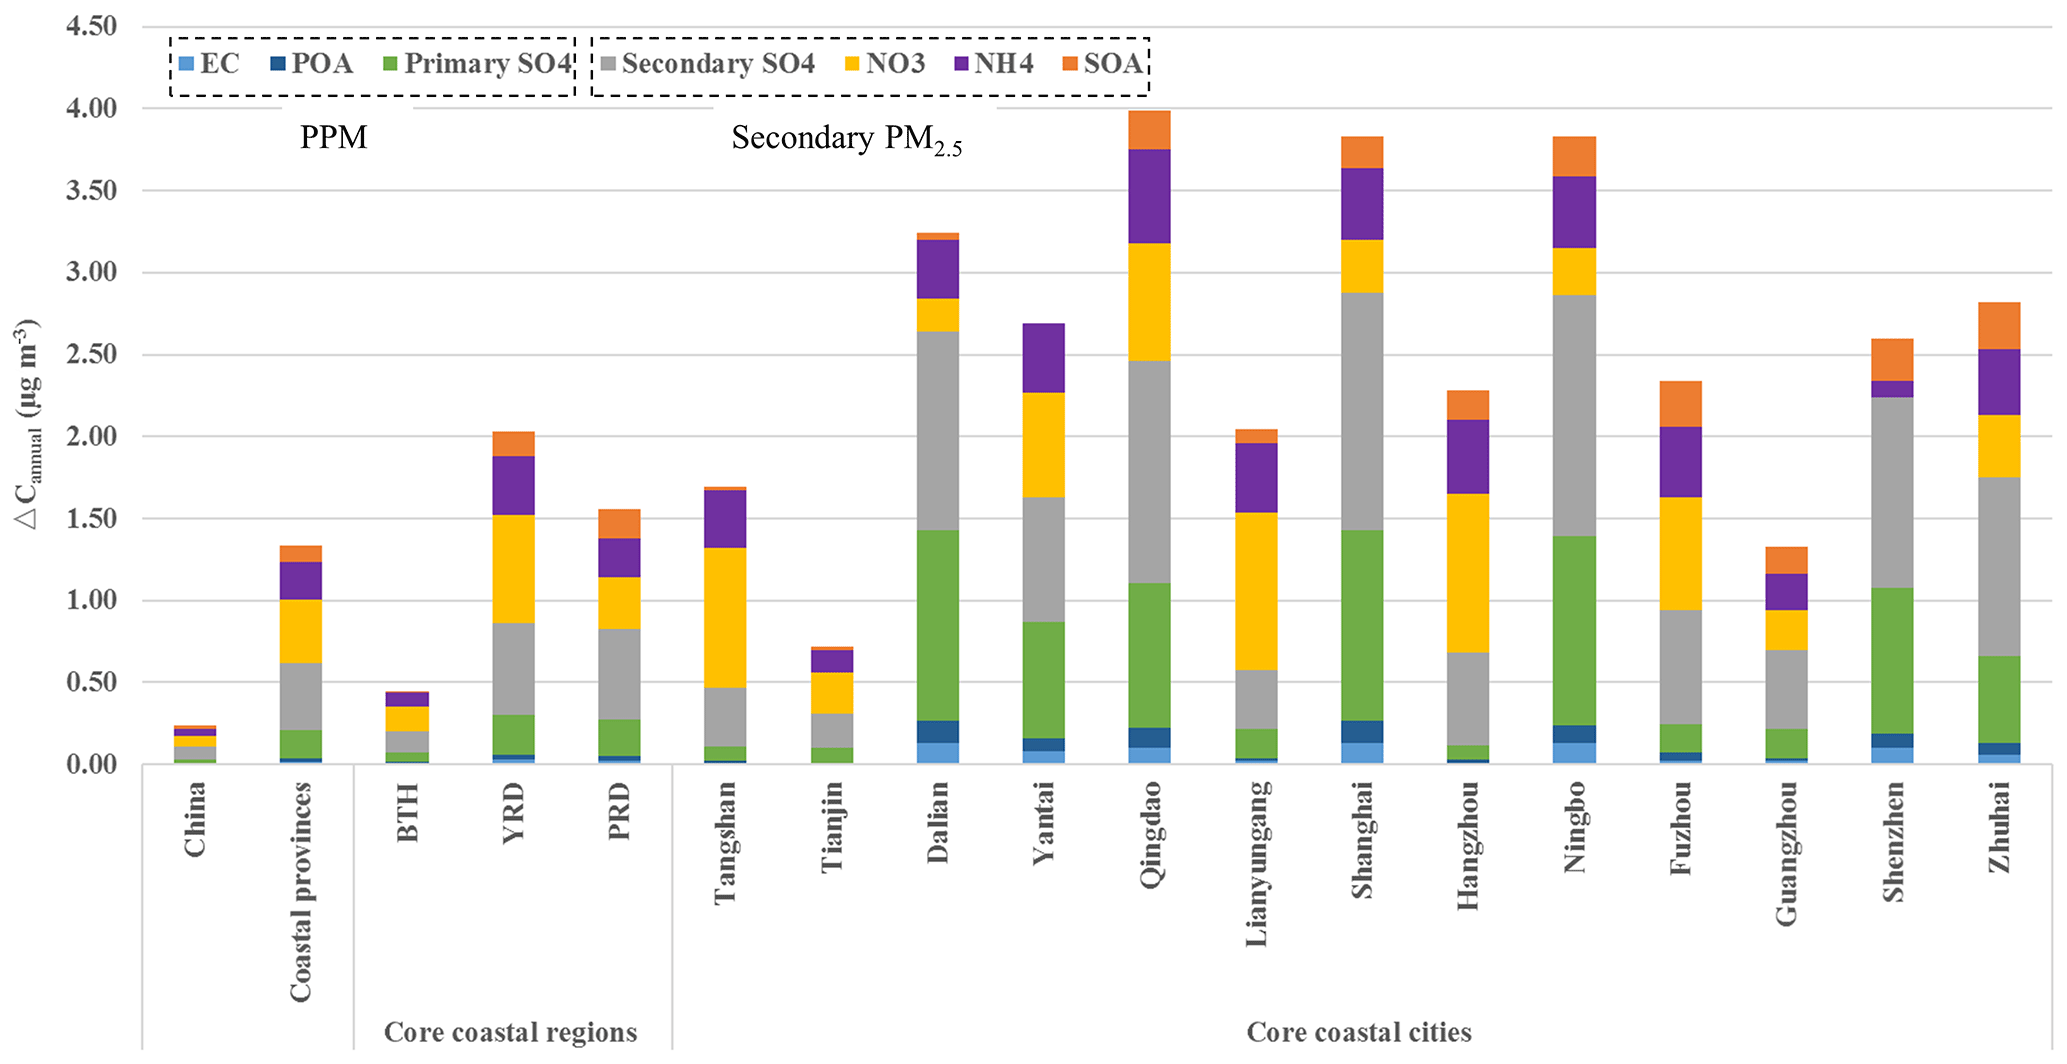
Figure 4Contributions of shipping emissions to the annual mean concentrations of total PM2.5 and detailed species in core coastal regions and cities (base case – no ship case).
Table 1MD for annual and seasonal impacts of shipping emissions in kilometers (km).
3.2 Annual PM2.5 impact from shipping emissions
Based on the results of the CMAQ model with (base case) and without shipping emissions (no ship case) within 200 Nm, the contributions of shipping sector to the inland PM2.5 concentrations were estimated. The annual averaged contribution of the shipping emissions to the increased concentration of PM2.5 (ΔCannual) in 2015 was calculated by averaging the modeling results of January, April, July and October, as presented in Fig. 3. The increased PM2.5 concentration in eastern China caused by shipping emissions was up to 5.2 µg m−3, and as the distance from the coastline increased, ΔCannual decreased dramatically. The most serious impacts were predicted in coastal areas of YRD region (more than 2.5 µg m−3), where large shipping emissions contributed to 20 % of the total shipping emissions in China (Fu et al., 2017). However, due to higher background PM2.5 concentrations mostly induced by land-based anthropogenic sources in China (Fig. S2), the annual mean relative contribution of shipping emissions was less than 12 %, except for Taiwan, which was much smaller than that in Europe (Aksoyoglu et al., 2016). For the same reason, although ΔCannual was smaller in Fuzhou and its surrounding areas than that in YRD, the relative contribution were approximately 2–4 times higher. In addition, in order to quantify how far the shipping emissions can be carried to inland areas, the maximum linear distance (MD) between coastline and areas where the PM2.5 concentration induced by ships was larger than a specific threshold was calculated by GIS (Table 1). The MDs of ΔCannual >0.1, 0.5 and 1 µg m−3 were 960, 510 and 350 km, respectively. The farthest areas affected by shipping emissions were typically located in a similar latitude to YRD (approximately 32∘ N), probably since the low terrain heights in this region were favorable for the long-range transport of air pollutants from sea to the inland areas (Fig. S1). The results illustrated that the shipping emissions influenced the air quality in not only coastal areas but also the inland areas as far as hundreds of kilometers away from the sea.
The shipping emissions caused not only the increase in PPM (element carbon (EC), primary organic aerosol (POA) and primary sulfate (PSO)), but also secondary PM (secondary sulfate (SO), nitrate (), ammonium ion () and SOA) formed from primary emitted precursors. The contributions of shipping emissions to the annual mean concentrations of the total PM2.5 and individual components in core coastal regions and cities were obtained by averaging the modeled concentrations in all grids of each area (Fig. 4). The averaged increases in PM2.5 concentration in the whole of China and all coastal provinces were 0.2 and 1.3 µg m−3, respectively, and the impacts of shipping emissions in YRD (2.0 µg m−3) and PRD (1.6 µg m−3) were much greater than those in BTH (0.4 µg m−3), where the shipping emissions were more concentrated at port level (Fu et al., 2017). The top four cities most seriously affected by shipping emissions were Qingdao (4.0 µg m−3), Shanghai (3.8 µg m−3), Ningbo (3.8 µg m−3) and Dalian (3.2 µg m−3). In addition to Qingdao, high contributions of the maritime sector were also observed in other coastal cities outside the three core city clusters, such as Lianyungang (2.0 µg m−3) and Fuzhou (2.3 µg m−3), which indirectly indicated that the existing DECA was not long enough in the north–south direction to prevent ship-related air pollution, and it should extend to the entire coastal area of eastern China in the future.
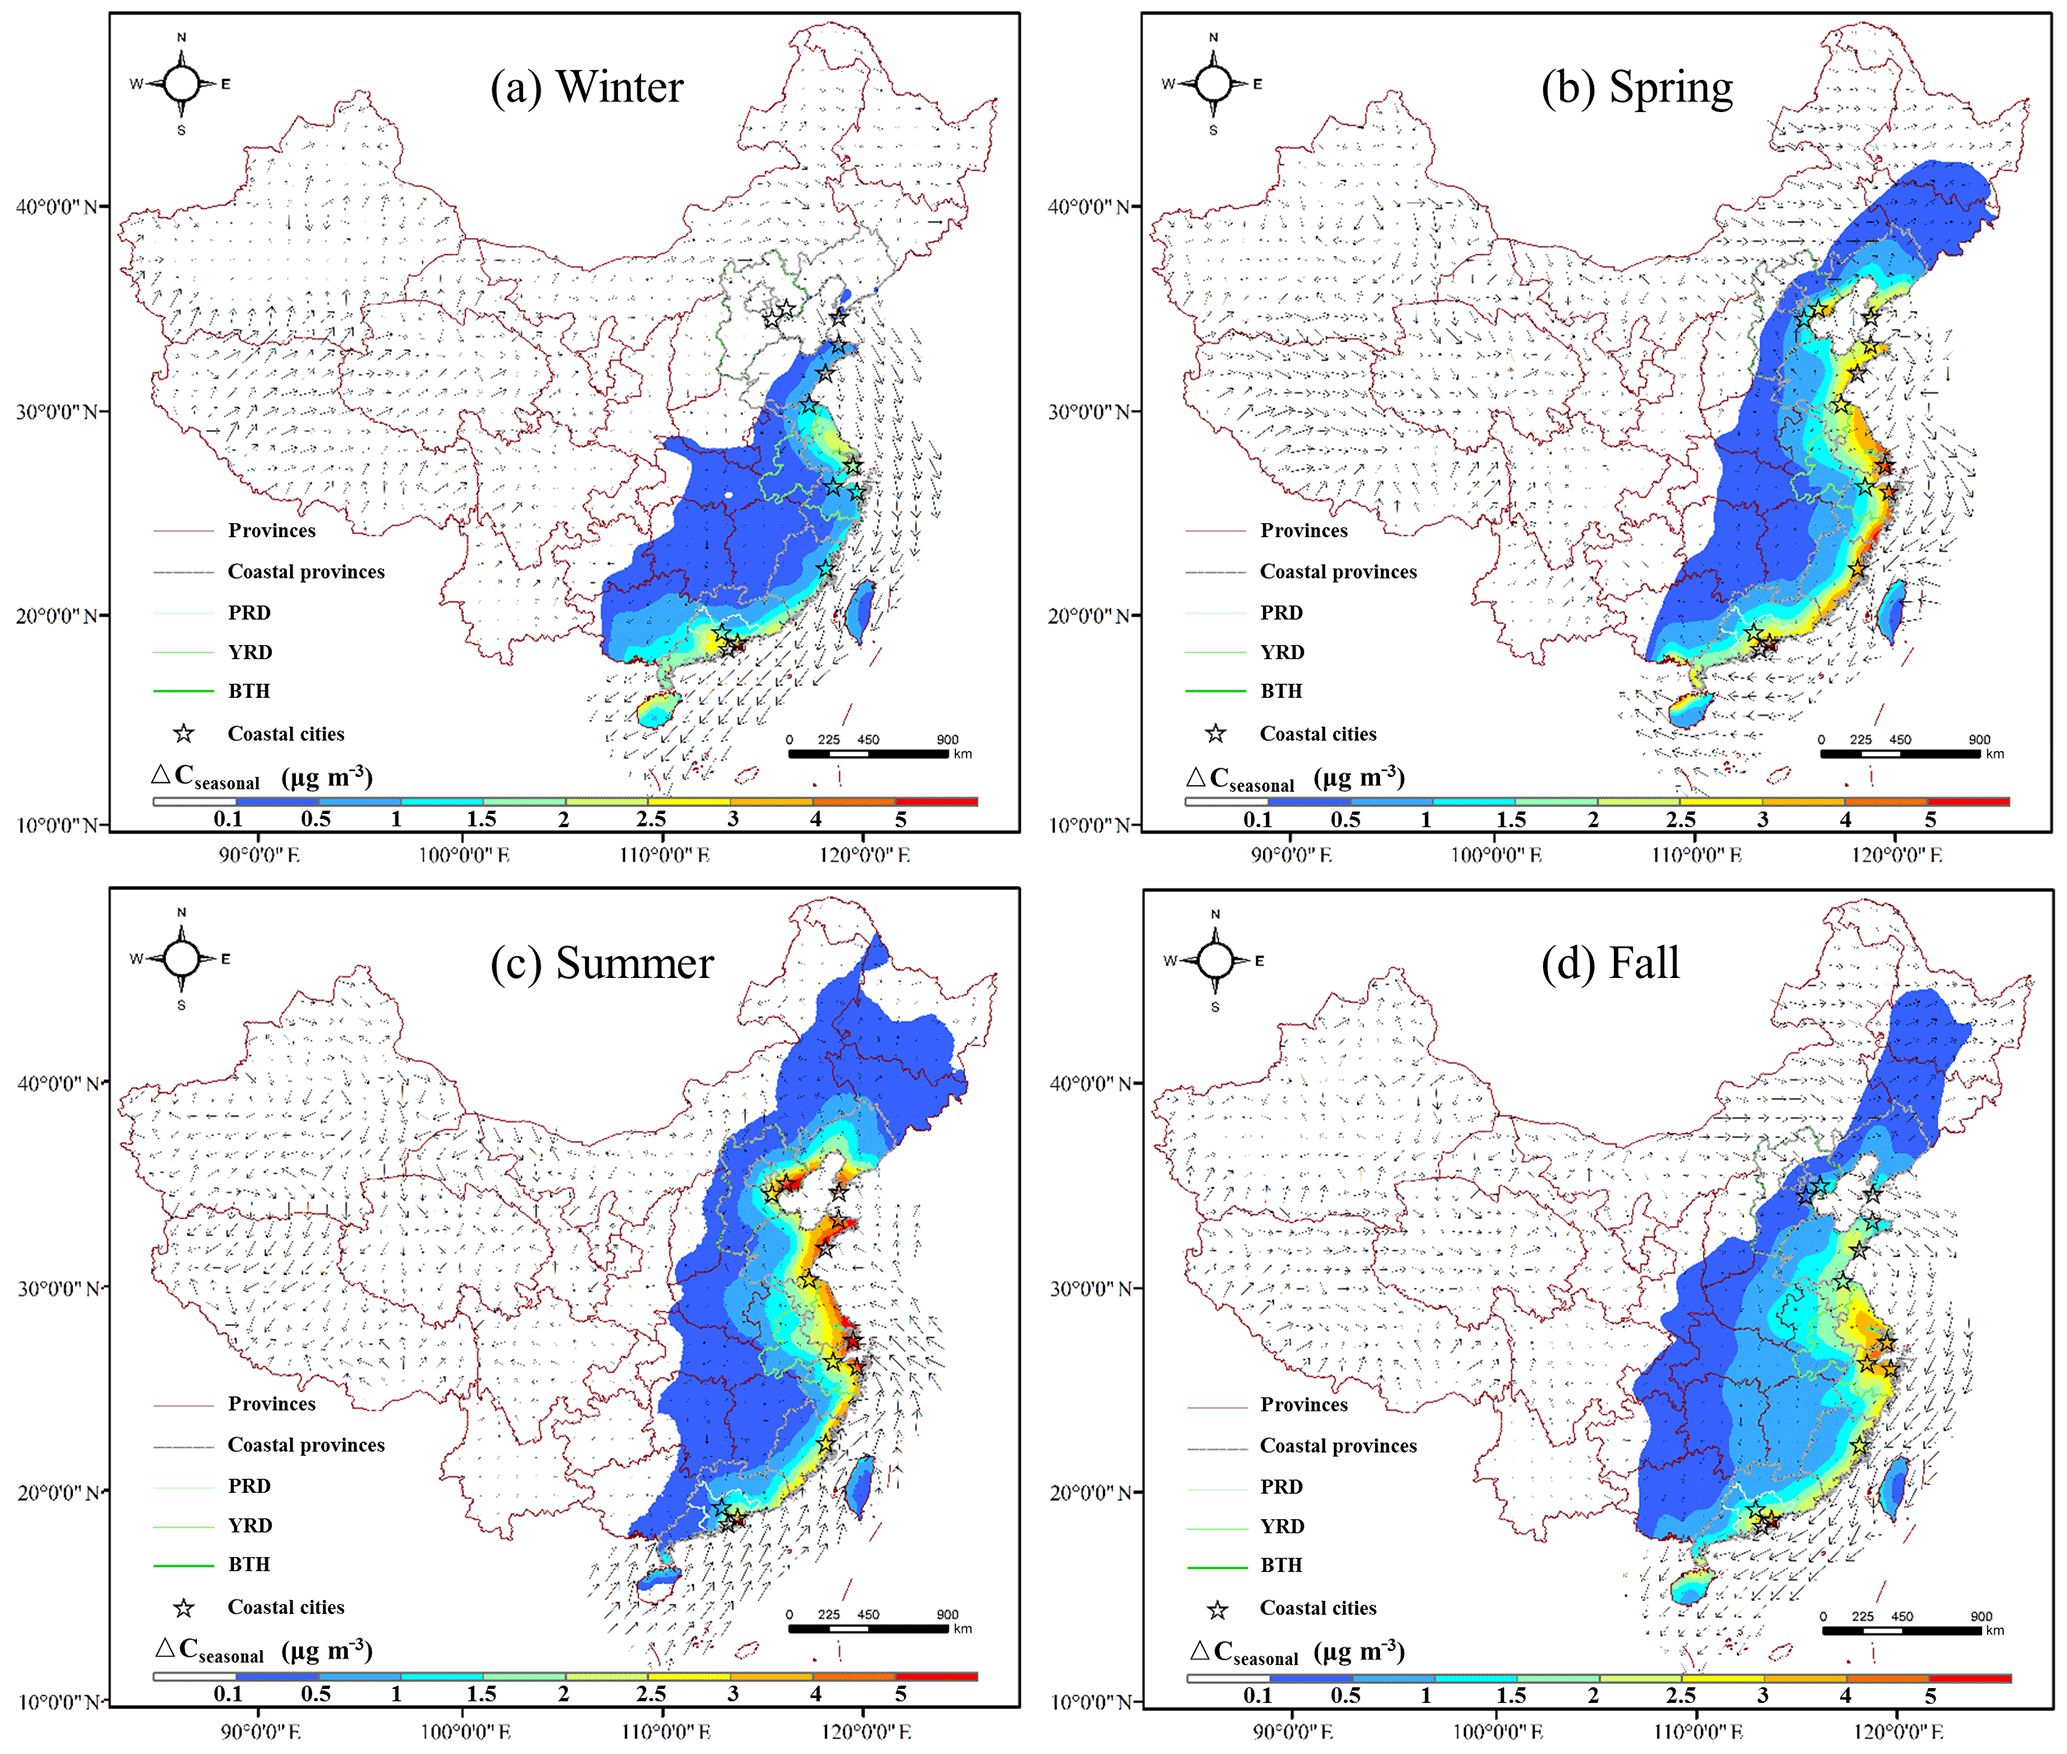
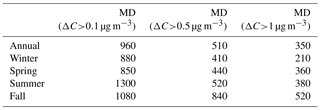
Figure 5Contributions of shipping emissions to the seasonal mean PM2.5 concentrations (base case- no ship case): (a) winter, (b) spring, (c) summer and (d) fall. Arrows represent the WRF modeled seasonal mean surface wind field.
The most important components of PM2.5 contributed by shipping emissions were SNA, accounting for 82.7 %–97.6 % of the total PM2.5 increase, and regional averaged contributions of , and were 49.2 %, 24.7 % and 15.8 %. The changes of SNA fraction in different areas were both related to shipping emissions and land-based emissions because the NOx and SO2 emissions from ships and ammonia emissions from the land led to the formation of secondary ammonium nitrate and ammonium sulfate. The concentrations of ship-emitted EC and the ratio of PSO ∕ EC in primary emissions (8.8 times) from ships were used to calculate the concentrations of ship-induced primary sulfate. The majority of the ship-induced sulfate was formed secondarily from oxidation of SO2, and only about one-third of it was from primary emission. The proportions of EC and organic aerosol (OA, the sum of POA and SOA) were relatively small due to a small amount of SOA formed from HC shipping emissions and the small fractions of EC and POA in PM emissions from ships. Moreover, we determined whether the concentrations of PPM or the secondary PM2.5 was affected more by shipping emissions. In all regions and cities, the PM2.5 pollution caused by shipping emissions was dominated by secondary species, with a mean contribution of 78.8 %. The mandatory fuel oil standard (0.5 % sulfur limit) in DECA would reduce the ship-induced sulfate and PPM concentrations, while our results illustrated that this control policy alone was not enough to reduce the total PM2.5 concentrations, particularly for nitrate and ammonium. After-treatment techniques should also be applied to the marine diesel engines to reduce NOx emissions, and more efforts should be made to reduce NH3 emissions from land-based sources, which is beneficial in reducing the secondary formation from shipping emissions.
3.3 Seasonal PM2.5 impact from shipping emissions
The changes in the mean PM2.5 concentration caused by shipping emissions in each season (ΔCseasonal) were analyzed separately (Fig. 5). Large seasonal variations in peak concentrations and the extent of impacted areas could be observed, and the changing patterns in northern and southern areas were also quite different. The largest impact of shipping emissions in the north of the Yangtze River was predicted in summer, with ΔCseasonal more than 5 µg m−3 in most coastal areas of the Bohai Rim, the YRD and the surrounding areas of Qingdao. The impact during winter was less significant, with ΔCseasonal less than 2.5 µg m−3. The seasonal variations in southern areas presented an opposite trend. Ship emissions were predicted to increase the PM2.5 concentrations by more than 2 µg m−3 in spring and fall but there are fewer effects in summer. The longest MD (ΔCseasonal >0.1 µg m−3) was calculated in summer with the value of 1300 km, showing that the emissions of ships could almost affect the northernmost areas of China (Table 1), while when the threshold of ΔCseasonal increased to 0.5 and 1.0 µg m−3, there was larger MD in fall compared with those in other seasons, which indicated that central China, hundreds of kilometers away from the sea, was critically influenced by ship-related air pollution.
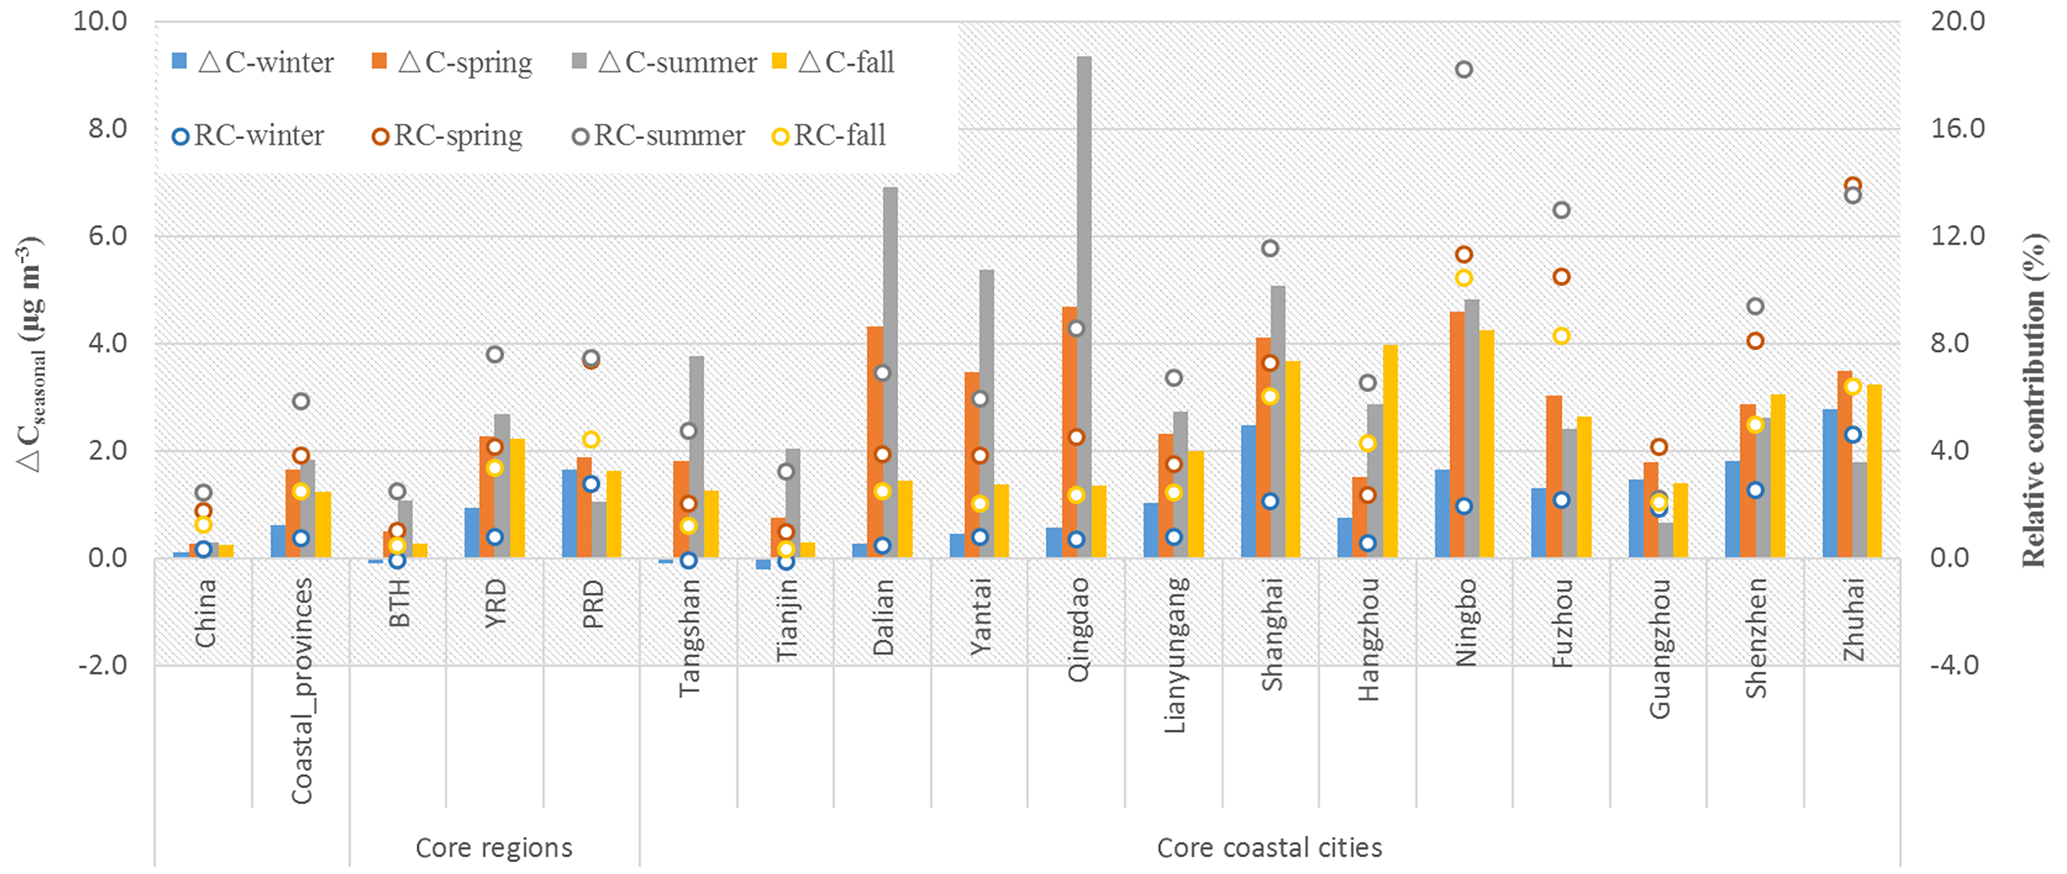
Figure 6Contributions of shipping emissions to the seasonal PM2.5 in core coastal regions and cities (base case – no ship case).
The differences in emission quantities and spatial distributions of vessels in the selected months alone could not explain the predicted seasonal variations. For example, in the YRD region, the emissions were larger and more concentrated in areas near the land in winter, but the contributions were still the lowest in the whole year. Therefore, these seasonal variations were probably related to the temporal changes of the meteorological conditions, particularly the direction of the prevailing winds, which was crucial for the diffusion and long-range transport of shipping emissions. Eastern China lies in the perennial monsoon region, and the summer monsoons could carry air pollutants related with shipping emissions to inland areas (Fig. 5c), while in winter, few contributions were observed in the BTH region and its surrounding areas, mainly due to the dominated wind from the northwest (Fig. 5a).
Figure 7Pollution rose maps in coastal cities: (a) Qingdao, (b) Shanghai, (c) Ningbo and (d) Dalian. The colors represent the daily contributions of shipping emissions to the total PM2.5 concentrations, and the baseline means the annual average of daily contribution. Max is the maximum daily increased PM2.5 concentrations by shipping emissions. The onshore WD is the wind direction in which marine air could be transported over land.
The contributions of shipping emissions to seasonal PM2.5 concentrations in coastal core regions and cities were further quantified (Fig. 6). The effects were most evident in summer for China and the entire coastal areas, which were 2.5 and 3.0 times higher than those in winter, respectively. In specific regions and cities, the great differences between the seasonal impacts could not be ignored. In summer, shipping emissions increased the PM2.5 concentrations in Qingdao, Dalian and Yantai by 9.4, 6.9 and 5.4 µg m−3, which were 16.4, 26.6 and 11.9 times larger than the smallest seasonal effects in winter, respectively, while for Zhuhai and Guangzhou, the seasonal impacts in spring were around 2 times higher than those in summer. Additionally, in almost all coastal regions and cities, the seasonal relative contributions of the shipping emissions to inland PM2.5 concentrations reached the peak in summer (2.2 %–18.8 %), indicating it played an important role in the inland PM2.5 air pollution during this period. It should be noted that although in the PRD region ΔCseasonal was the lowest in summer, the relative contribution of shipping emissions still remained at a high level. These were mainly because in eastern China, low emissions of land-based sources (e.g., fossil fuel combustion, biomass burning) and favorable meteorological conditions (e.g., large wet depositions, higher atmospheric mixing layer) in summer led to cleaner PM2.5 background level (Zhang and Cao, 2015).
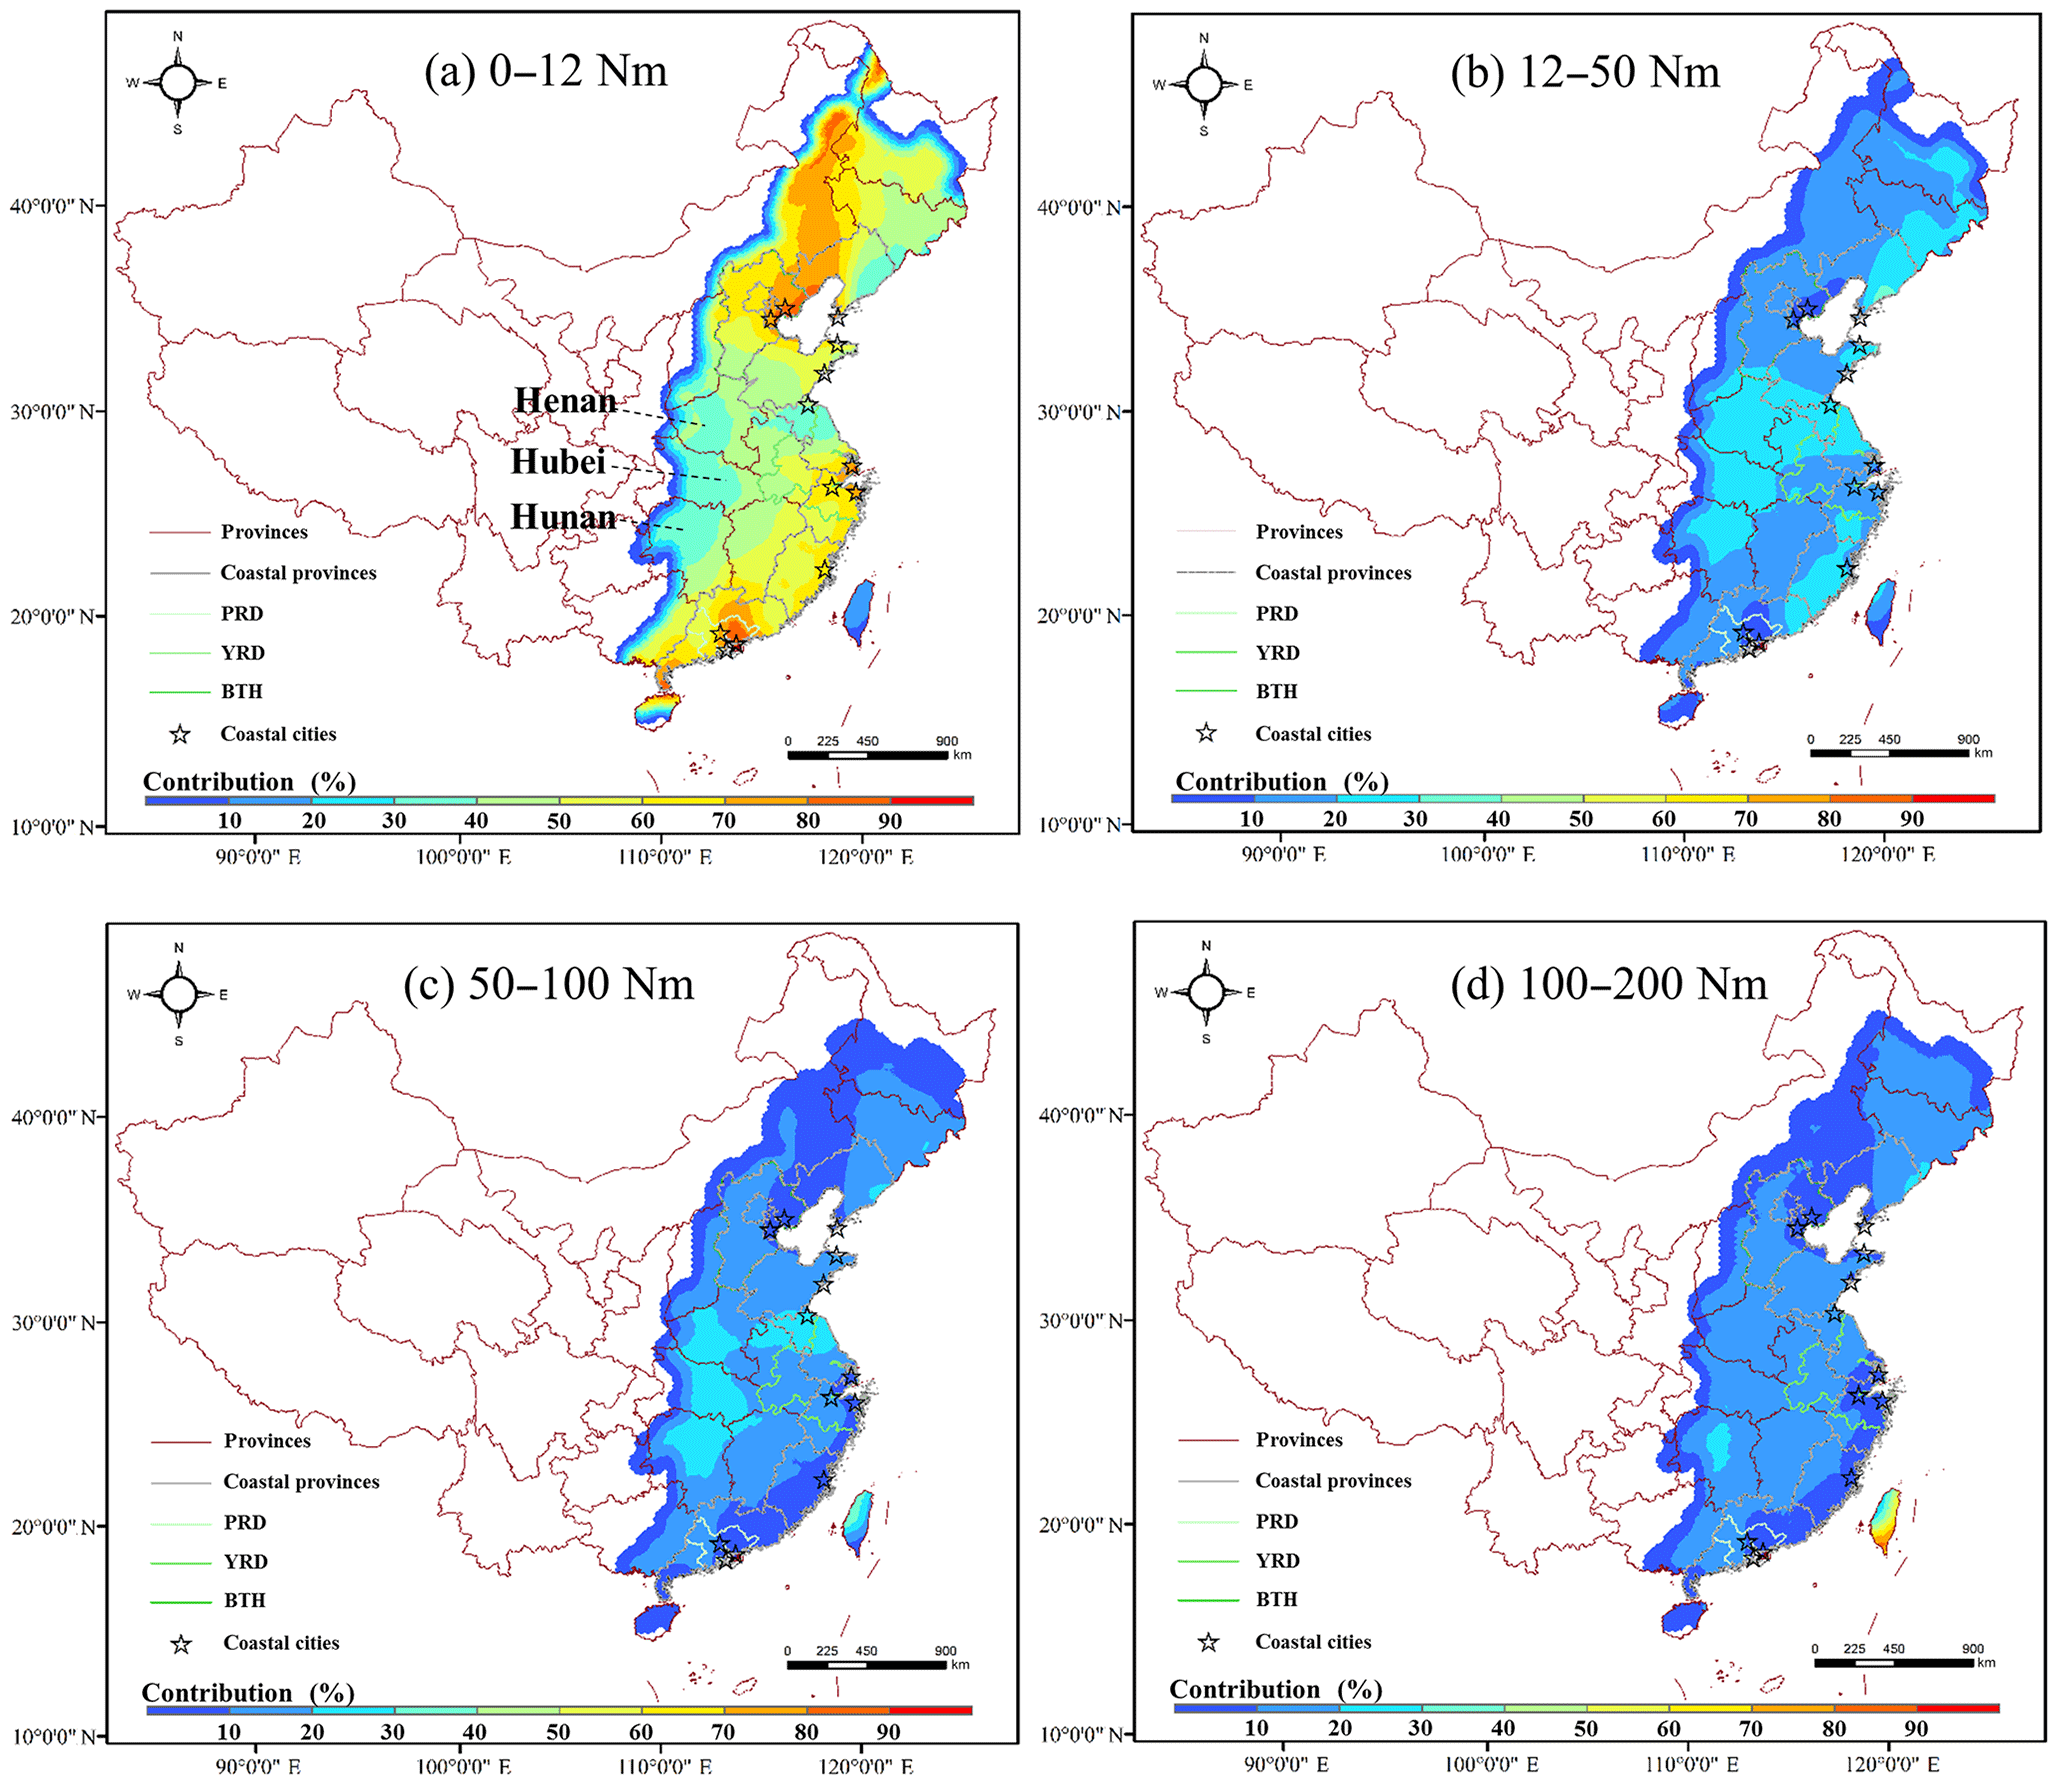
Figure 8Contributions of shipping emissions in different maritime areas to the total ship-induced PM2.5 concentration: (a) within 0–12 Nm, (b) within 12–50 Nm, (c) within 50–100 Nm and (d) within 100–200 Nm.
3.4 Influences of the onshore wind
Since the direction of the prevailing wind had an important role in the eventual impacts of emissions from ships on the inland air quality, relationships between their daily means in four cities most affected by shipping emissions were quantified (Fig. 7). The daily mean surface wind directions in the local area were calculated from WRF modeling results by vector-averaging. Based on the geographical location of the selected cities, the wind direction regarded as onshore was identified. To determine the daily impacted levels from shipping emissions, the annual averaged daily contribution of marine transport sectors to the PM2.5 concentrations was defined as a baseline value in each individual city. The results showed that coastal locations frequently experienced onshore winds that transported marine air over land. In Qingdao, Shanghai, Ningbo and Dalian, 48.0 %, 63.4 %, 48.8 % and 61.0 % of the days were considered as onshore flow days, respectively. On these days, higher relative contributions from the shipping sector to the inland air quality were observed. This was because the onshore wind could carry not only the ship-related air pollutants, but also the clean air from sea to land, which could cause a low PM2.5 background level in inland areas. During the onshore flow days, shipping emissions led to a ∼4.7 %–17.1 % increase on average in the inland PM2.5, about 1.8–2.7 times higher than that in rest of the days. The frequency of heavy shipping polluted days (daily relative contributions 1.5 times larger than the baseline) along with the onshore wind was 82.4 %–100.0 %, and simultaneously the inland daily PM2.5 concentrations increased by up to 20.3 %–38.1 % (10.5–26.8 µg m−3) due to shipping emissions. This revealed that in the period of frequent “onshore” winds, such as in summer for YRD and BTH regions, shipping emissions probably became one of the most important contributors to the air pollution. However, not all onshore wind would cause high contributions of ships, and it also depended on the spatial distribution of shipping emissions in surrounding marine areas. For example, during the period of westerly and northwesterly onshore flows in Dalian, the daily contributions were typically small, due to the relatively fewer emissions emitted from ships in the northern part of the Bohai Sea.
3.5 Contributions of shipping emissions from different maritime areas
The contributions of shipping emissions from maritime areas within 0–12, 12–50, 50–100 and 100–200 Nm to the total ship-related PM2.5 in summer were identified, respectively, using the source-oriented CMAQ model (Fig. 8). Only PPM and SNA formed from shipping emissions were tracked, not including SOA, which was quite a small portion (discussed in Sect. 3.2), and we assumed that the sum of them represented the concentration of the total ship-related PM2.5. Overall, shipping emissions within 12 Nm were the dominant contributor with the contributions of 30 %–90 % over the mainland China and more than 80 % for coastal areas of three major city clusters. As the distance away from the land increased, fewer air pollutants from shipping emissions were transported to the inland areas, and effects of emissions within 100–200 Nm only accounted for less than 20 % in most inland areas.
Due to the differences in distributions of shipping emissions, the surface structure and meteorological conditions, the contributions of emissions from ships within each maritime area may be diverse for individual inland areas. In terms of the areas located in the north of the YRD region and south of Lianyungang, due to the major water traffic lanes far from land around A4 and the increase in shipping emissions around A3 in summer (Fig. 2), significant emissions from ships within 12–100 Nm led to a relative higher contribution (40 %–60 %) in these areas, when the definite seasonal contributions of shipping emissions to the local PM2.5 concentration occurred (approximately 7 %). Moreover, some middle parts of China, including Henan province, Hubei province and Hunan province, were also significantly affected by the long-range transport of shipping emissions away from the coastline with the distance more than 12 Nm, probably due to the benefits of low terrain heights. Our results implied that DECAs within 12 Nm were not large enough in the latitudinal direction to prevent the PM2.5 pollution from shipping emissions, particularly for YRD region and its surrounding areas, and should be expanded to at least 100 Nm to the coastline.
The effects of shipping emissions on the PM2.5 concentrations for the base year of 2015 in China were described in details, using air quality models with an emission inventory of ocean-going vessels at a high spatial and temporal resolution. The annual SO2, PM, NOx and HC emissions from ships within 200 Nm of the coastline of China in 2013 were 918.4, 119.3, 1380.9 and 49.3 kt. These emissions led to the largest increase of 5.2 µg m−3 in annual averaged PM2.5 concentrations in eastern China, and the impacts in YRD (2.0 µg m−3) and PRD (1.6 µg m−3) were much greater than those in BTH (0.4 µg m−3). Qingdao (4.0 µg m−3), Shanghai (3.8 µg m−3), Ningbo (3.8 µg m−3) and Dalian (3.2 µg m−3) suffered the heaviest PM2.5 pollution caused by shipping emissions among all selected coastal cities. The ship-emission-impacted areas ranged from ∼350 to 960 km based on the cut-off concentrations of 1 and 0.1 µg m−3 from ship contributions. SNA accounted for 82.7 %–97.6 % of the total PM2.5 increase, and the ship-induced concentration of secondary species was much higher than that of PPM.
Although no significant differences were observed in the amount of shipping emissions in different seasons, the obvious seasonal variation in distributions of shipping emissions was detected in some marine areas. Distinct seasonal variations of impacts from shipping emissions were also observed, mainly due to the changes of the direction of the prevailing winds, and patterns in the north and south of the Yangtze River were also quite different. In summer, the seasonal impacts were more than 5 µg m−3 in coastal areas of BTH, YRD and its northern region, and relative contributions reached 2.2 %–18.8 % in all coastal areas, while little impact occurred during winter. Furthermore, the relationships between the daily contributions of shipping emissions and the dominant wind directions were discussed. A close association between onshore flow and significant increase in shipping contributions to PM2.5 was predicted. During the onshore flow days, shipping emissions led to a ∼4.7 %–17.1 % increase on average in the inland PM2.5, about 1.8–2.7 times higher than that in the rest of the days.
The contributions of emissions within 12, 12–50, 50–100 and 100–200 Nm accounted for 51.2 %–56.5 %, 15.8 %–17.4 %, 10.2 %–11.9 % and 17.5 %–19.7 % of the total shipping emissions within 200 Nm, respectively, while their contributions to the total PM2.5 impacts from ships in summer were quite different from their shares in emissions. Shipping emissions within 12 Nm were the dominant contributor, with contributions up to 30 %–90 % and more than 80 % for coastal areas of three major city clusters. Since there were major water traffic lanes far from land in the north of the YRD region and south of Lianyungang, a relatively high contribution (40 %–60 %) of shipping emissions within 20–100 Nm was predicted.
Based on the analysis of our model results, some recommendations for controlling shipping emissions in China can be made: (a) the area of DECA should expand from three core city clusters to the entire coastal area of eastern China; (b) in addition to using fuel with low sulfur content in DECA, the after-treatment techniques should also be applied to the marine diesel engines to reduce NOx emissions, and more efforts should be made to reduce NH3 emissions from land-based sources; (c) to reduce the major impacts of shipping emissions to PM2.5 concentrations in most coastal areas of China, the DECA should be expanded to at least 100 Nm to the coastline.
Data are available upon request from the corresponding author Huan Liu (liu_env@tsinghua.edu.cn).
The supplement related to this article is available online at: https://doi.org/10.5194/acp-18-15811-2018-supplement.
HL and KH conceived the study. ZL wrote the article. QY provided the model code and contributed to manuscript revision. MF and ZM calculated the shipping emissions. ZL and YW ran the air quality models. WW and HG provided constructive comments on this research.
The authors declare that they have no conflict of interest.
This article is part of the special issue “Shipping and the Environment – From Regional to Global Perspectives (ACP/OS inter-journal SI)”. It is a result of the Shipping and the Environment – From Regional to Global Perspectives, Gothenburg, Sweden, 23–24 October 2017.
This work was supported by the National Natural Science Foundation of China (nos.
41822505, 91544110 and 41571447), Beijing Nova Program (Z181100006218077),
National Key R&D Program (2016YFC0201504), and Special Fund of State Key
Joint Laboratory of Environment Simulation and Pollution Control
(16Y02ESPCT).
Edited by: Xavier Querol
Reviewed by: three anonymous referees
Aksoyoglu, S., Baltensperger, U., and Prévôt, A. S. H.: Contribution of ship emissions to the concentration and deposition of air pollutants in Europe, Atmos. Chem. Phys., 16, 1895–1906, https://doi.org/10.5194/acp-16-1895-2016, 2016.
Boylan, J. W. and Russell, A. G.: PM and light extinction model performance metrics, goals, and criteria for three-dimensional air quality models, Atmos. Environ., 40, 4946–4959, https://doi.org/10.1016/j.atmosenv.2005.09.087, 2006.
Buhaug, Ø., Corbett, J. J., Endresen, Ø., Eyring, V., Faber, J., Hanayama, S., Lee, D. S., Lee, D., Lindstad, H., Markowska, A. Z., Mjelde, A., Nelissen, D., Nilsen, J., Pålsson, C., Winebrake, J. J., Wu, W., and Yoshida, K.: Second IMO GHG Study 2009, IMO, available at: http://www.imo.org/en/OurWork/Environment/PollutionPrevention/AirPollution/Documents/SecondIMOGHGStudy2009.pdf (last access: 25 October 2018), 2009.
Cai, S., Wang, Y., Zhao, B., Wang, S., Chang, X., and Hao, J.: The impact of the “Air Pollution Prevention and Control Action Plan” on PM2.5 concentrations in Jing-Jin-Ji region during 2012–2020, Sci. Total. Environ., 580, 197–209, https://doi.org/10.1016/j.scitotenv.2016.11.188, 2017.
Cames, M., Graichen, J., Siemons, A., and Cook, V.: Emission Reduction Targets for International Aviation and Shipping, ENVI, available at: http://www.europarl.europa.eu/RegData/etudes/STUD/2015/569964/IPOL_STU(2015)569964_EN.pdf (last access: 25 October 2018), 2015.
Chen, D., Wang, X., Nelson, P., Li, Y., Zhao, N., Zhao, Y., Lang, J., Zhou, Y., and Guo, X.: Ship emission inventory and its impact on the PM2.5 air pollution in Qingdao Port, North China, Atmos. Environ., 166, 351–361, https://doi.org/10.1016/j.atmosenv.2017.07.021, 2017.
Corbett, J. J. and Fischbeck, P.: Emissions from Ships, Science, 278, 823–824, https://doi.org/10.1126/science.278.5339.823, 1997.
Corbett, J. J., Fischbeck, P. S., and Pandis, S. N.: Global nitrogen and sulfur inventories for oceangoing ships, J. Geophys. Res.-Atmos., 104, 3457–3470, https://doi.org/10.1029/1998jd100040, 1999.
Emery, C., Tai, E., and Yarwood, G.: Enhanced Meteorological Modeling and Performance Evaluation for Two Texas Ozone Episodes, Final Report, The Texas Natural Resource Conservation Commission, 12118 Park 35 Circle Austin, Texas 78753, 2001.
Eyring, V.: Emissions from international shipping: 1. The last 50 years, J. Geophys. Res., 110, D17305, https://doi.org/10.1029/2004jd005619, 2005.
Fan, Q., Zhang, Y., Ma, W., Ma, H., Feng, J., Yu, Q., Yang, X., Ng, S. K., Fu, Q., and Chen, L.: Spatial and Seasonal Dynamics of Ship Emissions over the Yangtze River Delta and East China Sea and Their Potential Environmental Influence, Environ. Sci. Technol., 50, 1322–1329, https://doi.org/10.1021/acs.est.5b03965, 2016.
Fu, H. and Chen, J.: Formation, features and controlling strategies of severe haze-fog pollutions in China, Sci. Total Environ., 578, 121–138, https://doi.org/10.1016/j.scitotenv.2016.10.201, 2017.
Fu, M., Liu, H., Jin, X., and He, K.: National- to port-level inventories of shipping emissions in China, Environ. Res. Lett., 12, 114024, https://doi.org/10.1088/1748-9326/aa897a, 2017.
Guenther, A., Karl, T., Harley, P., Wiedinmyer, C., Palmer, P. I., and Geron, C.: Estimates of global terrestrial isoprene emissions using MEGAN (Model of Emissions of Gases and Aerosols from Nature), Atmos. Chem. Phys., 6, 3181–3210, https://doi.org/10.5194/acp-6-3181-2006, 2006.
Hu, J., Wu, L., Zheng, B., Zhang, Q., He, K., Chang, Q., Li, X., Yang, F., Ying, Q., and Zhang, H.: Source contributions and regional transport of primary particulate matter in China, Environ. Pollut., 207, 31–42, https://doi.org/10.1016/j.envpol.2015.08.037, 2015.
Hu, J., Huang, L., Chen, M., Liao, H., Zhang, H., Wang, S., Zhang, Q., and Ying, Q.: Premature Mortality Attributable to Particulate Matter in China: Source Contributions and Responses to Reductions, Environ. Sci. Technol., 51, 9950–9959, https://doi.org/10.1021/acs.est.7b03193, 2017.
Iacono, M. J., Delamere, J. S., Mlawer, E. J., Shephard, M. W., Clough, S. A., and Collins, W. D.: Radiative forcing by long-lived greenhouse gases: Calculations with the AER radiative transfer models, J. Geophys. Res., 113, D13103, https://doi.org/10.1029/2008jd009944, 2008.
IMO: Emission Control Areas (ECAs) designated under MARPOL Annex VI, IMO, available at: http://www.imo.org/en/OurWork/Environment/Pollution (last access: 25 October 2018), 2017.
Kain, J. S.: The Kain-Fritsch Convective Parameterization: An Update, J. Appl. Meteorol., 43, 170–181, https://doi.org/10.1175/1520-0450(2004)043<0170:TKCPAU>2.0.CO;2, 2004.
Lang, J., Zhou, Y., Chen, D., Xing, X., Wei, L., Wang, X., Zhao, N., Zhang, Y., Guo, X., Han, L., and Cheng, S.: Investigating the contribution of shipping emissions to atmospheric PM2.5 using a combined source apportionment approach, Environ. Pollut., 229, 557–566, https://doi.org/10.1016/j.envpol.2017.06.087, 2017.
Li, C., Yuan, Z., Ou, J., Fan, X., Ye, S., Xiao, T., Shi, Y., Huang, Z., Ng, S. K. W., Zhong, Z., and Zheng, J.: An AIS-based high-resolution ship emission inventory and its uncertainty in Pearl River Delta region, China, Sci. Total Environ., 573, 1–10, https://doi.org/10.1016/j.scitotenv.2016.07.219, 2016.
Li, C., Borken-Kleefeld, J., Zheng, J., Yuan, Z., Ou, J., Li, Y., Wang, Y., and Xu, Y.: Decadal evolution of ship emissions in China from 2004 to 2013 by using an integrated AIS-based approach and projection to 2040, Atmos. Chem. Phys., 18, 6075–6093, https://doi.org/10.5194/acp-18-6075-2018, 2018.
Li, J., Cleveland, M., Ziemba, L. D., Griffin, R. J., Barsanti, K. C., Pankow, J. F., and Ying, Q.: Modeling regional secondary organic aerosol using the Master Chemical Mechanism, Atmos. Environ., 102, 52–61, https://doi.org/10.1016/j.atmosenv.2014.11.054, 2015.
Li, M., Zhang, Q., Kurokawa, J.-I., Woo, J.-H., He, K., Lu, Z., Ohara, T., Song, Y., Streets, D. G., Carmichael, G. R., Cheng, Y., Hong, C., Huo, H., Jiang, X., Kang, S., Liu, F., Su, H., and Zheng, B.: MIX: a mosaic Asian anthropogenic emission inventory under the international collaboration framework of the MICS-Asia and HTAP, Atmos. Chem. Phys., 17, 935–963, https://doi.org/10.5194/acp-17-935-2017, 2017.
Liu, H., Fu, M., Jin, X., Shang, Y., Shindell, D., Faluvegi, G., Shindell, C., and He, K.: Health and climate impacts of ocean-going vessels in East Asia, Nat. Clim. Change, 6, 1037–1041, https://doi.org/10.1038/nclimate3083, 2016.
Liu, H., Man, H., Cui, H., Wang, Y., Deng, F., Wang, Y., Yang, X., Xiao, Q., Zhang, Q., Ding, Y., and He, K.: An updated emission inventory of vehicular VOCs and IVOCs in China, Atmos. Chem. Phys., 17, 12709–12724, https://doi.org/10.5194/acp-17-12709-2017, 2017a.
Liu, H., Jin, X., Wu, L., Wang, X., Fu, M., Lv, Z., Morawska, L., Huang, F., and He, K.: The impact of marine shipping and its DECA control on air quality in the Pearl River Delta, China, Sci. Total Environ., 625, 1476–1485, https://doi.org/10.1016/j.scitotenv.2018.01.033, 2018a.
Liu, H., Meng, Z. H., Shang, Y., Lv, Z. F., Jin, X. X., Fu, M. L., and He, K. B.: Shipping emission forecasts and cost-benefit analysis of China ports and key regions' control, Environ. Pollut., 236, 49–59, https://doi.org/10.1016/j.envpol.2018.01.018, 2018b.
Liu, Z., Lu, X., Feng, J., Fan, Q., Zhang, Y., and Yang, X.: Influence of Ship Emissions on Urban Air Quality: A Comprehensive Study Using Highly Time-Resolved Online Measurements and Numerical Simulation in Shanghai, Environ. Sci. Technol., 51, 202–211, https://doi.org/10.1021/acs.est.6b03834, 2017b.
Marelle, L., Thomas, J. L., Raut, J.-C., Law, K. S., Jalkanen, J.-P., Johansson, L., Roiger, A., Schlager, H., Kim, J., Reiter, A., and Weinzierl, B.: Air quality and radiative impacts of Arctic shipping emissions in the summertime in northern Norway: from the local to the regional scale, Atmos. Chem. Phys., 16, 2359–2379, https://doi.org/10.5194/acp-16-2359-2016, 2016.
Morrison, H., Thompson, G., and Tatarskii, V.: Impact of Cloud Microphysics on the Development of Trailing Stratiform Precipitation in a Simulated Squall Line: Comparison of One- and Two-Moment Schemes, Mon. Weather Rev., 137, 991–1007, https://doi.org/10.1175/2008mwr2556.1, 2009.
Murphy, B. N., Woody, M. C., Jimenez, J. L., Carlton, A. M. G., Hayes, P. L., Liu, S., Ng, N. L., Russell, L. M., Setyan, A., Xu, L., Young, J., Zaveri, R. A., Zhang, Q., and Pye, H. O. T.: Semivolatile POA and parameterized total combustion SOA in CMAQv5.2: impacts on source strength and partitioning, Atmos. Chem. Phys., 17, 11107–11133, https://doi.org/10.5194/acp-17-11107-2017, 2017.
Olmer, N., Comer, B., Roy, B., Mao, X., and Rutherford, D.: Greenhouse gas emissions from global shipping, 2013–2015, ICCT, available at: https://www.theicct.org/sites/default/files/publications/Global-shipping-GHG-emissions-2013-2015_ICCT-Report_17102017_vF.pdf (last access: 25 October 2018), 2017.
Pleim, J. E.: A Combined Local and Nonlocal Closure Model for the Atmospheric Boundary Layer. Part I: Model Description and Testing, J. Appl. Meteorol. Clim., 46, 1383–1395, https://doi.org/10.1175/jam2539.1, 2007.
Qiao, X., Ying, Q., Li, X., Zhang, H., Hu, J., Tang, Y., and Chen, X.: Source apportionment of PM2.5 for 25 Chinese provincial capitals and municipalities using a source-oriented Community Multiscale Air Quality model, Sci. Total Environ., 612, 462–471, https://doi.org/10.1016/j.scitotenv.2017.08.272, 2018.
Shi, Z., Li, J., Huang, L., Wang, P., Wu, L., Ying, Q., Zhang, H., Lu, L., Liu, X., Liao, H., and Hu, J.: Source apportionment of fine particulate matter in China in 2013 using a source-oriented chemical transport model, Sci. Total Environ., 601–602, 1476–1487, https://doi.org/10.1016/j.scitotenv.2017.06.019, 2017.
Tao, J., Zhang, L., Cao, J., Zhong, L., Chen, D., Yang, Y., Chen, D., Chen, L., Zhang, Z., Wu, Y., Xia, Y., Ye, S., and Zhang, R.: Source apportionment of PM2.5 at urban and suburban areas of the Pearl River Delta region, south China – With emphasis on ship emissions, Sci. Total Environ., 574, 1559–1570, https://doi.org/10.1016/j.scitotenv.2016.08.175, 2017.
Viana, M., Amato, F., Alastuey, A., Querol, X., Moreno, T., García Dos Santos, S., Herce, M. D., and Fernández-Patier, R.: Chemical Tracers of Particulate Emissions from Commercial Shipping, Environ. Sci. Technol., 43, 7472–7477, https://doi.org/10.1021/es901558t, 2009.
Woody, M. C., Baker, K. R., Hayes, P. L., Jimenez, J. L., Koo, B., and Pye, H. O. T.: Understanding sources of organic aerosol during CalNex-2010 using the CMAQ-VBS, Atmos. Chem. Phys., 16, 4081–4100, https://doi.org/10.5194/acp-16-4081-2016, 2016.
Xiao, Q., Li, M., Liu, H., Fu, M., Deng, F., Lv, Z., Man, H., Jin, X., Liu, S., and He, K.: Characteristics of marine shipping emissions at berth: profiles for particulate matter and volatile organic compounds, Atmos. Chem. Phys., 18, 9527–9545, https://doi.org/10.5194/acp-18-9527-2018, 2018.
Xiu, A. and Pleim, J. E.: Development of a Land Surface Model. Part I: Application in a Mesoscale Meteorological Model, J. Appl. Meteorol., 40, 192–209, https://doi.org/10.1175/1520-0450(2001)040<0192:DOALSM>2.0.CO;2, 2001.
Ying, Q. and Kleeman, M. J.: Source contributions to the regional distribution of secondary particulate matter in California, Atmos. Environ., 40, 736–752, https://doi.org/10.1016/j.atmosenv.2005.10.007, 2006.
Ying, Q., Lu, J., Allen, P., Livingstone, P., Kaduwela, A., and Kleeman, M.: Modeling air quality during the California Regional PM10/PM2.5 Air Quality Study (CRPAQS) using the UCD/CIT source-oriented air quality model – Part I. Base case model results, Atmos. Environ., 42, 8954–8966, https://doi.org/10.1016/j.atmosenv.2008.05.064, 2008.
Ying, Q., Cureño, I. V., Chen, G., Ali, S., Zhang, H., Malloy, M., Bravo, H. A., and Sosa, R.: Impacts of Stabilized Criegee Intermediates, surface uptake processes and higher aromatic secondary organic aerosol yields on predicted PM2.5 concentrations in the Mexico City Metropolitan Zone, Atmos. Environ., 94, 438–447, https://doi.org/10.1016/j.atmosenv.2014.05.056, 2014a.
Ying, Q., Wu, L., and Zhang, H.: Local and inter-regional contributions to PM2.5 nitrate and sulfate in China, Atmos. Environ., 94, 582–592, https://doi.org/10.1016/j.atmosenv.2014.05.078, 2014b.
Ying, Q., Li, J., and Kota, S. H.: Significant Contributions of Isoprene to Summertime Secondary Organic Aerosol in Eastern United States, Environ. Sci. Technol., 49, 7834–7842, https://doi.org/10.1021/acs.est.5b02514, 2015.
Zhang, F., Chen, Y., Chen, Q., Feng, Y., Shang, Y., Yang, X., Gao, H., Tian, C., Li, J., Zhang, G., Matthias, V., and Xie, Z.: Real-World Emission Factors of Gaseous and Particulate Pollutants from Marine Fishing Boats and Their Total Emissions in China, Environ. Sci. Technol., 52, 4910–4919, https://doi.org/10.1021/acs.est.7b04002, 2018.
Zhang, H., Li, J., Ying, Q., Yu, J. Z., Wu, D., Cheng, Y., He, K., and Jiang, J.: Source apportionment of PM2.5 nitrate and sulfate in China using a source-oriented chemical transport model, Atmos. Environ., 62, 228–242, https://doi.org/10.1016/j.atmosenv.2012.08.014, 2012.
Zhang, Y. L. and Cao, F.: Fine particulate matter (PM2.5) in China at a city level, Sci. Rep., 5, 14884, https://doi.org/10.1038/srep14884, 2015.