


-
The tea plant [Camellia sinensis (L.) O. Kuntze] is an important economic crop worldwide[1, 2]. Compared to other horticultural crops, tea leaves accumulate higher levels of secondary metabolites, such as catechins, theanine, and caffeine[3−5]. These metabolites contribute to the pleasant characteristics and multiple health benefits of tea and make tea one of the most popular non-alcoholic beverages worldwide, consumed by billions of people[6−8]. Catechins are important secondary metabolites that determine bitterness and astringency[9, 10], which also endow tea with multiple beneficial effects, including attenuation of chronic inflammation, management of diabetes and obesity, and alleviation of cognitive impairment in Alzheimer's disease[11−14]. Theanine, the most quantitatively free amino acid (AA) in tea leaves, is associated with umami and sweetness, and effectively balances the bitterness of infusions caused by catechins and caffeine[15−17]. The concentration and composition of these secondary metabolites are critical for the flavor, value, and even health benefits of tea products[7, 8, 10]. Therefore, agricultural practices that improve the quality and flavor characteristics of tea by modulating the accumulation of secondary metabolites are economically important.
Shading is a traditional and effective practice to improve tea quality, especially for high-grade green tea, by modulating the accumulation of the flavor-related secondary metabolites of tea leaves[18−22]. Previous studies have shown that the balance of carbon and nitrogen metabolism, usually shown as the ratio of polyphenols/AAs of tender tea leaves, can be modulated by shading levels, shading periods, and even the colors of nets used for shading treatments[20, 23−25]. Under shading conditions, polyphenol biosynthesis of tea leaves was significantly reduced and this response can be detected in many tea cultivars, such as green leaf tea cultivars, 'Shuchazao'[26], 'Yabukita'[27] and 'Fuding Dabaicha'[23], and albino tea cultivars, 'Yujinxiang'[28], 'Huangjinya'[29], 'Baijiguan'[30] and 'Koganemidori'[31], etc.
Compared with the consistent shading reduction of polyphenols, the effects of shading on free AA accumulation of tea leaves have been conflicting for many years. Many studies suggest that shading can significantly increase the levels of AAs in tea plants[19, 32]. However, shading-induced decreases in the AAs of tea leaves have also been reported[31, 33]. In particular, theanine, the specific and most abundant free AA in tea plants which is crucial for the freshness and umami taste of tea products, showed conflicting shading responses in previous studies[18, 31]. Yang et al. reported that shading induced an allocation of theanine accumulation in 'Shuchazao' shoots, leading to a theanine increase in tender stalks but a decrease in leaves[18]. In contrast, Shamala et al. reported that shaded 'Shuchazao' leaves accumulated nearly 2-fold theanine compared with that of non-shaded leaves[34], and a similar shading-induced increase was also detected in 'Yujinxiang' leaves. These results indicate that the regulatory metabolism underlying shading effects on secondary metabolites is complicated, particularly when interacting with the synergistic or antagonistic effects of various environmental parameters, such as temperature changes, soil nutrition, and biotic and abiotic stresses.
The investigation of seasonal effects is important to our understanding of shading regulations on the secondary metabolism of tea plants, which is also economically important for improving the quality of tea via shading treatments. To better understand the seasonal dependence of shading regulation on major secondary metabolites in tea plants, shading nets with different light-transmitting levels were used to cover the over the green tea cultivar, 'Camellia sinensis Shuchazao' in tea plantations. In particular, the same shading conditions were carried out on the same tea plants in April and August, and a comparison was made between seasons, including the accumulations of catechins and free AAs. As our first study focused on seasonal-shading effects on flavor-related secondary metabolites in tea plants, these results improve our understanding of environmental regulation on secondary metabolism in important horticultural plants.
-
This study was carried out in a research tea plantation of Anhui Agricultural University (N 31°55′, E 117°12′; Hefei, Anhui, China). Twenty four-year-old Shuchazao were propagated from cuttings with growth conditions: 1.4 m wide, 1.5 m height, with 0.5 m between rows. Twelve rows of tea plants (50 m long and 1.4 m wide, 2 m between and 0.6 m within row spacing) were selected for the shade treatments. Black nylon nets with different light transmitting characteristics (Nongfeng Company, Hefei, China) were placed about 2 m over the tea plants. Three shading treatments were carried out (Fig. 1a, b): Control, tea plants are grown naturally without shading; MS, medium shading with 40%−50% of natural sunlight can be transmitted through the nets; HS, heavy shading with 10%−20% of natural sunlight can be transmitted through the nets. Spring treatments were established on the 13th of April, 2017. Autumn treatments were established on the 15th of August, 2016. Each treatment was replicated three times, with the positions randomized statistically within the rows. The first developing leaves of tea plants were collected through shading treatments (1, 7 and 14 d). All the materials were frozen immediately in the field using liquid nitrogen and stored at −80 °C.

Figure 1.
(a) Establishment of shading treatments. (b) SCZ tea plants, (c) diurnal PAR intensity and (d) diurnal temperature under different treatments in April and August. The PAR and temperature were measured at the 7 d of shading treatments. Control, tea plants are grown naturally without shade; MS, medium shading where 40%−50% of natural sunlight can be transmitted through the nets; HS, heavy shading where 10%−20% of natural sunlight can be transmitted; PAR, photosynthetically active radiation. Data shown are conducted by at least three independent biological replicates (n = 3). Same thereafter for abbreviation and statistical analysis.
Environmental parameter measurements
-
Photosynthetic activity radiation (PAR) and temperature were measured at two-hour intervals from 8:00 to 18:00 to monitor the growth conditions of tea plants during the experimental period (Fig. 1c, d). The PAR for all treatments was tested by Light Scout® Quantum Light Meters (Item#3415F, Spectrum Technology® Inc. USA). The temperature around the tea leaves was tested by a TEMP/RH/CO2 hand-held meter (catalog#3440, Spectrum Technology® Inc. USA).
Catechin determination
-
Tea catechins were extracted and measured as previously described[21]. The frozen leaves were ground, and 0.1 g of the sample was extracted with 3 mL of 80% methanol in an ultrasonic sonicator for 10 min at 4 °C. After centrifugation (13,000 rpm, 10 min), the residues were re-extracted twice as described above. The supernatant was combined and diluted with 80% methanol to a fixed volume of 10 mL. Then the supernatant was filtered through a 0.22 μm organic membrane and collected for high-performance liquid chromatography (HPLC) analysis. The HPLC system (Waters 2695) coupled with an ultraviolet-visible detector (Waters 2489) was used for catechin analysis. A reverse phase C18 column (Phenomenex 250 mm × 4.6 mm, 5 μm) was used at a flow rate of 1.0 mL·min−1. The detection wavelength was set at 278 nm at a column temperature of 25 °C. The solvent A (0.2% acetic acid in water, v/v) and solvent B (100% methanol) were used for separation with the following gradient: 0 min, 94% A, 6% B; 4 min, 94% A, 6% B; 16 min, 86% A, 14% B; 22 min, 85% A, 15% B; 32 min, 82% A, 18% B; 37 min, 71% A, 29% B; 45 min, 55% A, 45% B; 50 min, 55% A, 45% B; 51 min, 94% A, 6% B; 60 min, 94% A, 6% B. Ten μL of the extraction was injected for analysis. C, EC, GC, EGC, EGCG, GCG, and ECG were used as standards for sample quantification (Sigma Chemical Company, St. Louis, MO, USA).
Amino acid (AA) determination
-
AAs were extracted and measured as previously described[35]. One hundred mg of freeze-dried tea leaves were ground and ultrasonically extracted in 1 mL of 4% sulfosalicylic acid for 30 min at 4 °C. After centrifugation (13,000 rpm, 30 min), the supernatant was transferred into a new tube and the precipitate was re-extracted as described above. The supernatant was collected, metered to 2 mL, and then filtered through a 0.22 μm water membrane. The AA analysis was carried out by a High-Speed Amino Acid Analyzer (L-8900, Hitachi, Japan) with a mobile phase involving lithium citrate and UV-Vis detection at 570 and 440 nm. The flow rates for the mobile phase and the derivatization reagent were 0.35 mL·min−1 and 0.3 mL·min−1, respectively. The temperature of the column, post-column reaction equipment, and auto-sampler was maintained at 38, 130 and 4 °C, respectively. The injection volume was 20 μL. The theanine (Sigma Chemical Company, St. Louis, MO, USA) and other amino acids (Waters Corporation, Milford, Massachusetts, USA) were used as standards for AA calculation.
OPLS-DA analysis
-
The concentrations of catechins and amino acids in tea leaves at 1, 7 and 14 d from the Control, MS and HS treatments were analysed by the OPLS-DA models, constructed by the SIMCA software (version 13.0.0.0, UMETRICS,
www.ijg.org ). Three biological replicates were used for the analysis.Statistical analysis
-
PAR, temperature, catechins, and AA concentrations were obtained from at least three independent biological replicates (n ≥ 3). Statistical analysis was conducted using the Minitab 17.0 statistical software (Minitab Inc., UK), by one-way analysis of variance (ANOVA) with grouping information and Fisher's least significant difference (LSD) test at the 5% level.
-
To study the shading effects between seasons, the catechin accumulation of tender leaves in April and August was analyzed. The OPLS-DA analysis showed clear shading effects in catechin accumulation of tender leaves collected at 1 d, 7 d, and 14 d. Compared to the Control treatments, both MS and HS treatments had significant effects on catechin accumulation, regardless of season (Fig. 2). When comparing shading effects between seasons, August treatments showed more significant shading effects on catechin accumulation (Q2: 67.1% and 68.7% in August compared to 29.8% and 64.9% in April for MS and HS treatments, respectively). When compared between MS and HS treatments, HS treatments showed more significant shading effects on catechin accumulation than MS treatments in both seasons.

Figure 2.
OPLS-DA analysis for major catechins of tender tea leaves under different treatments in (a), (b) April and (c), (d) August. 1 d, 7 d and 14 d represent 1 day, 7 days and 14 days under shading conditions, respectively. OPLS-DA analysis was conducted by SIMCA 13.0 (UMETRICS,
https://umetrics.com/ ). △ shows catechins in different treatments (black, Control; red, Medium Shading; blue, Heavy Shading); PC1 shows variance between treatments; PC2 shows variance between catechins.The concentrations of major catechins were measured, including catechin (C), gallocatechin (GC), epicatechin (EC), epigallocatechin (EGC), gallocatechin gallate (GCG), epicatechin gallate (ECG), and epigallocatechin gallate (EGCG) (Fig. 3). When comparing the concentration of catechins between seasons, tender leaves collected in August contained higher levels of catechins (C, GC, EC, GCG, ECG, and EGCG) than that of April, except EGC which showed similar concentrations between seasons. Significant shading-induced decreases were found in catechins (C, GC, EC, EGC, ECG, and EGCG) both in April and August, except GCG which showed no significant change in both seasons. Compared to April, more significant decreases were found in the concentrations of C, GC, EC, ECG, and EGCG in August.
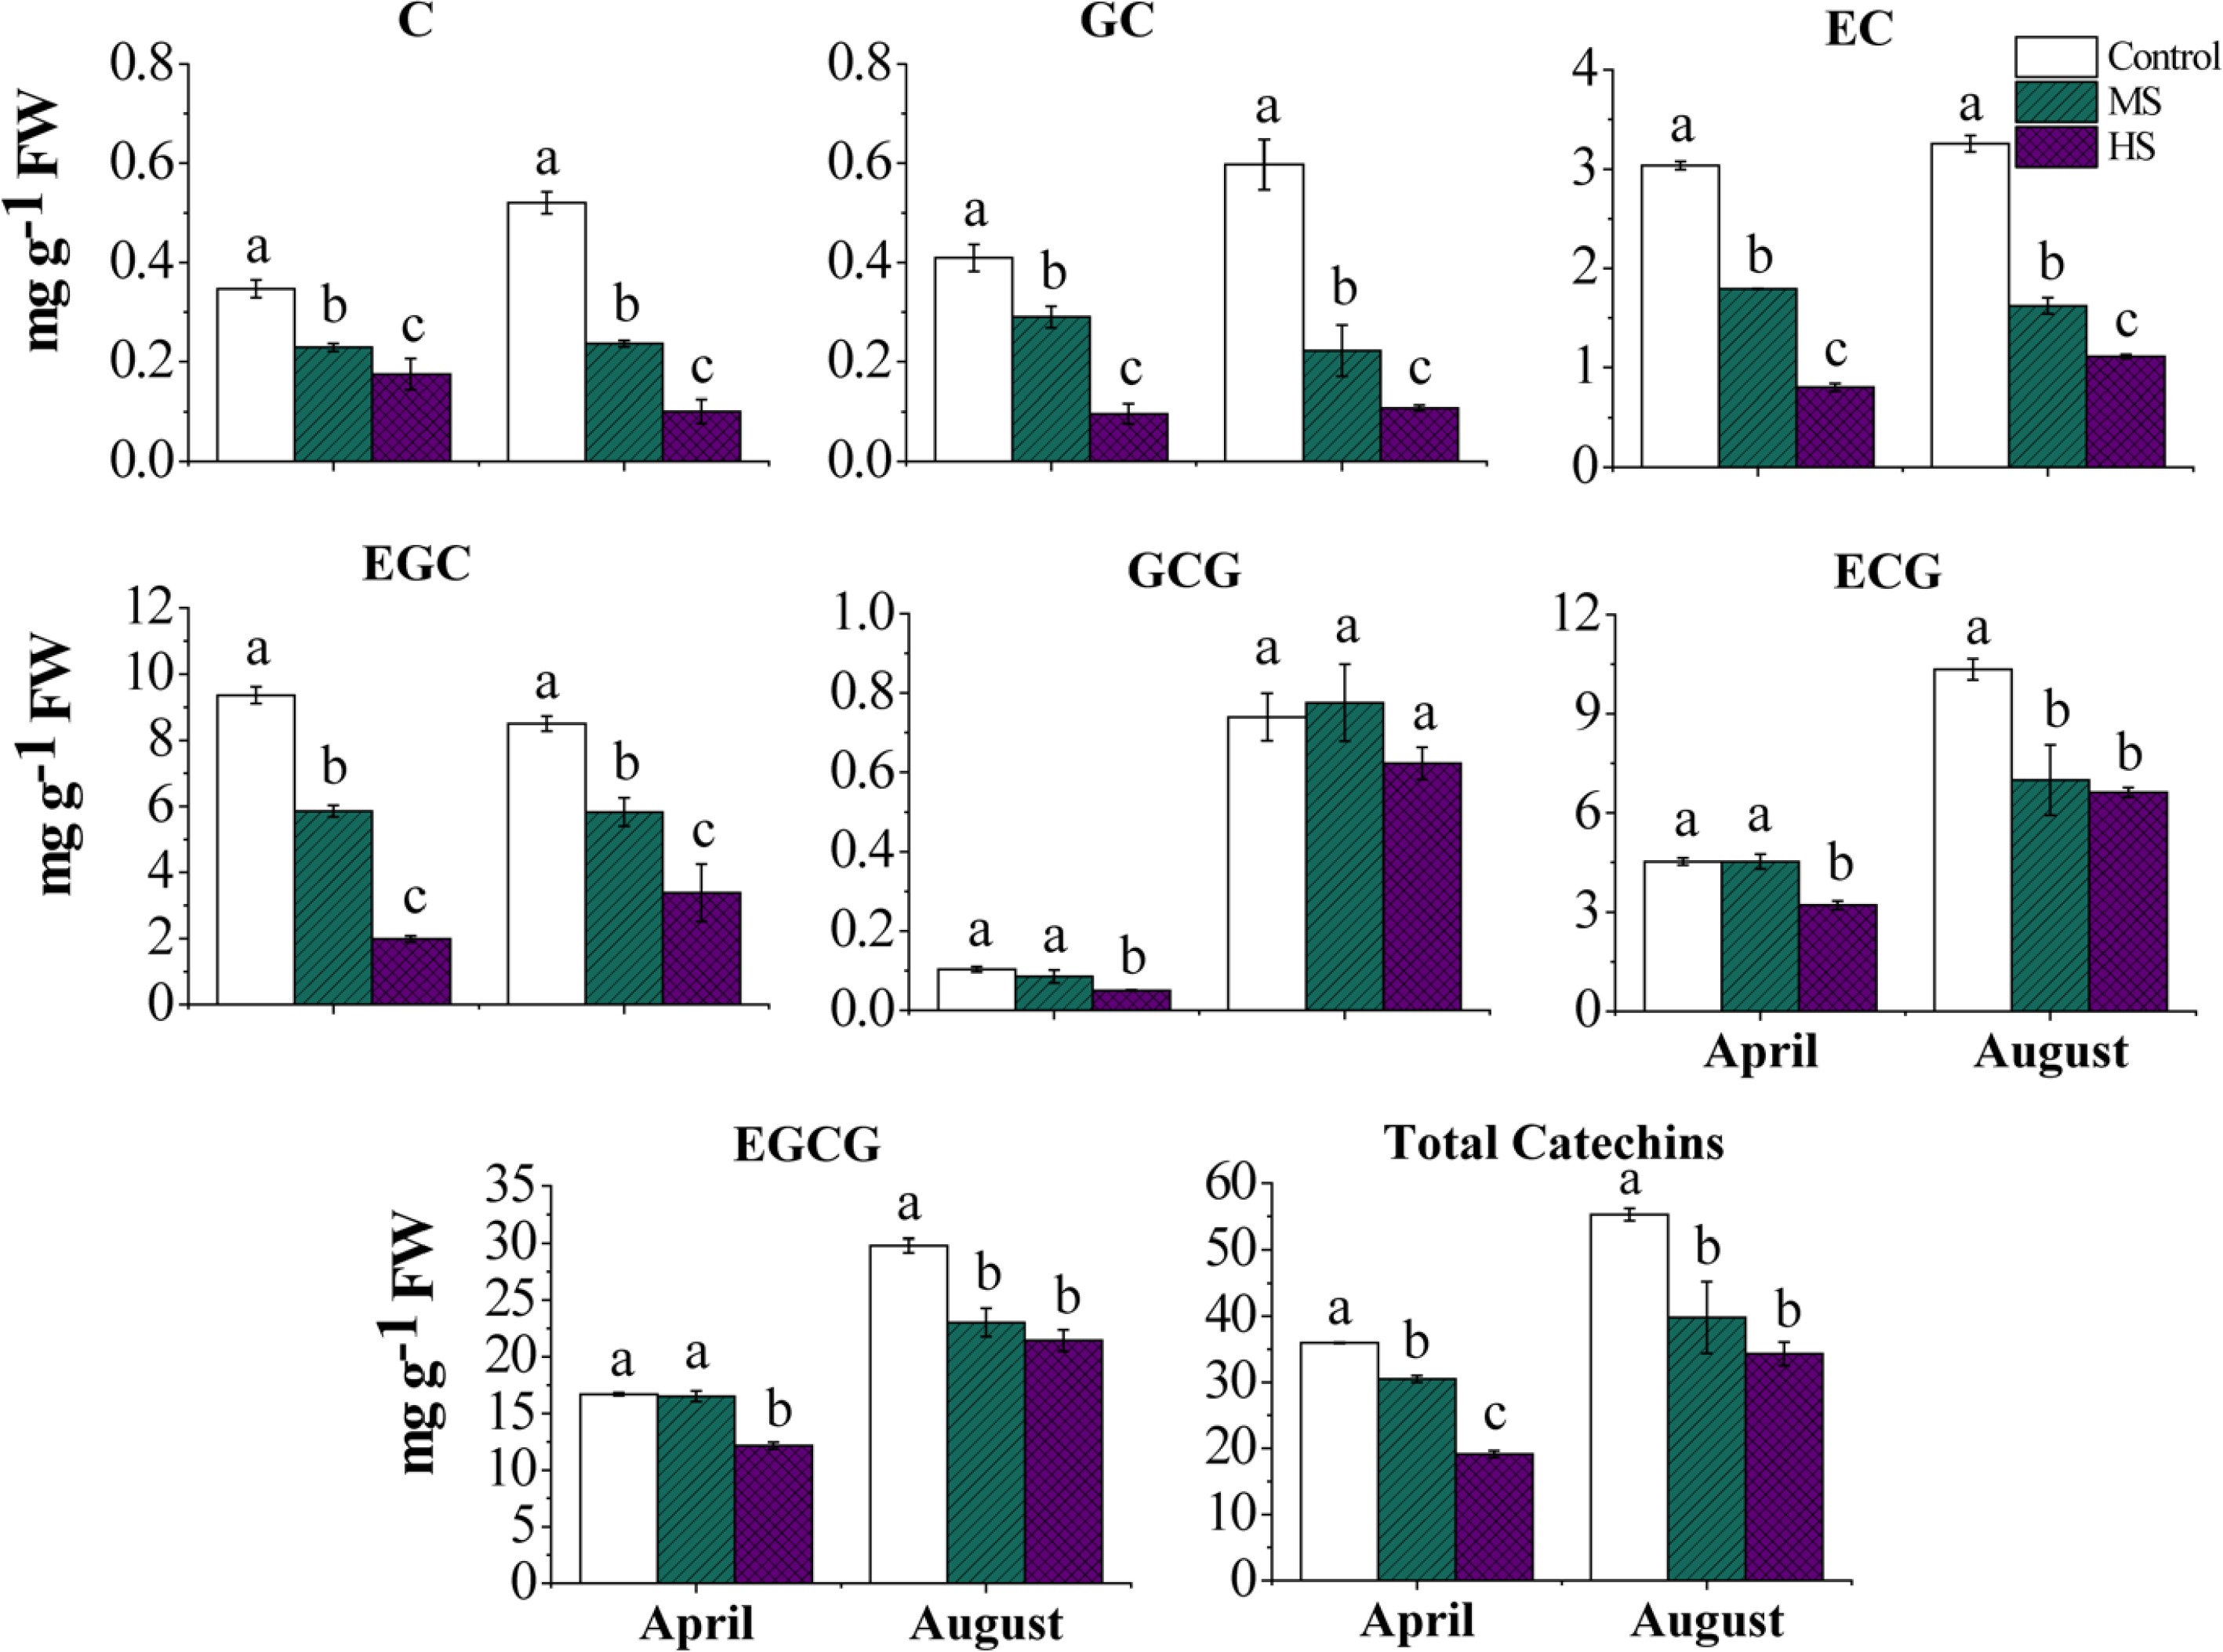
Figure 3.
Catechin accumulations of tender tea leaves at 14 d under different treatments in April and August. C, catechin; GC, gallocatechin; EC, epicatechin; EGC, epigallocatechin; GCG, gallocatechin gallate; ECG, epicatechin gallate; EGCG, epigallocatechin gallate. Letters (a, b, c) show significant differences and grouping information comparing different treatments according to one-way ANOVA and Fisher’s LSD test at the 5% level.
Shading effects on AAs in April and August
-
To study the shading effects between seasons, the AA accumulations of tender leaves collected in April and August were analyzed (Supplemental Tables S1 & S2). Compared to the Control treatments, significant shading effects on accumulations of AAs were detected according to the OPLS-DA analysis, regardless of shading levels and seasons (Fig. 4). When comparing shading effects between seasons, August treatments showed more significant effects on AAs than that of April (Q2: 75.9% and 81.1% in August compared to 48.9% and 67.5% in April for MS and HS treatments, respectively). When comparing shading effects between MS and HS treatments, HS treatments showed more significant shading effects on AA accumulations than MS treatments in both seasons.
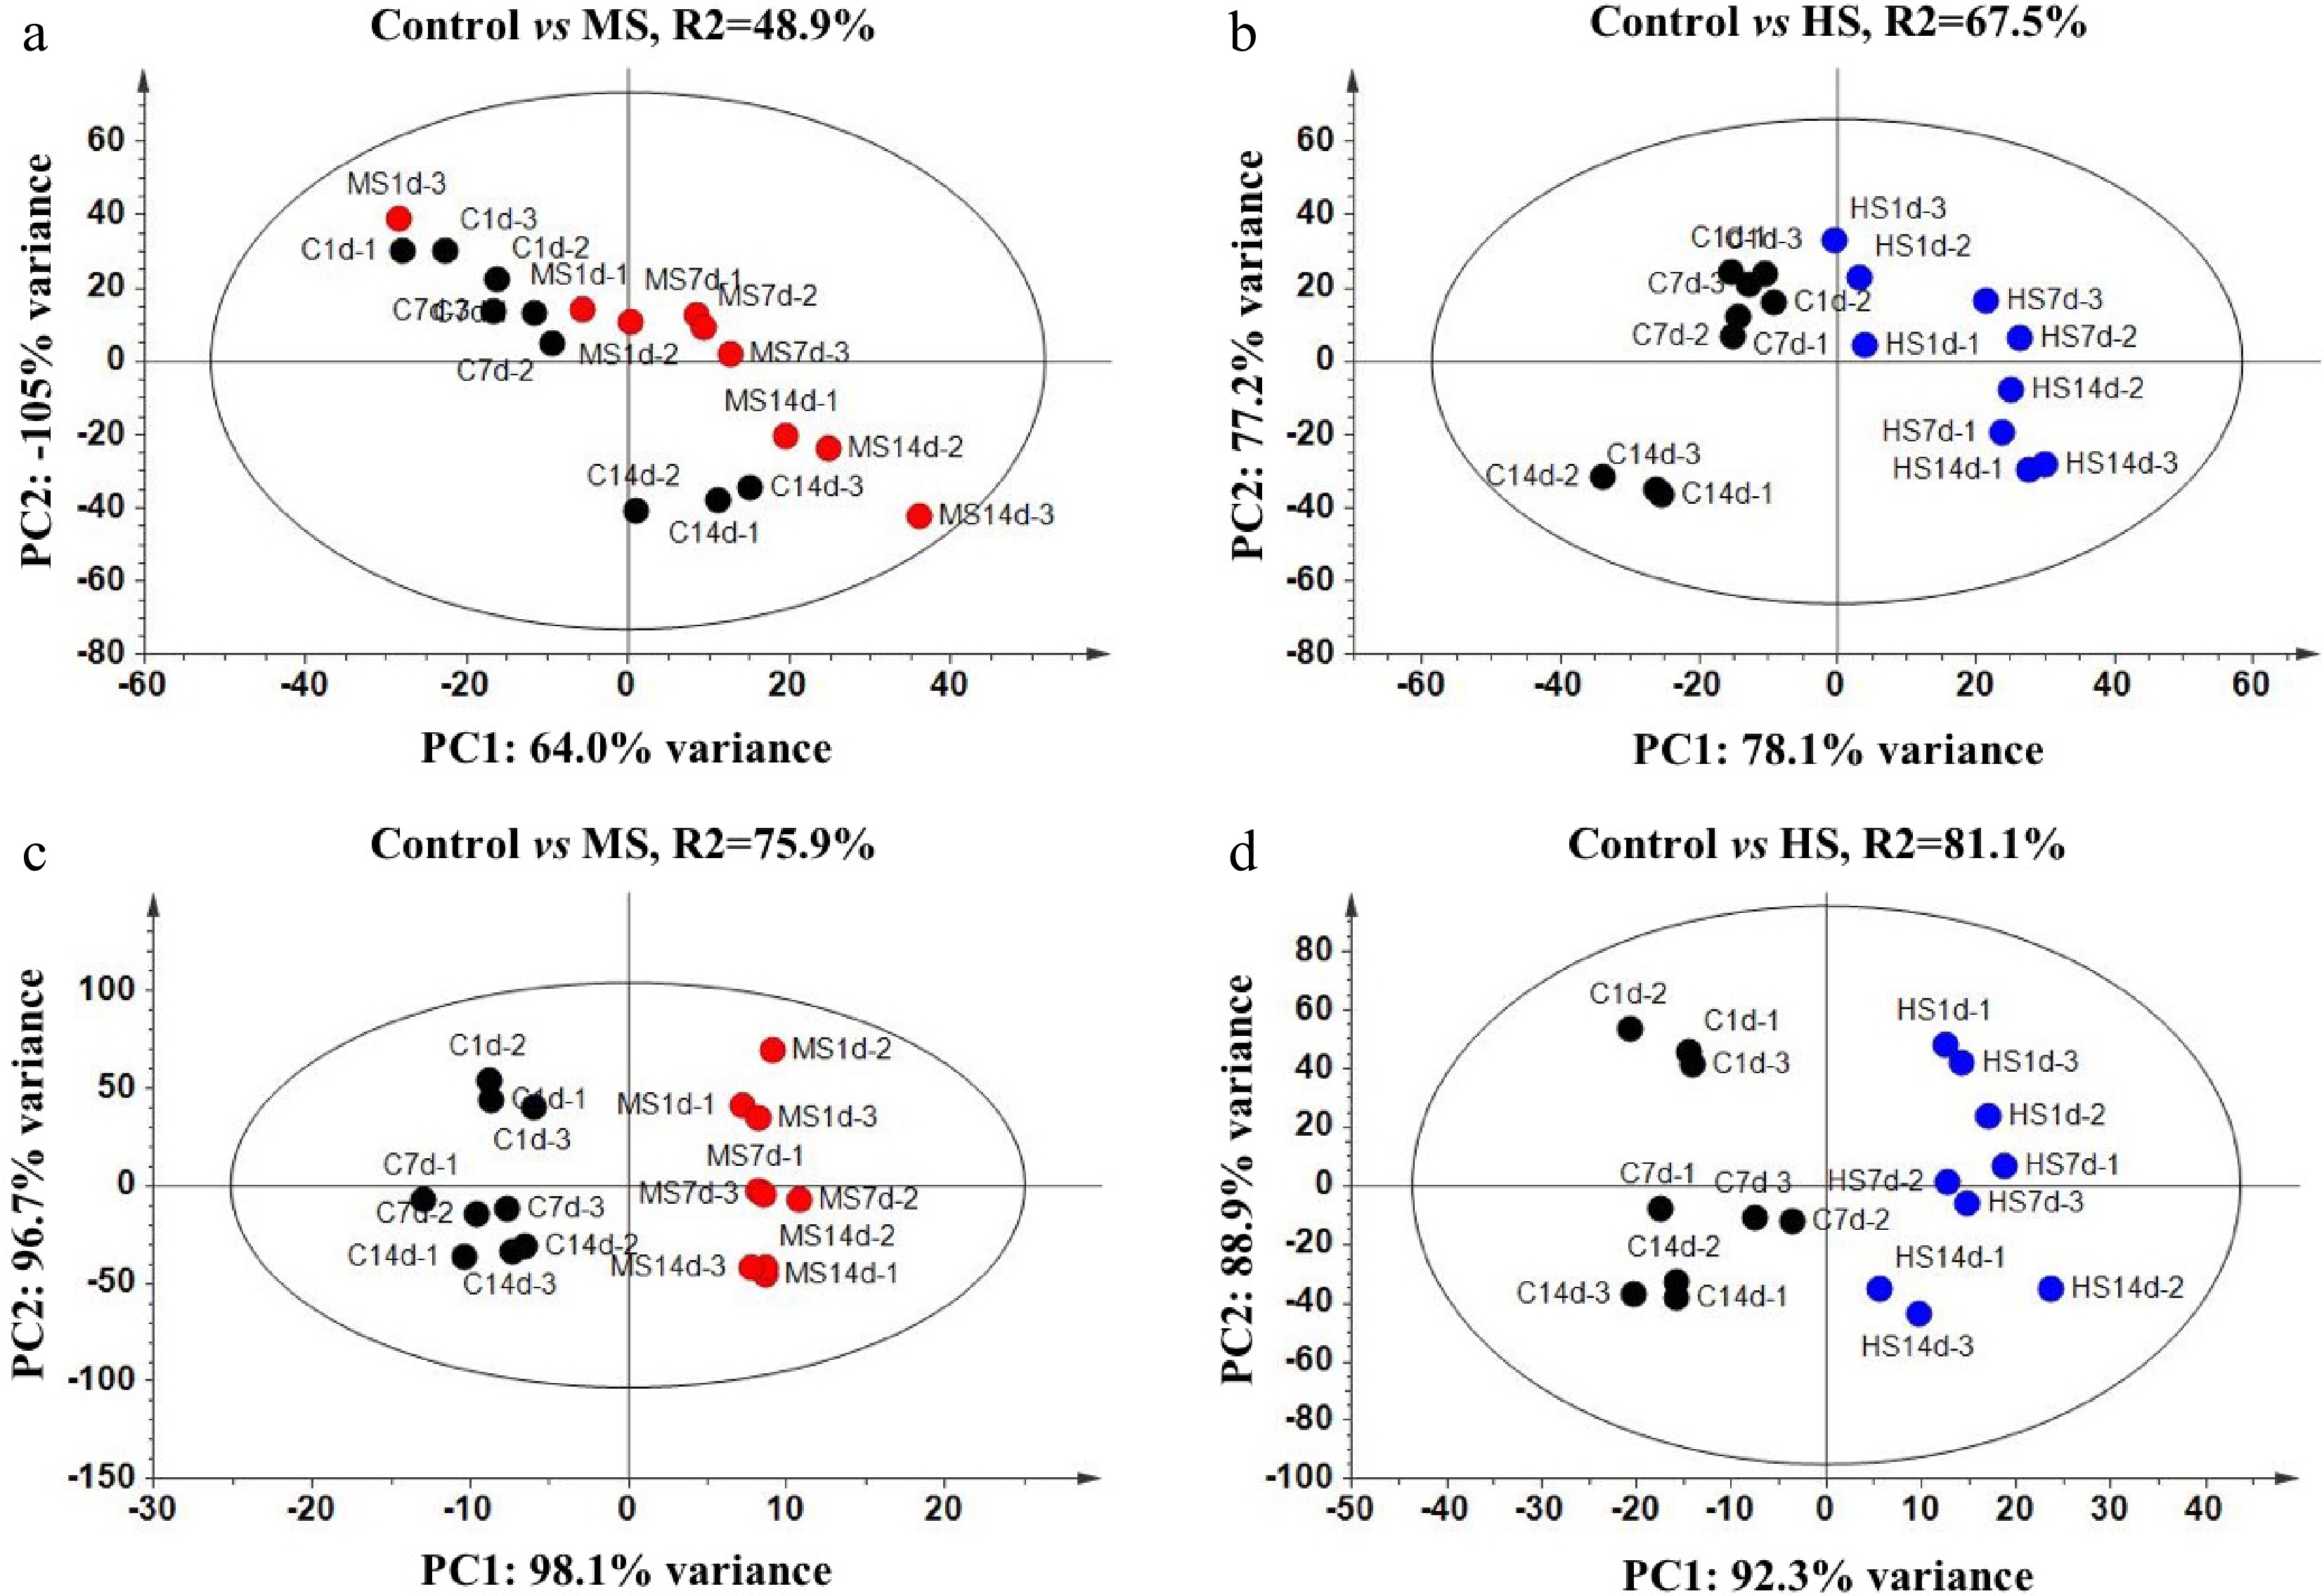
Figure 4.
OPLS-DA analysis for major free amino acids of tender tea leaves under different treatments in (a), (b) April and (c), (d) August. ○ shows amino acids in different treatments (black, Control; red, Medium Shading; blue, Heavy Shading); PC1 shows variance between treatments; PC2 shows variance between amino acids.
The proportions of major AAs were analysed between shading levels and seasons, including o-phosphoserine (P-Ser), o-phosphoethanolamine (PEA), aspartate (Asp), threonine (Thr), proline (Pro), glutamic acid (Glu), glutamine (Gln), α-aminoadipic acid (α-AAA), glycine (Gly), alanine (Ala), citrulline (Cit), α-aminobutyric acid (α-ABA), valine (Val), cysteine (Cys), isoleucine (Ile), leucine (Leu), tyrosine (Tyr), phenylalanine (Phe), β-alanine (β-Ala), β-aminoisobutyric acid (β-AiBA), γ-aminobutyric acid (γ-ABA), tryptophan (Trp), ornithine (Orn), histidine (His), and arginine (Arg) (Table. 1). Theanine, the most abundant free AA of tender tea leaves, showed shading-induced decreases in tender tea leaves regardless of shading levels and seasons. The proportion of theanine was 50.35% (Control), 46.94% (MS) and 42.06% (HS) in April, and 40.09%, 36.77% and 27.81% in August, respectively. A similar decreasing trend was detected in the proportion of Gln, which was 11.33% (Control), 8.86% (MS) and 6.57% (HS) in April, and 10.01%, 7.73% and 6.27% in August, respectively. In contrast, shading-induced increases were detected in proportions of some AAs, including Glu and Asp. The proportion of Glu increased from 14.18% (Control) to 15.09% (MS) and 15.28% (HS) in April, and from 15.25% (Control) to 20.93% (MS and HS) in August, respectively.
Table 1. The proponent of amino acid of tender tea leaves at 14 d under different treatments in April and August.
April, Proponent (%) August, Proponent (%) Control MS HS Control MS HS P-Ser 2.36 2.57 2.38 2.59 2.23 2.58 PEA 0.40 0.40 1.05 0.79 1.18 1.71 Asp 4.79 8.42 10.77 7.46 8.39 9.40 Thr 0.75 0.81 1.13 1.37 1.20 1.16 Ser 2.02 1.68 1.48 2.46 2.67 3.92 Pro 0.34 0.25 0.31 0.52 0.54 0.81 Glu 14.18 15.09 15.28 18.25 20.93 20.93 Gln 11.33 8.86 6.57 10.01 7.73 6.27 Theanine 50.35 46.94 42.06 40.09 36.77 27.81 α-AAA 1.39 1.05 0.74 1.51 1.05 1.08 Gly 0.26 0.24 0.16 0.55 0.60 0.65 Ala 1.73 1.60 1.63 1.93 1.84 2.35 Cit 0.54 0.54 0.47 1.01 1.03 1.17 α-ABA 0.18 0.18 0.17 0.21 0.18 0.24 Val 0.26 0.28 0.32 0.47 0.54 0.80 Cys 0.25 0.21 0.13 0.46 0.40 0.58 Ile 0.03 0.06 0.16 0.10 0.25 0.70 Leu 0.06 0.07 0.12 0.16 0.27 0.57 Tyr 0.14 0.16 0.19 0.25 0.28 0.34 Phe 0.13 0.11 0.19 0.12 0.19 0.25 β-Ala 0.05 0.04 0.34 0.07 0.08 0.11 β-AiBA 0.11 0.11 0.09 0.16 0.18 0.20 γ-ABA 0.45 0.49 0.47 0.80 0.76 1.00 Trp 1.98 2.42 1.43 2.85 5.97 4.23 Orn 1.51 1.08 0.71 0.82 0.86 0.37 His 0.22 0.28 0.50 0.36 0.31 0.76 Arg 4.17 5.31 10.48 4.68 3.02 10.38 MS, medium shading; HS, heavy shading; P-Ser, o-Phosphoserine; PEA, o-Phosphoethanolamine; Asp, Aspartate; Thr, Threonine; Ser, Serine; Pro, Proline; Glu, Glutamic acid; Gln, Glutamine; α-AAA, α-aminoadipic acid; Gly, Glycine; Ala, Alanine; Cit, Citrulline; α-ABA, α-Aminobutyric acid; Val, Valine; Cys, cysteine; Ile, Isoleucine; Leu, Leucine; Tyr, Tyrosine; Phe, Phenylalanine; β-Ala, β-Alanine; β-AiBA, β-Aminoisobutyric acid; γ-ABA, γ-Aminobutyric acid; Trp, Tryptophan; Orn, Ornithine; His, Histidine; Arg, Arginine. The concentration of amino acids and statistical information are shown in Supplemental Tables S1 & S2. To investigate the shading effects on specific AA between seasons, we compared the changes in major free AAs of tender leaves in April and August (Fig. 5). The heavy shading increased the accumulation of total AA of tender leaves in April but decreased that in August. For specific AA, the accumulation of PEA showed consistent increases in response to shading in both seasons, especially under HS conditions. Arg increased in shaded leaves in April but showed no consistent change in MS and HS conditions in August. In contrast, α-AAA, Orn and Gln showed consistent shading-induced decreases in both seasons. Notably, seasonal effects were detected in shading responses in some AAs, Thr, Glu and Ala. Compared with the Control treatment, the accumulations of Thr, Glu and Ala showed significant increases under HS conditions in April but significant decreases in August. For theanine, higher accumulation was detected in April compared to August (Fig. 6). No significant shading effect was detected in April but slight decreases were shown in both MS and HS in August.
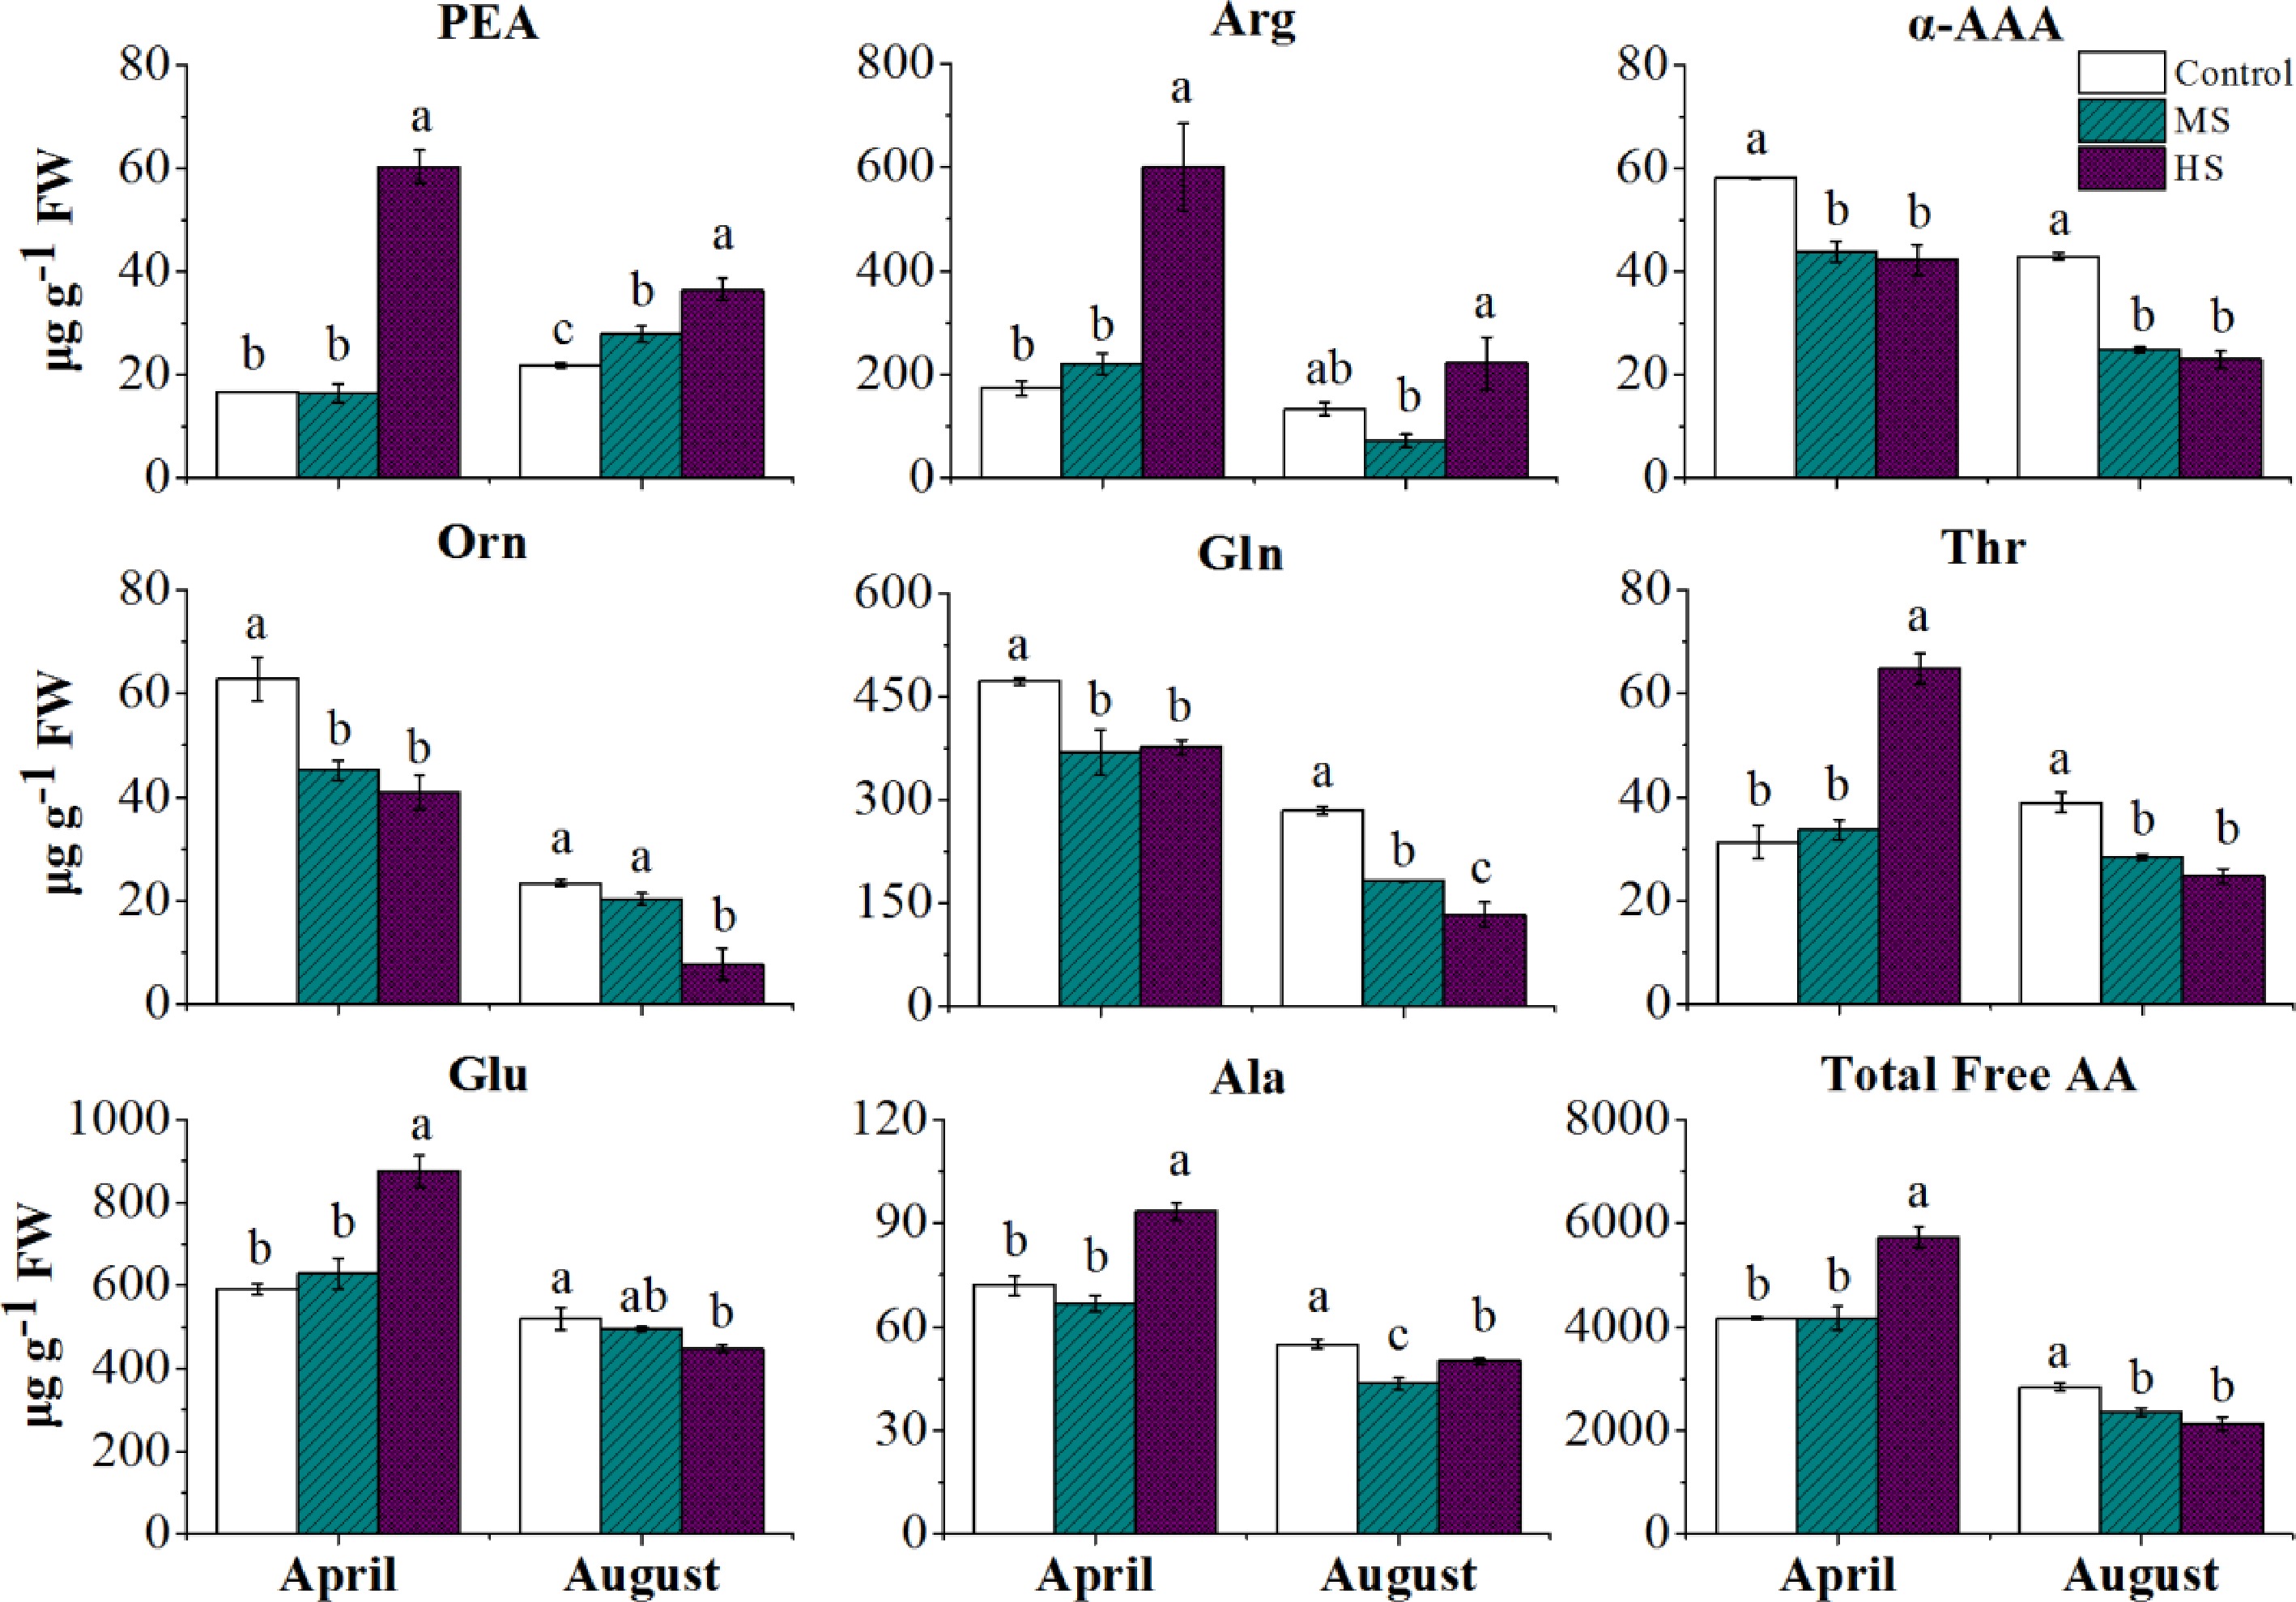
Figure 5.
The free AA accumulations of tender tea leaves at 14 d under different treatments in April and August. Letters (a, b, c) show significant differences and grouping information comparing different treatments according to one-way ANOVA and Fisher’s LSD test at the 5% level.
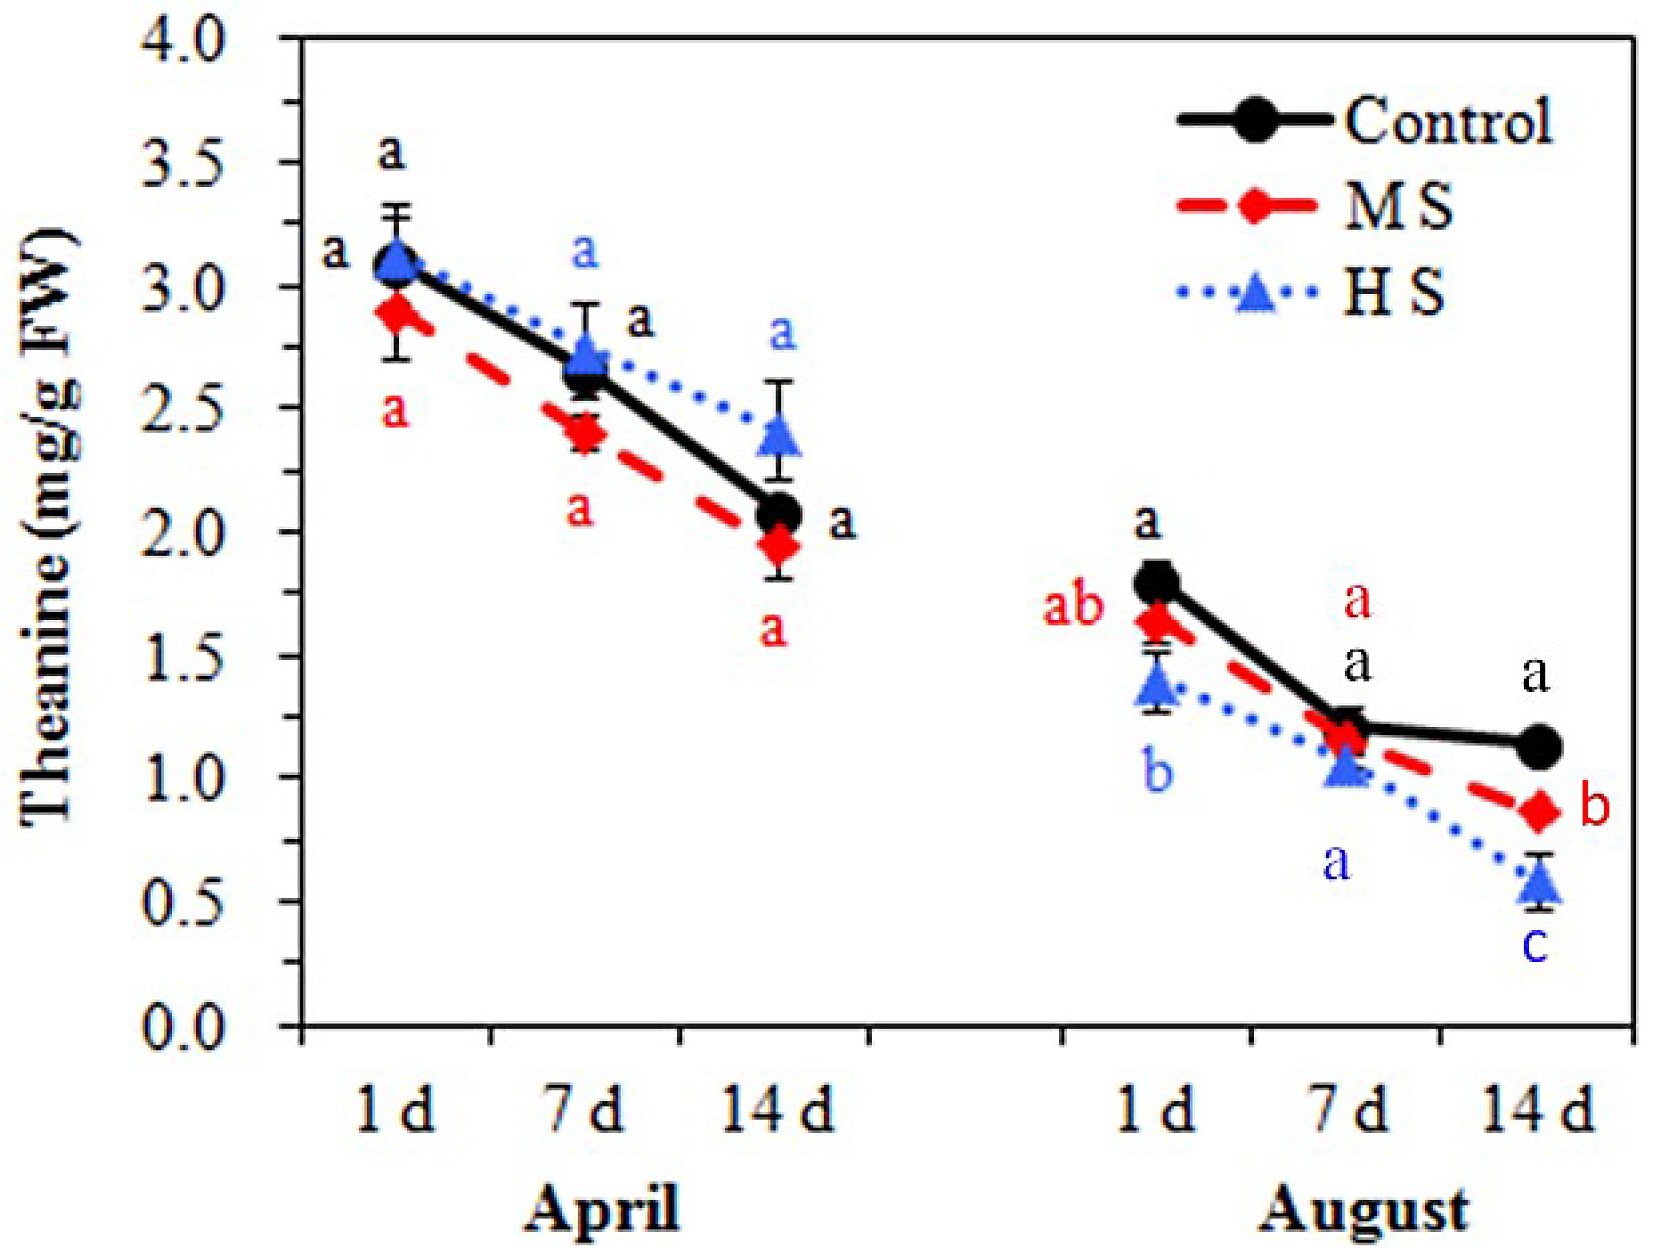
Figure 6.
The theanine accumulation of tender tea leaves under different treatments during the experimental periods in April and August. Letters (a, b, c) show significant differences and grouping information comparing different treatments according to one-way ANOVA and Fisher’s LSD test at the 5% level.
Shading effects on the ratio of catechins/AAs in April and August
-
The ratio of catechins/AAs, as an important factor for characteristic evaluation of tea infusion, was calculated between shading treatments and seasons (Table 2). A significant seasonal difference was detected in catechins/AAs between seasons, with a relatively higher ratio (19.41) of tender leaves in August compared with that (8.64) in April. Both seasons showed significant shading-induced decreases in the ratio of catechins/AAs. When comparing shading effects between MS and HS conditions, more significant effects were detected in HS treatment than that in MS treatment, regardless of the season. In April, the ratio of catechins/AAs decreased from 8.64 under the control condition to 3.34 under the HS condition. In August, the ratio of catechins/AAs decreased from 19.41 under the control condition to 16.06 under the HS condition.
Table 2. The ratio of catechins/amino acids of tender tea leaves at 14 d under different treatments in April and August.
April August Catechins
(mg·g−1 FW)AAs
(mg·g−1 FW)Ratio Catechins
(mg·g−1 FW)AAs
(mg·g−1 FW)Ratio Control 35.96a ± 0.08 4.16b ± 0.03 8.64 55.25a ± 0.93 2.85a ± 0.07 19.41 MS 30.49b ± 0.54 4.17b ± 0.02 7.32 39.79b ± 5.42 2.36b ± 0.08 16.83 HS 19.12c ± 0.53 5.73a ± 0.02 3.34 34.29b ± 1.79 2.13b ± 0.01 16.06 Letters (a, b, c) show significant differences and grouping information comparing different treatments according to one-way ANOVA and Fisher’s LSD test at the 5% level. MS, medium shading; HS, heavy shading; AAs, amino acids; FW, fresh weight. -
Shading has been demonstrated to be an effective way to reduce the accumulation of polyphenols in tea plants. However, shading regulation on amino acids has been conflicting for many years as both shading-induced increases and decreases in amino acids were reported. In the present study, we compared the effects of medium (40%−50% PAR) and heavy (10%−20% PAR) shading on catechins and AAs of tender 'Shuchazao' leaves in the same plantation in two seasons, April and August. Our results show that the reduction of tea catechins induced by shading is mainly determined by shading level, but the shading effects on total and individual AAs are seasonally-dependent.
The catechins/AAs ratio of tea leaves showed a significant decrease under shading conditions in both seasons (Table 2). This reduction was determined by shading levels and was mainly due to shading-induced decreases in C, GC, EC, EGC, ECG, and EGCG (Fig. 3). These results are supported by previous studies that catechins were mainly determined by light intensity, regardless of the experimental season[23, 26]. Compared with the leaves exposed to natural light in early May, 'Shuchazao' leaves contained significantly lower catechins under 80% ± 5% shading condition[26]. Ye et al. reported that catechins were sensitive to light intensity rather than light wavelength composition[23]. Under 70% and 95% shading conditions for 20 d from June to July, the total catechins of 'Fuding Dabaicha' leaves were significantly decreased by 10.7% and 28.7%, respectively. As catechins are the main contributors to bitterness, astringency, and colours of tea products, the low ratio of catechins/AAs enhances tea liquor with freshness and tenderness[10, 36]. The present study confirms that shading is an effective way to improve green tea quality by reducing the polyphenol accumulation of fresh tea leaves, regardless of the season.
When comparing the shading effects between seasons, shading regulation on AA metabolism presented a clear seasonal-dependent effect. Shading induced converse responses in the accumulation of the total free AAs and several individual AAs (Glu, Ala, and Thr) of tender leaves in April and August (Fig. 7). These results are supported by previous studies[27, 29, 37], the accumulations of the total AAs, Ala, and Thr were upregulated as amounts of shade and periods in April. Consistently, theanine has been observed to increase under shade in spring and early summer but showed no change under shade in midsummer and autumn[31]. These results indicate that shading regulation on tea quality is a seasonal-dependent and complicated response resulting from many environmental parameters, probably including light intensity, temperature, water availability, nutrients, and growth conditions of tea plants. These results also partially explain the conflicting shading effects on AAs and theanine of tender tea shoots reported by many previous studies[27, 30, 37], considering that previous studies were carried out in different seasons and tea plantations where the natural micro-climates varied widely.
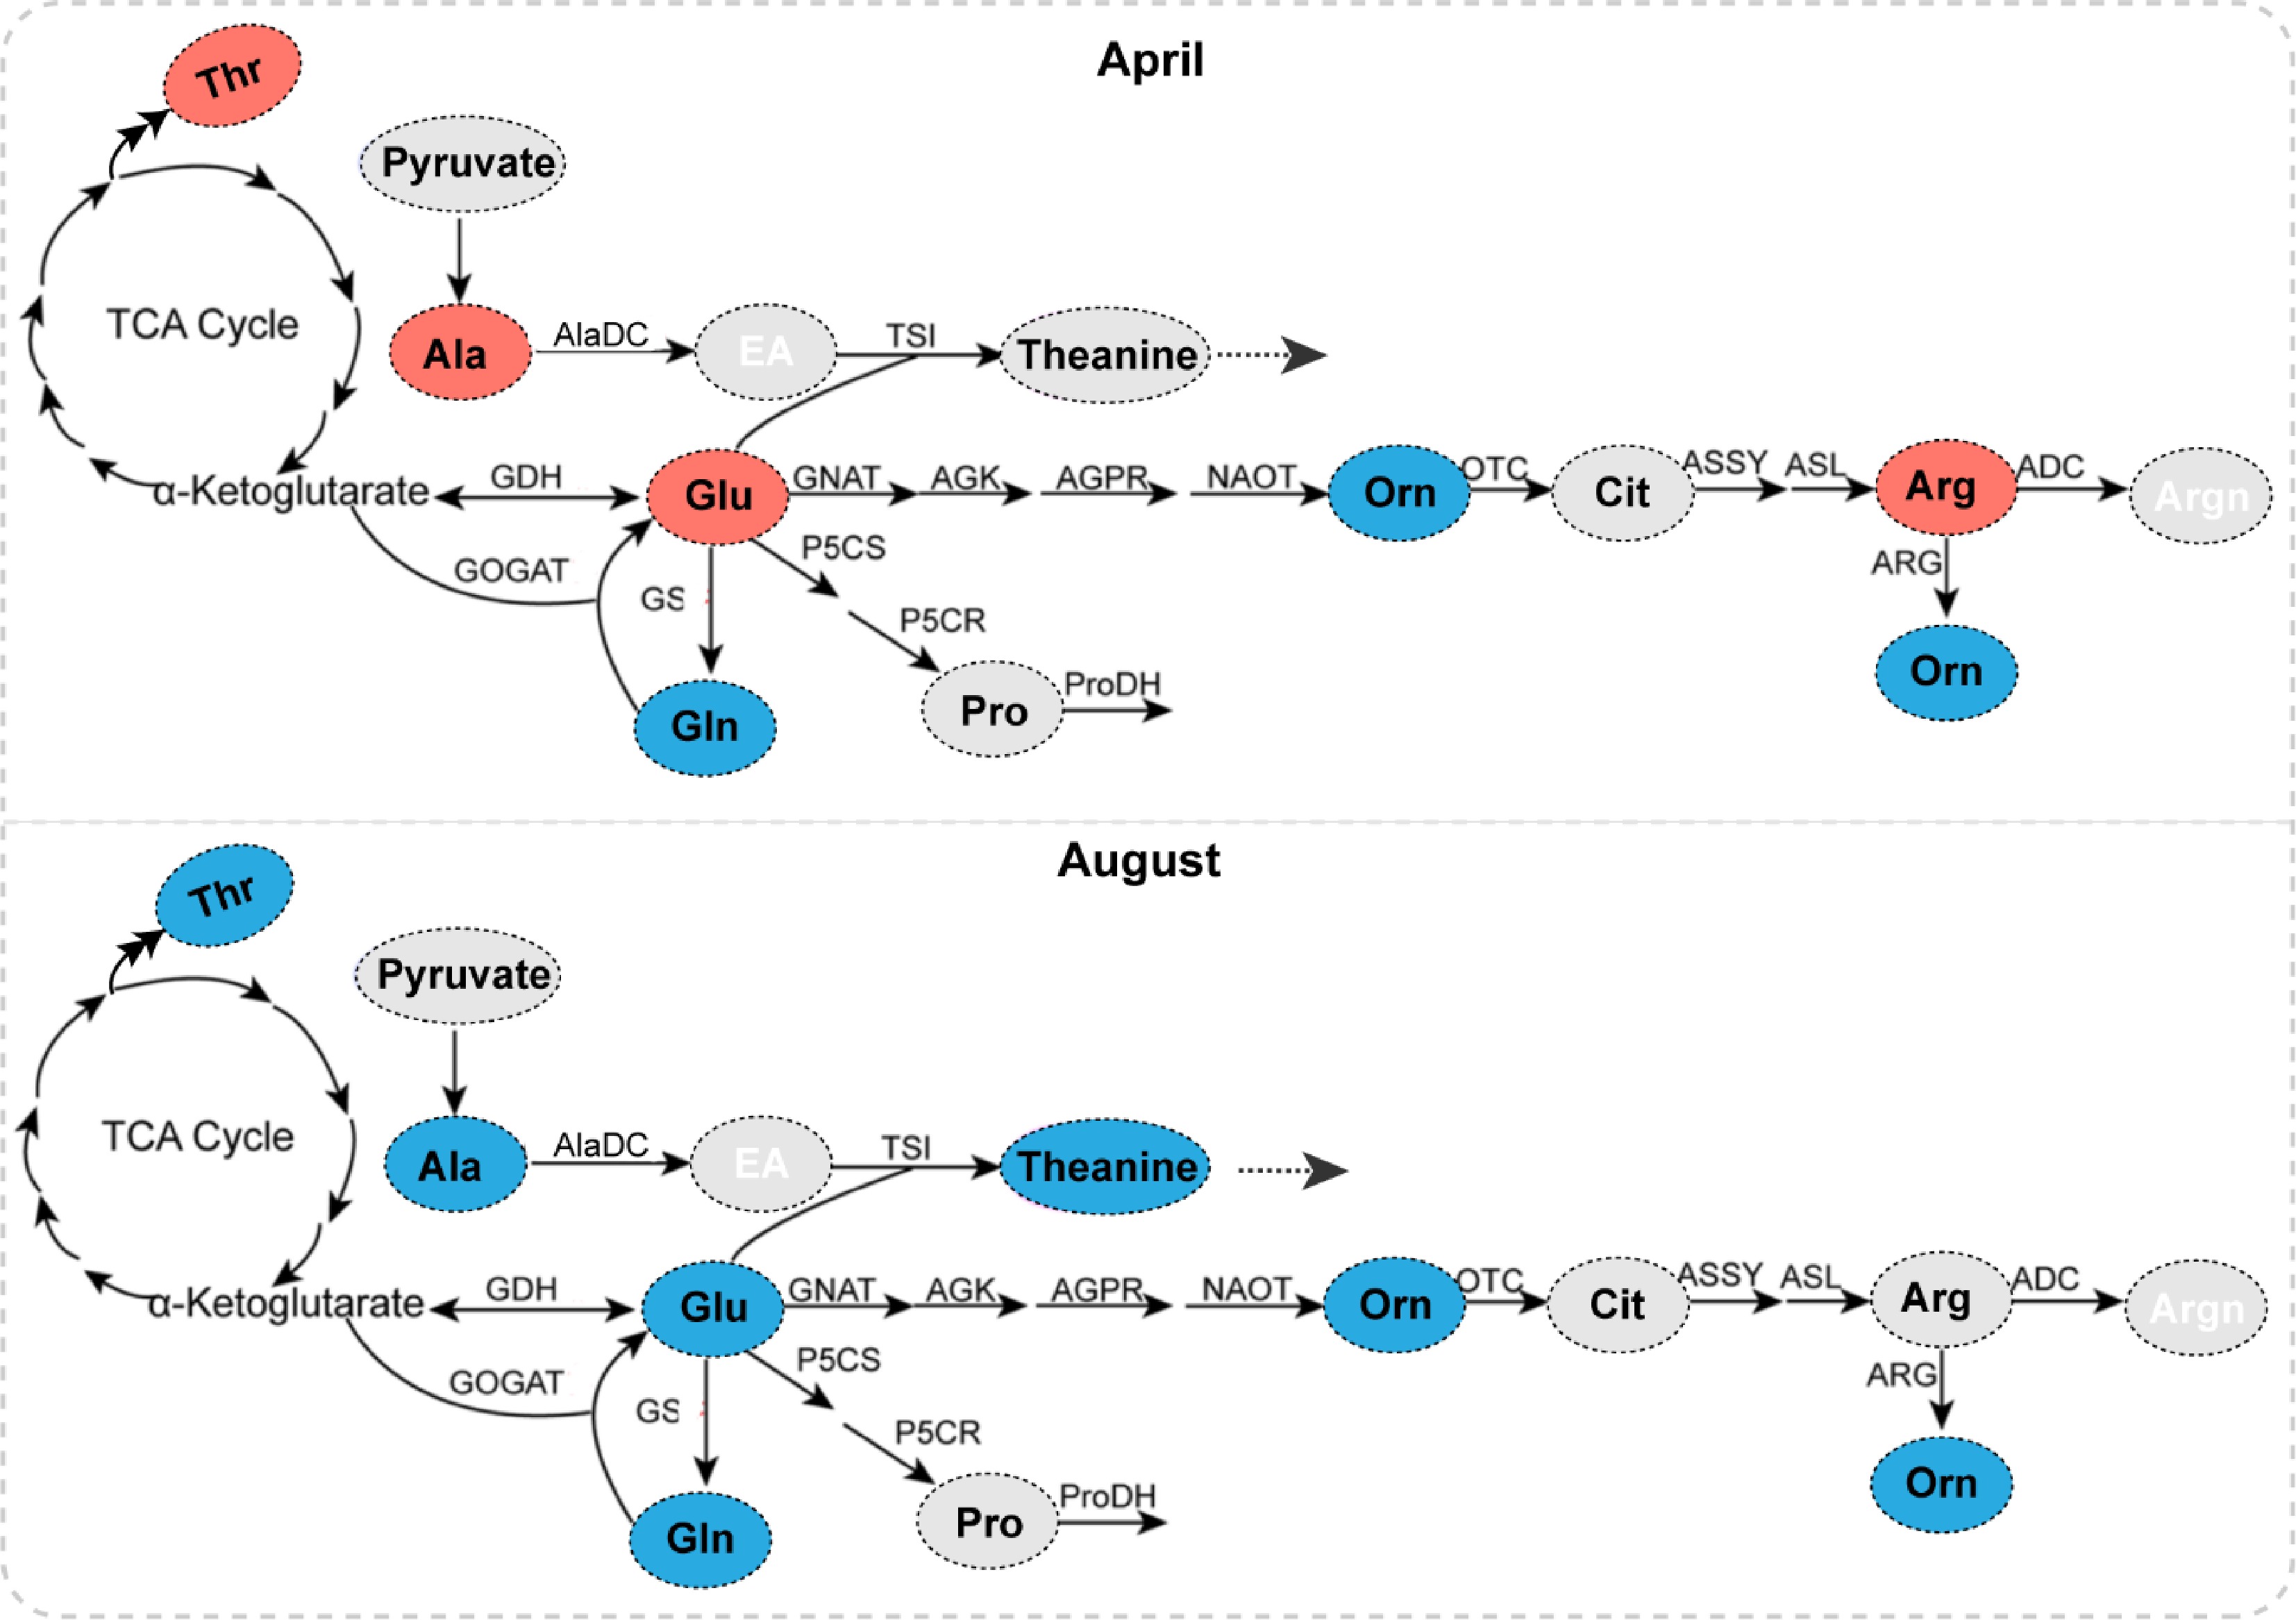
Figure 7.
The effects of heavy shading on AA accumulation of tender leaves in April and August. The predicted Glu pathway in tea plants is modulated from a previous study with permission[44]. AA with a shading-induced increase, decrease and no change is shown in red, blue, and grey, respectively. GDH, glutamate dehydrogenase; GS, glutamine synthetase; GOGAT, glutamate synthase; AlaDC, alanine decarboxylase; TSI, theanine synthetase; P5CS, 1-pyrroline-5-carboxylate dehydrogenase; GNAT, glutamate N-acetyltransferase; OCT, N-ornithine carbamoyltransferase; ASSY, argininosuccinate synthase; ARG, arginase; ADC, arginine decarboxylase.
The accumulation of secondary metabolites, especially theanine, in tea leaves is tightly correlated with the nutrient conditions of plantation soil[38−40]. Zhou et al. reported that soil nutrient deficiency reduced theanine abundance in tea leaves but increased the phenol-ammonia ratio, leading to poor taste quality[38]. Different nitrogen sources also have impacts on carbon/nitrogen metabolism in tea leaves[41−43]. Yang et al. showed that glutamate-derived AAs are the most dynamic in response to various forms of N and N deficiency[44]. In this study, both the control and shading treatments were applied with moderate fertilizer to keep the plantation soil in a consistent nutrition condition. As the uptake of nutrients has been known to be affected by the seasonal temperature conditions, the bioavailability of fertilizer might be different in April and August[42], but the main differences in accumulation of catechins, AA, and catechins/AAs ratio were due to shading conditions.
It has long been known that tea plants prefer growth conditions with modulating light intensity, suitable temperature (25−30 °C), and atmospheric CO2[45]. Photo-inhibition usually occurs at noon on sunny days during summer and autumn, mainly caused by high light intensity and aggravated by temperature. Photosynthesis decreased rapidly at a temperature above 35 °C and ceased completely above 40 °C[46]. In the present study, the temperature could maintain at 39−40°C from 10:00 to 14:00 in August which might enhance the photo-inhibition of tea plants. However, under shading conditions, the photo-inhibition could be relieved by shading-induced decreases in light intensity and temperature, and this endowed tea plants with increased photosynthesis and better growth biomass[46]. Furthermore, enhanced stem elongation of tea plants was observed under shading conditions as a classic 'shade avoidance' response[47, 48], in particular under heavy shading conditions in August. Shading has been previously reported to promote theanine biosynthesis in tender roots but allocates theanine accumulation from leaves to stems of tender shoots[18]. Consistently, the shading-induced decreases in AAs of tender leaves (first developing leaves were used for investigation in the present study) can be partly explained by the allocation of AAs between leaves and stems, especially for theanine, as a probable nitrogen supplication for tender stem elongation.
-
The present study evaluates the seasonal effects on shading regulation of catechins and amino acids of tea leaves by comparing the effects of different shading levels in April and August. Our results show that the reduction of leaf catechins induced by shading is mainly determined by shading level, but shading regulation on AA metabolism is seasonal-dependent. These results indicate that shading levels, shading period, and season-dependent effects should be considered when shading treatments were carried out in tea plantations. As the first report compared shading effects on secondary metabolites of tea leaves between seasons, this study improves our understanding of environmental regulations on tea quality.
This work was financially supported by the National Key Research and Development Program [2021YFD1601103], the National Natural Science Foundation of China [32072623], and the Anhui University Graduate Scientific Research Project [YJS20210246]. We would like to acknowledge Prof. Zhaoliang Zhang and Prof. Tianyuan Yang for their help to set up the shading treatments in the tea plantation and for providing suggestions.
-
The authors declare that they have no conflict of interest.
- Supplemental Table S1 The free AA accumulation of tender leaves at different stages under treatments in April.
- Supplemental Table S2 The free AA accumulation of tender leaves at different stages under treatments in August.
- Copyright: © 2023 by the author(s). Published by Maximum Academic Press, Fayetteville, GA. This article is an open access article distributed under Creative Commons Attribution License (CC BY 4.0), visit https://creativecommons.org/licenses/by/4.0/.
-
About this article
Cite this article
Zhu W, Liu X, Cheng X, Li Y, Liu L. 2023. Shading effects revisited: Comparisons of spring and autumn shading treatments reveal a seasonal-dependent regulation on amino acids in tea leaves. Beverage Plant Research 3:5 doi: 10.48130/BPR-2023-0005 

Shading effects revisited: Comparisons of spring and autumn shading treatments reveal a seasonal-dependent regulation on amino acids in tea leaves
- Received Date: 16 November 2022
- Revised Date: 14 January 2023
- Accepted Date: 17 January 2023
- Published Online: 20 February 2023
Abstract: Shading is an effective way to improve tea quality by modulating the accumulation of the flavor-related secondary metabolites of tea leaves. However, shading effects on amino acids have been conflicting for years as both shading-induced increases and decreases have been detected. This study aims to investigate the effects of shading levels on catechins and amino acids, in particular, a comparison was made in April and August to better understand the involvement of seasonal environmental parameters. Shading reduced major catechins (catechin, gallocatechin, epicatechin, epigallocatechin, epicatechin gallate, and epigallocatechin gallate) in both seasons. Heavy shading (80%−90%) increased total and individual amino acids (threonine, glutamic acid, and alanine) in April but decreased those in August. In both seasons, ᴏ-Phosphoethanolamine increased under heavy shading, but α-aminoadipic acid, ornithine and glutamine showed decreases. Theanine showed no shading response in April but decreased under heavy shading in August. These results indicate that shading-induced reduction of leaf catechins is mainly determined by shading level, but the shading effects on amino acids are seasonally-dependent. As our first report focuses on the synergistic effects of seasons, this study improves our understanding of shading regulation on secondary metabolites of tea leaves and guides shading treatments to improve tea quality.
-
Key words:
- Camellia sinensis /
- Shading /
- Catechin /
- Theanine /
- Amino acid /
- Seasonally-dependent