Temporal climate trend of Ping Basin of Thailand and implications for Mekong Region
Received: 27-May-2013 / Accepted Date: 10-Jul-2013 / Published Date: 15-Jul-2013 DOI: 10.4172/2157-7617.1000146
Abstract
The Ping Basin is the major basin in Northern Thailand with drainage area of 35,000 km2. Climate trend of Ping Basin for current period (1961-2010) and projected trend (2011-2059) are discussed for maximum and minimum temperature and precipitation. Current trend was analyzed from actual representative three stations data and averaging at basin level. Measures of the variability analysis included temporal variability, trend, anomaly, coefficient of variation (C.V) and index. The basin showed high temporal climate variability throughout the study period (1961-2059). The current period showed significant positive trend of minimum temperature and negative trend of maximum temperature while no significant trend in precipitation with high variability, fluctuation and inconsistency. Minimum temperature of Ping increased at a faster rate than that of Thailand. In the first two decades (1961-80), maximum temperature increased by 1.5°C and decreased by 1°C in the later decades (1981-2010) while minimum temperature dropped by 2.3°C in the period of 1961-80 and increased by 1.53°C in the years 1981-2010 as compared to the long term 50 years normal temperature of 1961-2010. Intercomparison of 5 GCMs at 50 km spatial scale in projecting future trends indicated that all the five models show similar prediction of future mean temperature while ECHAM5 had the most robust prediction power of rainfall. Projected trend (2011-2059) from ECHAM4 PRECIS RCM debiased, calibrated and validated at finer 20 km spatial scale shows precipitation will increase as compared to current intensity and minimum temperature will significantly increase at a higher rate (R2=0.76 at the rate of 0.042°C\annum) than maximum temperature (R2=0.5 at the rate of 0.038°C\annum). Our findings are consistent with projections for Mekong Basin.
Keywords: Climate trend; Projection; GCM intercomparison; Ping basin; Mekong region
Introduction
The climate of Thailand is under the influence of Monsoon, Inter Tropical Convergence Zone (ITCZ), and Tropical Cyclone [1].
Thailand climatology exhibits a strong trend and interdecadal variability. The variability in recent decades (post-1980) seems to be strongly linked with ENSO [2-5]. The Ping River Basin is the major watershed in Northern Thailand and is selected as the study area. It comprises parts of 5 provinces (Chiang Mai, Lamphun, Tak, Kamphaeng Phet and Nakon Sawan) with geo-coordinates of location of latitude (15.7°N to 19.8°N) and longitude (98°E to 100.1°E). With a catchment area of about 35,000 km2, the Ping River Basin covers about 22 percent of the Chao Phraya river system and contributes 24 percent of the system’s average annual. The major production constraint of rainfed rice production in Ping Basin is climate variability [1,7].
Accurate understanding of climate variation is of paramount importance to recognizing and understanding their effect on humans and environment. The climate variability impact at regional/subregional and ecosystem levels is likely to be uneven and unpredictable. South east and south Asia are such vulnerable regions wherein impacts on food security would be considerable [7-9].
Spatiotemporal climate trend analysis detect and describe pattern, variability, anomaly and trend in space and time context this will further enhance our insight into the possible natural disasters b like flood and drought for better preparedness to minimize their impacts. Extreme cases of drought and flooding cause disaster to human and environment. The October 2011 flooding in Thailand is one example. Seasonal rainfall from May to October in 2011 was 40% above normal in Northern Thailand. The World Bank estimated 1,425 billion baht (US$ 45.7billion) in economic damages due to flooding. The Agriculture Ministry reported total damage of 1.6 million ha of cultivated areas, of which 1.28 million was paddy with estimated loss of 6-7 million tons [1,10]. On the contrary, the worst 2012 USA drought disaster which hit hardest 10 states caused 30-50% yield losses of major crops [11]. Such extreme climatic phenomena indicate how seasonal or annual climate variability is more important to farmers than climate change due to their sudden and unexpected immediate and short term impacts.
In this study, temporal climate trend analysis was carried out for the period of 1961-2059 in Ping River Basin of Thailand. The current trend covered the 1961-2010 period and future projection of climate trend covered the period of 2011-2059. Results of this study will serve as a milestone for better understanding of the climate system of Thailand with a multiplier effect in Mekong Region for early warning system and effective planning and implementation of adaptation strategies to minimize natural hazards.
Objectives of the study:
a) Description and detection of climate variability in the period of 1961-2010 and 2011-2059.
b) Identification of extreme anomalous years of temperature and rainfall during 1961-2010 period
c) Assessment of climate variability and trend in the three Ping catchments.
d) Projecting future climate trend through GCM comparison.
Hypothesis:
a) All climate variables had similar trends
b) The Ping catchments exhibited similar climate variability and trend
c) Extreme anomalous years of temperature (warmest and coldest periods) and rainfall (wettest and driest periods) were not observed during 1961-2010 period
d) Future climate trends are similar with current climate situation
The Study Area: The Ping Basin
The Ping River along with the Nan River, is one of the two main contributories of Chao Phraya River. It originates at Doi Chiang Dao in Chiang Dao district, Chiang Mai Province. After passing Chiang Mai town, it flows though the provinces Lamphun, Tak, and Kamphaeng Phet. At the confluence with the Nan River at Nakhon Sawan it forms the Chao Phraya River. With a catchment area of about 35,000 km2, the Ping River Basin covers about 22 percent of the larger Chao Phraya river system within which it is nested and contributes about 24 percent of the system’s average annual runoff. The Ping river basin is the major watershed in northern Thailand. The basin is strategically important in terms of its upstream location, population density, economic integration, and as a cultural center. It is one of the four upper tributary basins forming the Chao Phraya river system, the most important river basin in Thailand [12].
Agriculture in Ping River Basin:
Rice is the major crop followed by orchards, maize, cassava, sugarcane, beans and other minor crops. Irrigation water source are from Ping River and Bhumiphol dam. The Chiang Mai valley is the most favorable environment for lowland rainfed rice production with fertile soil in the basin [6,13].
Climate:
The Ping Basin has a tropical climate affected by an annual monsoon. The climate of Ping River Basin is dominantly affected by Monsoon. The three distinct seasons in Northern Thailand are Monsoon (rainy season), winter and summer. Rainy season or Southwest Monsoon Season (May to Mid-October) is dominated by the southwest monsoon, during which time rainfall in the north is at its heaviest. Winter or northeast monsoon season (Mid-October to Mid-February) is cold season. Summer or pre-monsoon season (Mid-February to Mid-May) is the hottest season [1,4,16]. The basin receives annual rainfall of 1123 mm. The mean maximum and mean minimum temperature are 34°C and 20.7°C, respectively. The mean temperature of the basin is 27°C. Out of 31 main meteorological stations in Northern Thailand, 6 stations are located in Ping Basin and 3 representative stations were selected based on representativeness and availability of complete dataset. These are Chiang Mai, Tak and Nakhon Sawan representing Upper, Middle and Lower Ping catchments, respectively. Data Analysis was done at 3 catchment zones (Upper, Middle, and Lower Ping catchments) and at Ping basin level for all variables. Ping Basin level statistics was taken as average of the 3 catchments.
Land use change dynamics:
Gradient change in forest cover (1990-2000) shows 90% forest cleared in Nakon Sawan; Kamphaeng Phet: 30 % increment; Tak (70- 80% rise in forest) and Chiang Mai had Similar trend to Tak & Lamphun. There had been a shift from paddy land into bioenergy (corn) and high value crops (orchards, flowers and spices) in the marginal lands which have occurred mainly in the major valley and hilly areas of the Upper Ping Basin. There was also encroachment of forest areas for cash and energy crops and forests are highly threatened at present [14]. Details of the study area are presented in Table 1 and Figure 1.
| S.N. | Data Type | Data |
|---|---|---|
| 1 | Political administration | Northern Thailand, including parts of 5 provinces (Chiang Mai, Lamphun, Tak, Kamphaeng Phet & Nakhon Sawan) |
| 2 | Area | 35,000 km2 |
| 3 | Geographic Location | Latitude: 15.719900 to 19.821400 Longitude: 98.071700 to 100.166000 |
| 4 | Altitudinal zonation of Ping catchments | Upper Ping (Chiang Mai and Lamphun) Middle Ping (Tak) Lower Ping (Kamphaeng Phet and Nakon Sawan) |
| 5 | Population | 2,384,946 |
| 6 | Annual average runoff | 9,073Million M3 |
| 7 | Dam (reservoir)-Bhumibol | 9,662Million M3 storage capacity |
| 8 | Topography | Valley, mountains and plains (54m- 2600 m above sea level) |
| 9 | Rice farming | Rainfed and irrigated |
Table 1: Geography of Ping River Basin.
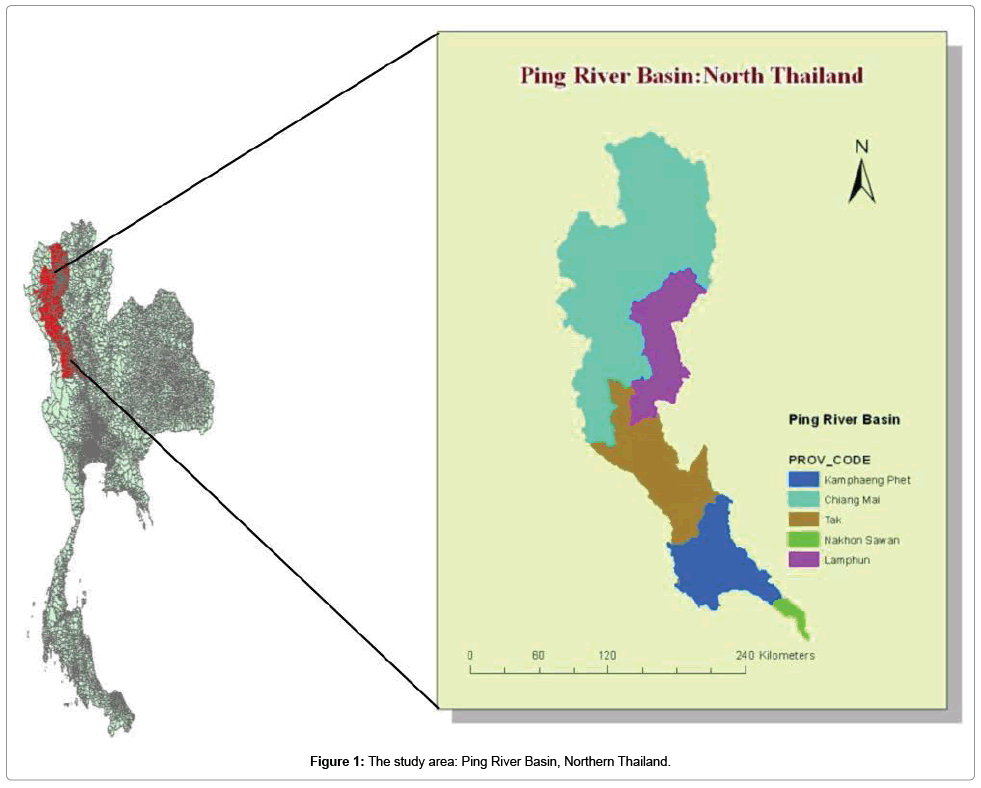
Figure 1: The study area: Ping River Basin, Northern Thailand.
Materials and Methods
Data collection
Climate data for current climate trend analysis were collected from the Thai Meteorological Department (TMD) for the period of 1961- 2010. Parameters include temperature (maximum and minimum) and rainfall. The baseline period 1961-90 was taken as reference year for anomaly comparison. Data source for climate trend projection were accessed from SEA START Regional Center for the period of 2011- 2059 and GCM intercomparison was done from data collected from The Nature Conservancy for 5 GCMs at 50 km spatial resolution [15].
Input data:
a) 1961-2010 climate data from TMD
b) Intercomparison of 5 GCMs with A2 Scenario (NCARCCSM3.o USA, CNRM-CM3.0 USA, Hadley Had CM3 UKMO, UK ( UKMO-HadM3), CSIROMK3.0 Australia, GCM3.1 Canada and ECHAM5 MPI Germany at 50km scale for future mean temperature and rainfall change prediction for the period of 2020-2100. Selection of GCMs was done on the basis of global representativeness, model performance and data availability.
c) ECHAM4 PRECIS RCM at 20km scale for Minimum and maximum temperature and precipitation (2011-2059)
Data analysis
Time series data should be compared with standard climatological base year of known 30 years period for valid inference of climate variability and climate. The 1961-90 period was selected as baseline climatological period for Ping River Basin for climate variability, trend and anomaly comparison of 50 years climatological period (1961-2010) at annual and decadal scale.
Temporal climate variability (annual, inter annual and decadal variability); time series trend; climate anomaly, coefficient of variation (CV) and index were considered as measures of climate trend analysis for variability, anomaly and trend analysis and comparison for the period of 1961-2010 at annual and decadal time periods. Software packages used include ARC GIS 10 (for GIS data operation) and Statistical packages (Excel, MINITAB 15.3 and SPSS 16).
Statistical analytical tools included descriptive statistics, correlation, regression, Mann-Kendall trend and T-test [16]. Time series trend analysis (Parametric and Non- Parametric Tests) was undertaken through regression and Mann Kendall trend test to detect temporal trend of variables. The Mann-Kendall test is a non-parametric test for identifying trends in time series data). Non Parametric time series Mann Kendall trend test is adopted for testing temporal trend of climate variables as recommended by WMO [17,18].
Spatial interpolation analysis was done through raster interpolation. A total of 18 known points from 6 main stations and 12 agrometeorological stations interpolated for prediction and densification of climate variables so as develop climate map of Ping Basin through comparison of interpolation methods of IDW, SPLINE and KRIGING (Ordinary KRIGING) in ARC GIS 10. GIS overlaying of observed stations and interpolated maps of best fit techniques was carried out in ARC GIS 10 to generate normal (average) interpolated climate map of each climate variable for Ping River Basin.
Intercomparison of the predictive power of GCMs was done through comparison of their level of significance.
Parameters of climate trend were calculated through the following formulae:
i. Coefficient of Variation (CV %):
CV= [standard deviation/ Mean]*100
ii. Annual variability= [Annual climate data]- long term mean climate data (μ)
iii. Rainfall index (δi)= δi=[(Pi-μ)/σ], (δ is rainfall index for year , Pi is annual rainfall for year i and μ is mean rainfall and σ as standard deviation)
iv. Anomaly as deviation of annual value from climatological base year (1961-90 in this case).
v. Interannual variability as difference between two consecutive years (Δ)
Descriptive statistics:
It was applied to summarize data with measure of central tendency and measure of variability or dispersion (standard deviation and variance, the minimum and maximum variables, kurtosis, and skewness. Descriptive summary was prepared for each parameter to derive statistics at Ping Basin level. Normality test was done to check the distribution pattern of parameters and to choose appropriate statistical tests (parametric or non-parametric tests). Monthly, annual, decadal and long term climate data descriptive statistics and summary were prepared. Coefficient of variation (C.V.) was reported as a percentage value for each parameter. The variability of climate variables over the study time was examined by calculating coefficient of variation (CV).
Correlation:
It was calculated to quantify the strength of the relationship between two variables which ranges between -1 and 1. Positive correlation shows both variable follow the same linear trend (when one variable increases, the second increases in a linear fashion). Bivariate analysis is a Pearson correlation coefficient to determines the strength of the linear relationship between two variables (bivariate refers to two variables). Negative correlation shows as one variable increases, the second decreases. Correlation analysis assumes no causal relationship between variables. Pearson’s bivariate correlation coefficient (r) and level of significance at 0.05 and 0.01 levels were compared to detect degree and direction of relationship (association) between climate variables.
Parametric test (regression) and Mann Kendall were done to detect time series trend of climate variables as no significant trend, negative or positive trend.
Results and Discussion
Current climate trend (1961-2010)
Overall variability and time series analysis indicates that there was significant trend in temperature but no significant trend and high variability in rainfall during the last five decades (1961-2010). Ping Basin based 50 years climate data (1961-2010) analysis showed that the mean (normal) temperature was 27.44°C while mean maximum temperature of 34.27°C and mean minimum temperature was 20.7°C and mean rainfall was 1123 mm. The climatological base year (1961- 1990) mean maximum temperatures was 37.3°C and mean minimum temperature of 20.7°C and mean rainfall of 1200 mm indicating that the base period had higher temperature and rainfall than the 50 years (1961-2010) normal climate. Upper Ping received the highest rainfall (1171.47 mm) followed by Lower Ping (1141.72 mm) and Middle Ping (1056.15 mm), respectively. No gradient trend was observed for rainfall. Rainfall was highly variable and inconsistent with coefficient of variation (C.V) of 19% followed by minimum temperature (10%) and maximum temperature (4%). Results of analysis are summarized in Tables 2-6.
| Climate variable | Base year (1961-1990) | 1961-2010 | 1961-70 | 1971-80 | 1981-90 | 1991-2000 | 2001-2010 |
| Rainfall | 1200.01 | 1123.11 | 1142.58 | 1118.08 | 1113.32 | 1047.67 | 1193.93 |
| TMax | 37.29 | 34.27 | 35.99 | 35.58 | 33.15 | 33.26 | 33.38 |
| TMin | 20.81 | 20.74 | 18.19 | 18.71 | 21.85 | 22.28 | 22.69 |
| Decadal climate variability | |||||||
| Rainfall | 1200.01 | 1123.11 | 19.46 | -5.03 | -9.80 | -75.45 | 70.81 |
| TMax | 37.29 | 34.27 | 1.71 | 1.31 | -1.13 | -1.01 | -0.89 |
| TMin | 20.81 | 20.74 | -2.56 | -2.04 | 1.10 | 1.54 | 1.95 |
| Decadal anomaly | |||||||
| Rainfall | 1200.01 | 1123.11 | -57.43 | -81.93 | -86.69 | -152.34 | -6.08 |
| TMax | 37.29 | 34.27 | -1.3 | -1.71 | -4.14 | -4.03 | -3.91 |
| TMin | 20.81 | 20.74 | -2.62 | -2.1 | 1.04 | 1.47 | 1.88 |
TMax= Maximum temperature
TMin= Minimum temperature
Table 2: Decadal climate variability and anomaly of Ping Basin as compared to normal (1961-2010) and base year (1961-90).
| Region | Dry season (winter & Summer) | Rainy Season |
| North | 23.2 | 76.8 |
| Ping River Basin (N. Thailand) | 15.3 | 84.7 |
| Northeast | 20.8 | 79.1 |
| Central | 25.9 | 74.4 |
| East | 23.6 | 76.4 |
| South East | 58.7 | 41.2 |
| South West | 30.5 | 69.6 |
Table 3: Comparison of seasonal rainfall distribution (%) in Thailand and Ping Basin.
| Climate Variable | Ping Catchments | |||
|---|---|---|---|---|
| Upper Ping | Middle Ping | Lower Ping | Ping Basin | |
| Temperature | ||||
| Maximum | 33.00 | 34.68 | 35.13 | 34.27 |
| Mininimum | 19.20 | 21.08 | 21.95 | 20.74 |
| Mean | 26.03 | 27.79 | 28.51 | 27.44 |
| Total Rainfall | 1172 | 1056 | 1142 | 1123 |
Table 4: Time series averaged climate data by catchment (1961-2010).
| Statistic | Max.T | Min T | Rainfall |
| No. of observations (years) | 50 | 50 | 50 |
| Minimum | 32.48 | 17.02 | 760.10 |
| Maximum | 36.79 | 23.60 | 1451.50 |
| Range | 4.31 | 6.58 | 691.40 |
| 1st Quartile | 33.16 | 18.46 | 1011.63 |
| Median | 33.57 | 21.77 | 1146.77 |
| 3rd Quartile | 35.74 | 22.40 | 1229.60 |
| Mean | 34.28 | 20.80 | 1123.11 |
| Variance | 1.86 | 4.18 | 27497.31 |
| Standard deviation | 1.36 | 2.04 | 165.82 |
| C.V. | 0.04 | 0.10 | 0.15 |
| C.V. (%) | 4 | 10 | 19 |
| Skew | 0.49 | -0.49 | 0.12 |
| Kurt | -1.41 | -1.54 | -0.87 |
Table 5: Descriptive statistics of climate variables of Ping River Basin (1961-2010).
| Climate Variable | Month | ||||||||||||
| 1 | 2 | 3 | 4 | 5 | 6 | 7 | 8 | 9 | 10 | 11 | 12 | Annual | |
| 50 years (1961-2010) average | |||||||||||||
| Temperature | |||||||||||||
| Max | 32.5 | 35.3 | 37.6 | 38.7 | 36.6 | 34.4 | 33.8 | 33.3 | 33.2 | 32.6 | 31.9 | 31.3 | 34.3 |
| Min | 14.6 | 17.1 | 20.4 | 23.3 | 23.9 | 24.0 | 23.8 | 23.5 | 22.9 | 21.7 | 18.6 | 15.1 | 20.7 |
| Mean | 23.7 | 26.3 | 29.2 | 30.9 | 29.8 | 28.9 | 28.5 | 28.1 | 27.8 | 27.1 | 25.4 | 23.4 | 27.4 |
| Rainfall (mm) | 5.9 | 9.2 | 23.5 | 56.9 | 159.6 | 124 | 129 | 177.8 | 229.3 | 156 | 41.6 | 10.3 | 1123 |
Table 6: Ping River Basin monthly and annual averaged climate data (1961-2010).
Temperature trend: Mean maximum temperature and mean minimum temperature were variable over time and space. The rate of increment of minimum temperature in Ping is much higher than the Thailand average increment rate [2,4,7,18].
a) Maximum temperature
It showed an increasing trend but not significant during pre-and post-1980 which is in line with the Thailand trend showing increasing trend. However, the 1961-2010 trend shows a decreasing trend after 1980 as the pre-1980 period had high records in 1970s. During pre-1980 period (1961-1979) the lower catchment had a relatively higher increment than the middle and upper catchments while the middle catchment showed more rising followed by lower and upper catchments, respectively. These two distinct clusters of maximum temperature (pre-and post-1980 periods) indicate that the pre-1980 period was warmer period than the post-1980 period and was above average and increasing trend during 1961-1978. There was sharp increase above average in 1979 and it was the warmest year during 1961-2010 period. The first two decades of time period 1961-1979 had higher maximum temperature record for the basin and from 1980 onwards maximum temperature was lower than the pre-1980 period. This finding is in line with global trends justifying that the standard base year of 1961-90 could be taken as climatological base year and local maximum temperature phenomenon is observed and global trend validated at local level. The year 1999 showed Sharp rise and was the warmest year in the post-1980 period for all catchments and was typical year for rise of maximum temperature and this year is also a global indicator of sharp climate shifts. There were two distinct cluster classes of maximum temperature; Pre- and post-1980 periods. The pre-1980 period is characterized by higher temperature than post-1980 period.
b) Minimum temperature
Minimum temperature had a significant increasing trend during the 1961-2010 period. It was below average but increasing trend during 1961-79 but sharp rise above average in 1980. The period 1981-2010 was characterized by increasing trend of minimum temperature in the basin. From 1980 onwards, unlike maximum temperature, there was faster increasing trend of minimum temperature than pre-1980 period showing that seasons are getting warmer in recent years. This is also in line with global climate change and variability trends that some places are getting hotter manifested in warming of cold season [1,2,12].
Inter-annual and inter-decadal temperature variability was observed in terms of fluctuation, inconsistency, trend and extreme values and events, and anomalies. In the first 2 decades (1961-80), maximum temperature increased by 1.5°C and decreased by 1°C in the later decades (1981-2010). Minimum temperature dropped by 2.3°C in the period 1961-80 and increased by 1.53°C in the years 1981-2010 as compared to the long term 50 years normal temperature of 1961-2010. The change in minimum temperature has been occurring at faster rate than maximum temperature and showed consistent results with that of Thailand attributed to El Niño-Southern Oscillation (ENSO) events as important source of interannual/interdecadal variability in Thailand surface air temperatures. The overall warming trends of maximum temperature and minimum temperature in the 1980s and 1990s were consistent with the tendency for more frequent El Niño events and fewer La Niña events since the late 1970s [18,19].
d) Temperature anomaly
Temperature variability shows deviation of annual temperature (negative or positive) as compared to long-term normal (average) temperature whereas anomaly shows deviation from the standard base year average (1961-90). Anomalies are of three types- no anomaly (no difference from normal climate which is equal to zero value), positive anomaly (difference above normal, value >0) and negative (difference below normal, value <0). Anomalous years of temperature were screened to identify warmest and coldest years in the study period (1961-2010) at Ping River Basin. Accordingly, the year 1979 was the warmest year recording 2.5°C above normal maximum temperature and the year 1971 as the coldest year 3.7°C below normal minimum temperature in the Ping Basin during the last 50 years (1961-2010).
Rainfall trend: Rainfall variability, trend, anomaly and index are discussed. It was also highly variable in terms of amount, intensity, onset and seasonal distribution (Table 2). Rainfall index which is computed as a standard rainfall departure helps to differentiate available temporal rainfall into normal, wet and dry years (with values =0 as normal, values 0 as wet years). There was no significant trend in rainfall index. We classified years based on rainfall index to identify the wettest and driest years during 1961-2010. The year 1970 and 1988 were the wettest years and 1993 as the driest year during the period of 1961-2010. There had been a decadal anomaly of 19.46 mm in 1961-70 and -7.41°C in the next 2 decades (1971-90). The decade 1991-2000 showed decline of rainfall (-75.45 mm) while the recent decade (2000-2010) was evidenced by increment of 70.80 mm indicating that the 1990s were deficit years and 2000-2010 as better years with increased rainfall (Table 2). Normal seasonal distribution in the Ping Basin shows that September receives the highest rainfall (20.4%), followed by August (15.8%), May (14.2), July (11.5%) and June (11.1%) during the rainy season, respectively. Rainy season (May- October) contributes 84.7% while the dry season (November.-April) contributes only 15.3% to the total annual rainfall in the basin (Table 3). Rainfall components comprise intensity, seasonal distribution and rainy days. It is not the total annual rainfall what matters to production but the seasonal distribution during critical crop growth stages. Though there was no significant trend in rainfall based on Mann Kendall trend test, its annual and interannual variability, anomaly and seasonal distribution pattern are of paramount importance for agriculture.
Correlation between climate variables: Highly significant correlation was observed between year (time) and minimum temperature (r=0.891, p-value=0.001). Maximum temperature was highly negatively correlated with time (r=-0.768, p-value=0.001) and minimum temperature (r=-0. 873, p-value=0.001). There was no significant correlation between rainfall and temperature.
Climate map of 50 years average temperature (maximum and minimum) and rainfall are generated through interpolation for Ping Basin.
Mapping climate variables: Comparison of interpolation techniques showed that IDW and Kriging had equal prediction power of maximum and minimum temperature and both techniques were found to be 66.6% more accurate than Spline in predicting maximum temperature while 30.4% more accurate in predicting minimum temperature. Kriging was 64.5% more accurate followed by IDWA with 56.1% accuracy in predicting rainfall. Kriging was found to be best fit in predicting all climate variables. Spline had higher error of 71.7%, 34% and 72.5% in predicting maximum temperature, minimum temperature and rainfall, respectively. Spline performed least in predicting all climate variables (Figure 2).
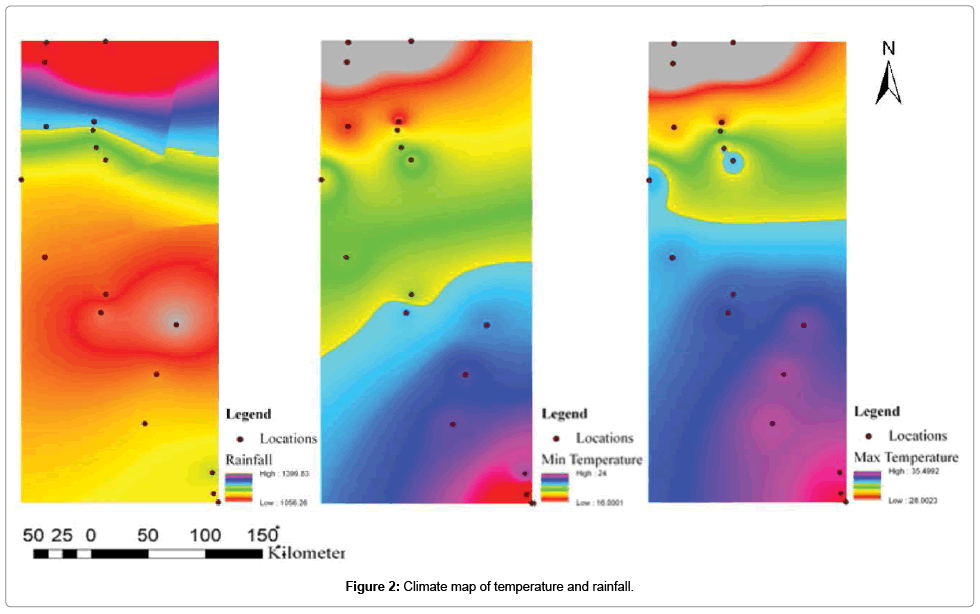
Figure 2: Climate map of temperature and rainfall.
Future climate trend (2011-2059)
Climate modeling in Thailand for B2 and A2 forecasts an increase in average temperature by 2100 from 21.5-27.5°C to 25-32°C. The temperature increases by 2.5°C in the northeast region and by 3-3.5°C in the central, north, and west regions. The hot period of the year will extend longer and the cold period will be significantly shorter. The distribution of rainfall changes across the country. The amount of rainfall in the northeast remains constant while it increases by 40% in the south. The amount of rainfall in other parts of the country increases by 20%. The length of rainy season would remain the same but with higher rainfall intensity [1,3,9,18-21]. GCMs are developed for different geographical regions and have limitations in resolution, accuracy, representation, topographical barriers and uncertainty problems and should be locally evaluated, calibrated and validated for practical application and choice.
Intercomparison of GCMs: Comparison of HadCM3, CSIRO, CGCM2, and NCAR for predicting temperature shows that the first 3 models had similar performance. Comparison of PRECIS, RegCM3, GCM-GFDL-R30 and MM5 in Thailand indicated the models performed in predicting temperature and predictions correlate well with observed values but precipitation prediction varied with each model with poor correlation with observed data [2,18].
Projecting future climate variability through intercomparison of GCMs to select best fit model was carried out through intercomparison of GCMs at 50 km and 20 km spatial scales.
a) GCM comparison (50 km resolution)
Comparison of 5GCMs at 50 km spatial scale for predicting future temperature (mean temperature) and rainfall showed similar prediction of 0.03-0.049°C \annum rise (P-value<0.0001). Of the 5 GCMs, future rainfall was best predicted by ECHAM5.1.MPI-OM (4.43mm\annum increment rate, P-value <0.0001).
b) Projection by ECHAM4 PRECIS RCM (20km resolution)
South East Asia START Regional Center (SEA START RC) developed; tested and validated this model for the region and it is serving as a regional model for projecting climate variables. ECHAM 4 PRECIS RCM at 20km spatial scale was downscaled, debiased and validated and accepted as a working model for SEA (START). Projected climate by ECHAM 4 PRECIS RCM (START) shows increasing trend for temperature (Maximum and Minimum temperature) and rainfall. Maximum and minimum temperatures will increase with significant temporal trend of maximum temperature at the rate of 0.038°C\annum (R2 =0.5) and 0.042°C\annum (R2=0.75) for minimum temperature, respectively. Minimum temperature will increase at a faster rate than maximum temperature while rainfall increases as compared to current intensity but with no significant temporal trend (Figures 3-5). Similar future projected trends are observed and reported in the Mekong Basin [1,9,18].
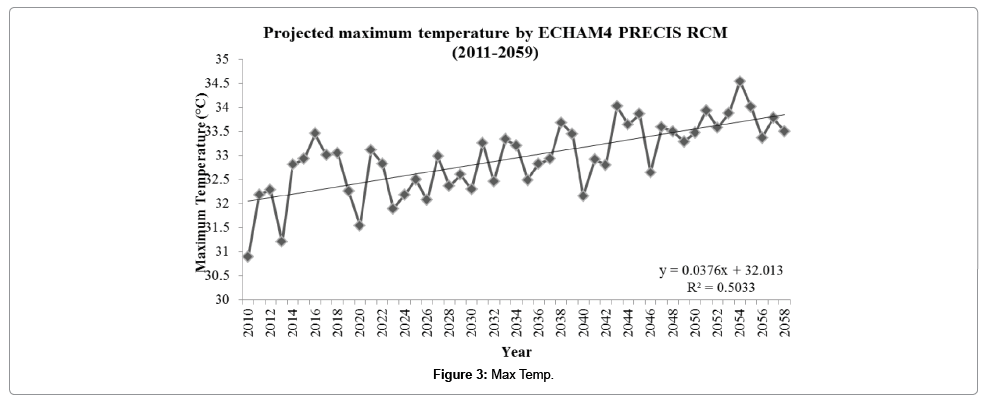
Figure 3: Max Temp.
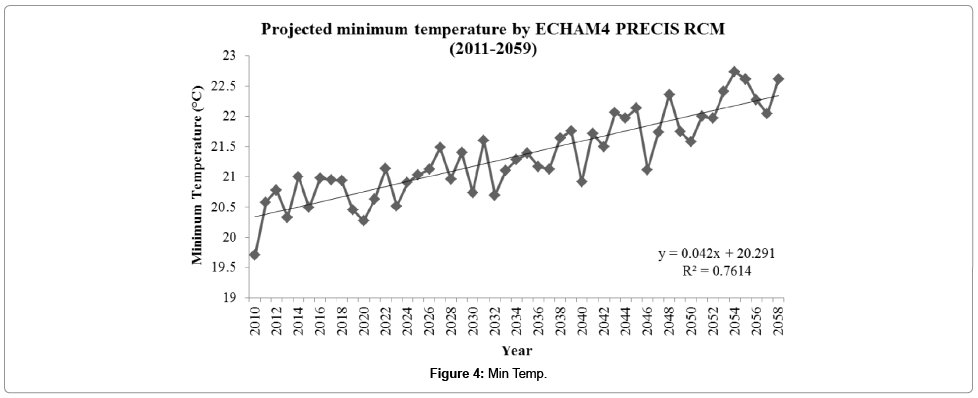
Figure 4: Min Temp.
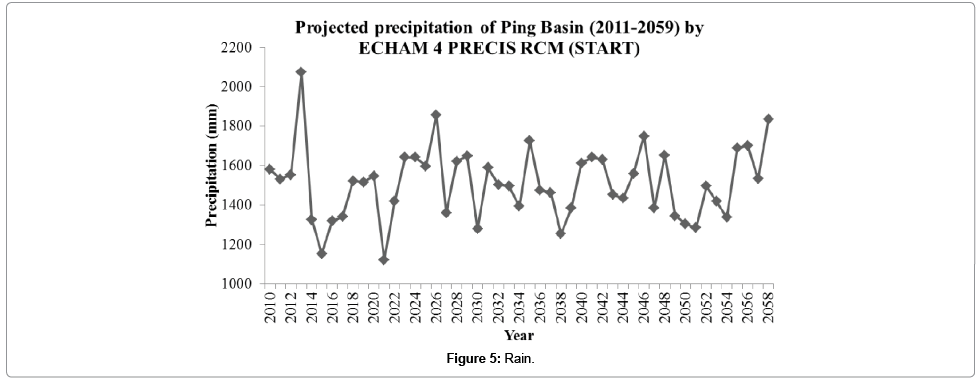
Figure 5: Rain.
Conclusion
The current period showed significant positive trend of minimum temperature and negative trend of maximum temperature while no significant trend in precipitation with high variability, fluctuation and inconsistency. Minimum temperature of Ping increased at a faster rate than that of Thailand. In the first two decades (1961-80), maximum temperature increased by 1.5°C and decreased by1°C in the later decades (1981-2010) while minimum temperature dropped by 2.3°C in the period of 1961-80 and increased by 1.53°C in the years 1981-2010 as compared to the long term 50 years normal temperature of 1961-2010. Intercomparison of 5 GCMs at 50 km spatial scale in projecting future trends indicated that all the five models show similar prediction of future mean temperature while ECHAM5 had the most robust prediction power of rainfall. Projected trend (2011-2059) from ECHAM4 PRECIS RCM debiased, calibrated and validated at finer 20 km spatial scale shows precipitation will increase as compared to current intensity and minimum temperature will significantly increase at a higher rate than maximum temperature. Climate variability is impacting on rainfed agriculture in the Mekong Region. Developing more accurate assessment and prediction methods and tools will be top priority in the face of existing natural disasters and their uncertainty and unpredictability in the region. Existing GCMs and regional models give clues about long term climate change trends which are not fit to predict variability as the variability of climate is high, unpredictable and dynamic within short time span. Seasonal prediction and early warning system through augmentation of space technology with ground stations and further modeling, calibration and validation of such tools as a decision support system (DSS) are of practical solution in the region rather than GCMs. Our finding show exploratory results and further and detailed research is needed at a finer spatial scale and associate such results with impact assessment tools at sector level.
Acknowledgement
We are grateful to The Royal Thai Meteorological Department (TMD), SEA START RC (Bangkok) and The Nature Conservancy for data provision.
References
- Thai Meteorological Department (2011) Meteorological records and reports
- Chalalai J (2007) Climate dataset: Past and Future for Climate data in Thailand.
- National Climatic Data Center (2009) El Niño / Southern Oscillation (ENSO) information by National Oceanic and Atmospheric Administration (NOAA).
- Singhrattna N, Babel MS, Perret SR (2009) Hydroclimate variability and its statistical links to the large-scale climate indices for the Upper Chao Phraya River Basin, Thailand. Hydro Earth Syst Sci Discuss 6: 6659-6690.
- Singhrattna N, Balaji R, Krishna KK, Martyn C (2005) Interannual and interdecadal variability of Thailand Monsoon season. J Climate 18: 1697–1708.
- Shinawatra B, Pichit T, Jamaree P (1986) Farmers' Decision Making: A Case Study of the Chiang Mai Valley (1985/86).
- Reda AG, Tripathi NK, Soni P, Tipdecho T, Vaddhanaphuti C (2012) Climate variability in Ping River Basin, Northern Thailand.
- ADB (1994) Climate Change in Asia: Executive Summary. Asian Development Bank, Manila, Philippines.
- Kamal K, Subbiah AR (2000) Regional Climate Outlook: Southeast Asian Applications.
- World Bank (2012) Thailand floods and the World Bank Support to Thailand's Post-Floods Recovery Effort.
- Thomas DE (2006) Developing Watershed Management Organizations in the Ping River Basin Thailand.
- Benchaphun S, Sukapong C, Woodtikarn P, Deundao P, Padermchai P, et al. (1992) Assessing the Impact of Farming Systems Research in Thailand. In Proceedings of the 9th Thailand National Farming Systems Seminar, Phuket, March 24-27.
- Mapiam PP, Sriwongsitanon N (2009) Estimation of the URBS model parameters for flood estimation of ungauged catchments in the upper Pingriver basin, Thailand. ScienceAsia 35: 49-56.
- Gilbert RO (1987) Statistical methods for environmental pollution monitoring New York.
- Suppakorn C (2008) Current Research on Impact, Vulnerability and Adaptation to Climate Change in Thailand. South East Asia START Regional Center (SEA START RC), Bangkok, Thailand.
- Atsamon L, Joaquim IG (2008) Empirical evidence for interannual and longer period variability in Thailand surface air temperatures. Atmospheric Research 87: 89-102.
- Cullen MB, Lyon B (2002) Drought in central and southwest Asia: La Niña, the warm pool, and Indian Ocean precipitation. J Clim 15: 697-700.
Citation: Reda AG, Tripathi NK, Soni P, Tipdecho T, Phalke A (2013) Temporal climate trend of Ping Basin of Thailand and implications for Mekong Region. J Earth Sci Clim Change 4: 146. Doi: 10.4172/2157-7617.1000146
Copyright: ©2013 Reda AG, et al. This is an open-access article distributed under the terms of the Creative Commons Attribution License, which permits unrestricted use, distribution, and reproduction in any medium, provided the original author and source are credited.
Share This Article
Open Access Journals
Article Tools
Article Usage
- Total views: 14518
- [From(publication date): 8-2013 - Apr 20, 2024]
- Breakdown by view type
- HTML page views: 10034
- PDF downloads: 4484