Bioremediation of Xenobiotic Pesticides by Bacterial Species Isolated from Flower Farm Soil around Lake Naivasha, Kenya
Received: 26-Jul-2018 / Accepted Date: 08-Aug-2018 / Published Date: 13-Aug-2018 DOI: 10.4172/2155-6199.1000450
Keywords: Bioremediation; Flower farms; Pesticides; Xenobiotics
Introduction
Interest in the microbial biodegradation of pollutants has intensified in recent years as humanity strives to find sustainable ways to clean up contaminated environments [1]. These bioremediation and biotransformation methods endeavor to harness the astonishing, naturally occurring ability of microorganisms to degrade, transform or accumulate a huge range of compounds including hydrocarbons (e.g., oil), polychlorinated biphenyls (PCBs), polyaromatic hydrocarbons (PAHs), heterocyclic compounds (such as pyridine or quinoline), pharmaceutical substances, radionuclides and metals [2]. Major methodological breakthroughs in recent years have enabled detailed genomic, metagenomic, proteomic, bioinformatics and other highthroughput analyses of environmentally relevant microorganisms providing unprecedented insights into key biodegradative pathways and the ability of organisms to adapt to changing environmental conditions [3]. In the field of Environmental microbiology, genomebased global studies open a new era providing unprecedented in silico views of metabolic and regulatory networks, as well as clues to the evolution of degradation pathways and to the molecular adaptation strategies to changing environmental conditions [4]. Functional genomic and metagenomic approaches are increasing our understanding of the relative importance of different pathways and regulatory networks to carbon flux in particular environments and for particular compounds and they will certainly accelerate the development of bioremediation technologies and biotransformation processes using several microbes [5,6].
Materials and Methods
Sampling site
Lake Naivasha is a freshwater lake in Kenya, outside the town of Naivasha in the Great Rift Valley. The lake geographical coordinates are 0°46’6.70”S 36°21’2.32”E. The most significant activity in Lake Naivasha, albeit for large scale farmers, is the extensive irrigated greenhouse floriculture and horticulture industry. Livestock ranching and private game sanctuaries and conservation areas also exist in the catchment [7].
Sample collection
Soil samples were collected from randomly selected five greenhouses from each five flower farms namely Crescent flower farm, Elsamere flower farm, Karuturi flower farm, Malewa flower farm and Sewage flower farm around Lake Naivasha basin. Systemic random sampling method was used to collect the samples. Four sampling points for each greenhouse within the farms were randomly selected i.e., two points within the greenhouses and two water drainage points around the greenhouses. A soil core was dug using hoe and scooped using a spade down to the depth of 5-10 cm (for assessment of adsorption depth) from the four different locations from each greenhouse and approximately 200 g of the scooped core taken. The cores from each greenhouse were thoroughly mixed to give a composite sample of 100 g.
Isolation and characterization of bacterial species
5 mg of the flower farm soil samples was dissolved in 10 ml of distilled deionized water and the mixture then inoculated with nutrient growth media. For isolation of P. aeruginosa , 20 ml of glycerol and 10 g of Tryptone was mixed with MSM media and dissolved in 1000 mL distilled water. A loopful of the resulting bacterial suspension was streaked onto asparagine plates containing 1.5% agar. About 1 g of phosphorus was also added to promote pyocyanin production which is unique to Pseudomonas aeruginosa and was noted as a blue-green water soluble pigment that imparts a greenish color into the media. E. coli and B. subtilis were isolated by inoculating soil samples with LB growth media mixed with 10 g Tryptone, 5 g yeast extract and 10 g NaCl suspended in 1 Lt of distilled water of while R. erythropolis was isolated by inoculating soil samples with MSM nutrient media. Two subculturing was done by adding 1-chloorobutane as carbon source. The samples were incubated for 48 hrs at 37°C with vigorous shaking at 200 rpm to provide aeration for the bacteria. The bacteria were then transferred to fresh asparagine plates. Small amount of Dapsome fungicide was added to inhibit the growth of fungi.
Identification tests of isolated bacterial species
Identification of pesticide-tolerant bacteria isolated from flower farm soil samples was based on morphological, physiological and biochemical characterization according to Bergey’s Manual of Systematic Bacteriology [8] with some modifications. After 24 hours of incubation, plates were studied for the colonies of microbes grown on the media. Microorganisms grown on MacConkey agar are capable of metabolizing lactose which produces acid by-products that lower the pH of the media which causes the neutral red indicator to turn red, and if sufficient acid is produced, a zone of precipitated bile develops around the colony [9]. Catalase activity was determined by the presence of bubbles in a 3% H2O2 solution [9,10]. Oxidase activity was analyzed by oxidation of 1% p-aminodimethylaniline oxalate. Motility was determined with an optical microscope using the hanging-drop technique. Starch hydrolysis was analyzed as described by Cowan and Steel’s Manual for the identification of medical bacteria [10].
Physico-Chemical parameters of farm soil samples
Physical and chemical parameters in soil samples are determined as an indication if the environmental conditions in the soil samples are favorable for bioremediation of xenobiotic pesticide residues. The physico-chemical parameters determined were temperature (°C) of the farm soil samples, Biological Oxygen Demand (BOD), Chemical Oxygen Demand (COD), Dissolved O2, inorganic ions (PO43-, NO3-, K+, Mg2+) and organic carbon.
Standard chemical reagents
In the preparation of the stock solution, 0.25 g of the organochloride pesticides standards (aldrin, dieldrin and endosulfan) and organophosphate pesticides standards (dimethoate, malathion and parathion) were purchased from Ultra Scientific (Analytical Standards). They were weighed into 250 ml volumetric flasks and dissolved to the mark with methanol to make standard stock solution of 1000 ppm. Serial dilutions were then done to obtain 10 ppm, 20 ppm, 40 ppm, 60 ppm, 80 ppm, and 100 ppm. The thirty six (36) standards solutions prepared were then stored in refrigerator at 4°C.
Extraction of pesticide residues from farm soil samples
The soil samples were extracted in triplicate using a soil-packed bulb column. 5 g of each sample was weighed into a glass jar, and fortified at this step, before adding 10 g of granular anhydrated sodium sulfate (Na2SO4) to absorb moisture. The sample mixtures were manually shaken for 30 seconds, placed on a roller for 30 seconds, and then allowed to stand for 20 minutes to provide time for the sodium sulfate to adsorb any residual moisture from the soil. The sample mixtures were then transferred to a 250 ml bulb column and the sample jar was triple rinsed with small amounts of 5 ml of hexane and transferred to the bulb column. The soil content was extracted with acetone: hexane (1:1 v/v, 250 ml) and the eluate collected and concentrated to 100 ml using a rotary evaporator. The concentrated soil eluate was washed by liquid-liquid partitioning with saturated sodium sulfate (25 ml) and distilled water (300 ml) in a separator funnel (500 ml). After shaking, the aqueous layer was drained into a beaker and the non-aqueous hexane was transferred to a separator funnel (250 ml). The aqueous layer was returned to the 500 ml separator funnel and re-extracted with 15% dichloromethane in hexane (40 ml). The organic layer was combined in the 250 ml separator funnel and gently washed with distilled water (100 ml) for about 30 seconds. After discarding the aqueous layer, the organic layer was filtered through sodium sulfate, evaporated to near dryness on a rotary evaporator, then the sides of the flask rinsed with hexane (20 ml), and evaporated to about 1 ml. The extraction procedure was done in triplicates for each of the greenhouse soil samples. The sample extract was quantitatively transferred to a centrifuge tube, concentrated on a nitrogen evaporator to 0.5 ml and made ready for silica clean up step.
Clean-up of soil extracts
The silica gel clean-up process for the soil extracts were carried out by the methods described by Frimpong et al. [11]. 1 g of silica gel that was previously activated at 110°C for 8 hours was carefully packed into 10 ml polypropylene cartridge column and 5 ml acetonitrile solution was used to condition the cartridge. The concentrated extracts were then loaded onto the column and 50 ml pear shaped flask was placed under the column to collect the eluate. 10 ml acetonitrile was then used to eluate the column and the total filtrate collected, concentrated to dryness using rotary evaporator set at 37°C. The residues were redissolved in 1 ml methanol and diluted to 2.0 ml final volume in hexane prior to High Performance Liquid Chromatography (HPLC) analysis.
Identification and quantification of pesticide extracts
Qualitative analysis was carried out in a two-step process of targeted analysis and general unknown screening. In a first step, targeted analysis for the pesticide standards was carried out for three organochlorides pesticides i.e., aldrin, dieldrin and endosulfan; and three organophosphate pesticides i.e., dimethoate, malathion and parathion. In a second step, farm soil pesticide extracts were injected into the HPLC and the chromatogram peaks of the samples compared to pesticide standard chromatogram peaks. Retention time, isotopic pattern match, fragment search, and library search were used as confirmation criteria for targeted search. In quantitative analysis, known concentration of each pesticide standard was prepared by serial dilution to obtain the final concentration of 1 ppm. Thereafter 20 μL of each pesticide standard was injected into HPLC and the absorbance measured. The measurements were then used to calibrate the HPLC instrument so that the concentration of the soil samples could be read directly from the HPLC instrument. This gave the concentration of the pesticide residues in each soil samples analyzed. 20 μL of each pesticide extracts were then injected into HPLC and the absorbance measured. The measurements were done in triplicates for each greenhouse soil samples. The average concentration of each pesticide residues in each green house was then tabulated and thereafter the mean concentration of each pesticide residues on every flower farm calculated.
Determination of bioremediation of pesticide residues by bacterial species
Stock culture of each bacterial isolate was grown in nutrient medium for 48 hours to mid-log phase of growth. Each pesticide was added to pre-sterilized 100 ml Erlenmeyer flask at the concentration of 50 μg/ml in acetone. After evaporation of acetone, 50 ml of MSM were placed in 100 ml Erlenmeyer flasks and the flasks were shaken for two hours. The medium was inoculated with a suspension of the cells of P. aeruginosa, E. coli, R. erythropolis , and B. subtilis grown on nutrient media for 48 hours. Bioremediation of pesticide residues in the soil was conducted in unsterilized soil in order to study the interaction of these bacterial species with organic amendments, with the endogenous microbial community on the biodegradation of soil applied with xenobiotic pesticides as it happens in the field. Six sets of five soil subsamples were each inoculated with isolated bacterial species. The fifth subsample was not inoculated to serve as control. Each sample was spiked with different pesticide standard. The sixth sample was spiked with all the pesticide standards to serve as mixture sample. All soil samples were incubated at 28 ± 2°C and under intermittent shaking to provide aerobic condition. Pesticide residues from incubated and unicubated soil samples were extracted 2 days, 10 days, 15 days and 21 days after incubation periods. Soil samples were extracted and cleaned up according to the method of Krause et al. [12]. They were then shaken mechanically with 50 ml of acetone-water (3:1) for one hour in 500 ml glass stopper bottle. The extract was filtered through a clean pad of cotton, then, 50 ml of filtrate was concentrated by using a rotary evaporator on water bath at 40°C to remove acetone and then extracted twice with 50 ml chloroform. The combined chloroform extract was dried using anhydrous sodium sulfate and then evaporated to dryness at 40°C using a rotary evaporator prior to HPLC determination of qualitative and quantitative analysis of bioremediation products.
Statistical analysis
Biodegradation of pesticide residues by bacterial species was assessed by comparing differences in pesticide residue concentration between treatments, each consisting of 3 replicates. All data were analyzed by analyses of variance (ANOVA), using SPSS 16.0 statistical software (SPSS Inc., USA) and Statistical Analysis System (SAS) version 9.4. Pairwise comparisons of means were used to compute Fisher’s least significant difference values (LSD, P=0.05).
Results and Discussion
Physicoc-Chemical characteristics of flower farm soil samples
Table 1 summarizes the physico-chemical properties of flower soil samples collected from the various green houses in major flower farms around the lake Naivasha basin.
| Parameters | Crescent | Elsamere | Karuturi | Malewa | Sewage | Range of Means |
|---|---|---|---|---|---|---|
| pH | 6.85a ± 0.51 | 7.27a ± 0.24 | 6.55a ± 0.66 | 6.88a ± 0.82 | 6.37a ± 0.68 | 6.37-7.27 |
| Moisture (%) | 67.25b ± 0.65 | 60.65a ± 1.22 | 63.43a ± 1.25 | 64.88a ± 0.78 | 63.72a ± 0.24 | 60.65-67.25 |
| Alkalinity(meq) | 0.65a ± 0.65 | 0.85c ± 0.45 | 0.78b ± 0.36 | 0.88c ± 0.21 | 0.82c ± 0.64 | 0.65-0.88 |
| D.O2 (μg/g) | 9.45a ± 0.76 | 10.51b ± 0.55 | 11.51c ± 1.21 | 10.24b ± 0.77 | 10.58b ± 0.85 | 9.45-11.51 |
| COD (μg /g) | 244.51a ± 1.75 | 250.55b ± 1.45 | 251.80b ± 0.87 | 252.76b ± 0.76 | 255.21c ± 0.67 | 244.51-255.21 |
| Temp (°C) | 24.55a ± 0.21 | 24.71a ± 0.41 | 24.50a ± 0.15 | 24.83a ± 0.21 | 24.55a ± 0.24 | 24.5-24.8 |
| Cation (meq) | 100.52c ± 1.55 | 90.74a ± 0.75 | 105.55c ± 1.54 | 95.51b ± 0.24 | 102.33c ± 0.54 | 90.74-105.55 |
| Mg2+(μg/g) | 11560.44c ± 1.22 | 11550.41b ± 0.74 | 11440.65a ± 0.85 | 11525.65b ± 0.45 | 11485.66a ± 0.24 | 11440.65-11560.44 |
| K+(μg/g) | 245.55a ± 0.44 | 254.61c ± 0.74 | 251.73b ± 0.25 | 253.65c ± 0.35 | 240.54a ± 0.55 | 240.54-254.61 |
| Organic C (%) | 3.25a ± 0.14 | 3.56c ± 0.16 | 3.13a ± 0.11 | 3.34b ± 0.24 | 3.27a ± 0.28 | 3.13-3.34 |
| NO3-(μg/g) | 1100.54a ± 0.64 | 1130.55b ± 0.24 | 1135.51b ± 0.41 | 1140.22c ± 0.44 | 1138.58b ± 0.31 | 1100.54-1140.22 |
| PO43-(μg/g) | 0.48b ± 0.14 | 0.55c ± 0.22 | 0.51c ± 0.14 | 0.45a ± 0.24 | 0.53c ± 0.33 | 0.45-0.55 |
Table 1: Mean ± SD of Physico-Chemical characteristics of soil samples from five flower farms. Within rows, means and standard deviations with different letters are statistically significant (P ≤ 0.05).
The pH recorded mean range from 6.37 to 7.27 across the green houses in the five flower farms. The mean moisture content recorded for the entire study ranged from 60.65 to 67.25%. The alkalinity content in all the greenhouses in the flower farms ranged from 0.67-0.88 meq. The range of dissolved O2 was 9.45-11.51 μg/g. The average range of COD concentration recorded in the study was 244.51-255.21 μg/g.
Isolation and identification of bacterial species isolated from flower farm soil samples
Bacterial isolates were identified according to their morphological, physiological and biochemical characterization based on Bergey’s Manual of Systematic Bacteriology [8] (Table 2). The four bacterial species identified were Pseudomonas aeruginosa, Escherichia coli, Rhodococcus erythropolis and Bacillus subtilis.
| SS | Shape | MT | Cap | Sp | CT | IN | OX | GS | Bacterial species Identified | BBL Crystal (% Confidence) |
|---|---|---|---|---|---|---|---|---|---|---|
| BS1 | Rods | + | - | - | + | + | + | - | P. aeruginosa | 99.3 |
| BS2 | Rods | + | - | - | + | + | - | - | E. coli | 90.5 |
| BS3 | Rods | + | - | + | + | + | + | + | R. erythropolis | 94.8 |
| BS4 | Rods | + | + | + | + | - | + | + | B. subtilis | 95.2 |
Table 2: Morphological and biochemical characteristics of bacterial species isolated from flower farm soil samples. SS=Sample species; MT=Motility; Cap=Capsulation; Sp=Spore formation; CT=Citrate test; IN=Indole test; OX=Oxidase test; GS=Gram staining. +=Positive reaction; -=Negative reaction.
Identification and quantification of pesticide residues
Qualitative analysis of soil sample extracts identified organochloride aldrin, dieldrin, endosulfan and organophosphate dimethoate, malathion and parathion. The detection level of all the residues showed strong positive Pearson correlation coefficient (P<0.05) for all the six targeted pesticide residues in all the five flower farms. The results show that organochloride pesticides aldrin, dieldrin and endosulfan were generally lower in concentration compared to organophosphorus pesticide dimethoate, Malathion and Parathion.
The mean concentration of the pesticide residues in all the greenhouses in the five flower farms showed that organophosphate methyl parathion had the highest concentration of at 81.32 ± 5.28 μg/g of the soil samples while organochloride endosulfan recorded the lowest concentration in all the farm soil samples with the lowest concentration of 10.27 ± 2.16 μg/g. The mean concentration of malathion was 67.62 ± 4.99 μg/g; dimethoate had mean concentration of 39.93 ± 3.78 μg/g. Organochloride aldrin recorded mean concentration of 14.72 ± 1.40 μg/g while mean concentration of dieldrin was 11.57 ± 1.83 μg/g. The average concentration of each pesticide residues from each farm was recorded in Figure 1 below.
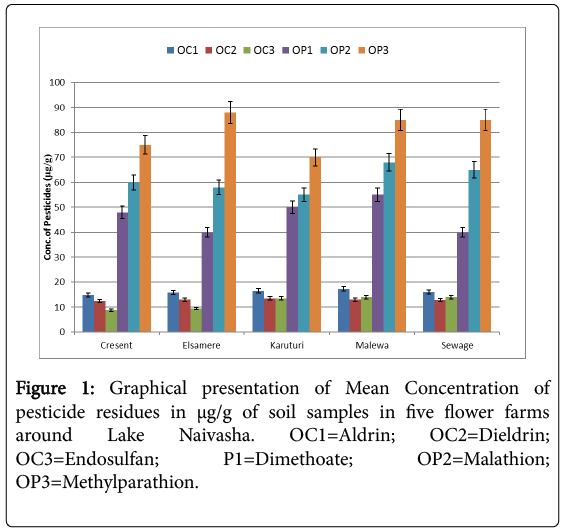
Figure 1: Graphical presentation of Mean Concentration of pesticide residues in μg/g of soil samples in five flower farms around Lake Naivasha. OC1=Aldrin; OC2=Dieldrin; OC3=Endosulfan; P1=Dimethoate; OP2=Malathion; OP3=Methylparathion.
Bioremediation analysis
Analysis for the concentration of pesticide residues remaining after 2 days, 10 days, 15 days and 21 days of incubation showed significant bioremediation of every pesticide by all the bacterial species used in the experiment as shown in Table 3 below and Figures 2a-2f below. The controls were pesticide residues not inoculated by the bacterial species and therefore exposed to only physico-chemical parameters. The highest degradation rate was observed in B. subtilis against dimethoate organophosphate pesticide residues at 66.81% during the 21 days incubation period while the lowest biodegradation rate was observed in R. erythropolis against aldrin organochloride pesticide at 40.34%. The biodegradation of dimethoate in B. subtilis therefore recorded the shortest degradation time for 50% of the pesticide (DT50) of 15.81 days as compared to physical degradation of dimethoate that had DT50 of 84.24 days under in vitro experimental setup.
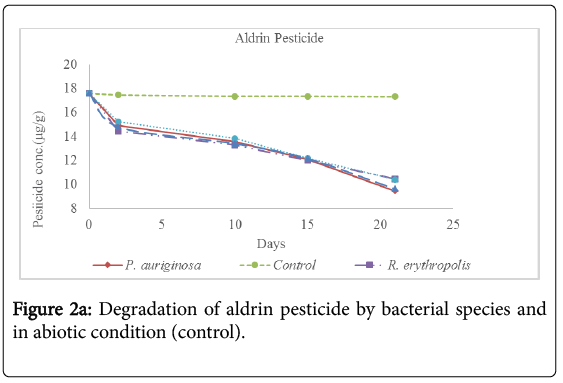
Figure 2a: Degradation of aldrin pesticide by bacterial species and in abiotic condition (control).
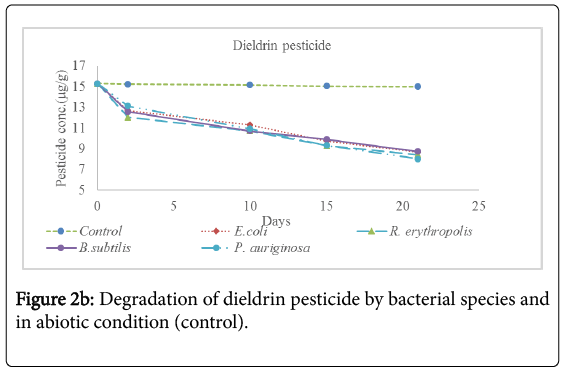
Figure 2b: Degradation of dieldrin pesticide by bacterial species and in abiotic condition (control).
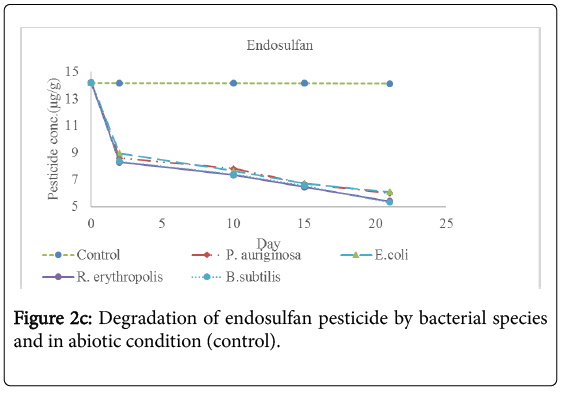
Figure 2c: Degradation of endosulfan pesticide by bacterial species and in abiotic condition (control).
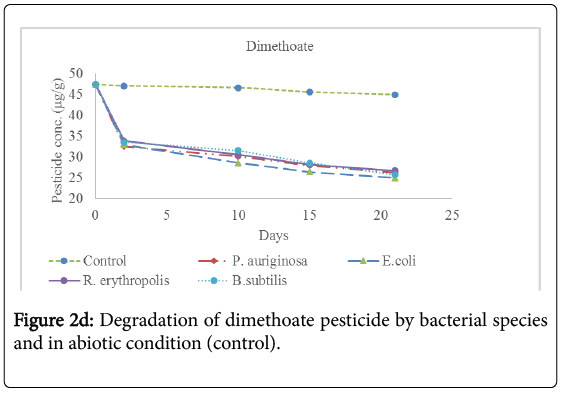
Figure 2d: Degradation of dimethoate pesticide by bacterial species and in abiotic condition (control).
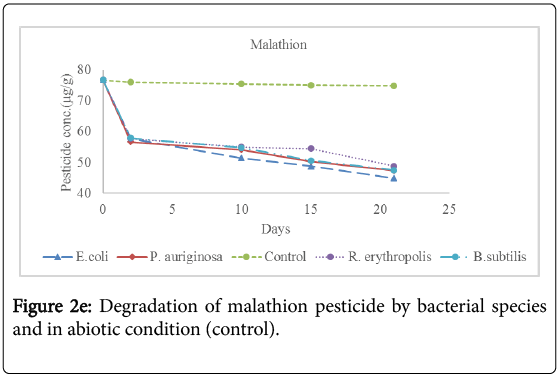
Figure 2e: Degradation of malathion pesticide by bacterial species and in abiotic condition (control).
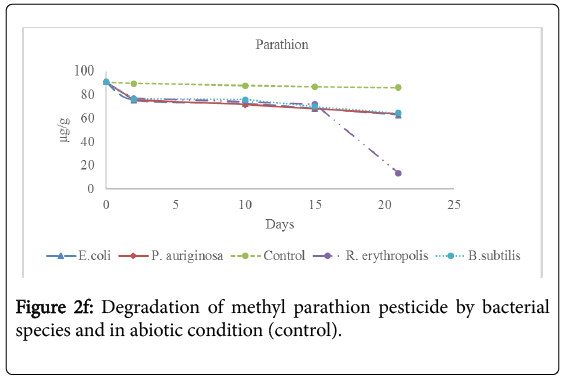
Figure 2f: Degradation of methyl parathion pesticide by bacterial species and in abiotic condition (control).
| Days | OC1 | OC2 | OC3 | OP1 | OP2 | OP3 | |||||||
|---|---|---|---|---|---|---|---|---|---|---|---|---|---|
| Incub | contr | Incub | contr | Incub | contr | Incub | contr | Incub | contr | Incub | contr | ||
| P. aeruginosa | [Init] | 17.6a | 17.6a | 15.3a | 15.3a | 14.2a | 14.2a | 47.4a | 47.4a | 76.8a | 76.8a | 90.6a | 90.6a |
| 2 | 14.9b | 17.5b | 13.1a | 15.3b | 8.6b | 14.2b | 32.5b | 47.0b | 56.7b | 76.1b | 75.4b | 89.6a | |
| 10 | 13.6b | 17.3c | 10.9b | 15.2c | 7.8c | 14.2c | 30.1bc | 46.5c | 54.1b | 75.6c | 71.6bc | 87.6bc | |
| 15 | 12.1c | 17.3c | 9.3bc | 15.1d | 6.7d | 14.1d | 27.9cd | 45.6d | 50.3c | 75.1d | 68.1cd | 86.7c | |
| 21 | 9.5d | 17.3c | 8.0c | 15.0d | 6.0d | 14.1e | 26.3d | 44.9e | 47.3d | 74.9e | 63.7d | 87.3c | |
| %Degrd | 46.19 | 1.65 | 47.52 | 2.02 | 57.68 | 2.74 | 57.24 | 5.37 | 60.01 | 7.74 | 63.91 | 5.15 | |
| E. coli | [Init] | 17.6a | 17.6a | 15.3a | 15.3a | 14.2a | 14.2a | 47.4a | 47.4a | 76.8a | 76.8a | 90.6a | 90.6a |
| 2 | 14.8ab | 17.5b | 12.7b | 15.3b | 9.0b | 14.2b | 32.9b | 47.0b | 57.2b | 76.1b | 75.7b | 89.6a | |
| 10 | 13.4bc | 17.3c | 11.3bc | 15.2c | 7.7c | 14.2c | 28.6c | 46.5c | 51.5bc | 75.6c | 72.4bc | 87.6bc | |
| 15 | 12.2c | 17.3c | 9.8cd | 15.1d | 6.7d | 14.1d | 26.4cd | 45.6d | 48.8cd | 75.1d | 68.5c | 86.7c | |
| 21 | 9.7d | 17.3c | 8.7d | 15.0d | 6.1d | 14.1e | 24.9d | 44.9e | 44.9d | 74.9e | 62.8d | 87.3c | |
| %Degrd | 45.06 | 1.65 | 43.33 | 2.02 | 56.97 | 2.72 | 66.41 | 5.37 | 59.81 | 7.74 | 63.76 | 5.15 | |
| R. erythropolis | [Init] | 17.6a | 17.6a | 15.3a | 15.3a | 14.2a | 14.2a | 47.4a | 47.4a | 76.8a | 76.8a | 90.6a | 90.6a |
| 2 | 14.4b | 17.5b | 12.0b | 15.3b | 8.3b | 14.2b | 33.8b | 47.0b | 57.8b | 76.1b | 76.8b | 89.6a | |
| 10 | 13.3c | 17.3c | 10.7c | 15.2c | 7.4c | 14.2c | 30.5c | 46.5c | 55.1bc | 75.6c | 74.2bc | 87.6bc | |
| 15 | 12.0d | 17.3c | 9.3d | 15.1d | 6.5d | 14.1d | 28.2d | 45.6d | 52.2c | 75.1d | 71.8c | 86.7c | |
| 21 | 10.5e | 17.3c | 8.4e | 15.0d | 5.4e | 14.1e | 26.2d | 44.9e | 48.8d | 74.9e | 67.9d | 87.3c | |
| %Degrd | 40.34 | 1.65 | 44.91 | 2.02 | 61.91 | 2.74 | 64.75 | 5.73 | 62.54 | 7.74 | 63.08 | 5.15 | |
| B. subtilis | [Init] | 17.6a | 17.6a | 15.3a | 15.3a | 14.2a | 14.2a | 47.4a | 47.4a | 76.8a | 76.8a | 90.6a | 90.6a |
| 2 | 15.0ab | 17.5b | 12.6b | 15.3b | 8.4b | 14.2b | 33.5b | 47.0b | 57.9b | 76.1b | 76.3b | 89.6a | |
| 10 | 13.8bc | 17.3c | 10.7b | 15.2c | 7.4c | 14.2c | 31.5c | 46.5c | 54.8bc | 75.6c | 73.4bc | 87.6bc | |
| 15 | 12.2cd | 17.3c | 9.9c | 15.1d | 6.6d | 14.1d | 28.5d | 45.6d | 50.6cd | 75.1d | 69.9c | 86.7c | |
| 21 | 10.4d | 17.3c | 8.7d | 15.0d | 5.3e | 14.1e | 15.7e | 44.9e | 47.6d | 74.9e | 64.4d | 87.3c | |
Table 3: Mean concentration (μg/g) of pesticide residues in the soil samples before incubation (Initial concentration) and the concentration remaining in the soil during incubation period with bacterial spps in MM media at 15°C. The values in red correspond to the concentration remaining in natural soil under physical degradation (control). Means on the column with different superscripts are significantly different for each bacterial species. OC1=Aldrin; OC2=Dieldrin; OC3=Endosulfan; OP1=Dimethoate; OP2=Malathion; OP3=Parathion [Init]=Initial concentration of pesticide residues before incubation with bacterial species. %Degrd=Degradation of pesticide residues in percentage (%).
Physical degradation rate was very slow compared to biodegradation rate. For example, the biodegradation of aldrin organochloride in R. erythropolis consortium which was the lowest bioremediation rate and longest DT50 of 25.66 days was still comparatively shorter than the physical degradation rate of aldrin with DT50 of 1308 days. The DT50 for malathion organophosphate in physical condition was the shortest at 135.56 days while aldrin organochloride had the longest DT50 value at 610.75 days. Organophosphate pesticides had shorter DT50 values in both physical and biological conditions as compared to organochloride pesticides. This confirms that organochloride compounds have stronger C-Cl bonds that are more resistant to physical and biological degradation processes.
Conclusion
Utilization of xenobiotic compounds by soil microorganisms is a crucial phenomenon by which these compounds are removed from the environment, thus preventing environmental pollution. The results of the present study suggest that the bacteria species used in this study was able to degrade xenobiotics at a relatively faster rate as compared to physico-chemical degradation that takes longer period of time and therefore leading to accumulation of these chemicals in the soil. Use of microorganisms is therefore the best method for bioremediating pesticide-contaminated soil.
Acknowledgment
Lecturers and staff of Institute of Biotechnology and Research (IBR) at Jomo Kenyatta University of Agriculture and Technology, Kenya for their support and professional advice. Management and staff of Hamelmalo Agricultural College (HAC), Eritrea for their support and provision of laboratory equipment and reagents.
References
- Jamaluddin H, Zaki DM, Ibrahim Z (2012) Isolation of metal tolerant bacteria from polluted wastewater. Pertanika J Trop Agric Sci 35: 647-662.
- Strong PJ, Burgess JE (2008) Treatment methods for wine-related and distillery wastewaters: A review. Bioremediation Journal 12: 70-87.
- Malhat F, Nasr I (2013) Monitoring of Organophosphorus pesticides residues in water from the Nile River Tributaries, Egypt. Am J Water Resour 1: 1-4.
- Syoku AN (2006) Method as specified by Multi-residue method for agricultural chemicals by GC/MS. As released by the Department of Food Safety, Ministry of Health, Labour and Welfare, Japan.
- Ang EL, Zhao HM, Obbard JP (2005) Recent advances in the bioremediation of persistent organic pollutants via molecular engineering. Enz Microb Technol 37: 487-496.
- Dankyi E, Gordon C, Carboo D, Fomsgaard IS (2014) Quantification of neonicotinoid insecticide residues in soils from cocoa plantations using a QuECh‑ERS extraction procedure and LC-MS/MS. Sci Total Environ 499: 276-283.
- Ohayo-Mitoko GJA, Kromhout H, Simwa JM, Boleij JSM, Heederik D (2000) Self-Reported Symptoms and Inhibition of Acetylcholinesterase Activity among Kenyan Agricultural Workers. Occupational and Environmental Medicine 57: 195-200.
- Krieg NR, Holt JG (1984) Bergey’s manual of systematic bacteriology. Williams & Wilkins, USA, p: 943.
- Granados PR, Villaverde PC (1996) Microbiología. Bacteriología: características y clasificación bacteriana. Paraninfo, Barcelona. España, p: 298.
- Jilani S, Khan MA (2004) Isolation, characterization and growth response of pesticides degrading bacteria. Journal of Biological Sciences 4: 15-20.
- Frimpong KS, Gbeddy G, Doyi I, Arye-Quaye F, Kokroko W, et al. (2013) Efficient method development for atrazine determination in soil samples. An Indian J Environ Sci 8: 264-267.
- Yang L (2007) Solid Phase Extraction-HPLC. Determination of Atrazine in Drinking Water. Chemical Measure and Analysis 16: 53.
Citation: Anode SO, Magoma G, Onguso J, Abraha T (2018) Bioremediation of Xenobiotic Pesticides by Bacterial Species Isolated from Flower Farm Soil around Lake Naivasha, Kenya. J Bioremediat Biodegrad 9: 450. DOI: 10.4172/2155-6199.1000450
Copyright: © 2018 Anode SO, et al. This is an open-access article distributed under the terms of the Creative Commons Attribution License, which permits unrestricted use, distribution, and reproduction in any medium, provided the original author and source are credited.
Share This Article
Open Access Journals
Article Tools
Article Usage
- Total views: 3222
- [From(publication date): 0-2018 - Apr 24, 2024]
- Breakdown by view type
- HTML page views: 2564
- PDF downloads: 658