Model for Rainfall and Malaria Cases in Yilmana Densa District, North West Ethiopia
Received: 02-Aug-2016 / Accepted Date: 09-Sep-2016 / Published Date: 16-Sep-2016 DOI: 10.4172/2161-1165.1000262
Abstract
Background: Malaria is the major public health problem in Ethiopia. Rain fall amount and distribution have impact for malaria transmission. Objective: To assess the relationship between positive malaria cases and Rainfall within ten year’s periodic trends of malaria transmission. Method: Retrospective study design was conducted by using ten years monthly rainfall and positive malaria cases. Simple linear regression, correlation were applied to analyze association. SPSS version 16.0 was used for analysis. Result: A slight variation of malaria transmission was observed in the last ten years and the transmission was non periodic. Among Plasmodium species, P. falciparum was highly prevalent. From spearman correlation analysis monthly minimum rainfall (p=0.022) at one month lag was significantly correlated with total positive malaria cases. Simple linear regression analysis suggested that monthly rainfall (p=0.001) at one month lag was significant meteorological factor. Multiple linear regressions analysis also showed that, rainfall had significantly (p<0.001) correlated at the same time with positive malaria cases by stepwise regression. Conclusion: From this finding, malaria transmission was not seasonal. Rainfall has association with malaria cases and may effect on the same or next month malaria cases occurrence. Rainfall seems best malaria predictor, since strongly correlated with malaria cases.
Keywords: Rain; Relationship; Malaria
Abbreviations
PF: Plasmodium falciparum; PV: Plasmodium vivax
Background
Malaria is one of the major public health challenges undermining development in the developing countries with 300-500 million annual clinical cases and kills up to 3 million people annually of which 90% of the cases and deaths occur in Africa [1].
In Ethiopia, based on Federal ministry of health report, malaria is the first cause of morbidity and mortality accounting for 15.5% outpatient consultations, 20.4% admissions and 27% inpatient deaths. In the study area (Yilmana Densa district) there is high incidence rate of malaria transmission. Such as 1994, 3100 examined 1050 were positive with 686 (65.3%) P. falciparum and 364 (34.7%) vivax . In 1995, 10518 examined 4955 were positive with 3985 (80.4%) P. falciparum and 970 (19.6%) vivax.
In 1996, 8063 examined 5612 were positive with 4032 P. falciparum , 1577 P. vivax and 3 mixed. In 1997, 7755 examined 4448 were positive with 2802 P. falciparum , 1567 P. vivax and 79 mixed. In 1998, 11987 examined 6786 were positive with 5075 P. falciparum, 1542 P. vivax and 169 mixed. In 1999, 9305 examined 3551 were positive with 2177 P. falciparum , 1300 P. vivax and 74 mixed.
In 2000, 3215 examined 119 were positive with 37 P. falciparum , 81 P. vivax and 1 mixed. In 2001, 11216 examined 8612 were positive with 5213 P. falciparum , 2380 P. vivax and 19 mixed. In 2002, 5235 examined 3928 were positive with 2996 P. falciparum , 902 P. vivax and 30 mixed. Generally the proportion of malaria in this district was 18.5 [2].
The purpose of this study is to undertake a statistical analysis for identifying the influence of rainfall for malaria transmission. Due to sever health problems of malaria, there is still a growing need for methods that will help to understand the influencing factors, allow forecasting, early warning so that for the implementation of more control methods.
Objective
To identify the association between positive malaria cases and rain fall.
Methods
Ethical consideration
Ethical clearance was obtained from Bahir Dar University and submitted to meteorology agency/office which is found in Bahir Dar city and Yilmana Densa district health office for receiving permission during data collection.
Annual variation of total positive malaria cases in Yilmana Densa district, 2001-2010
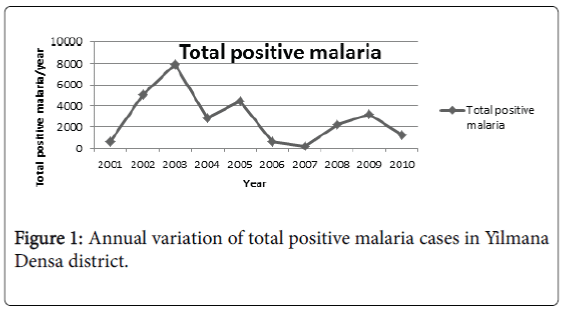
From 2001 to 2010 ten years time series analysis, a total of 71,590 microscopically and RDT examined malaria cases with 39,257 positive for Plasmodium species of which 27649 (71% Plasmodium falciparum ), 11079 (28% Plasmodium vivax ) and 529 (1% mixed) were reported in the study area. No other malaria species were observed rather than P. falciparum and P. vivax . The annual variation of total positive malaria cases was not statistically significant (F=1.21, P=0.303) by using ANOVA (Figure 1).
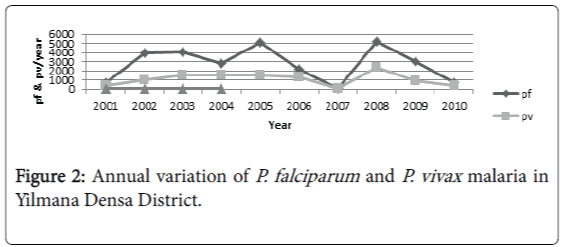
Annually, there was insignificance variation of Plasmodium falciparum (F=0.125, P=0.733) and Plasmodium vivax (F=0.004, P=0.950) malaria. However, the prevalence of P. falciparum was higher than P. vivax all of the last ten years (Figure 2).
Annual variation of rainfall in Yilmana Densa district, 2001-2010
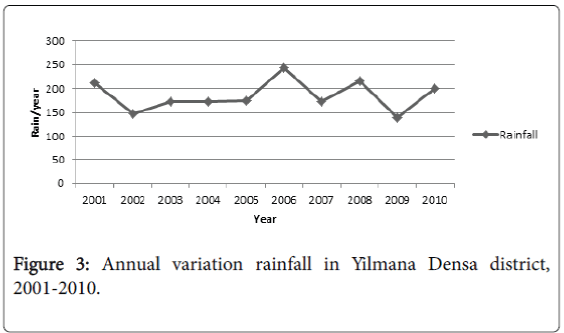
Change of rainfall through the years 2001 to 2010 with 1576.8 mm maximum rainfall in 2006 and minimum annual rainfallwas 905.8 mm in 2009 was observed but the annual variation of rainfall was not significant (F=3.02, P=0.12) by using one way ANOVA (Figure 3).
Simple linear regression between independent and dependent variables, Ylmana Densa district, 2001-2010
The main goal of regression analysis is to predict or estimate malaria cases occurrence associated with rainfall variable. It is usually desirable to express their relationship by finding an appropriate mathematical equation. To form the equation, monthly rainfall used as independent variables and malaria cases and positive malaria used as dependent variables. Let the observations be denoted by (R1, M1), (R2, M2), (R3, M3) . . . (Rn, Mn).
R………..rain
M……….malaria cases and positive malaria
N………..number of months (1-120).
Let us see the associated equation between malaria cases and rainfall. After mathematical adjustment, it becomes; positive malaria cases predicted by rainfall (Pm)=240.59-0.062 rainfall (R) i.e.
Pm=240.59-0.062R…………………………... (1)
At the same month and one month delay simple linear regression analysis was done and the result showed that at the same month rainfall, mean rainfall were negatively correlated with total malaria cases. At one month delay, monthly rainfall (P=0.001) was statistically significant meteorological factor with monthly total malaria cases (Table 1).
| Variables | Month | Beta | R-square | F | P-value |
|---|---|---|---|---|---|
| Rain | 0 | -0.062 | 0.001 | 0.091 | 0.763 |
| 1 | 0.168 | 0.006 | 0.68 | 0.001 | |
| Mean Rain | 0 | -0.02 | 0.012 | 0.1 | 0.76 |
| 1 | 0.038 | 0.016 | 0.386 | 0.552 |
Table 1: Simple linear regression between monthly rainfall and monthly total positive malaria cases in Yilmana Densa district, 2001-2010.
Spearman correlation analysis between independent (meteorological) and dependent (positive malaria) variables, Ylmana Densa district, 2001-2010
Spearman correlation analysis used to observe the strength of association between malaria cases and climatic variables and showed at the same month effect that, average rainfall (P=0.048) had statistical significantly positively related with P. falciparum . Where as maximum rainfall negatively correlated with total positive malaria cases.
One month lag spearman correlation analysis suggested that rainfall (P=0.022 statistically significant positively associated with total malaria cases (Table 2).
| Variables | Month | Total positive malaria | P. vivax | P.falciparum | |||
|---|---|---|---|---|---|---|---|
| rs | p-value | rs | p-value | rs | p-value | ||
| Total Rain | 0 | 0.095 | 0.306 | 0.079 | 0.0394 | 0.102 | 0.271 |
| 1 | 0.782 | 0.022 | 0.376 | 0.359 | 0.796 | 0.018 | |
| MeanRain | 0 | 0.552 | 0.098 | 0.288 | 0.419 | 0.636 | 0.048 |
| 1 | 0.121 | 0.776 | 0.411 | 0.312 | 0.589 | 0.124 | |
Rs- Spearman correlation coefficient, 0 month-the same month effect of rainfall for malaria cases occurrence, 1 month- One month delay effect of rainfall for malaria cases occurrence, Pos. malaria- total positive malaria species,p.falciparum- plasmodium falciparum, p. vivax- plasmodium vivax
Table 2: Spearman correlation between rainfall and Plasmodium species, at zero months and one month delay effect, Yilmana Densa district, 2001-2010.
Discussion
Time series analysis was conducted from 2001 to 2010 and the result showed that Malaria cases were consistently present in Yilmana Densa district and cause for morbidity and mortality; although intensive intervention had been carried out there.
Spearman correlation analysis also showed that maximum rainfall at zero month effect were negatively correlated with total positive malaria cases, this might be due to much rainfall washout the vectors breeding site and affect the life cycle of mosquitoes which was similar to study in Tanzania [2] and Burundi [3]. Minimum rainfall both at the same month and one month lag time had positive association with P. falciparum , P. vivax and total positive malaria cases this was in line with studies in Dehradam India [4], Amazon [5] Kuazukulu, South Africa [6] and Ethiopia, Adama [7] and Jimma [8], since it provides aquatic anopheles vector breeding site and it also provides relative humidity which is essential for mosquitoes survival., but it is opposite to study which was conducted in Botswana [9,10], the reason might be difference in rainfall amount between the two countries.
Mean rainfall had statistically significant (P=0.048) positively correlated at one month lag with P. falciparum and positively correlated both at zero month and one month lag with P. vivax and total malaria cases.
The correlation coefficient for the association between monthly malaria cases and some meteorological factors was greater than other climatic factors. This indicates that one meteorological factor plays greater role in malaria transmission than others such as; in our study the correlation coefficient for the association between monthly rain fall and monthly malaria cases was greater than that of the correlation coefficient for the association between any other measured meteorological variables and monthly malaria cases.
This result suggests that rainfall was the most significant factor that correlated with malaria transmission in the study area than the other variables, since correlation coefficient was greater.
The results of a similar study conducted in Amazon [5], suggested that monthly malaria cases occurrence or incidence is related to change with rainfall. Simple linear regression analysis showed that at the same month rainfall was negatively correlated with total malaria cases, this finding were coincided with study in Burundi [3].
The regression analysis at one month lags effect rainfall was statistically significant P-value of 0.001 with total malaria cases.
Multiple regressions suggested that rainfall, were predictor variables strongly associated with total malaria cases (p<0.001), these meteorological variables happens at the same time might factors for excessive malaria cases occurrence. So, during such condition continuous malaria prevention and control activities like bed net distribution and utilized properly, spraying and treatment should be not forgotten.
Conclusion
From the ten years time series analysis, malaria cases occurrence was not periodic in the study area. Since, malaria cases were found throughout the year.
Other than Plasmodium falciparum and Plasmodium vivax no other Plasmodium species were observed and Plasmodium falciparum were the most dominant malaria species in the study area.
Rainfall has contributed for malaria transmission, since it had strongly correlated with positive malaria cases. The correlation and regression analyses, temperature, rainfall and relative humidity were associated with monthly malaria case occurrence at the same month or one month delay. So, the change in the current month climatic factors may contribute on the same month or the next month malaria transmission.
Rainfall seems malaria predictor variables and may cause for malaria transmission in endemic areas, since associated with malaria cases.
Based on the study finding I recommend the responsible bodies should use rainfall variables to estimate malaria cases occurrence. Uninterrupted malaria prevention and control activities should be done by focusing on areas and months with the highest malaria risk for preventing the disease.
Author’s Contributions
TW-Proposal writing, data collection, analysis, manuscript preparation and write up (all activities of the study were done by him).
Acknowledgement
I like to acknowledge Health Development and Anti-Malaria Association for their financial support.
And also I like to thank regional meteorology bureau and Yilmana Densa district health office and health centers for their cooperation during data collection.
References
- Joel GB, Martin SA, Anne M (2004) Conquering the Intolerable burden of malaria in developing countries. Am J Trop Med Hyg 71: 1-15.
- Lindsay SW, Bodker R, Malima R, Msangeni HA, Kisinza W (2000) Effect of 1997/98 El Nino on highland malaria in Tanzania. The Lancet 355: 989-990.
- Nkurunziza H, Gebhardt A (2010) Bayesian modelling of the effect of climate on malaria in Burundi, Malar J9:114.
- Devi NP, Jauhari RK (2006) Climatic variables and malaria incidence in Dehradun, Uttaranchal, India. J Vector Borne Dis 43: 21-28.
- Olson SH, Gangnon R, Elguero E, Durieux L, Foley JA, et al. (2009) Links between climate and malaria in the Amazon Basin. Emerge Infect Dis 15: 659-662.
- Person I, Teklehaimanot A(2009) A Temporal-spatial Analysis of Malaria transmission in Adama, Ethiopia. Am J Trop Med Hyg 81: 944-949.
- Alemu A, Abebe G, Tsegaye W, Golassa L (2011) Climatic variables and malaria transmission dynamics in Jimma town,South West Ethiopia. Parasites Vectors 4: 30.
- (2008) Spatio/temporal analysis of climate variability and malaria incidence in Botswana.
- Kleinschmidt (2000)Use of Generalized Linear Mixed Models in the Spatial Analysis of Small-Area Malaria Incidence Rates in KwaZulu Natal, South Africa. Am J Epidemiol 153: 1213-1221.
Citation: Brhanie TW (2016) Model for Rainfall and Malaria Cases in Yilmana Densa District, North West Ethiopia. Epidemiology (Sunnyvale) 6:262. Doi: 10.4172/2161-1165.1000262
Copyright: © 2016 Brhanie TW. This is an open-access article distributed under the terms of the Creative Commons Attribution License, which permits unrestricted use, distribution, and reproduction in any medium, provided the original author and source are credited.
Share This Article
Open Access Journals
Article Tools
Article Usage
- Total views: 11581
- [From(publication date): 10-2016 - Apr 26, 2024]
- Breakdown by view type
- HTML page views: 10794
- PDF downloads: 787


