

Abstract
The origin of soluble CD14 (sCD14) in the circulation is uncertain. To examine whether CD14 could be an acute-phase protein (APP), the levels of sCD14, IL-6, and C-reactive protein were determined by ELISA in serum and synovial fluid (SF) of patients with various arthropathies, and the regulation of CD14 synthesis was examined in liver cells. In patients with crystal-mediated or immunologically mediated arthritis (rheumatoid arthritis), serum levels of sCD14 were higher than or similar to those found in infection-mediated arthritis (reactive arthritis), precluding a relation with bacteria exposure. Levels of sCD14 were similar in SF and serum, and did not correlate with the number of SF leukocytes, excluding an important source from leukocyte membrane-bound CD14, by protease-mediated shedding. In contrast, serum levels of sCD14 in patients correlated with those of C-reactive protein, a classical APP, and IL-6, a cytokine known to regulate the synthesis of APP in the liver. Serum levels of sCD14 also correlated with disease activity in rheumatoid arthritis and reactive arthritis patients. IL-6 stimulated the production of CD14 by HepG2 hepatoma cells. By real-time PCR, the inducibility of CD14 by IL-6 was also observed at the mRNA level both in HepG2 cells and human primary hepatocytes. These in vitro results were confirmed by in vivo studies in IL-6−/− mice injected with turpentine, an experimental model of acute-phase response. Liver levels of CD14 mRNA increased in IL-6+/+, but not in IL-6−/− mice. These results indicate that sCD14 can be considered as a type 2 APP.
CD14 is a GPI-anchored protein constitutively expressed on the surface of various cells, including monocytes, macrophages, polymorphonuclear neutrophils, chondrocytes (1), B cells (2), dendritic cells (3), gingival fibroblasts (4), keratinocytes (5), and human intestinal epithelial cell lines (6). Aside from this membrane-bound (mCD14)3 state, CD14 is also found in a circulating soluble (sCD14) state (7, 8, 9, 10). The exact role of CD14 in physiological and pathological situations is not well defined. CD14 was initially described as a specific receptor for LPS, a compound from the outer cell wall of Gram-negative bacteria (11). At the monocyte surface, the LPS receptor mCD14 and the LPS-binding protein (LBP) (known to be an acute-phase reactant) interact with LPS and form a high affinity trimolecular complex that allows monocytes to detect the presence of LPS (12). In contrast, two opposite functions have been described for sCD14. It can either reduce endotoxin-induced activities by competing with mCD14 for LPS binding (13, 14, 15, 16) or mediates the LPS-induced activation of non-CD14-expressing endothelial, epithelial, and smooth-muscle cells (17, 18, 19, 20, 21). It is also known that besides binding LPS, CD14 may function as a receptor for peptidoglycan, the major cell wall component of Gram-positive bacteria (22), other microbial products with similar structural features (23), human heat shock protein 60 (24), and other ligands (ceramide, anionic phospholipids, modified lipoproteins, opsonized particles) (25).
Interestingly, sCD14 level in the serum of normal adult human represents a ∼1000-fold molar excess of the LPS level seen in fatal septic shock patients (26), and exceeds by 1 or 2 logs that of the cell membrane-bound receptor (27), suggesting that sCD14 may have other biological functions. Several clinical studies have reported significantly elevated serum levels of sCD14 in inflammatory conditions, such as Kawasaki disease (28), atopic dermatitis (29), liver disease (30), rheumatoid arthritis (RA) (31, 32), systemic lupus erythematosus, and primary Sjögren’s syndrome (33). Correlations between levels of sCD14 and disease activity in systemic lupus erythematosus (33, 34) and the severity of the trauma in polytraumatized patients (35) have also been published. Besides its function in LPS signaling, CD14 might therefore play a role in inflammatory diseases by controlling the immune system level of response. It has recently been demonstrated that sCD14 is a regulatory factor capable of modulating cellular and humoral immune responses by interacting directly with T and B cells (27, 36). Moreover, it has been suggested that sCD14 could be an acute-phase protein (APP), because apart from protease-mediated shedding from leukocytes, sCD14 is also produced by hepatocytes (37, 38, 39, 40, 41), which represent the major source of APP (42). However, if CD14 is known to be synthesized in human hepatocytes (40), nothing is known about the humoral mediators that regulate its production. Synthesis of APP in the liver is mainly regulated by IL-6 (43, 44), IL-1β (43, 45), TNF-α (46), and glucocorticoids (dexamethasone) (47, 48).
We have therefore investigated whether increase of sCD14 level is linked to bacteria exposure, and whether sCD14 originates mainly from leukocytes by protease-mediated shedding or behaves as an APP. The levels of sCD14 as well as those of IL-6 and C-reactive protein (CRP), a classical APP, were determined in serum and synovial fluid (SF) from patients with various inflammatory arthropathies, including infection-mediated, immunologically mediated, or crystal-induced arthritis. The levels of sCD14 were elevated in the different inflammatory conditions and correlated with those of CRP and IL-6, but not with the number of leukocytes. To further examine the APP hypothesis, the regulation of CD14 expression and synthesis was studied in HepG2 hepatocellular carcinoma cells and human primary hepatocytes and found to be also inducible by IL-6. The role of inflammation and IL-6 on CD14 expression in the liver was finally confirmed in mice injected with turpentine, an experimental model of acute-phase response. These data provide the first information about the role of IL-6 on the regulation of CD14 expression in liver cells and show that CD14 behaves like a type 2 APP in vivo.
Materials and Methods
Patients
Serum and SF samples from patients with various rheumatic diseases and serum from healthy blood donors have been kept for various times at −70°C. Diagnosis was taken from the chart at the time of collection. The patients were divided into the five following groups: 1) RA diagnosed according to the revised criteria formulated by the American College of Rheumatology (49) (n = 29): age median, 58 years; interquartile range (IQR), 44–78. 2) Reactive arthritis (ReA) (n = 38): asymmetrical mono/oligoarthritis; 33 patients had urethritis and 5 patients had diarrhea and negative culture; age median, 33 years; IQR, 25–47. 3) Crystal-induced arthritis (n = 27): age median, 77 years; IQR, 64–85. 4) Osteoarthritis (n = 13): age median, 69 years; IQR, 62–78. 5) Septic arthritis (n = 5): due to Staphylococcus epidermidis, Staphylococcus aureus, and Streptococcus β hemolytic; age median, 63 years; IQR, 47–80. A group of 58 healthy blood donors was used as controls: age median, 31 years; IQR, 25–36.
RA patients treated with TNF-α inhibitors
Seventeen patients with active RA despite treatment with classical disease-modifying drugs received TNF-α inhibitors (age median, 55 years; IQR, 40–63; 53% of female patients; 11 received infliximab (Remicade), 3 mg/kg i.v. at times 0, 2, 6 wk, and every 8 wk (median time of treatment, 14 wk; IQR, 9–26), and 6 had received etanercept (Enbrel), 25 mg s.c. twice per week (median time of treatment, 12 wk; IQR, 8–18). The disease activity score (DAS) (50) was determined before and after treatment for assessment of disease activity. Serum samples were taken before and after treatment and used to measure serum levels of CRP and sCD14.
Determination of IL-6, CRP, and sCD14 concentrations in serum and SF samples
All levels were determined by commercially available ELISA kits, according to the manufacturer protocols: IL-6 and sCD14 Quantikine from R&D Systems GmbH (Wiesbaden-Nordenstadt, Germany), and CRP from Immundiagnostik AG (Bensheim, Germany). When sufficient amount of serum and SF was available, assays were performed in duplicate, otherwise in monoplicate on serum and SF diluted 1/1.25–1/5000 (IL-6 determination), 1/200–1/500 (sCD14 determination), or 1/1000 (CRP determination). All determinations were performed at the same time. Intra-assay variations indicated by the manufacturers were: 2–4% (for IL-6) and 3–7% (for sCD14 and CRP). The detection limits were: 0.7 pg/ml (for IL-6), 125 pg/ml (for sCD14), and 0.124 ng/ml for CRP. To allow statistical analysis, cytokine concentrations were determined for all obtained ODs, by extrapolating linear standard curves, even when cytokine levels found were below the minimum detectable doses indicated by the manufacturers.
Reagents
Recombinant human IL-1β, IL-6, TNF-α, and soluble IL-6R (sIL-6R) were purchased from R&D Systems; the LPS contamination in each cytokine preparation was <0.1 ng/μg protein, according to the manufacturer. LPS (Escherichia coli 055:B5) was obtained from Difco (Chemie Brunschwig AG, Basel, Switzerland), and dexamethasone was purchased from Sigma-Aldrich (Fluka Chemie GmbH, Buchs, Switzerland).
Cell culture
HepG2 (human hepatoma) cells were obtained from American Type Culture Collection (Manassas, VA). They were cultured in DMEM (Life Technologies, Invitrogen, Karlsruhe, Germany), supplemented with 100 U/ml penicillin, 0.1 mg/ml streptomycin, and heat-inactivated 10% FCS (Life Technologies, Invitrogen). After 72 h, the cells reached confluence, the medium was renewed, and stimulants were added, as described (51). Except for the first experiment, all the subsequent ones were performed under serum-free conditions to prevent the presence of bovine CD14 and LBP. After stimulation for the indicated time periods at 37°C, supernatants were harvested and kept at −70°C until analysis.
Determination of CD14, IL-1 receptor antagonist (IL-1Ra), and fibrinogen concentrations in culture supernatants and cell lysates
All levels were determined by commercially available ELISA kits, according to the manufacturer protocols: IL-1Ra and CD14 Quantikine from R&D Systems, and fibrinogen from Hyphen BioMed (Andresy, France). The recovery of sCD14 spiked to different levels; the linearity and specificity were assessed by the manufacturer in cell culture medium and serum. Assays were performed in monoplicate of culture supernatants or cell lysates (cell-associated CD14) diluted 1/1 (CD14 determination), 1/1–1/10 (IL-1Ra determination), or 1/20–1/100 (fibrinogen determination). Intra-assay variations indicated by the manufacturers were: 5–6% (for CD14) and 3–8% (IL-1Ra and fibrinogen). The detection limits were: 14 pg/ml (for IL-1Ra), 125 pg/ml (for CD14), and 0.5 ng/ml for fibrinogen.
HepG2 RNA isolation and analysis
To quantify steady state levels of CD14 mRNA, HepG2 cells were cultured in six-well plates (4 × 10⁵ cells/4 ml per well) and stimulated for 6 h with indicated stimuli. Total RNA was extracted using RNeasy kit (Qiagen AG, Basel, Switzerland) and treated with RNase-free DNase to remove genomic DNA, according to the manufacturer’s instructions. First-strand cDNA synthesis was performed using 2 μg of total RNA in the presence of random hexamers and the SuperScript II RNase H− reverse transcriptase (RT) (Life Technologies, Invitrogen). Samples were then analyzed by quantitative, real-time RT-PCR, using an ABI 7000 thermal cycler sequence detection system (Applied Biosystems, Rotkreuz, Switzerland). Primers optimized for the ABI 7000 were designed using the Primer Express software package (Applied Biosystems) and purchased from Microsynth (Balgach, Switzerland). The following primers were selected for human CD14, forward, 5′-GCCTTCCGTGTCCCCACTGC-3′ and reverse, 5′-TGAGGGGGCCCTCGACG- 3′; for human cyclophilin, forward, 5′-TACGGGTCCTGGCATCTTGT-3′ and reverse, 5′-CCATTTGTGTTGGGTCCAGC-3′. In preliminary experiments, the optimal concentrations were determined for each set of primers and were found to be 1 μM (final concentration) for human CD14 and 1.5 μM for cyclophilin. An aliquot of 2.5 μl (35 ng) of cDNA, resulting from each RT reaction, or non-RT control (in duplicate) was amplified in 25 μl (total reaction volume) using SYBR PCR Green Master Mix (Applied Biosystems). In each plate, mean sample CD14 mRNA levels were quantified against a standard curve generated from serial dilutions of a HepG2 cDNA stock by plotting log concentrations to the number of cycles required to reach the threshold. The amount of CD14 mRNA was normalized to similarly quantified cyclophilin mRNA levels. The data of two independent analyses for each sample were averaged.
Human hepatocyte RNA isolation and analysis
Human primary hepatocytes were isolated from livers obtained from three organ donors and cultured, as previously described (52). In brief, 106 viable hepatocytes were seeded on 100-ml plates in RPMI 1640 medium supplemented with penicillin, streptomycin, and 0.2% BSA. After 48 h, the cells were cultured in the absence (control) or presence of 10 ng/ml IL-6, 1 ng/ml IL-1β, or a combination of IL-6 and IL-1β for 16 h. Total RNA was purified using 1 ml of TRIzol reagent (Life Technologies, Invitrogen). Results were expressed in terms of fold increase over the mRNA levels of human primary hepatocytes cultured in the absence of cytokine, after normalization against cyclophilin mRNA.
Mouse RNA isolation and analysis
Livers of C57BL/6 IL-6+/+ and IL-6−/− mice injected s.c. with 100 μl of either turpentine or saline in each hind limb were collected at 8 and 48 h (53). Total RNA was extracted from livers and from one spleen immediately after termination of the experiments by adding TRIzol reagent (Life Technologies, Invitrogen). The following primers were selected for mouse CD14, forward, 5′-GGCGCTCCGAGTTGTGACT-3′ and reverse, 5′-TACCTGCTTCAGCCCAGTGA-3′; and cyclophilin, forward, 5′-ATGGCAAATGCTGGACCAA-3′ and reverse, 5′-GCCATCCAGCCATTCAGTCT3′. The optimal concentrations of primers were found to be 1.5 μM for all sets. Levels of CD14 mRNA were calculated by using standard curves generated from serial dilutions of a spleen cDNA stock. Other conditions are the same as described above.
Statistical analysis
Statistical analysis was performed using the SPSS statistical software (SPSS for Macintosh, version 10, Chicago, IL). Kruskal-Wallis and Mann-Whitney tests were used to compare the levels of analytes in the different groups. Comparison between two groups was made only when the Kruskal-Wallis test yielded statistically significant results. Student’s t test was used to compare serum and SF levels of analytes. Value of p < 0.05 was considered significant. Correlations were made with the Spearman rank correlation analysis.
Results
Serum levels of IL-6, CRP, and sCD14 in patients with various rheumatic diseases
To examine whether the serum levels of sCD14 are related to bacteria exposure or to an inflammatory state, the concentrations of sCD14 were determined in the serum of patients with various rheumatic diseases: infection-mediated (ReA), immunologically mediated (RA), or crystal-induced arthritis. The concentrations of sCD14 in serum were significantly higher in all groups of patients than in healthy blood donors. The highest level was found in patients with crystal-induced arthritis, and the lowest level in those with ReA. The difference was highly significant (p < 0.0001) (data not shown). These data therefore provide no evidence of relation between levels of sCD14 in serum and bacteria exposure.
To investigate whether sCD14 could be an APP, the concentrations of IL-6, known to regulate synthesis of APP in the liver, as well as those of CRP, a classical APP, were determined in the same samples. Serum IL-6 and CRP concentrations were significantly higher in all groups of patients than in healthy blood donors (Table I). Serum sCD14 levels correlated significantly with those of IL-6 in RA (Fig. 1,A) and ReA patients (Rho = 0.47, p < 0.005 when the values obtained for all the patients were considered, and Rho = 0.57, p < 0.001 (Fig. 1,B) when one patient who had a very high level of IL-6 (750 pg/ml) was removed to better show the other couple of values). Serum sCD14 levels also correlated significantly with those of CRP in RA (Fig. 1,C), ReA (Fig. 1,D), and crystal-induced arthritis (Fig. 1 E) patients. These correlations showing a relation between sCD14 levels and inflammatory state, observed in the three group of patients independently of the cause of arthritis, provide some evidence in favor of sCD14 being an APP.
Levels of IL-6, CRP, and sCD14 in the serum of patients with various rheumatic diseases and healthy blood donorsa
| Patients with: | IL-6 (pg/ml) | CRP (μg/ml) | sCD14 (μg/ml) |
|---|---|---|---|
| RA (n = 29) | 6.9 (2.3–11.2)c | 14 (6–23)c | 2.4 (1.9–2.7)c |
| ReA (n = 38) | 16 (6–44)c | 58 (12–127)c | 2.1 (1.6–2.5)b |
| Crystal-induced arthritis (n = 26) | 61 (26–92)c | 433 (98–158)c | 2.9 (2.3–3.2)c |
| Healthy blood donors (n = 58) | 0.39 (0.07–0.99) | 1.6 (1.0–1.6) | 1.7 (1.5–1.9) |
Data are expressed as median (IQR); Statistically significant differences as compared with healthy blood donors;
, p < 0.001;
, p < 0.0001 (Mann-Whitney tests); Comparison between two groups were made only when the Kruskal-Wallis test yielded statistically significant results.
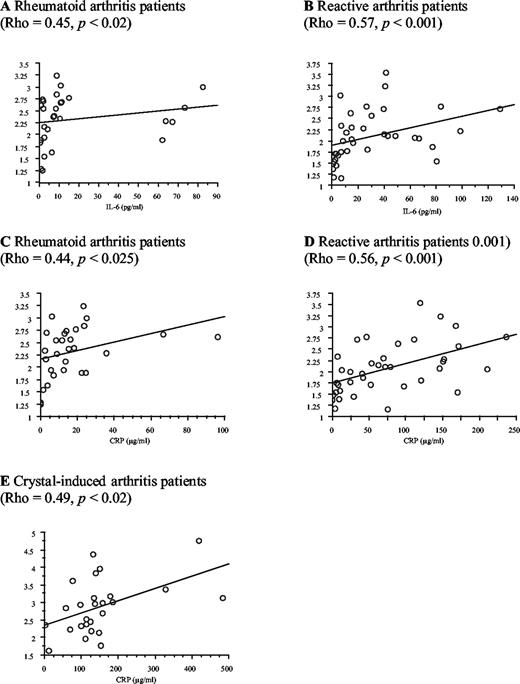
Correlations made with the Spearman rank correlation test of serum sCD14 levels with those of IL-6 in RA (A) and ReA (B) patients, and with those of CRP in RA (C), ReA (D), and crystal-induced arthritis (E).
Correlations made with the Spearman rank correlation test of serum sCD14 levels with those of IL-6 in RA (A) and ReA (B) patients, and with those of CRP in RA (C), ReA (D), and crystal-induced arthritis (E).
SF cell counts and comparison of paired serum and SF concentrations of IL-6, CRP, and sCD14 in patients with various rheumatic diseases
To further examine whether the level of sCD14 is mainly related to bacteria exposure, the concentrations of sCD14 were determined in SF from five patients with septic arthritis and compared with those found in other rheumatic diseases. No significant difference was found between the SF concentrations of sCD14 in patients with septic arthritis (median, 3.0 μg/ml; IQR, 2.7–3.3), and in those with RA.
To examine whether in inflammatory fluids rich in leukocytes such as SF, sCD14 could be released from mCD14 by protease-mediated shedding (7), a comparison of the number of leukocytes with the level of SF sCD14 was performed, but no significant correlation was observed.
The possible joint origin of SF sCD14 was also investigated by comparing its SF and serum concentrations. They were found to be of the same order of magnitude, in all groups of patients, whereas IL-6 concentrations, known to have a joint origin in these patients, were 100- to 1000-fold higher in SF than in serum. In all groups of patients tested, the number of SF leukocytes/mm3 and the SF concentrations of IL-6, CRP, and sCD14 were significantly higher than in osteoarthritis (noninflammatory disease) patients (Table II). These results do not support the joint as a primary source of sCD14 in the circulation, but still suggest an origin related to an inflammatory state.
SF cell counts and comparison of paired serum and SF levels of IL-6, CRP, and sCD14 in patients with various rheumatic diseasesa
| Patients with: | Leukocytes/mm3 | IL-6 (pg/ml) | CRP (μg/ml) | sCD14 (μg/ml) | |
|---|---|---|---|---|---|
| RA (n = 15) | Serum | 6.3 (1.8–14.8) | 13.3 (5.8–24.7) | 2.3 (1.8–2.7) | |
| SF | 11,150 (5,950–14,900)d (n = 29) | 6,405 (1,366–10,195)b | 8.6 (4.0–25.4)b | 2.8 (2.1–3.3)c | |
| ReA (n = 17) | Serum | 45.1 (6.6–82.6) | 119 (29–168) | 2.4 (1.5–2.8) | |
| SF | 13,000 (9,200–25,400)d (n = 31) | 31,260 (4,444–126,500)b (n = 16) | 92 (3.4–154)b (n = 11) | 1.9 (1.7–2.7)b | |
| Crystal-induced arthritis (n = 26) | Serum | 63 (25–92) | 133(98–158)c | 2.9 (2.3–3.2) | |
| SF | 21,200 (13,750–34,250)d (n = 25) | 68,000 (42,500–140,500)c (n = 25) | 46 (17–77)c | 2.2 (1.6–2.6)b | |
| Osteoarthritis (n = 6) | Serum | 5.1 (1.9–7.4) | 5.3 (3.9–22.1) | 2.2 (1.9–2.3) | |
| SF | 150 (100–250) (n = 13) | 514 (301–1,793) | 2.1 (1.4–4.3) | 1.4 (0.8–1.8) |
n is given when difference of 15 for RA, 17 for ReA, 26 for crystal-induced arthritis, and 6 for osteoarthritis groups. Data are expressed as median (IQR). Statistically significant differences as compared with osteoarthritis patients:
, p < 0.05;
, p < 0.001;
, p < 0.0001 (Mann-Whitney tests). Comparison between two groups were made only when the Kruskal-Wallis test yielded statistically significant results.
Relation between sCD14 serum concentrations and disease activity
The possible relation between the level of sCD14 and an inflammatory state was further examined in ReA and RA. In ReA patients, a significant correlation (p = 0.48, p = 0.040) was obtained between the intensity of joint pain (patient’s assessment) and the serum concentrations of sCD14 (Fig. 2). In patients with active RA who received TNF-α inhibitors, the disease activity (DAS) and the serum concentrations of CRP and sCD14 were determined before and after treatment. A significant decrease of DAS (median, 4.5; IQR, 3.9–5.9 vs median, 3.7; IQR, 2.7–4.8, p = 0.008), as well as serum concentrations of CRP (median, 38 μg/ml; IQR, 5.6–70 vs median, 4.5 μg/ml; IQR, 0.9–32, p = 0.014) and sCD14 (median, 2.2 μg/ml; IQR, 2.0–2.7 vs median, 1.9 μg/ml; IQR, 1.7–2.2, p = 0.005) was observed after TNF-α inhibitor treatment (Fig. 3). These results provide evidence of a relation between the serum levels of sCD14 and disease activity.

Serum level of sCD14 in 23 patients with ReA according to intensity of pain affecting joints (patient’s assessment) scored from 1, low intensity to 4, high intensity.
Serum level of sCD14 in 23 patients with ReA according to intensity of pain affecting joints (patient’s assessment) scored from 1, low intensity to 4, high intensity.
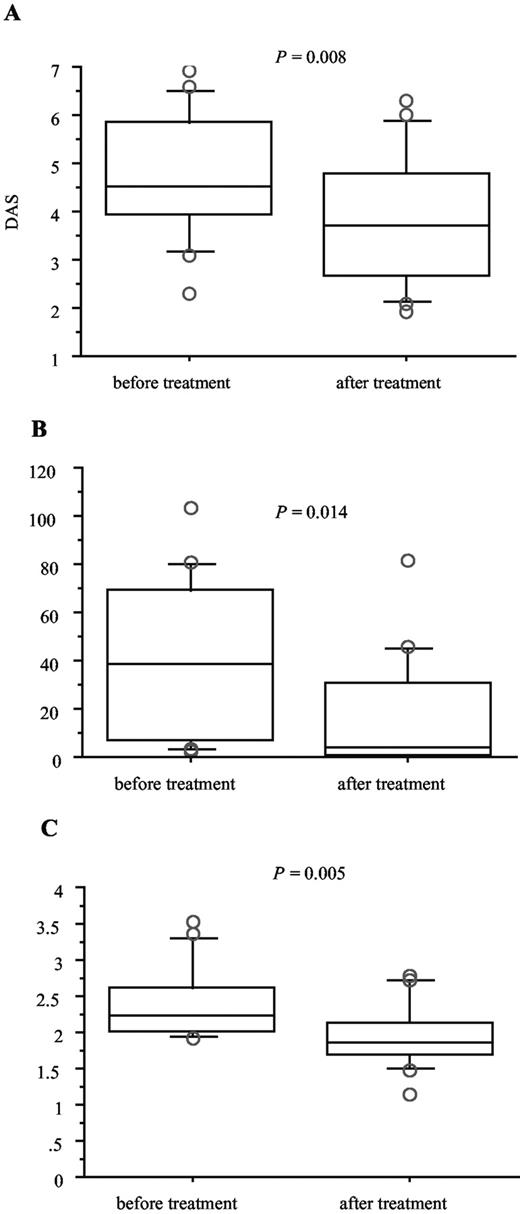
DAS (A), serum levels of CRP (B), and sCD14 (C) in 17 patients with RA, before and after treatment with TNF-α inhibitors (11 received infliximab and 6 etanercept). Horizontal bars within boxes show the median; boxes show the IQR (±25% of the median); vertical bars show the 95% confidence interval (values above and below these levels were plotted separately).
DAS (A), serum levels of CRP (B), and sCD14 (C) in 17 patients with RA, before and after treatment with TNF-α inhibitors (11 received infliximab and 6 etanercept). Horizontal bars within boxes show the median; boxes show the IQR (±25% of the median); vertical bars show the 95% confidence interval (values above and below these levels were plotted separately).
Differential effects of LPS, IL-1β, IL-6, and TNF-α on sCD14, IL-1Ra, and fibrinogen production in HepG2 hepatoma cells
To study the possibility that CD14 could be an APP, HepG2 cells were cultured in presence of different cytokines known to stimulate the production of APP. After 48 h, the levels of sCD14 as well as those of a class 1 (IL-1Ra) (54) and class 2 APP (fibrinogen) were determined by ELISA in culture supernatants. HepG2 was selected because it is widely used to study the production of APP. The cultures were first performed in absence and in presence of 10% FCS to evaluate the importance of this potential source of nonspecific effects. In presence of FCS, sCD14 and IL-1Ra levels were ∼3-fold higher than in absence of FCS, but the effects of the various stimulants were similar. The only exception was TNF-α aloneor combined to IL-1β, which decreased significantly the release of sCD14 in presence, but not in absence of FCS (Fig. 4, A and B). However, to avoid possible nonspecific effects, the following experiments were realized without FCS.
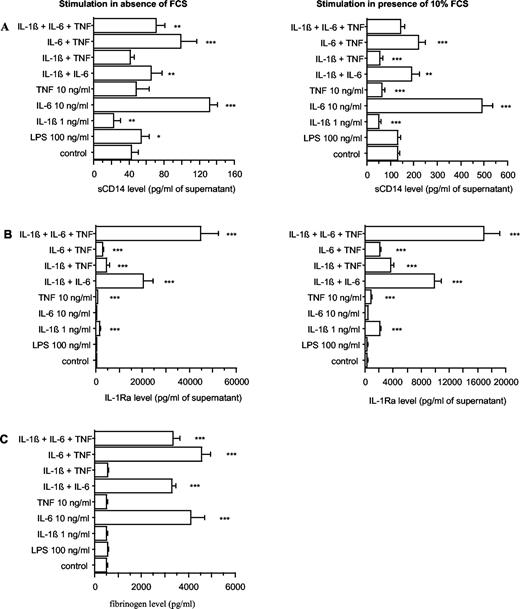
sCD14 (A), IL-1Ra (B), and fibrinogen (C) production by HepG2 cells, in response to E. coli LPS, IL-1β, IL-6, and TNF-α. HepG2 cells were stimulated by LPS, or IL-1β, IL-6, or TNF-α either alone or in combination at the indicated concentrations, in absence and in presence of 10% FCS. After 48 h of culture, supernatants were collected, and their content in sCD14, IL-1Ra, and fibrinogen was analyzed by ELISA. Each value represents the mean ± SD of triplicates from two different experiments. ∗∗∗, p < 0.0001; ∗∗, p < 0.005; ∗, p < 0.05 (comparison with control).
sCD14 (A), IL-1Ra (B), and fibrinogen (C) production by HepG2 cells, in response to E. coli LPS, IL-1β, IL-6, and TNF-α. HepG2 cells were stimulated by LPS, or IL-1β, IL-6, or TNF-α either alone or in combination at the indicated concentrations, in absence and in presence of 10% FCS. After 48 h of culture, supernatants were collected, and their content in sCD14, IL-1Ra, and fibrinogen was analyzed by ELISA. Each value represents the mean ± SD of triplicates from two different experiments. ∗∗∗, p < 0.0001; ∗∗, p < 0.005; ∗, p < 0.05 (comparison with control).
The highest stimulatory effect was triggered by IL-6 that induced a 3.1-fold stimulation, whereas TNF-α had no effect and IL-1β induced a 0.5-fold inhibition. The stimulatory effect triggered by IL-6 was slightly decreased by TNF-α because a 2.3-fold stimulation was obtained in presence of the combination of TNF-α and IL-6, but was mainly decreased by IL-1β because only a 1.5-fold stimulation remained in cells cultured with the combination of IL-1β and IL-6. A similar stimulation (1.7-fold) of basal sCD14 production was induced by the combination of IL-6 with IL-1β and TNF-α. LPS induced a slight stimulation (1.3-fold) of basal sCD14 production (Fig. 4,A). In contrast, IL-6 alone could not trigger any detectable elevation of IL-1Ra, whereas IL-1β and TNF-α or the combinations of these cytokines with IL-6 stimulated its production significantly, as previously demonstrated (54). LPS had no effect on IL-1Ra production (Fig. 4,B). As for sCD14, fibrinogen production was significantly increased by IL-6 and by the two combinations of IL-6 with IL-1β and TNF-α, but no inhibitory effect of IL-1β was obtained. LPS had no effect on fibrinogen production (Fig. 4 C).
These data indicate that HepG2 cells are capable of producing sCD14 in response to IL-6 as a typical class 2 APP.
Different kinetics of soluble and cell-associated CD14 production in HepG2 hepatoma cells in response to IL-6 ± sIL-6R and effect of dexamethasone
To define more precisely the regulation of CD14 synthesis by IL-6 in HepG2 hepatocellular carcinoma cells, dose-response and time course experiments were performed. The concentration of CD14 was determined in culture supernatants as well as in cell lysates to examine whether the various forms of CD14 (cell associated and soluble) are differently regulated by IL-6. In presence of increasing concentrations of IL-6 (0.1 ng to 50 ng/ml), a dose-dependent stimulation with a maximal response in the range 10–50 ng/ml was observed for soluble as well as cell-associated CD14 (measured in cell lysates and corresponding to membrane-bound and intracellular molecules) (Fig. 5).
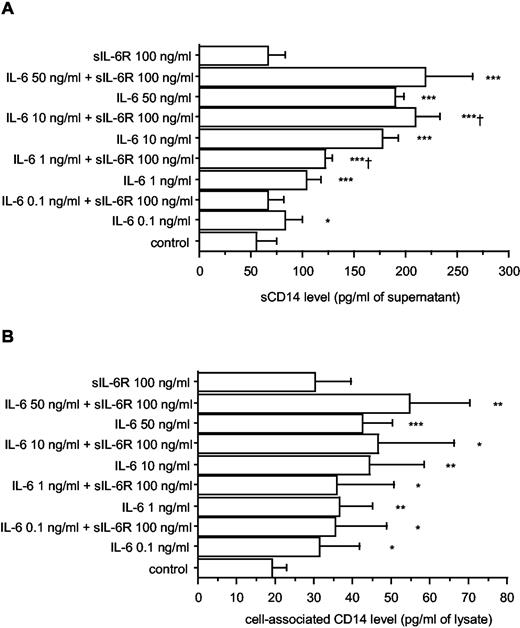
Soluble (A) and cell-associated (B) CD14 production by HepG2 cells, in response to increasing concentrations of IL-6 ± sIL-6R. HepG2 cells were cultured in 48-well plates (5 × 10⁴ cells/0.5 ml per well) and were stimulated by IL-6 (0.1 ng to 50 ng/ml) alone or in combination with sIL-6R (100 ng/ml). After 48 h of culture, supernatants were collected, and their content in sCD14 was analyzed by ELISA. Cells were lysed with three cycles of freezing and thawing. Lysates were used for cell-associated CD14 measurement. Each value represents the mean ± SD of triplicates from two experiments. ∗∗∗, p < 0.0001; ∗∗, p < 0.005; ∗, p < 0.05 (comparison with nonstimulated cells). †, p < 0.05 (comparison with IL-6-stimulated cells).
Soluble (A) and cell-associated (B) CD14 production by HepG2 cells, in response to increasing concentrations of IL-6 ± sIL-6R. HepG2 cells were cultured in 48-well plates (5 × 10⁴ cells/0.5 ml per well) and were stimulated by IL-6 (0.1 ng to 50 ng/ml) alone or in combination with sIL-6R (100 ng/ml). After 48 h of culture, supernatants were collected, and their content in sCD14 was analyzed by ELISA. Cells were lysed with three cycles of freezing and thawing. Lysates were used for cell-associated CD14 measurement. Each value represents the mean ± SD of triplicates from two experiments. ∗∗∗, p < 0.0001; ∗∗, p < 0.005; ∗, p < 0.05 (comparison with nonstimulated cells). †, p < 0.05 (comparison with IL-6-stimulated cells).
As the sIL-6R is known to enhance the effects of IL-6 (55), the production of soluble and cell-associated CD14 was analyzed in response to the combination of IL-6 with sIL-6R. A relatively high concentration of sIL-6R (100 ng/ml) had no significant effect on basal soluble and cell-associated CD14 production, but increased significantly the sCD14 response to 1 and 10 ng/ml IL-6 (Fig. 5).
Concentrations of 10 ng/ml IL-6 and 100 ng/ml sIL-6R were therefore chosen to study the kinetics of soluble and cell-associated CD14 production. The concentrations of sCD14 were time dependent with a maximal level after 96–120 h of culture, whereas the levels of cell-associated CD14 were maximal after 24–48 h of culture before decreasing to the lowest level after 120 h. For sCD14, the concentration began to be significantly increased after 12 h, in presence of stimulants (p < 0.05) and after 48 h, in absence of stimulants (p < 0.005), and continued to increase. For cell-associated CD14, the concentration began to be significantly increased and was the highest after 24 h in presence of IL-6 + sIL-6R (p < 0.005) and after 48 h in presence of IL-6 alone (p < 0.05). In absence of stimulant, no significant increase was observed, but after 120 h, the concentration of cell-associated CD14 decreased significantly (p < 0.01) (Fig. 6). These data support similar regulations of soluble and cell-associated CD14 by IL-6 and sIL-6R, but different kinetics, because after 48 h, opposite results were observed with an increase of sCD14 and a decrease of cell-associated CD14 concentrations, suggesting that after 48 h, most of the mCD14 is released.

Kinetics of soluble (A) and cellular (B) CD14 production in response to IL-6 ± sIL-6R. HepG2 cells were cultured in 48-well plates (5 × 10⁴ cells/0.5 ml per well) and were stimulated by IL-6 (10 ng/ml) alone or in combination with sIL-6R (100 ng/ml). After various duration of culture, supernatants were collected, and their content in sCD14 was analyzed by ELISA. Cells were lysed with three cycles of freezing and thawing. Lysates were used for cell-associated CD14 measurement. Each value represents the mean ± SD of triplicates from two experiments.∗∗∗, p < 0.0001; ∗∗, p < 0.005; ∗, p < 0.05 (comparison with nonstimulated cells at the same time point). †, p < 0.05 (comparison with IL-6-stimulated cells at the same time point).
Kinetics of soluble (A) and cellular (B) CD14 production in response to IL-6 ± sIL-6R. HepG2 cells were cultured in 48-well plates (5 × 10⁴ cells/0.5 ml per well) and were stimulated by IL-6 (10 ng/ml) alone or in combination with sIL-6R (100 ng/ml). After various duration of culture, supernatants were collected, and their content in sCD14 was analyzed by ELISA. Cells were lysed with three cycles of freezing and thawing. Lysates were used for cell-associated CD14 measurement. Each value represents the mean ± SD of triplicates from two experiments.∗∗∗, p < 0.0001; ∗∗, p < 0.005; ∗, p < 0.05 (comparison with nonstimulated cells at the same time point). †, p < 0.05 (comparison with IL-6-stimulated cells at the same time point).
As glucocorticoids are known to up-regulate expression of IL-6R (56) and to enhance the stimulatory effects of cytokines on the production of APP by hepatocytes (45, 57), the effect of dexamethasone on production of soluble and cell-associated CD14 was analyzed in the presence of IL-6 alone or the combination of IL-6 with sIL-6R. At the concentration usually used to costimulate the production of APP (10−7 M), dexamethasone induced a 2-fold increase of basal sCD14 production (p < 0.05) and a 1.3-fold increase of that induced by IL-6 + sIL-6R (p < 0.05) (data not shown).
CD14 mRNA quantification in HepG2 hepatoma cells and in human primary hepatocytes, in response to IL-1β, IL-6, and TNF-α
To examine regulation of CD14 production at the mRNA level, HepG2 cells and human primary hepatocytes were cultured with the same set of cytokines used in previous experiments. Total RNA was prepared from cells cultured in the presence or absence of cytokines, and the amount of CD14 mRNA was determined by quantitative, real-time RT-PCR. The addition of IL-6 led to a 2.8-fold stimulation (p < 0.001), the combination of IL-6 with IL-1β to a 2.2-fold stimulation (p < 0.001), the combination of IL-6 with TNF-α to a 1.8-fold stimulation (p < 0.01), and the combination of IL-6 with IL-1β and TNF-α to a 1.6-fold (p < 0.05) stimulation of CD14 mRNA levels in HepG2 cells (Fig. 7,A). In primary cultures of human hepatocytes, results were obtained from three independent donors, and the addition of IL-6 led also to a significant stimulation (1.3-fold, p < 0.05) of CD14 mRNA levels (Fig. 7 B). Thus, similar to the protein data, CD14 steady state mRNA levels were increased by IL-6 both in hepatoma cells and human primary hepatocytes.

A, Induction of CD14 mRNA in HepG2 cells in response to IL-1β, IL-6, and TNF-α. HepG2 cells were stimulated by IL-1β, IL-6, and TNF-α. alone or in combination at the indicated concentrations. After 6 h of culture, total RNA was extracted for CD14 mRNA quantification by real-time PCR. The data of two independent analyses for each sample were averaged. The results are expressed after normalization against cyclophilin. Each value represents the mean ± SD of three independent experiments. ∗∗, p < 0.005; ∗, p < 0.05 (comparison with control). B, Induction of CD14 mRNA in human primary hepatocytes in response to IL-1β and IL-6. Human primary hepatocytes isolated from surgical biopsies were cultured in the absence (control) or presence of IL-6, IL-1β, or a combination of IL-6 and IL-1β at the indicated concentrations. After 16 h of culture, total RNA was extracted for CD14 mRNA quantification by real-time PCR. The results are expressed in terms of fold increase over the mRNA levels of human primary hepatocytes cultured in the absence of cytokine, after normalization against cyclophilin. Each value represents the mean ± SD of experiments performed with hepatocytes from three different donors, except for IL-6 + IL-1β stimulation (one donor). ∗, p < 0.05 (one sample t test: mean is significantly different from 1).
A, Induction of CD14 mRNA in HepG2 cells in response to IL-1β, IL-6, and TNF-α. HepG2 cells were stimulated by IL-1β, IL-6, and TNF-α. alone or in combination at the indicated concentrations. After 6 h of culture, total RNA was extracted for CD14 mRNA quantification by real-time PCR. The data of two independent analyses for each sample were averaged. The results are expressed after normalization against cyclophilin. Each value represents the mean ± SD of three independent experiments. ∗∗, p < 0.005; ∗, p < 0.05 (comparison with control). B, Induction of CD14 mRNA in human primary hepatocytes in response to IL-1β and IL-6. Human primary hepatocytes isolated from surgical biopsies were cultured in the absence (control) or presence of IL-6, IL-1β, or a combination of IL-6 and IL-1β at the indicated concentrations. After 16 h of culture, total RNA was extracted for CD14 mRNA quantification by real-time PCR. The results are expressed in terms of fold increase over the mRNA levels of human primary hepatocytes cultured in the absence of cytokine, after normalization against cyclophilin. Each value represents the mean ± SD of experiments performed with hepatocytes from three different donors, except for IL-6 + IL-1β stimulation (one donor). ∗, p < 0.05 (one sample t test: mean is significantly different from 1).
CD14 mRNA expression in the liver of turpentine-induced acute-phase response in IL-6+/+ vs IL-6−/− mice
To further study the role of inflammation and IL-6 on CD14 expression by hepatocytes, the amount of CD14 mRNA was determined in IL-6+/+ and IL-6−/− mice, injected or not with turpentine in the thigh to induce local inflammation, as recently described (53). Steady state levels of CD14 mRNA remained unchanged in the livers of IL-6−/− mice after the injection of turpentine, whereas the levels were significantly up-regulated in IL-6+/+ mice. In IL-6+/+ mice, a 7.2-fold stimulation in CD14 mRNA levels was obtained following the injection of turpentine as compared with mice injected with saline (p < 0.0001). As with other APPs, the levels of CD14 mRNA further increased 48 h after turpentine injection (53) (Fig. 8).

Turpentine-induced production of CD14 mRNA by the liver from IL-6+/+ vs IL-6−/− mice. C57BL/6 IL-6+/+ and IL-6−/− mice were injected s.c. with either turpentine or saline. After 8 or 48 h, livers were collected for CD14 mRNA quantification by real-time PCR. The results are expressed after normalization against cyclophilin. Each value represents the mean ± SD of triplicates from three animals. ∗∗∗, p < 0.0001; ∗, p < 0.05 (comparison with IL-6−/−).
Turpentine-induced production of CD14 mRNA by the liver from IL-6+/+ vs IL-6−/− mice. C57BL/6 IL-6+/+ and IL-6−/− mice were injected s.c. with either turpentine or saline. After 8 or 48 h, livers were collected for CD14 mRNA quantification by real-time PCR. The results are expressed after normalization against cyclophilin. Each value represents the mean ± SD of triplicates from three animals. ∗∗∗, p < 0.0001; ∗, p < 0.05 (comparison with IL-6−/−).
Discussion
CD14 appears to be a multifunctional molecule. In addition to being a receptor to LPS and other bacterial structures (22, 23), it may modulate LPS-triggered apoptosis (58, 59, 60) and regulate T and B lymphocyte activation and function (27, 36), and the present results show that CD14 is also an APP. In vivo, the main characteristics of sCD14 included: higher serum levels in patients with crystal-induced than in those with infection-mediated (ReA) arthritis; similar SF levels in patients with septic arthritis and in those with an immunologically mediated disease (RA); similar levels in serum and SF, whereas IL-6, produced in the joint, had concentrations 100- to 1000-fold higher; correlation of sCD14 serum levels with those of CRP and IL-6 and with disease activity in ReA and RA patients; and the absence of correlation in SF with the number of leukocytes. In vitro, the main results included a direct stimulation of CD14 production by IL-6 in HepG2 hepatoma cells and a stimulation of CD14 steady state mRNA levels by IL-6 both in hepatoma cells and in human primary hepatocytes. These in vitro results were confirmed by in vivo studies in IL-6−/− mice following the injection of turpentine. However, taking into account the low increase (less than 2-fold) of sCD14 levels in the patients’ sera as compared with normal healthy individuals, the low increase (less than 4-fold) of sCD14 levels in the supernatants of IL-6-treated hepatoma cells, and the mild increase (less than 8-fold) of CD14 mRNA in IL-6-treated hepatoma cells, IL-6-treated human primary hepatocytes, and the liver of turpentine-treated mice, sCD14 should be considered as a minor APP.
These results show that protease-mediated shedding of the mCD14 from leukocytes (7, 8, 9, 10) is not the only source of sCD14, which is also directly secreted by hepatocytes. The relative contribution of both mechanisms was not determined, but hepatocytes are probably an important source of circulating CD14, as sCD14 concentrations found in normal human plasma exceed by 1 or 2 logs that of the cell membrane-bound receptor (27). In addition, patients with paroxysmal nocturnal hemoglobinuria, who have a defect in GPI anchoring and do not express mCD14 on their monocytes, have normal levels of serum sCD14.
The regulation of CD14 production by IL-6 clearly classifies CD14 as a class 2 APP. Indeed, two types of APP have been identified and classified according to the effects of cytokines on their regulation: class 1 APP, induced mainly by IL-1β in synergy with IL-6 (45, 57, 61, 62), including CRP, serum amyloids A and P, and α1-acid glycoprotein; and class 2 APP, induced by IL-6 or IL-6-related cytokines (45, 57), including the three chains of fibrinogen, α2-macroglobulin, and various antiproteases. Roughly, the two classes of APP can be distinguished by the absence of significant inhibitory effect of IL-1β on the synthesis of class 1 APP and effective IL-1β inhibition of the production of class 2 APP (51). Therefore, as sCD14 synthesis is induced by IL-6 and inhibited by IL-1β, it corresponds to a class 2 APP.
Many functions have been attributed to APP, including tissue repair, modulation of coagulation, neuroendocrine secretion, hemopoiesis, metabolism, metal binding, and infection fighting (48, 63, 64, 65). A role in the defense to infection has been devoted to CD14, which can bind endotoxin with relatively high affinity (66). With LBP, which is another LPS receptor and another APP, CD14 presents LPS to Toll-like receptor (TLR) 4 in association with the accessory protein MD-2 (67, 68). TLR4 serves as a cell surface coreceptor for CD14 because mCD14 is anchored to the cell membrane by a GPI linkage without a cytoplasmic domain, and is therefore not capable of initiating a transmembrane activation signal (69). The presentation of LPS to TLR4 leads to the activation of intracellular signals, including NF-ΚB and c-Jun N-terminal kinase, which initiate the transcription of genes coding for proinflammatory cytokines such as TNF-α, IL-1β, IL-6, and IL-8 (2, 70, 71, 72). In contrast to sCD14, LBP is classified as a class 1 APP because of its synergistic inducibility with IL-6, IL-1β, and TNF-α (73, 74). The participation of two differentially regulated APP to the mechanisms involved in the response to LPS is puzzling. These different regulations might implicate different roles for sCD14 and LBP. LBP is induced by early response cytokines (42, 75), consistent with the notion that the synthesis of LBP is part of an early alarm system aimed at recognizing and binding LPS, and thus enhancing the activation of the immune system to combat invading Gram-negative bacteria. However, although a high proinflammatory cytokine response is crucial during the early phase of an infection (76), an overwhelming production of these mediators can be fatal in septic shock (77). In the late phase, sCD14 could play a role by preventing the lethal side effects of bacterial products. As a soluble LPS receptor, sCD14 may serve as modulator of the events triggered by the binding of LPS to the mCD14. Indeed, it has been shown that sCD14 competes with mCD14 for LPS binding and is able to neutralize LPS-induced responses in vitro and in vivo (13, 14, 15, 16). sCD14 can also transfer cell-bound LPS to plasma lipoproteins (78). The fact that survival rates in the lethal Shwartzman reaction induced by LPS were significantly higher in CD14 transgenic than in nontransgenic mice is compatible with this hypothesis (79).
As sCD14 and LBP (80) levels in the serum of normal adult human represent, respectively, approximately a 1,000- and 10,000-fold molar excess of the LPS level seen in fatal septic shock patients (81), sCD14 and LBP may have other biological functions besides their role in LPS signaling (41). In acute-phase response, sCD14 might bridge the gap between innate and adaptive immunity. It could modulate cell-associated and humoral immune responses by interacting directly with T and B cells (27), and thus play a role in immuno-mediated diseases. However, further studies to better define this role deserve to be conducted.
Acknowledgements
The technical assistance of Pilar Eraso, Eve-Julie Sarret, and Madeleine Vuillet is gratefully acknowledged.
Footnotes
This study was supported by Grants N° 3200-061500.00 (to S.B.); 32-66907.01 (to B.R.G. and C.B.W); 3200-054955.98 (to C.G.) from the Fonds National Suisse de la Recherche Scientifique; and grants from Novartis, Albert-Boeni, and De Reuter Foundations (to S.B.).
Abbreviations used in this paper: mCD14, membrane-bound CD14; APP, acute-phase protein; CRP, C-reactive protein; DAS, disease activity score; IL-1Ra, IL-1 receptor antagonist; IQR, interquartile range; LBP, LPS-binding protein; RA, rheumatoid arthritis; ReA, reactive arthritis; RT, reverse transcriptase; sCD14, soluble CD14; SF, synovial fluid; sIL-6R, soluble IL-6R; TLR, Toll-like receptor.
