


Abstract
Dimorphos was the target of the Double Asteroid Redirection Test (DART) mission. This paper summarizes the properties of an updated shape model of Dimorphos, describes the differences between the updated shape model and an earlier version published by Daly, Ernst, Barnouin et al. (doi:10.1038/s41586-023-05810-5), summarizes the data products associated with this model, and explains where the products can be accessed. The updated shape model benefited from improved methods of incorporating limb information, which will accelerate future shape modeling efforts for other objects with limited imaging data. The updated shape model is similar to the earlier model but slightly smaller (−2.8% change in volume) than the previous Dimorphos global shape model, and the updated shape is slightly more elongated. The additional analysis reported here supports an oblate preimpact shape for Dimorphos. This result indicates that the postimpact elongation of Dimorphos derived from ground-based observations is evidence for a large crater or global reshaping of the asteroid due to the DART impact. The updated global shape model of Dimorphos, as well as the earlier version, will be available in the Planetary Data System Small Bodies Node and through the public Small Body Mapping Tool.
Export citation and abstract BibTeX RIS

Original content from this work may be used under the terms of the Creative Commons Attribution 4.0 licence. Any further distribution of this work must maintain attribution to the author(s) and the title of the work, journal citation and DOI.
1. Introduction
NASA's Double Asteroid Redirection Test (DART) mission was the first planetary defense test mission, and on 2022 September 26, the mission demonstrated a technology that can be used to deflect an asteroid (Cheng et al. 2023a; Daly, Ernst, Barnouin et al. 2023; Li et al. 2023; Thomas et al. 2023). The DART mission targeted the binary Didymos asteroid system (Rivkin et al. 2021), and the DART spacecraft intentionally collided with the secondary asteroid, Dimorphos (Daly, Ernst, Barnouin al. 2023). In the final 2 minutes of the DART spacecraft's life, the Didymos Reconnaissance and Asteroid Camera for Optical navigation (DRACO) instrument (Fletcher et al. 2018, 2022) returned a stream of images of both asteroids until Didymos left the DRACO field of view, leaving only Dimorphos in the scene (Daly et al. 2023). In the final seconds before impact, Dimorphos filled the DRACO field of view. In addition, the Light Italian Cubesat for Imaging of Asteroids (LICIACube) LICIACube Unit Key Explorer (LUKE) instrument contributed by the Italian Space Agency acquired resolved images of the Didymos system shortly after the DART impact (Dotto et al. 2021; Dotto & Zinzi 2023). Images taken by the DART spacecraft were used to build a preliminary global shape model of Dimorphos (Daly, Ernst, Barnouin et al. 2023).
The shape of Dimorphos is important for at least three reasons. First, the volume of Dimorphos, when combined with an assumed density, is one constraint on the total mass of the asteroid, which is in turn used to determine the momentum enhancement factor associated with the DART impact (Rivkin et al. 2021; Cheng et al. 2023a). Second, the shapes of asteroids provide clues to their origins and evolutions (Sullivan et al. 1996; Thomas et al. 2002; Abe et al. 2006; Fujiwara et al. 2006; Barnouin et al. 2019; Watanabe et al. 2019; Roberts et al. 2021; Agrusa et al. 2022; Richardson et al. 2022). Third, the secondary's shape, which is tied closely to its moments of inertia, plays an important role in determining Dimorphos's postimpact orbital and rotational state (Agrusa et al. 2021; Meyer et al. 2023a).
Here we present an updated shape model of Dimorphos. This updated shape model was built using improved information about the location of the DART spacecraft, as well as a more recent orbit solution for the Didymos system. The updated model benefited from additional computational processing time and a more robust method for incorporating limb data. We summarize the properties of the updated shape model, describe the differences between the preliminary and updated models, and summarize the data products associated with this model and where people can access those products.
2. Methods
2.1. Images Used to Build the Shape Model
The updated Dimorphos shape model was built by stereophotoclinometry (SPC; Gaskell et al. 2008, 2023; Barnouin et al. 2020; Palmer et al. 2022) using images that were taken by the DRACO imager. In brief, SPC is an image-based shape modeling technique that uses brightness variations across all available images, together with an initial solution for the spacecraft state at the time of each image, to generate topography using a combination of geometric stereo and two-dimensional photoclinometry. Topography is generated using an SPC program called lithos (Gaskell et al. 2008; Palmer et al. 2022; Gaskell et al. 2023) across a network of local digital terrain models (DTMs)—called maplets in SPC parlance—tiled across the body. Each maplet is made at a specific ground-sample distance (GSD), and the body may be tiled with maplets at multiple GSDs, depending on the available images for a particular object. The maplet ensemble is united into a global shape model using an SPC program called densify (Gaskell et al. 2008, 2023; Palmer et al. 2022).
DRACO images posed challenges for image-based shape modeling because they had a minimal stereo parallax and were taken at a single solar phase angle (Daly et al. 2022). Figure 1 shows that DRACO images satisfied one of the five imaging conditions that Barnouin et al. (2020) determined led to optimal SPC results. These ideal imaging conditions include views from the four cardinal directions, along with a fifth image taken at a low phase angle to help with the albedo solution (Barnouin et al. 2020). The DRACO images satisfied only one of the cardinal look directions. Because the solar phase angles of the DRACO images were between 59° and 60° during the final 2 minutes of the mission, no images satisfied the ideal albedo criterion. This limitation of the input images did not preclude the use of SPC because the quality of the SPC solution degrades gracefully when ideal conditions are not met. Shape modeling tests performed prior to impact (Daly et al. 2022) demonstrated that SPC produces a shape model with a reasonable volume accuracy and adequate topography near the impact site, despite the limitations of DRACO images. These preimpact tests also informed the likely errors in the updated Dimorphos shape model.
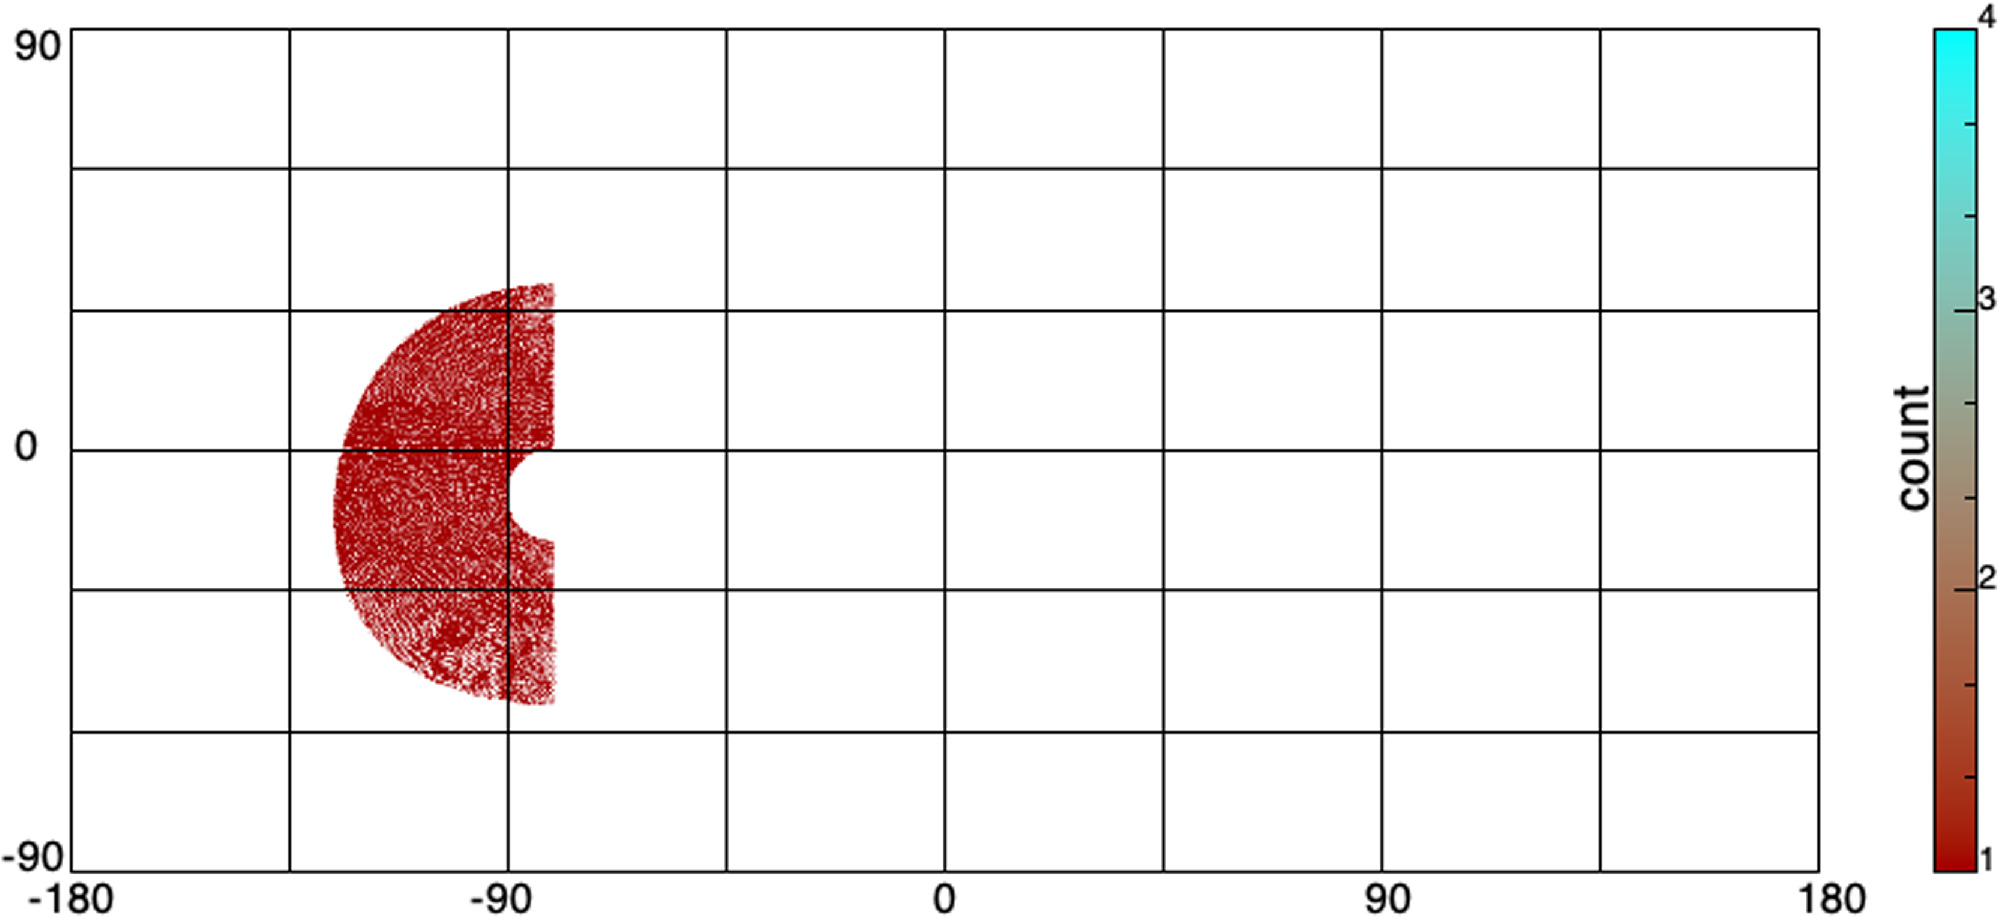
Figure 1. An analysis of the quality of the DRACO images compared to the ideal image set for SPC. The figure shows the number of cardinal look directions met by DRACO images. DRACO images satisfy only one of the imaging conditions that lead to optimal SPC results. The color bar shows the number of cardinal directions that are satisfied, not the number of images that match a particular cardinal direction.
Download figure:
Standard image High-resolution imageThe images taken by LICIACube were not fully incorporated into the SPC solution for Dimorphos due to their relatively coarse pixel scales and the pervasive presence of ejecta. LICIACube images were used to constrain the axial ratios of Dimorphos (A. Zinzi et al. 2023, in revision) and were fully incorporated into the SPC shape model of Didymos (Barnouin et al. 2023).
2.2. Shape Modeling Process
Daly et al. (2022) and Daly, Ernst, Barnouin et al. (2023) detailed the procedures used to build global shape models of Dimorphos. We built the updated model largely following those procedures but with modest procedural adjustments—described at length later in this paper—and the use of updated data (Figure 2). Table 1 summarizes the differences between the inputs and procedures used to build the preliminary Daly, Ernst, Barnouin et al. (2023) shape model (hereafter the "preliminary model") and the updated one reported here. The most substantive changes pertain to the starting ellipsoid and use of limb information; those changes are discussed at length in Sections 2.3 and 2.4.

Figure 2. Process used to build the updated shape model of Dimorphos. Green text denotes places where the steps used to build the updated shape model differed from those used to build the preliminary model.
Download figure:
Standard image High-resolution imageTable 1. Differences in Inputs and Procedures Used for Preliminary and Updated Shape Models
| Item | What Was Used for the Preliminary Model | What Was Used for the Updated Model | Comment |
|---|---|---|---|
| Dimorphos SPICE kernels a | dimorphos_s501-preimp.bsp | didymos_system_09.tpc | The updated model used an updated orbit solution for the system's preimpact state |
| dimorphos_s501-preimp.tpc | didymos_system_003.tf | ||
| de430.bsp | |||
| didymos_barycenter_s202_v01.bsp | |||
| didymos_system_s516_v01.bsp | |||
| DRACO images | 39 images; dart_0401930004_30962_01_iof.fits to dart_0401930049_43695_01_iof.fits, inclusive | 44 images; dart_0401930002_34675_01_iof.fits to dart_0401930050_41838_01_iof.fits, inclusive | The updated model included the final, partial DRACO image (dart_0401930050_41838_01_iof.fits) in the solution for topography but did not use that image in the solution for landmark locations or spacecraft state. The preliminary model did not use the partial image. The updated model incorporated four lower-resolution images that the preliminary model did not. |
| Starting ellipsoid | A extent (m) 176 | A extent (m) 176 | The updated model used a starting ellipsoid that had a slightly smaller intermediate (B) axis. This change was made based on reassessments of the DRACO terminator. |
| B extent (m) 174 | B extent (m) 170 | ||
| C extent (m) 114 | C extent (m) 114 | ||
| a/b = 1.01 | a/b = 1.04 | ||
| Limb information | SPC program limber; limb-only maplets at two GSDs: 11 and 26 cm | SPC program darthLimber; limb-only maplets at 11 cm GSD only | The SPC program limber searches for and identifies limb points along sunlit limbs. darthLimber allows users to specify the pixel-line locations of limb points in images, which makes it possible to include the limb lit by scattered light from Didymos, in addition to the sunlit limb. Limb-only maplets were used in both models, but for the updated model, they were tiled ∼6x more densely and only made at the finer-scale 11 cm GSD. Using only the finer GSD maplets brought out additional detail on the shapes of boulders along the limb. |
| Standard SPC maplets | GSDs of 60, 25, 10, 5, and 3 cm for standard maplets | GSDs of 60, 25, 10, 8.6, 7.2, 4.2, and 2.8 cm for standard maplets; maplets were also placed more densely everywhere and were densest around the impact site | Additional maplet GSDs were used for the updated model so that the final five complete images taken by the DART spacecraft were fully tiled with maplets whose GSDs were half the pixel scale of the image. The area in the vicinity of the impact site was tiled even more densely with 2.8 cm maplets. Denser maplets improve the representation of boulders in the topography (Weirich et al. 2022), and the surface of Dimorphos is boulder-rich. Figure 3 illustrates the extent of maplets of various GSDs and the coverage of standard maplets with different GSDs. |
| SPC iterations | Limited by the tight timeline in the weeks immediately following impact | All maplets iterated at least 10 times | Ten SPC iterations ensure that the SPC solution has fully converged (Palmer et al. 2022). |
Note.
a Kernels used for the preliminary model are available at https://ssd.jpl.nasa.gov/ftp/eph/small_bodies/dart/dimorphos/archive/. Kernels used for the updated model will be available at https://lib.jhuapl.edu/papers/an-updated-shape-model-of-dimorphos-from-dart-data/.Download table as: ASCIITypeset image
2.3. The Triaxial Ellipsoid Used to Initiate the Model
Due to the single viewing geometry associated with the DART images of Dimorphos, the shape model used to start the SPC process exerts considerable sway over the ultimate shape (Daly et al. 2022). Preimpact tests showed that adding LICIACube images to the SPC model could offset this effect (Daly et al. 2022); however, in practice, the LICIACube images could not be incorporated into the SPC solution for Dimorphos. Several factors contributed to this situation, including the fact that images from the finer-resolution LICIACube Explorer Imaging for Asteroid (LEIA) camera were not suitable for shape modeling due to instrument performance challenges, the images taken by LUKE had relatively coarse pixel scales were relative to the size of Dimorphos, Dimorphos left the LUKE field of view during closest approach, and ejecta was pervasive and optically thick (Cheng et al. 2023a; Dotto & Zinzi 2023). However, LUKE images were used in the SPC model of the much larger Didymos (Barnouin et al. 2023).
Given the importance of the starting shape, we reevaluated it for the updated shape model. The preliminary model used a triaxial ellipsoid, and, given the overall egglike appearance of Dimorphos in DRACO images, the updated model also used a triaxial ellipsoid as the starting shape. However, the dimensions of this starting ellipsoid were modified based on new assessments of DRACO images. We refer to the dimensions of the ellipsoid as A (long axis), B (intermediate axis), and C (short axis). Table 1 lists the axial extents of the starting ellipsoids for both models.
2.3.1. The Extents of the A and C Axes
Dynamical considerations suggest that Dimorphos was likely tidally locked prior to the DART impact (Agrusa et al. 2022; Richardson et al. 2022). Although this assumption has not been explicitly confirmed by DART data or ground-based observations, no data collected to date have been inconsistent with a preimpact tidally locked Dimorphos. Although radar images taken in 2003 did not contain full rotational coverage of the secondary, the secondary's bandwidth in these images is consistent with synchronous rotation (Naidu et al. 2020). The best-fit, preimpact orbital solution indicates that inward binary Yarkovsky–O'Keefe–Radzievskii–Paddack (BYORP) drift is either overcoming or in equilibrium with the outward expansion due to tidal dissipation (Scheirich & Pravec 2022), and BYORP requires a tidally locked secondary to act (Ćuk & Burns 2005). In addition, Pravec et al. (2016) found that all secondaries with orbit periods of <20 hr with measured rotational lightcurves are in synchronous rotation. The maximum forced libration depends on the elongation of Dimorphos and, given the preimpact orbital eccentricity of Dimorphos as <0.03 (Scheirich & Pravec 2022), ranges from <2° for an a/b ratio of 1.00–1.13, <4° for a/b between 1.13 and 1.20, and <10° for a/b between 1.20 and 1.28. The preimpact elongation (a/b) of Dimorphos was not reliably measured from ground observations (Pravec et al. 2022), and the preliminary model indicated that Dimorphos was quite oblate (a/b = 1.02). In that case, the forced libration would be <1°. While we cannot definitively rule out that some unknown event caused Dimorphos to have a large preimpact free libration amplitude, we consider this to be unlikely due to the relatively rapid dissipation timescale for free libration (Meyer et al. 2023b) and the lack of any obvious excitation mechanisms. We therefore posit that Dimorphos was probably not librating at the time of impact to a degree that would substantially change the result of the terminator assessments.
Assuming Dimorphos was tidally locked and not librating at the time of the DART impact, the long (A) axis of Dimorphos would have been pointing toward Didymos during the short time interval of DRACO images used to build the model. The DRACO images used for shape modeling were taken with a subboresight latitude/longitude near 9°S and 263°E. This approach geometry is close to the geometry that would view the A and B axes of Dimorphos directly (0°S, 270°E) if the asteroid were tidally locked prior to impact. The tidal-locking assumption is relevant only to our perception of the A and B axes; our ability to understand the extent of the C axis from DRACO is independent of that assumption.
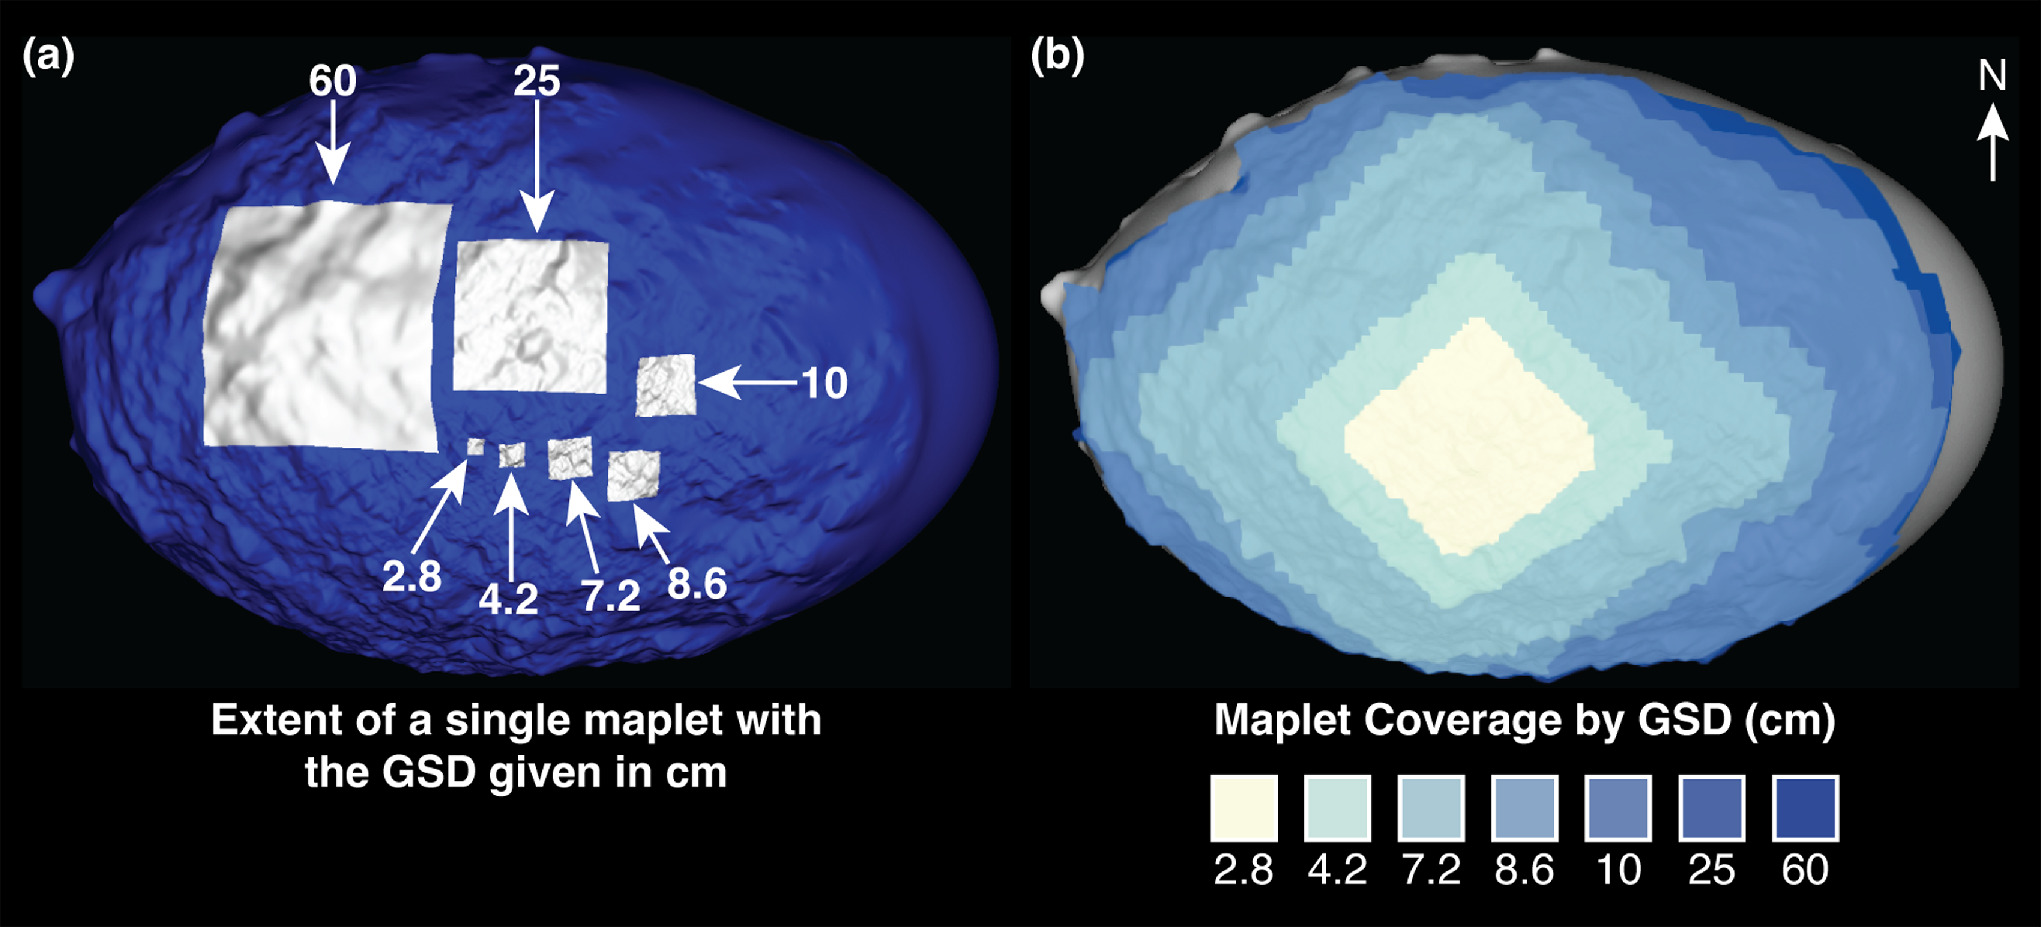
Figure 3. SPC maplets relative to the size of Dimorphos. (a) Extent of a single maplet with the labeled GSD. Many overlapping maplets of a given GSD are tiled across the body wherever DRACO images cover sunlit terrain. (b) Extent of the location of the finest-scale standard maplet to cover a given part of the body. The diamond-shaped patterns follow the outlines of DRACO images whose pixel scales are twice the maplet GSD. The figure shows only the finest-scale maplets in a given area. Each area is also covered by maplets with a coarser GSD than the color shown. For example, the area covered by 2.8 cm maplets is also densely tiled with 4.2-, 7.2-, 8.6-, 10-, 25-, and 60-cm maplets. The example maplets are shown in the updated model described in this paper.
Download figure:
Standard image High-resolution imageImages of Dimorphos have a key feature that was not considered in preimpact shape modeling tests but substantially improves knowledge of the shape of Dimorphos. Specifically, scattered light from Didymos illuminated the dark side of Dimorphos to reveal a complete outline of the asteroid (Figure 4). Seeing the asteroid's full, 360° limb in DRACO images reduces uncertainties compared to preimpact shape modeling tests. In shape modeling tests, we had to make an educated guess about how far the limb of the asteroid lay in darkness beyond the terminator. In the case of Dimorphos, we see where the long axis of the asteroid not only starts but also ends, which tightly constrains the extent of the long axis.
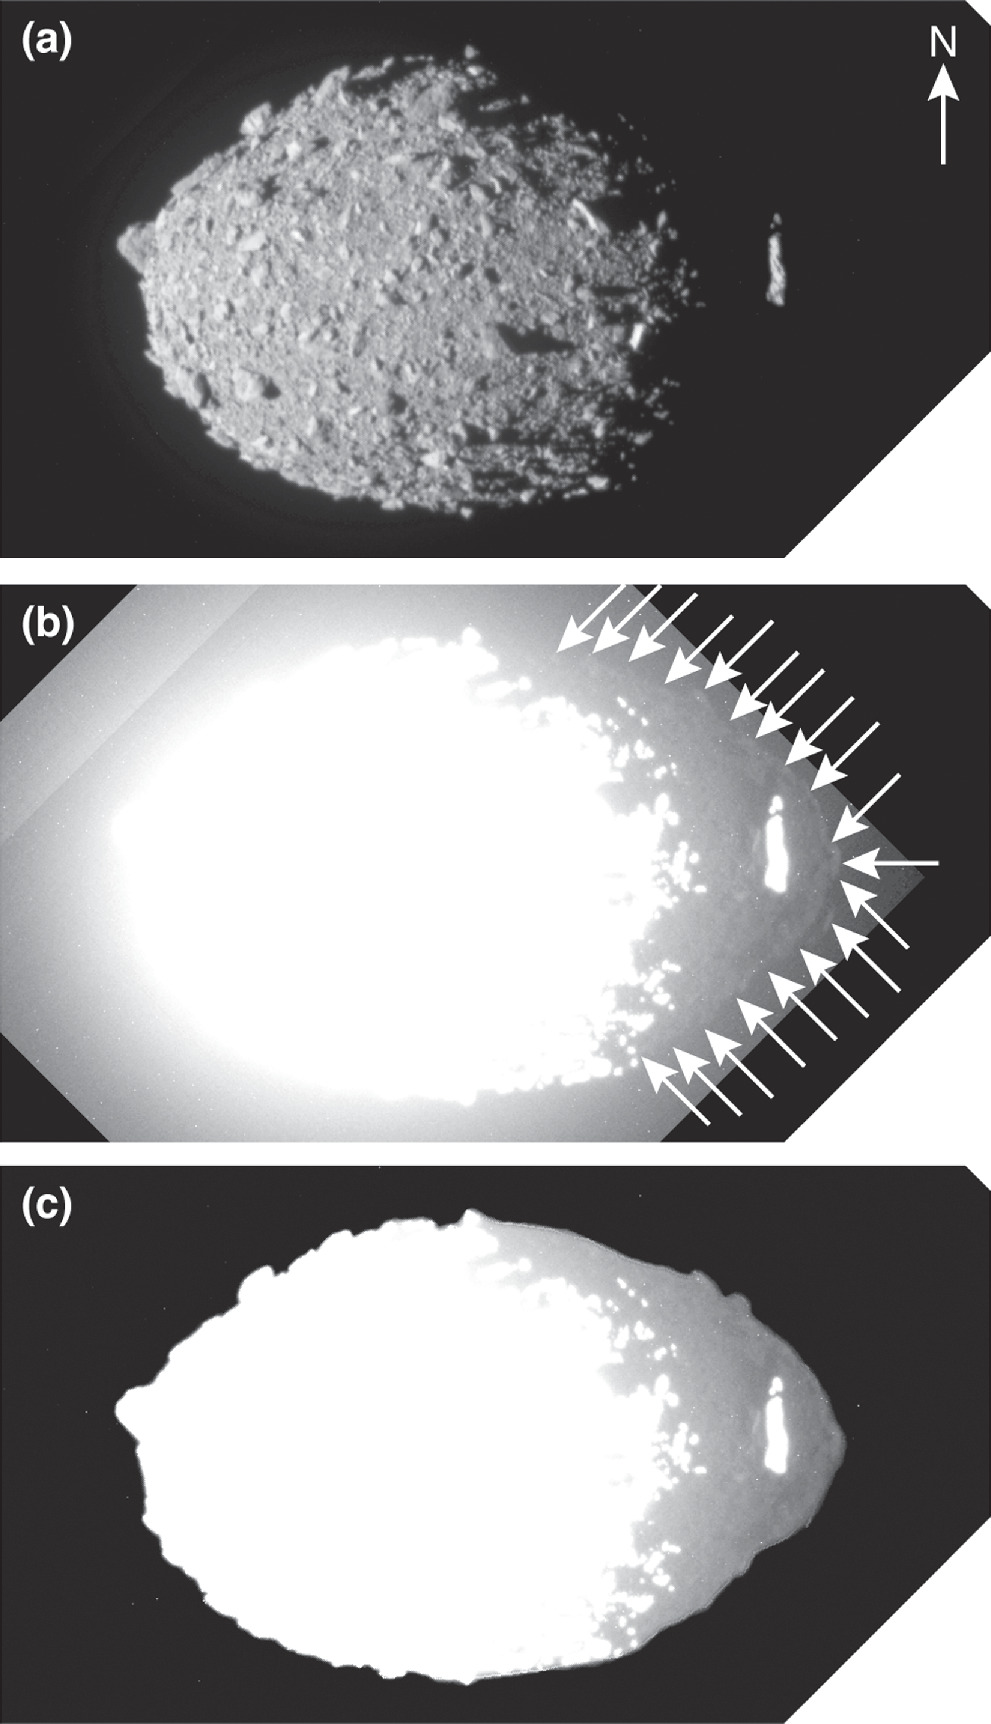
Figure 4. The final DRACO image to contain all of Dimorphos (dart_0401930039_14119_01_iof.fits). (a) When stretched normally, the sunlit limb on the left side of the body is clearly revealed. Didymos is out of the scene and to the right, and scattered light from Didymos illuminates the dark side of Dimorphos. (b) Strongly stretching the image brings out the dark Didymos-lit limb (white arrows). (c) Combining the limbs from the sunlit and Didymos-lit terrain reveals the complete outline of Dimorphos.
Download figure:
Standard image High-resolution imageWhen combined, the approach geometry, scattered light from Didymos, and precisely known time of impact and spacecraft speed (which pins down the spacecraft range) tightly constrain the extents of the A and C axes of Dimorphos, although the longitude component of the approach geometry argument relies on the reasonable assumption that Dimorphos was tidally locked prior to the DART impact. The preliminary model fully incorporated these constraints, and as a result, we did not change the extents of the A and C axes for the updated starting ellipsoid.
2.3.2. The Extent of the B Axis: The DRACO Perspective
For the preliminary model, the extent of the B axis had larger uncertainties than the extents of the A and C axes. We therefore paid particular attention to constraints on the B axis of the asteroid. The B axis (under the tidal-locking assumption) was almost entirely into and out of the plane of the DRACO images, and so it is the position of the terminator in the DRACO images that provides information about the extent of the B axis. Because DRACO data revealed the complete outline of Dimorphos, and the overall shape of Dimorphos was relatively uniform as seen by DRACO, the terminator constraint is much more powerful for Dimorphos than it would be for an object where the complete outline was not seen (e.g., a lone asteroid) or one with a more complicated overall shape (e.g., the bilobate comet 67P). Our approach implicitly assumed that the side of Dimorphos not seen by DART was grossly similar to the side that was imaged by DART, but such an assumption is reasonable based on LICIACube images (Dotto & Zinzi 2023; A. Zinzi et al. 2023, in preparation).
We identified features in DRACO images that could be used to reliably mark the location of the terminator (Figure 5). First, we masked out four areas where large boulders cast long shadows that connected to terrain in darkness (versus ending within lit terrain). The long shadows cast by these large boulders made the terminator appear to be closer to the sunlit terrain than the terminator would have appeared in the absence of these particular boulder shadows (Figure 5(a)). Smaller boulders in the south also created long shadows that complicated identification of the terminator at high southern latitudes. Second, we masked out knobs of terrain surrounded entirely by darkness (Figure 5(b)). These were local high points that stuck up above the background shape, which meant they were located beyond the true terminator of the long-wavelength background shape of Dimorphos (which is what we sought to identify for the starting triaxial shape). These isolated knobs had the opposite effect of the shadows from the large boulders; they gave the impression of the terminator being closer to the dark side than the terminator would have been in the absence of these knobs of terrain. Third, we identified reliable terminator markers by marking the farthestmost lit terrain that was outside of the areas affected by large boulder shadows and contiguous with other lit terrain (Figure 5(c)). Figure 5(d) combines all of these annotations into a single panel.
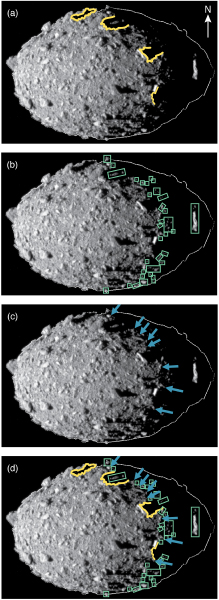
Figure 5. The highest-resolution DRACO image to contain all of Dimorphos (dart_0401930039_14119_01_iof.fits), with markings related to terminator identification. (a) Shadows (outlined in yellow) cast by large boulders prematurely create darkness. (b) Disconnected knobs of terrain (green) lie beyond the terminator of the background shape. (c) The farthest pieces of contiguous lit terrain in areas not affected by shadows from large boulders are reliable markers (blue arrows) of the terminator position. (d) Boulder shadows, terrain knobs, and terminator markers overlaid on the same image.
Download figure:
Standard image High-resolution imageNext, we rendered simulated DRACO images of triaxial ellipsoids with fixed A and C extents but a range of B-axis extents and compared the positions of the terminator in the simulated images to the positions of the terminator markers based on the DRACO image (Figure 6). The ratio of the A and B extents (a/b) is a convenient way to describe the ellipsoids. The starting ellipsoid for the preliminary model had a/b = 1.01. As a/b approaches 1, the terminator that would be seen by DRACO systematically shifts toward the sunlit side of the asteroid. Based on agreement between the location of the terminator on the rendered ellipsoids and the location of the terminator markers from the DRACO images, the a/b ratio of Dimorphos is between 1.11 and 1.00, which corresponds to a B-axis extent between 159 and 176 m. We did not adopt a/b = 1.11 because the rendered triaxial ellipsoid is smooth, whereas the asteroid has rocks and other smaller-scale features that stand above the background and reflect light or cast shadows. The terminator position in the rendered image should therefore lie slightly sunward of the terminator markers. To investigate the a/b ratio more finely, we made a set of ellipsoids where the B-axis extent decreased in 4 m increments. This distance was convenient because 4 m was the 1σ of the uncertainty reported on the B-axis extent of the preliminary model. For the updated model, we decreased the B-axis extent of the starting ellipsoid by 4 m. The starting ellipsoid for the updated model had a/b = 1.04.

Figure 6. Terminator position as a function of asteroid elongation. (a) The last DRACO image to contain all of Dimorphos (dart_0401930039_14119_01_iof.fits), with overlays as described in Figure 5. (b)–(j) Simulated images of triaxial ellipsoids with different a/b ratios. The tips of the blue arrows show the positions of terminator markers. Panel (h) shows the starting ellipsoid for the updated model. Panel (i) shows the starting ellipsoid for the preliminary model.
Download figure:
Standard image High-resolution imageTo understand whether libration might affect the interpretation of the terminator in DRACO images—specifically whether a prolate, librating asteroid might masquerade as an oblate one—we simulated DRACO images of an ellipsoid with a/b = 1.25 that has been rotated toward and away from the DRACO boresight in 10° increments (Figure 7). This method simulates what would be seen if Dimorphos were librating at the time of impact. A librating sphere would look the same in all images. The more elongated an object is, the more its appearance would change in DRACO images as a result of libration. A value of a/b = 1.25 is reasonable for the following reasons. An analysis of ground-based lightcurves taken in 2022 July gives a formal 3σ upper limit of Dimorphos's preimpact a/b = 1.13 (P. Pravec, personal communication). Using a slightly larger value (a/b = 1.25) provides a hedge for any systematic errors that might be present and not accounted for in the formal limit. The forced libration is likely <10° (see Section 2.3.1), and the changes in the terminator position between 0° and −10° indicate that if Dimorphos were librating with the long axis pointing away from DRACO, there might be a slight bias in our assessment of the terminator position toward a more oblate object than reality. However, if the libration was in the opposite sense at the time of impact, we would underestimate how oblate the asteroid was. So, depending on the possible libration angle at the time of impact, one might be fooled into thinking Dimorphos was more or less oblate than it actually is. Because no libration has been directly detected by preimpact observations (Pravec et al. 2022; Scheirich & Pravec 2022), the forced component would be small in amplitude (Section 2.3.1), and the free component would be dampened over a short timescale (Meyer et al. 2023b), we conclude that the terminator assessments reported here are reasonable.
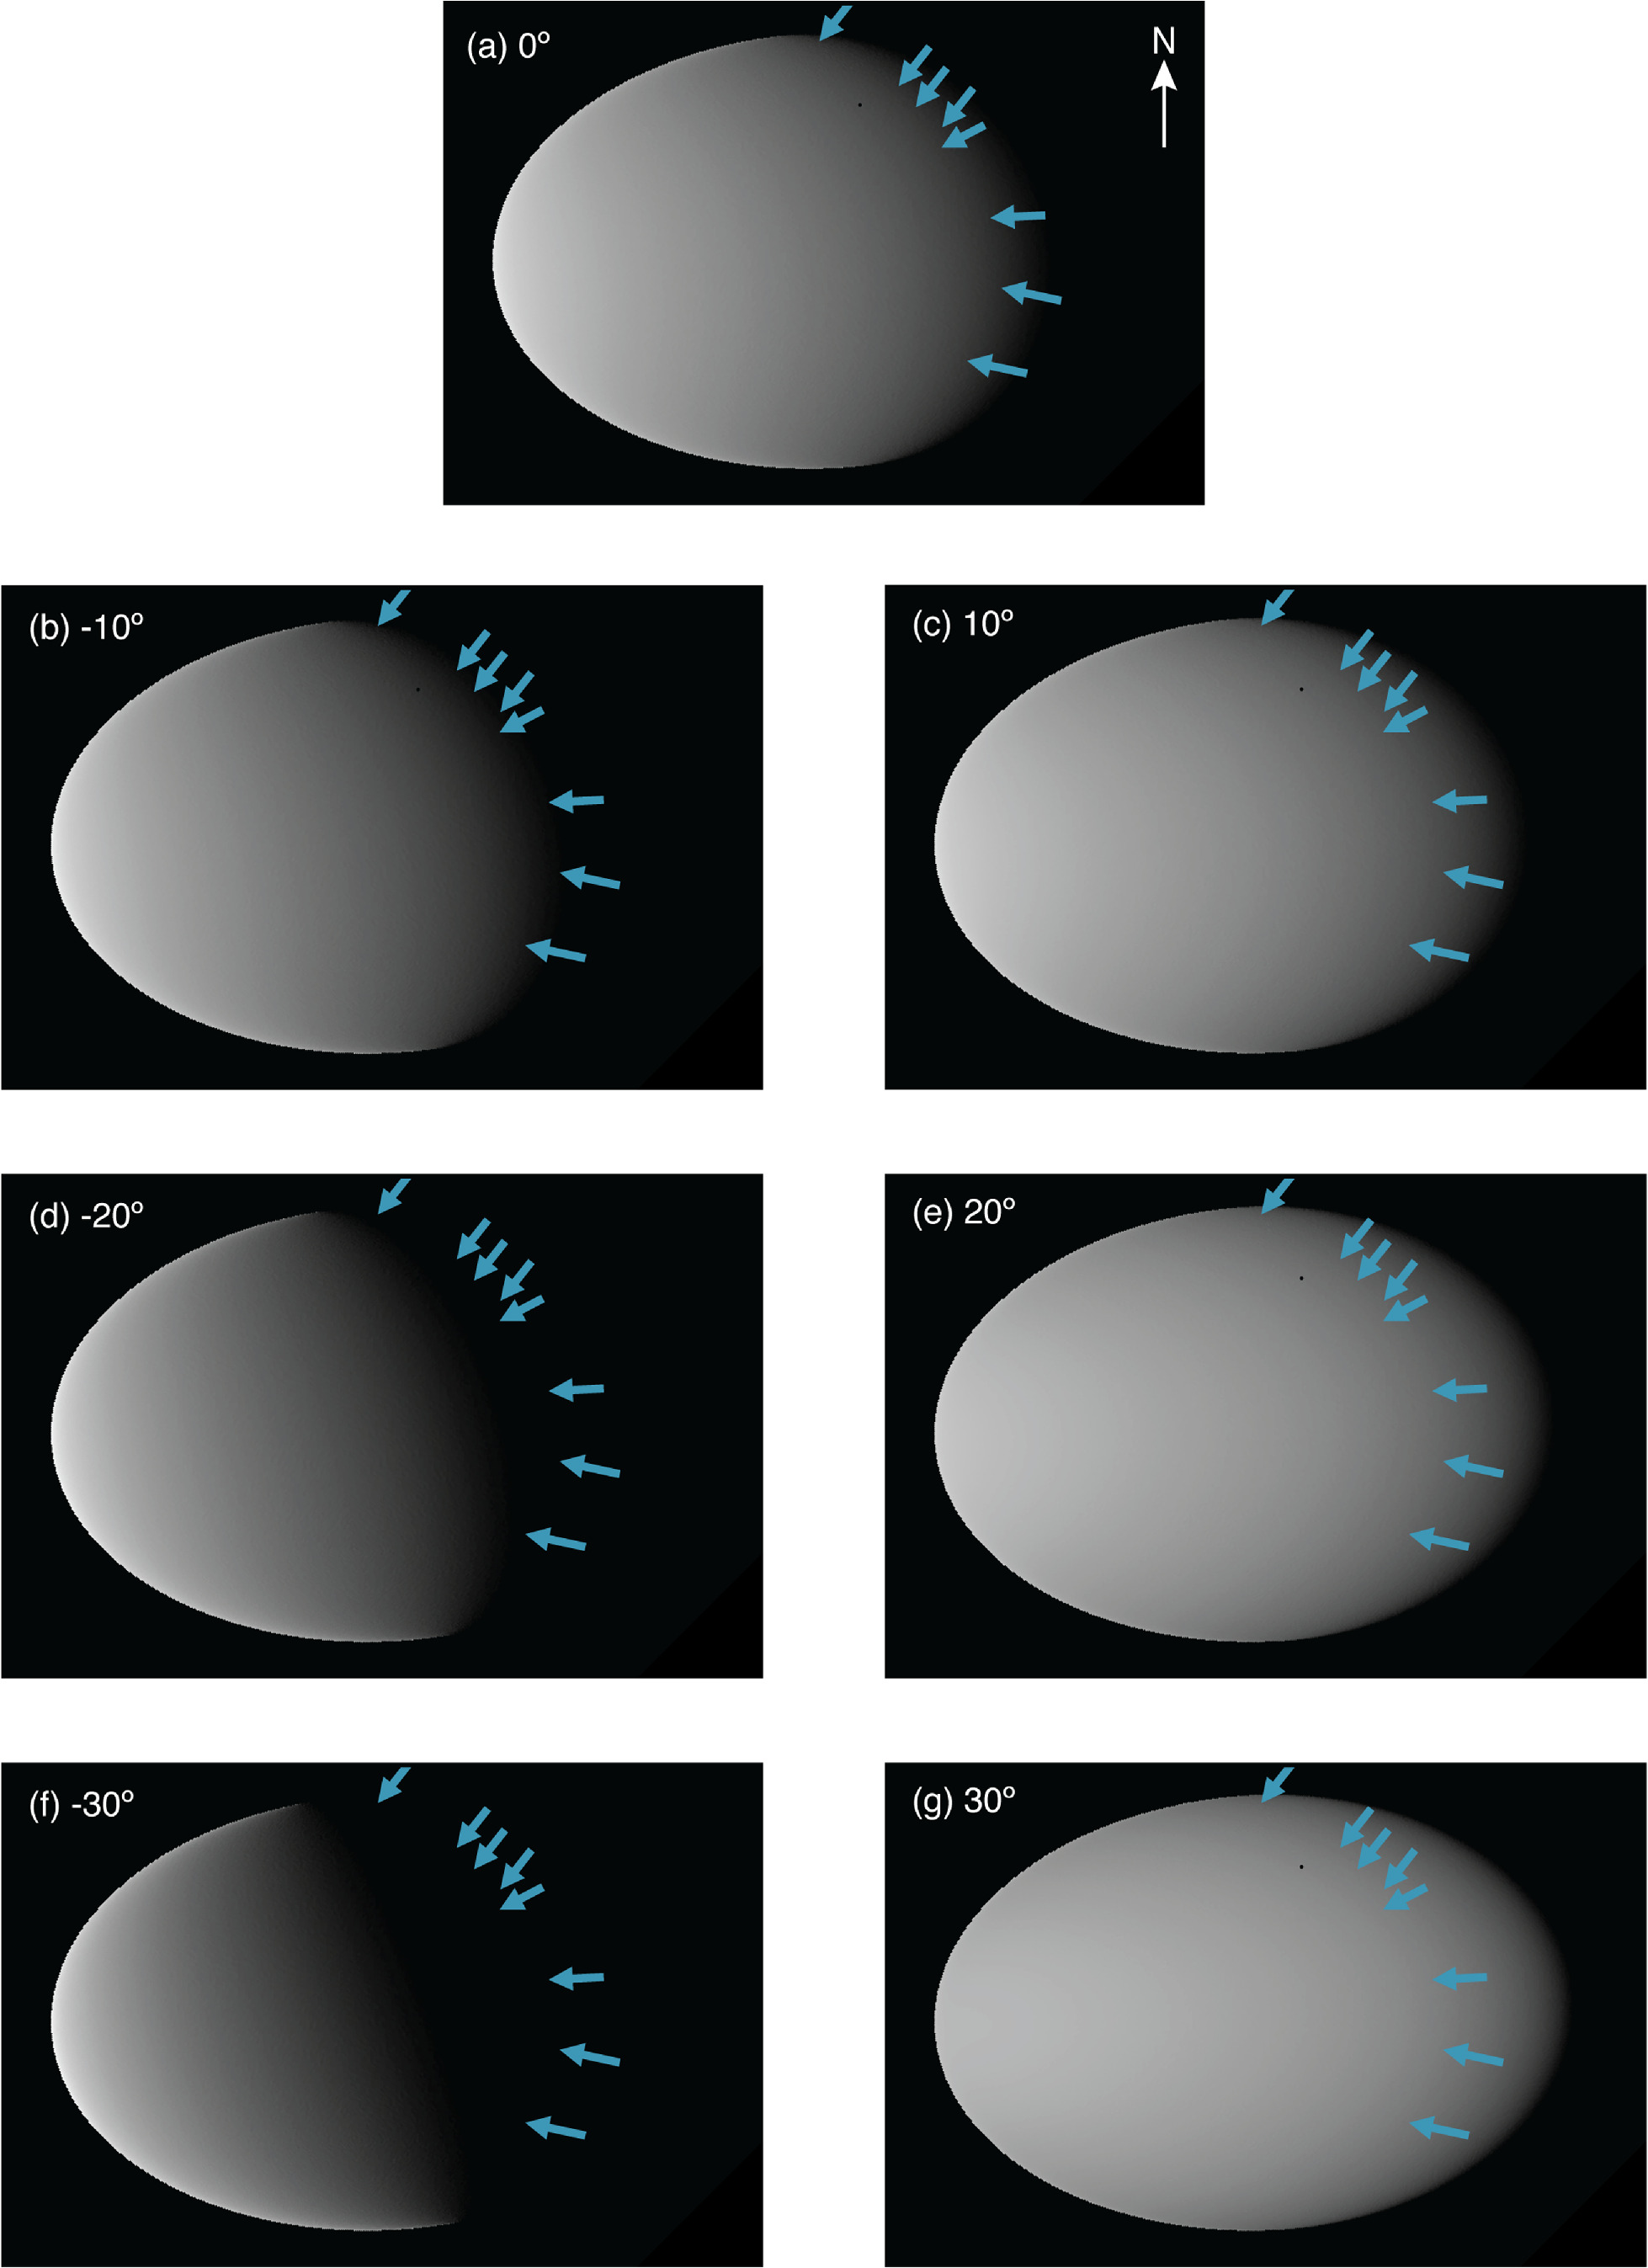
Figure 7. Possible manifestation of libration in DRACO images if an asteroid with a/b = 1.25 had its long axis rotated toward ((a)–(c)) or away from ((e) and (f)) the DRACO boresight by the number of degrees listed on each panel. Panel (d) shows what the image would look like in the absence of libration and corresponds to Figure 6(f).
Download figure:
Standard image High-resolution imageIn summary, the position of the terminator in DRACO images is a useful constraint on the extent of the B axis of Dimorphos for four reasons. First, DRACO viewed the A and C axes with minimal projection effects (assuming tidal locking), so most of the uncertainty in the shape lies in the B direction. Second, the B axis is largely into and out of the image plane, with the tidal-locking assumption. Third, the position of the terminator is known with respect to both the sunlit limb and the Didymos-lit limb. Fourth, the asteroid has a relatively regular profile as seen by DRACO and not a more pathological shape, such as comet 67P. The terminator constraint would not be as reliable without the benefit of scattered light to reveal the dark limb or with a more pathologically shaped object.
2.3.3. The Extent of the B Axis: LUKE Perspective
LUKE images give two general views of Dimorphos (Table 2; Figure 8). The inbound images captured much of the same terrain that DART saw but from higher southern latitudes, with the most poleward view occurring at ∼59°S. However, the pervasive ejecta blocks much of the limb (Figure 8(a)), which makes it impossible to determine where the asteroid limb ends and the ejecta plume begins. The outbound images observed the nonimpact hemisphere, much of which was in darkness during the LICIACube flyby, from latitudes ∼28° to 39°S. In this sequence, a dark band that has been posited as a shadow (Cheng et al. 2023b) at the base of the ejecta (as opposed to a detached curtain) occurs between the ejecta plume and the limb of Dimorphos (Figure 8(b)). If that is true, then the shadow blocked some lit parts of the body from view, and the edge seen in the image is not the true limb of the object.
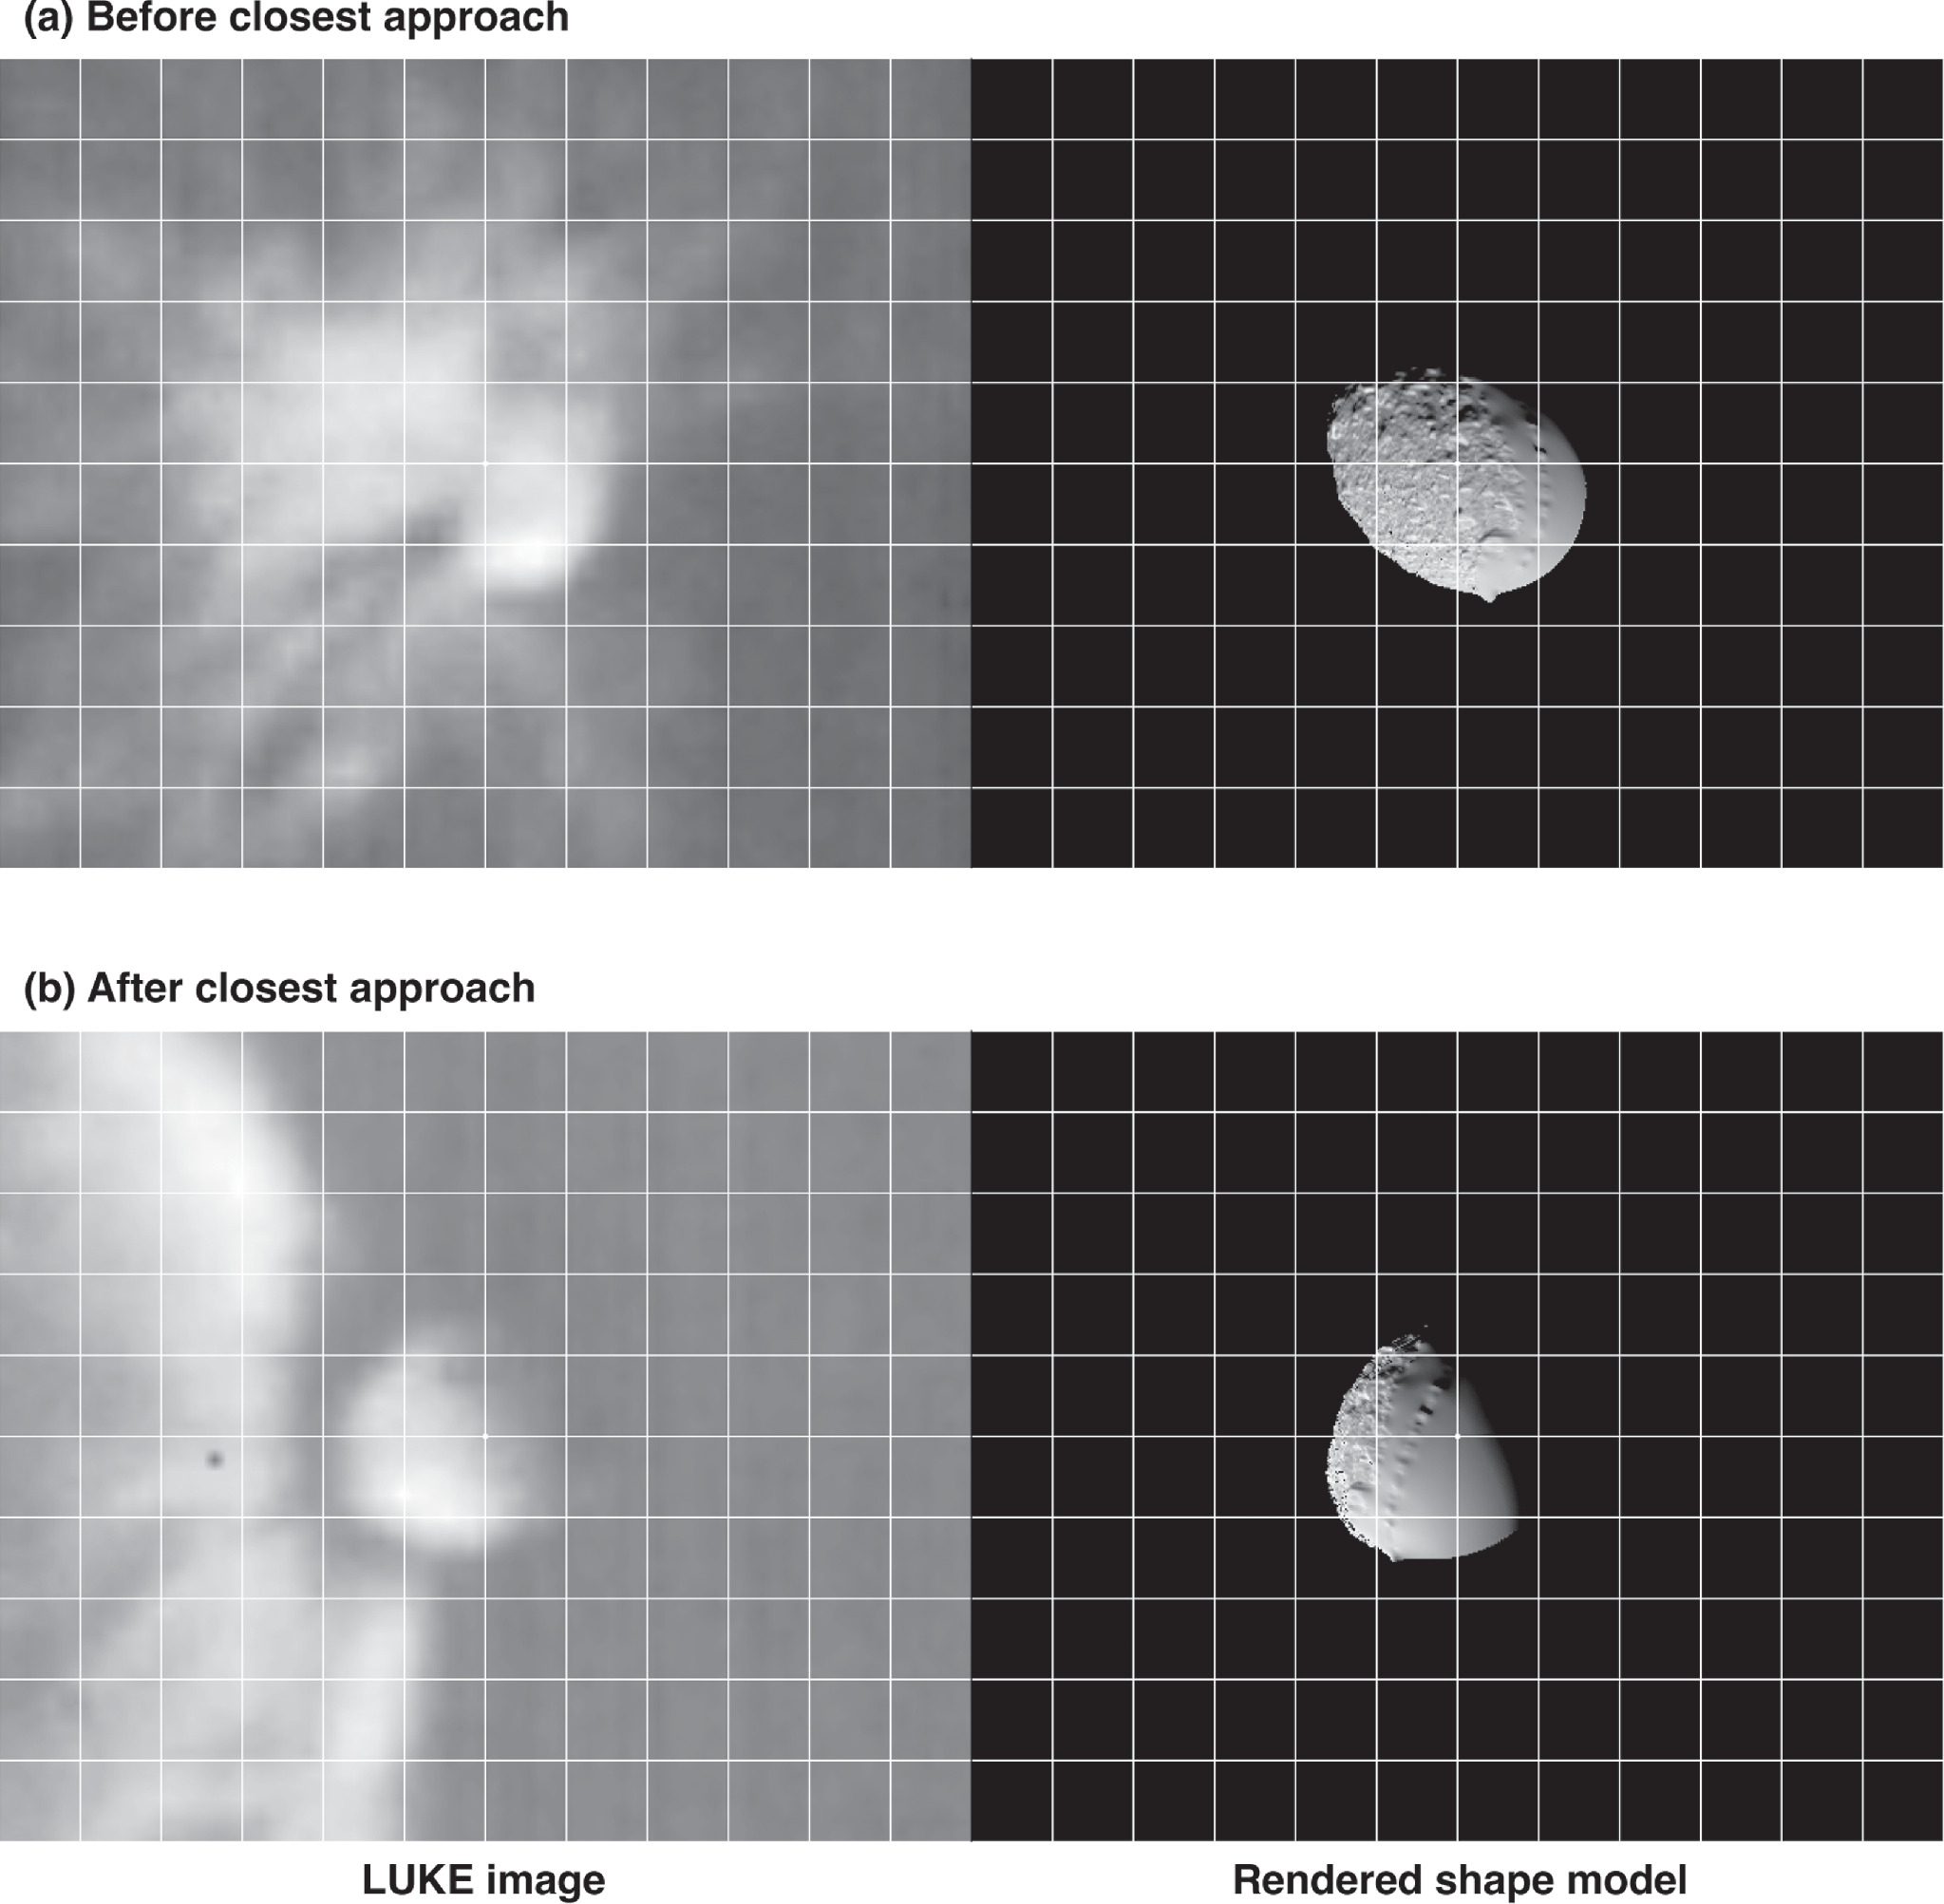
Figure 8. Dimorphos as seen by LUKE. The left column shows a window from two LUKE images: one before closest approach and one after closest approach. Ejecta pervades both images. The right column shows a rendering of the updated shape model (without any simulated ejecta). The areas with detailed surface features were imaged by DRACO. (a) An image from before closest approach, which imaged much of the same terrain as DRACO but from a higher southern latitude. (b) The images taken after closest approach view the opposite side of Dimorphos. The top image is a window from liciacube_luke_l2_1664234222_00002_01.fits. The bottom image is a window from liciacube_luke_l2_1664234238_00005_01.fits.
Download figure:
Standard image High-resolution imageTable 2. LUKE Images Assessed in This Study (with DRACO for Reference)
| Image | Time from Impact (s) b | Subspacecraft Latitude (°) c | Subspacecraft Longitude (°E) c | Pixel Scale (m pixel−1) |
|---|---|---|---|---|
| dart_0401930039_14119_01_iof.fits a | −12.41 | −9.30 | 280.00 | 0.37 |
| liciacube_luke_l2_1664234222_00002_01.fits | +157.88 | −53.18 | 252.12 | 6.4 |
| liciacube_luke_l2_1664234223_00005_01.fits | +158.88 | −55.79 | 248.66 | 6.1 |
| liciacube_luke_l2_1664234224_00003_01.fits | +159.88 | −58.54 | 244.29 | 5.8 |
| liciacube_luke_l2_1664234238_00005_01.fits | +173.88 | −41.90 | 122.06 | 5.5 |
| liciacube_luke_l2_1664234239_01003_01.fits | +174.88 | −38.66 | 119.83 | 5.8 |
| liciacube_luke_l2_1664234240_00002_01.fits | +175.88 | −35.67 | 117.96 | 6.1 |
| liciacube_luke_l2_1664234241_00007_01.fits | +176.88 | −32.93 | 116.39 | 6.4 |
| liciacube_luke_l2_1664234242_00003_01.fits | +177.88 | −30.43 | 115.04 | 6.7 |
| liciacube_luke_l2_1664234243_00002_01.fits | +178.88 | −28.16 | 113.87 | 7.1 |
Notes.
a This is the finest-scale image that contains all of Dimorphos. All of the listed LUKE images contain all of Dimorphos, which is why this particular DRACO image is listed as a point of reference. The final complete image returned by DART fills the field of view and was taken 1.818 s before impact with a pixel scale of 5.5 cm. b The DRACO image was taken this many seconds before impact (hence the negative sign); the LUKE images were taken this many seconds after impact (hence the positive sign). c Calculated using the following pole for Dimorphos: BODY120065803_POLE_RA = (65.011802585236623, 0, 0); BODY120065803_POLE_DEC = (−73.109411393975080, 0, 0). These values are slightly different from the ones used to build the shape model and are from a more recent orbit solution.Download table as: ASCIITypeset image
Following the same approach we used for DRACO, we rendered ellipsoids with fixed A and C axes but a variety of B axes and compared them to LUKE images. However, there are caveats to this approach that did not apply to the DRACO assessments. First, Dimorphos is only ∼25 to ∼30 pixels across in the best LUKE images. Second, as noted earlier, optically thick ejecta obscures or may cast a shadow on the limb of Dimorphos, depending on the image. Third, scattered light off the ejecta affects brightness across the scene. Fourth, all axes are seen with foreshortening. LUKE did not image Dimorphos from the south pole, which would have been a direct measurement of the B-axis extent, because Dimorphos left the LUKE field of view during part of the flyby.
The comparisons between rendered ellipsoids and LUKE images (from a different point of view than DRACO; Table 2) are consistent with an oblate shape, assuming tidal locking (Figure 9). In the more elongated ellipsoids (e.g., Figures 9(a)–(d)), the lit terrain is much closer to a crescent than is seen in the actual image. Qualitatively, the lit terrain shown in Figure 9 is more similar to an ellipsoid with a/b = 1 than to more elongated ellipsoids (e.g., compare the dashed yellow line in Figure 9(g) against the terminator positions in panels (a)–(f)). This result is consistent with the finding from the DRACO terminator assessments that indicate the a/b is close to 1. This result is also consistent with the axial ratios determined from assessments of the dark side of Dimorphos as seen by LUKE (A. Zinzi et al. 2023, in preparation), although the dark-side assessments do not entirely rule out other possibilities. The LUKE assessment makes a case for a/b being closer to 1 than to 1.11 because with a/b = 1.11, the lit terrain has more of a crescent shape than is seen in the actual image.
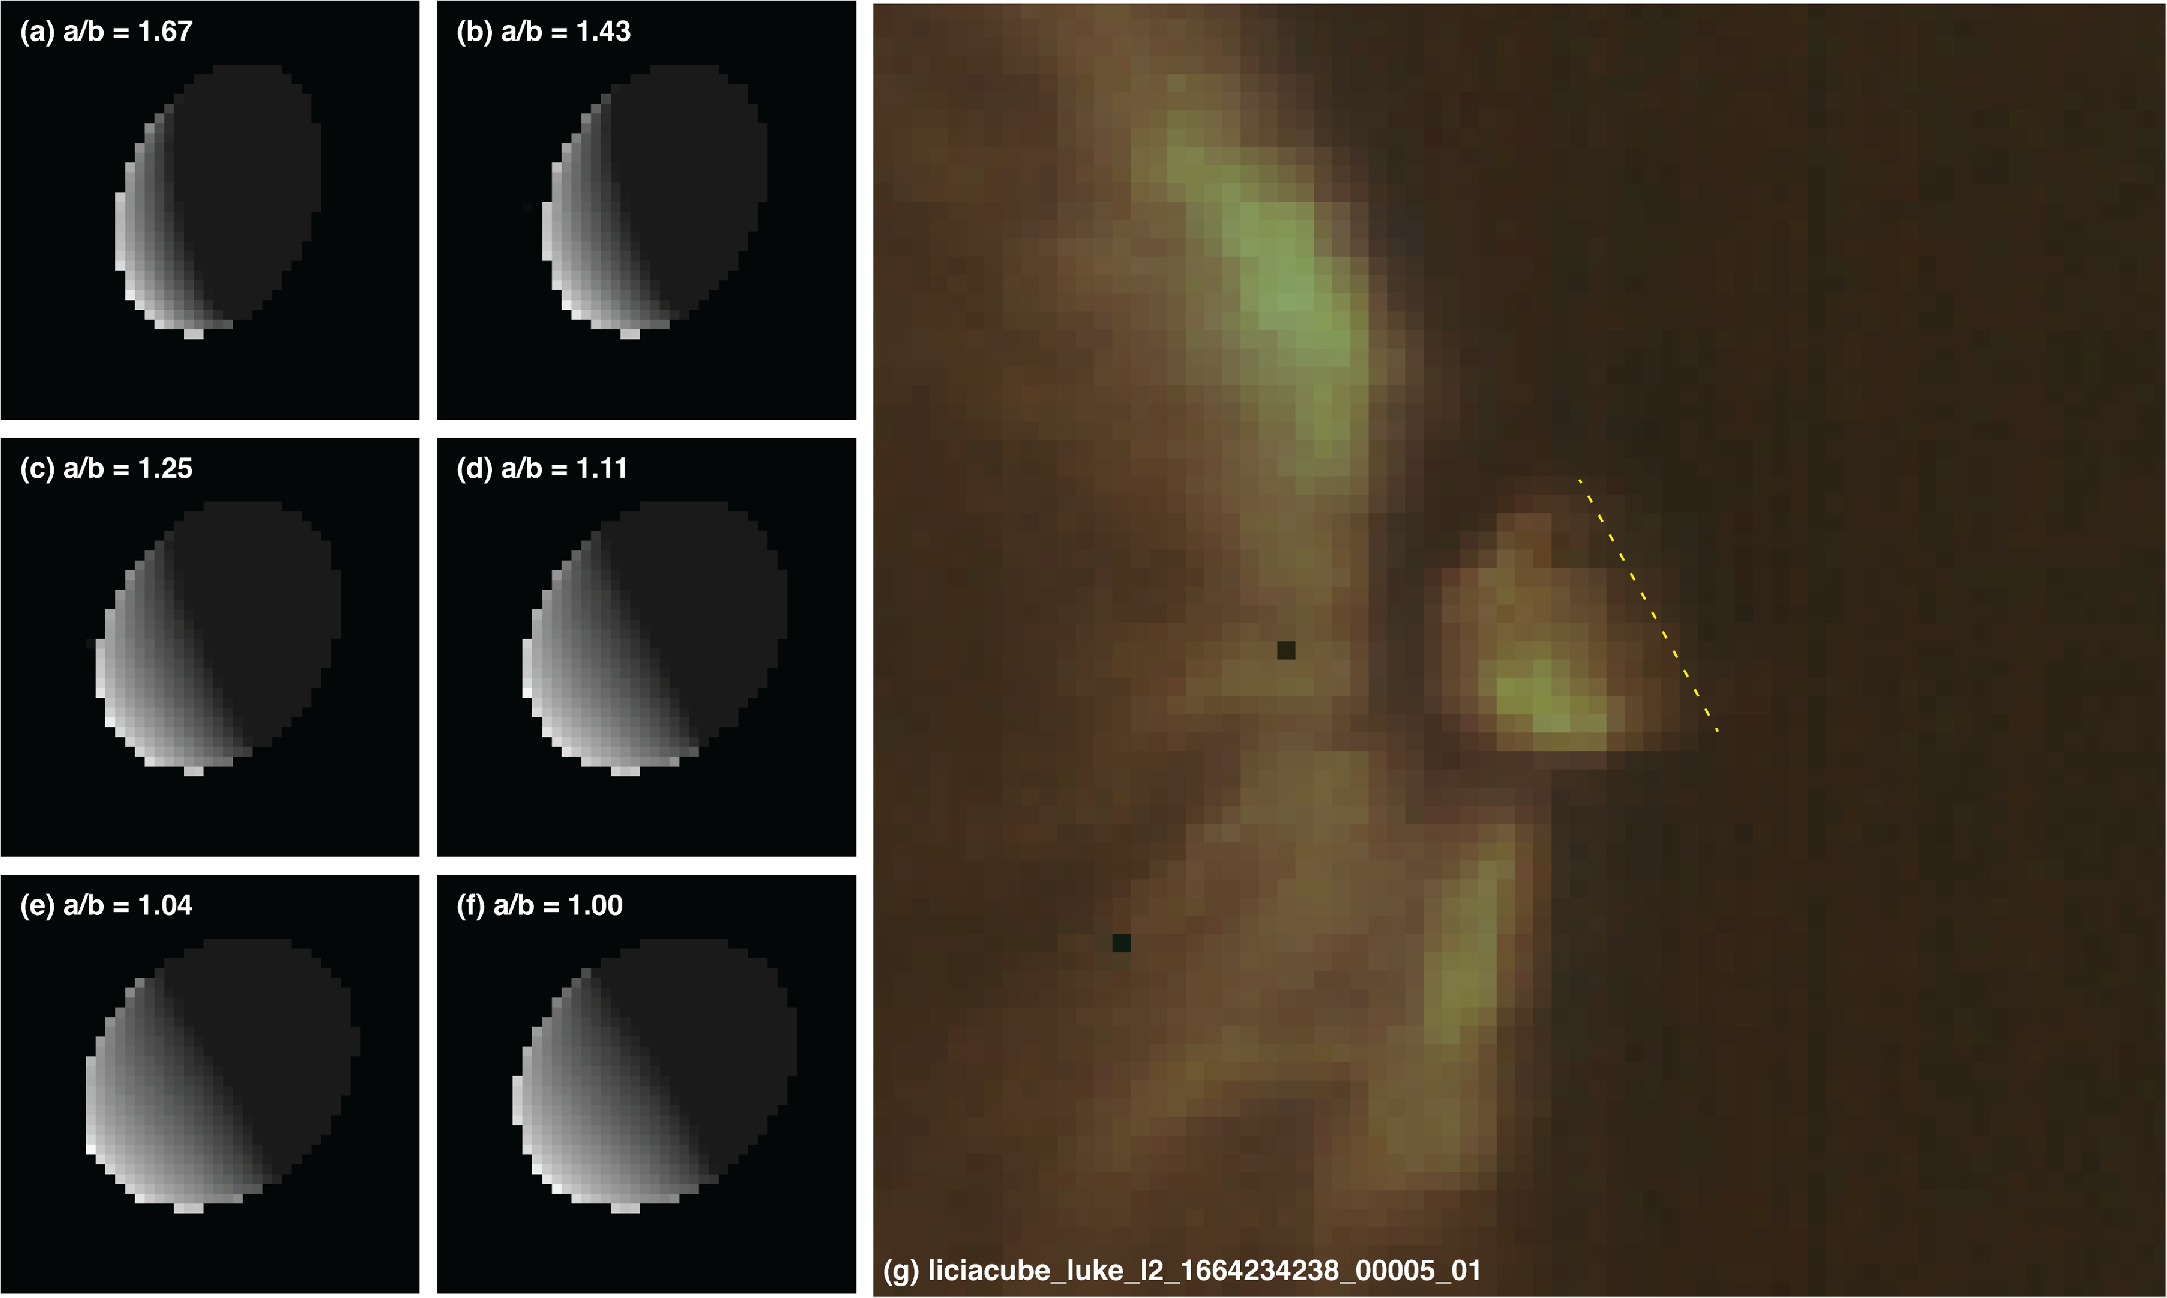
Figure 9. A simulated LUKE image vs. an actual LUKE image. Panels (a)–(f) show renderings of triaxial ellipsoids with the same lighting and viewing geometry as LUKE image liciacube_luke_l2_1664234238_00005_01.fits. The ellipsoids have fixed A and C axes but variable B axes. Panel (g) shows a window centered on Dimorphos from the real, calibrated LUKE image. Ejecta are present in the LUKE image. A dashed yellow line indicates the approximate location of the terminator. Qualitatively, the extent of the lit terrain in the LUKE image is most consistent with the rendered ellipsoid with an a/b closer to 1 than to 1.11. For more elongated ellipsoids, the lit terrain has a crescent-like shape that is not seen in the LUKE image. Panel (e) shows the starting ellipsoid that was used for the updated model.
Download figure:
Standard image High-resolution image2.4. Refinement of the Starting Ellipsoid via Limb Information
Prior to tiling Dimorphos with maplets, we used limb information to refine the starting ellipsoid. Both the preliminary and updated models were influenced by limb vectors from DRACO images. In the case of the preliminary model, these limb points were automatically identified by an SPC program called limber. That program searches along a vector normal to the surface of the starting model until it encounters a strong brightness contrast that is interpreted as a limb point. That limb point is then turned into a body-fixed vector. The program does not identify points on the dark, Didymos-lit limb. For the updated model, we used a new SPC program called darthLimber. That program allows users to manually record the pixel/line locations of limb points in an image, and then the program converts that information into the body-fixed vectors that SPC needs. This approach allowed us to incorporate limb points from both the sunlit and Didymos-lit limbs into the updated shape model.
Once the limb points were identified, we used an updated procedure to incorporate the limb information to refine the starting ellipsoid. For the preliminary model, we relied on a SPC program called vecs2cube, which combines the limb vectors with the vectors that define the starting ellipsoid to create a new shape model. That approach creates a single, narrow ridge or valley in the ellipsoid (depending on whether the ellipsoid is too short or too tall in a particular area), which is not physically realistic. For the updated model, we used a SPC program called densify to incorporate the limb vectors into the shape. That program is typically used to unite an ensemble of maplets into a global shape model, but it also includes an option to condition the slope-to-heights integration using limb information. We refined the starting ellipsoid for the final model by running densify to do a slope-to-heights integration conditioned by the limb vectors only. A set of anchor maplets with the same heights as the shape model ensured that densify only changed the starting ellipsoid in the areas with limb information. This approach avoided the narrow, artificial ridge or valley in the shape model created by vecs2cube, improved the agreement of the shape model to the DRACO limb, and did so without affecting any other areas of the ellipsoid. Figure 10 compares the starting ellipsoid (left) with the initial limb-based shape model used for the final model (right). The initial limb-based shape was then used as the basis for maplet tiling.

Figure 10. Improvements to the starting shape model based on limb information. Renderings of (a) the starting triaxial shape and (b) the limb-based shape overlaid on the final DRACO image to contain all of Dimorphos (dart_0401930039_14119_01_iof.fits). The yellow outlines show the limb location for each shape model. Fine white dots show the location of the limb in the DRACO image. Gaps between the yellow outline and white dots show mismatches between the shape and the image. White arrows indicate specific areas where the shape model improved (that is, became a better match to images) as a result of incorporating the sunlit and Didymos-lit limb information.
Download figure:
Standard image High-resolution image3. Results
Figure 11 shows the updated shape model as viewed along its principal axes. Standard maplets cover 32% of the model, and these areas have the highest-quality topography. This figure is the equivalent of Extended Data Figure 1 in Ernst et al. (2023) but for the updated model. Figure 12 compares the finest-scale DRACO image to contain all of the body to the preliminary and updated models. The updated model is a better match to the image, particularly with respect to the dark, Didymos-lit limb; the heights and shapes of large boulders along both the sunlit and Didymos-lit limbs; and the representation of knobs of topography along the terminator. It is slightly more elongated (larger a/b ratio) than the preliminary model. The axial ratios of the updated model (as well as those of the preliminary model) are fully consistent with the axial ratios derived by analysis of LUKE images of the nonimpact side of Dimorphos reported by A. Zinzi et al. (2023, in preparation). Note that neither the preliminary nor updated model include the large, rectangular boulder near the Didymos-lit limb. We attempted to incorporate the height of this boulder into the updated shape model. But there was not enough information in the images to determine the full extent of the boulder, as so much of it was in the dark.

Figure 11. The updated Dimorphos shape model as viewed along its six principal axes. The gray areas are covered by maplets and have the best-constrained topography. The blue and magenta points show the location of the limb points that are sunlit and Didymos-lit, respectively. The yellow areas of the model are poorly constrained because they were not directly imaged by DART but rather constrained by the terminator position in DRACO images. The black star marks the location of the impact site.
Download figure:
Standard image High-resolution image
Figure 12. Renderings of (a) the preliminary shape model and (c) the updated shape model compared to (b) the final DRACO image to contain all of Dimorphos (dart_0401930039_14119_01_iof.fits). White lines mark the limb. The stars, circles, and arrows indicate areas of notable change between the two shape models. All of the symbols are at the same location with respect to the image or rendered model, so offsets between the shapes and the renderings vs. the positions of the shapes relative to the DRACO image indicate errors in the shape models. The updated shape model has improved boulders along the sunlit limb (e.g., Dhol, marked by a magenta star), improved limbs along the dark side of the asteroid (cyan circles), and fine-scale details of knobs of lit terrain that lie beyond the terminator (yellow arrows).
Download figure:
Standard image High-resolution imageIn order to quantify the differences between the preliminary and updated models, we calculated the optimal rigid-body transformations (rotation and translation) to minimize the rms differences between them and applied these transformations prior to the calculation. Comparing the transformed models is appropriate due to the slightly different solutions for the pole and prime meridian, which led to a rotation between the models. The vector to optimally translate the preliminary model to align with the updated model is (−60.3200899, −57.9099328, −35.5212888 cm) in X, Y, and Z. After that translation, the preliminary model was rotated by 1 21298948 about the XYZ-axis (960.697829, −73.3131902, 267.740279 m).
Figure 13 shows the differences calculated between the two models. We found a median difference of 56 cm and rms difference of 140 cm between the two models. The largest differences occur in the areas where the Didymos-lit limb was used to refine the starting ellipsoid (see also Figure 10). Systematic differences also exist along the B axis of the shape model (as seen in the views from 90° to 270°E in Figure 13), which is as expected given that the starting ellipsoid used for the updated model was 4 m smaller in B extent than the ellipsoid used for the preliminary model. The updated model is, on average, slightly smaller (−2.8% change in volume), primarily due to the removal of excessive material along the Didymos-lit limb and the slightly smaller B axis used in the starting ellipsoid. Table 3 summarizes the quantitative differences between the preliminary and updated models.
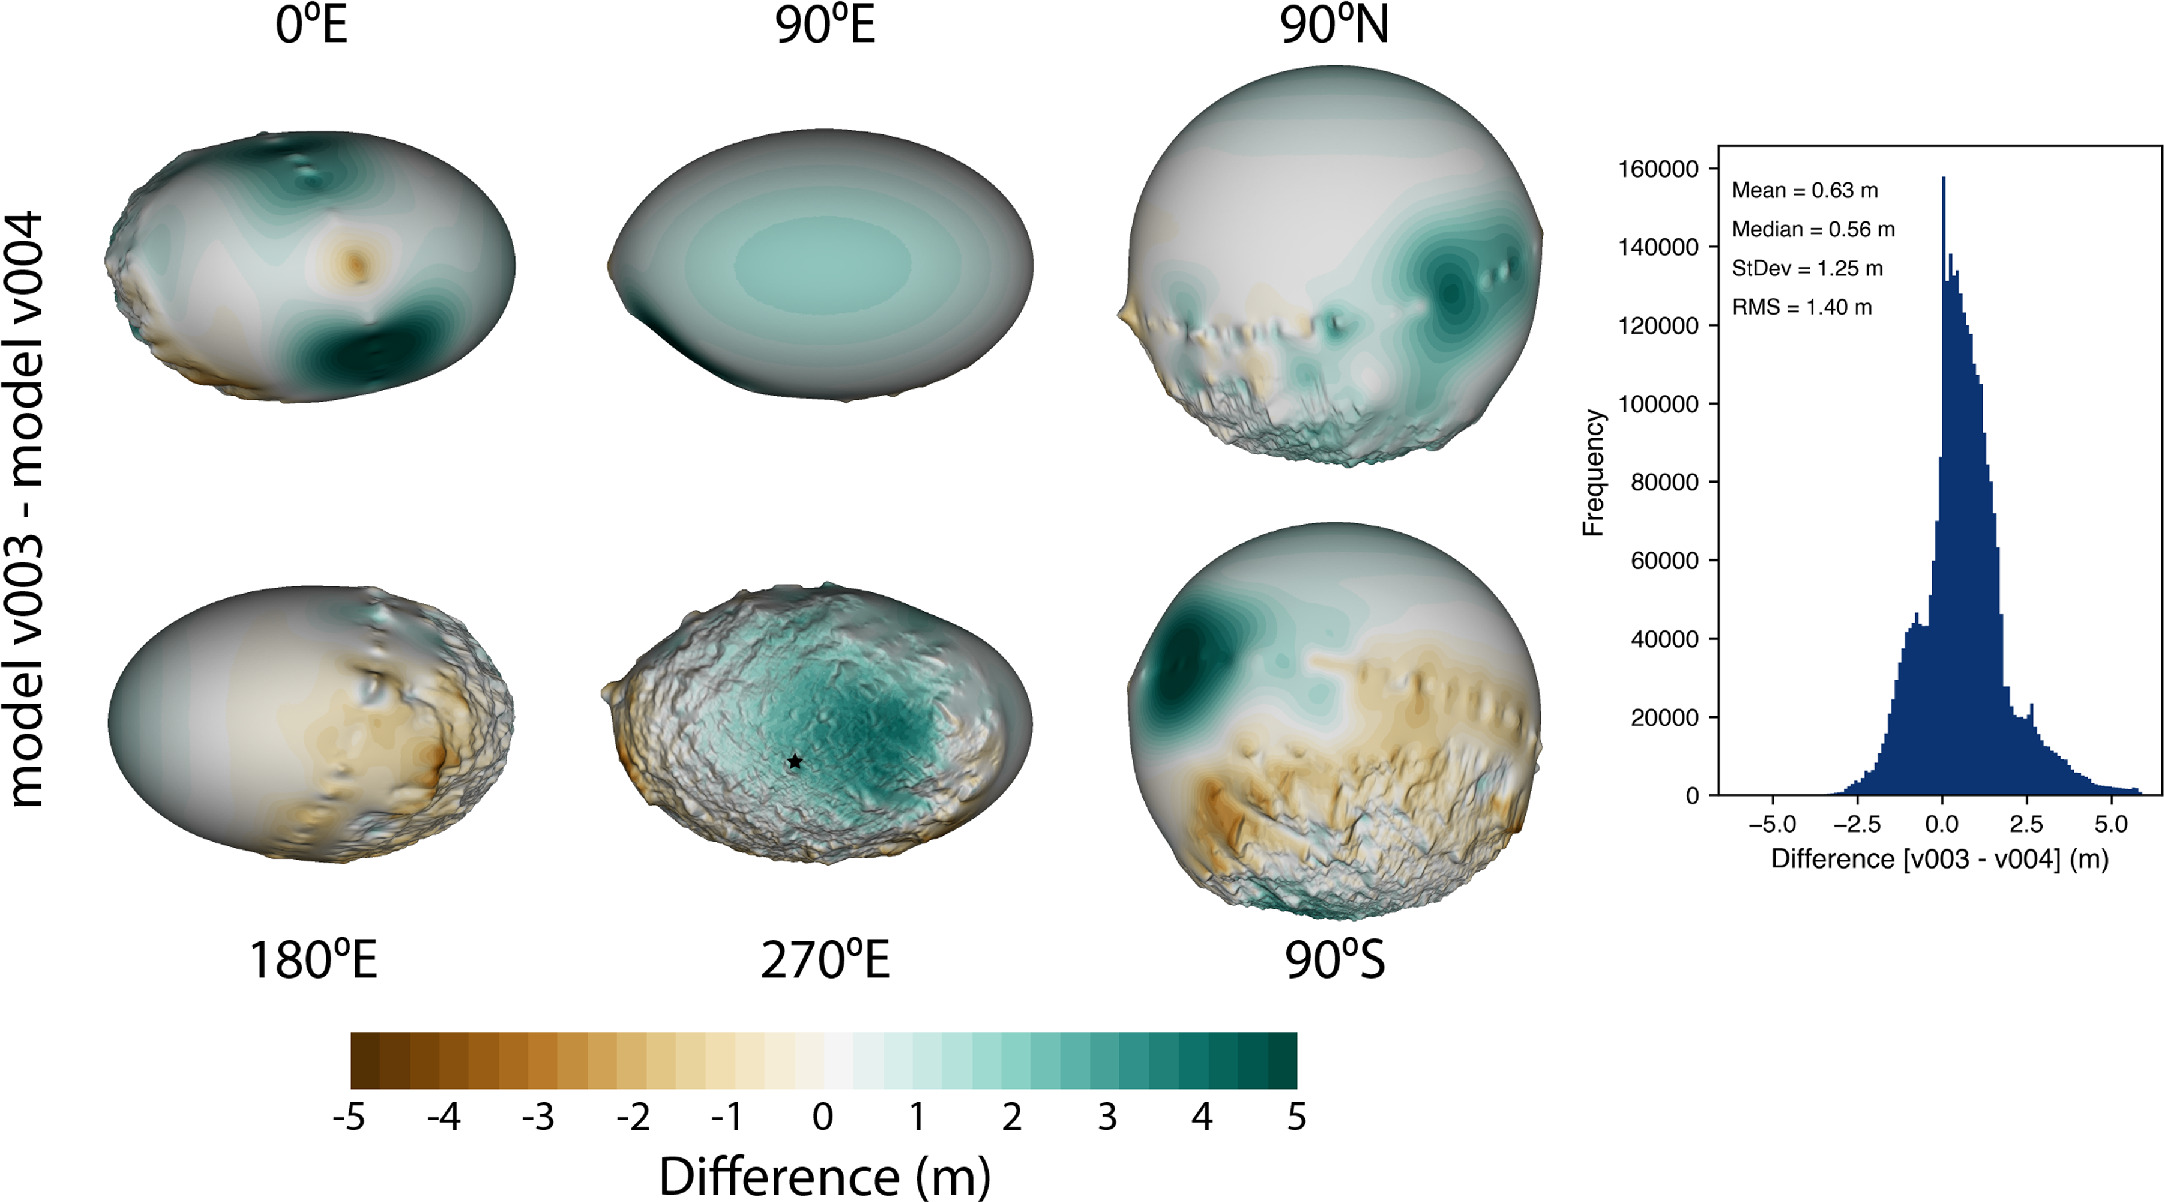
Figure 13. Difference between the preliminary and updated global shape models of Dimorphos. Areas that show up as white or ivory changed relatively little between the two models. In brown areas, the preliminary model is larger than the updated model. In green areas, the preliminary model is smaller than the updated model. The updated model is, on average, slightly smaller (−2.8% change in volume). The black star in the 270°E view marks the impact site.
Download figure:
Standard image High-resolution imageTable 3. Comparison between the Preliminary and Updated Dimorphos Shape Models
| Item | Preliminary Model | Final Model | Difference (%) |
|---|---|---|---|
| Volume (m3) | 1,810,000 ± 10 | 1,760,000 ±5 | −2.8 |
| Surface area (m2) | 75,800 | 74,700 | −1.5 |
| Global model GSD (cm) a | 25 | 24.3 d | −2.8 |
| A-axis extent of model (m) | 177 ± 2 | 179 ± 1 | 1.1 |
| B-axis extent of model (m) | 174 ± 4 | 169 ± 4 | −2.9 |
| C-axis extent of model (m) | 116 ± 2 | 115 ± 1 | −0.9 |
| a/b b for model extent | 1.02 ± 0.03 | 1.06 ± 0.03 | 4.1 |
| b/c for model extent | 1.50 ± 0.04 | 1.47 ± 0.04 | −2.0 |
| a/c for model extent | 1.53 ± 0.03 | 1.56 ± 0.02 | 2.0 |
| A-axis extent of best-fit ellipsoid (m) c | 174 ± 2 | 173 ± 1 | −0.6 |
| B-axis extent of best-fit ellipsoid (m) | 173 ± 4 | 170 ± 4 | −1.7 |
| C-axis extent of best-fit ellipsoid (m) | 114 ± 2 | 113 ± 1 | −0.9 |
| a/b for best-fit ellipsoid | 1.01 ± 0.03 | 1.02 ± 0.02 | 1.2 |
| b/c for best-fit ellipsoid | 1.52 ± 0.04 | 1.49 ± 0.04 | −2.0 |
| a/c for best-fit ellipsoid | 1.53 ± 0.03 | 1.52 ± 0.02 | −0.7 |
| Volume-equivalent diameter (m) | 151 ± 5 | 150 ± 2.5 | −0.7 |
Notes.
a The global model is overresolved in areas without maplets and underresolved in areas with maplets with finer GSDs than the GSD of the global model (e.g., Figure 3). b Much of the literature on secondary shapes refers to axial ratios in terms of lowercase a, b, and c, and we adopt that convention here. c Determined using a least-squares minimization method to determine the coefficients of an ellipsoid after first resampling the starting shape to a uniform grid in latitude/longitude. d This global GSD is slightly smaller than in the preliminary model due to the slightly smaller B-axis.Download table as: ASCIITypeset image
3.1. Shape Model Uncertainties and Error Assessments
Several approaches exist to assess the uncertainties in global shape models. Here we use three methods based on work done by Daly et al. (2022, 2023): an internal SPC metric, quantitative comparisons between DRACO images and renderings of the shape model, and lessons learned from preimpact shape modeling tests.
SPC has an internal metric called the rms residual that can be used to assess model quality (Asad et al. 2021). Due to the single viewing geometry associated with DRACO images, the formal uncertainty metric (Weirich et al. 2022) is not a reliable indicator. The rms residual is a measure of the self-consistency of the maplet vectors, pixel-line locations of the maplet vectors in the images, and overlaps between maplets (Al Asad et al. 2021). The rms residual also accounts for the location of limb points in maplets, but none of the standard SPC maplets contain limb points, so that part of the calculation is not relevant for the Dimorphos model. The rms residual for the updated model is 3.9 cm (Figure 14). The distribution of the rms residual per maplet has a long tail, with most of the maplets having an rms residual of <2 cm. The rms residual for the preliminary model was 3.6 cm, but the distribution was much less skewed. The majority of maplets in the updated model have smaller rms residuals than the maplets in the preliminary model. The rms residual is slightly higher for the final model for two reasons. First, we extended maplet coverage as far as possible toward the limb—without extending any standard maplets beyond it—to maximize the extent covered by maplets. That approach meant tolerating emission angles in maplets that were as high as ∼75°, which is higher than the more typical 50°–60° cutoff for emission angles that has been used for models with a broader range of available data (e.g., Bennu). For these high-emission-angle images, small changes in the body-fixed position of a maplet lead to larger changes in the pixel/line location of the maplet vector in the image, which then leads to a higher rms residual. Second, we extended maplet coverage into more heavily shadowed regions along the terminator. Substantial portions of these maplets are in the dark. As a result, fewer features exist in these images for SPC to use for image alignment, and the residuals are higher. Given the limited number of DART images that were fine-scale enough to use in SPC modeling of Dimorphos, extracting everything possible from the available images took priority over conforming to ideal SPC emission angle and maplet illumination cutoffs. The rms metric adequately identifies these areas where the model has higher uncertainties.
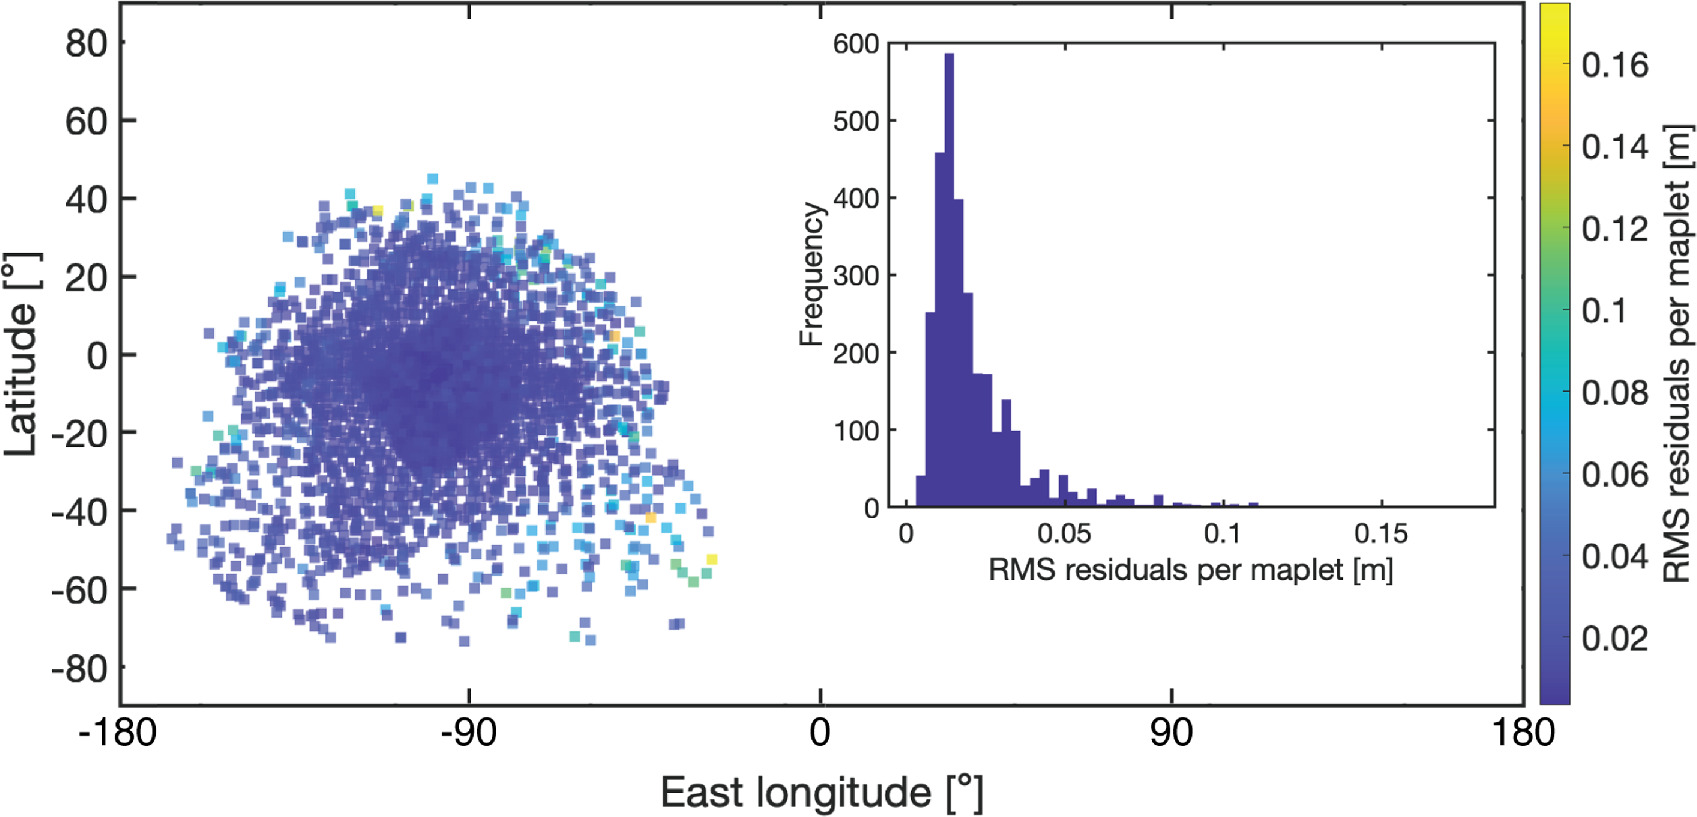
Figure 14. The rms residuals for maplets in the updated Dimorphos shape model. The rms residual is a measure of the internal consistency of the SPC model. The rms residual for the updated model is 3.9 cm, which is smaller than the 5.5-cm pixel scale of the final complete DRACO image used. The maplets with the highest emission angles are located near the limb or along the terminator in places where large shadows cover much of the maplet terrain.
Download figure:
Standard image High-resolution imageFor quantitative comparisons between DRACO images and the rendered shape model, we used the same three approaches as Daly et al. (2023, 2022), which were based on the techniques used to estimate the uncertainties associated with global shape models of Bennu (Al Asad et al. 2021), as well as Phobos and Deimos (Ernst et al. 2023). These approaches are the limb/terminator, keypoint matching, and keypoint distance methods.
The limb/terminator method used image thresholding to identify the limb and terminator in the DRACO image and rendered shape model. This method only considered the sunlit limb. Thresholded images were subtracted, which revealed mismatches between the image and shape model and any size bias in the model (Figure 15). Figure 15(d) shows the sum of the absolute value of the image–model differences, normalized by the image perimeter. The median is the most relevant measure of uncertainty because the distribution is always one-sided and never Gaussian. Figure 15(e) shows the differences in the radii of the equivalent-area circles for the reference image and rendered shape model, respectively. The radius of the equivalent-area circle is the radius of a circle with the same area as the total area of lit terrain on the rendered model or the reference image, respectively. The mean is the relevant measure of uncertainty from this metric because the distribution should be symmetric.
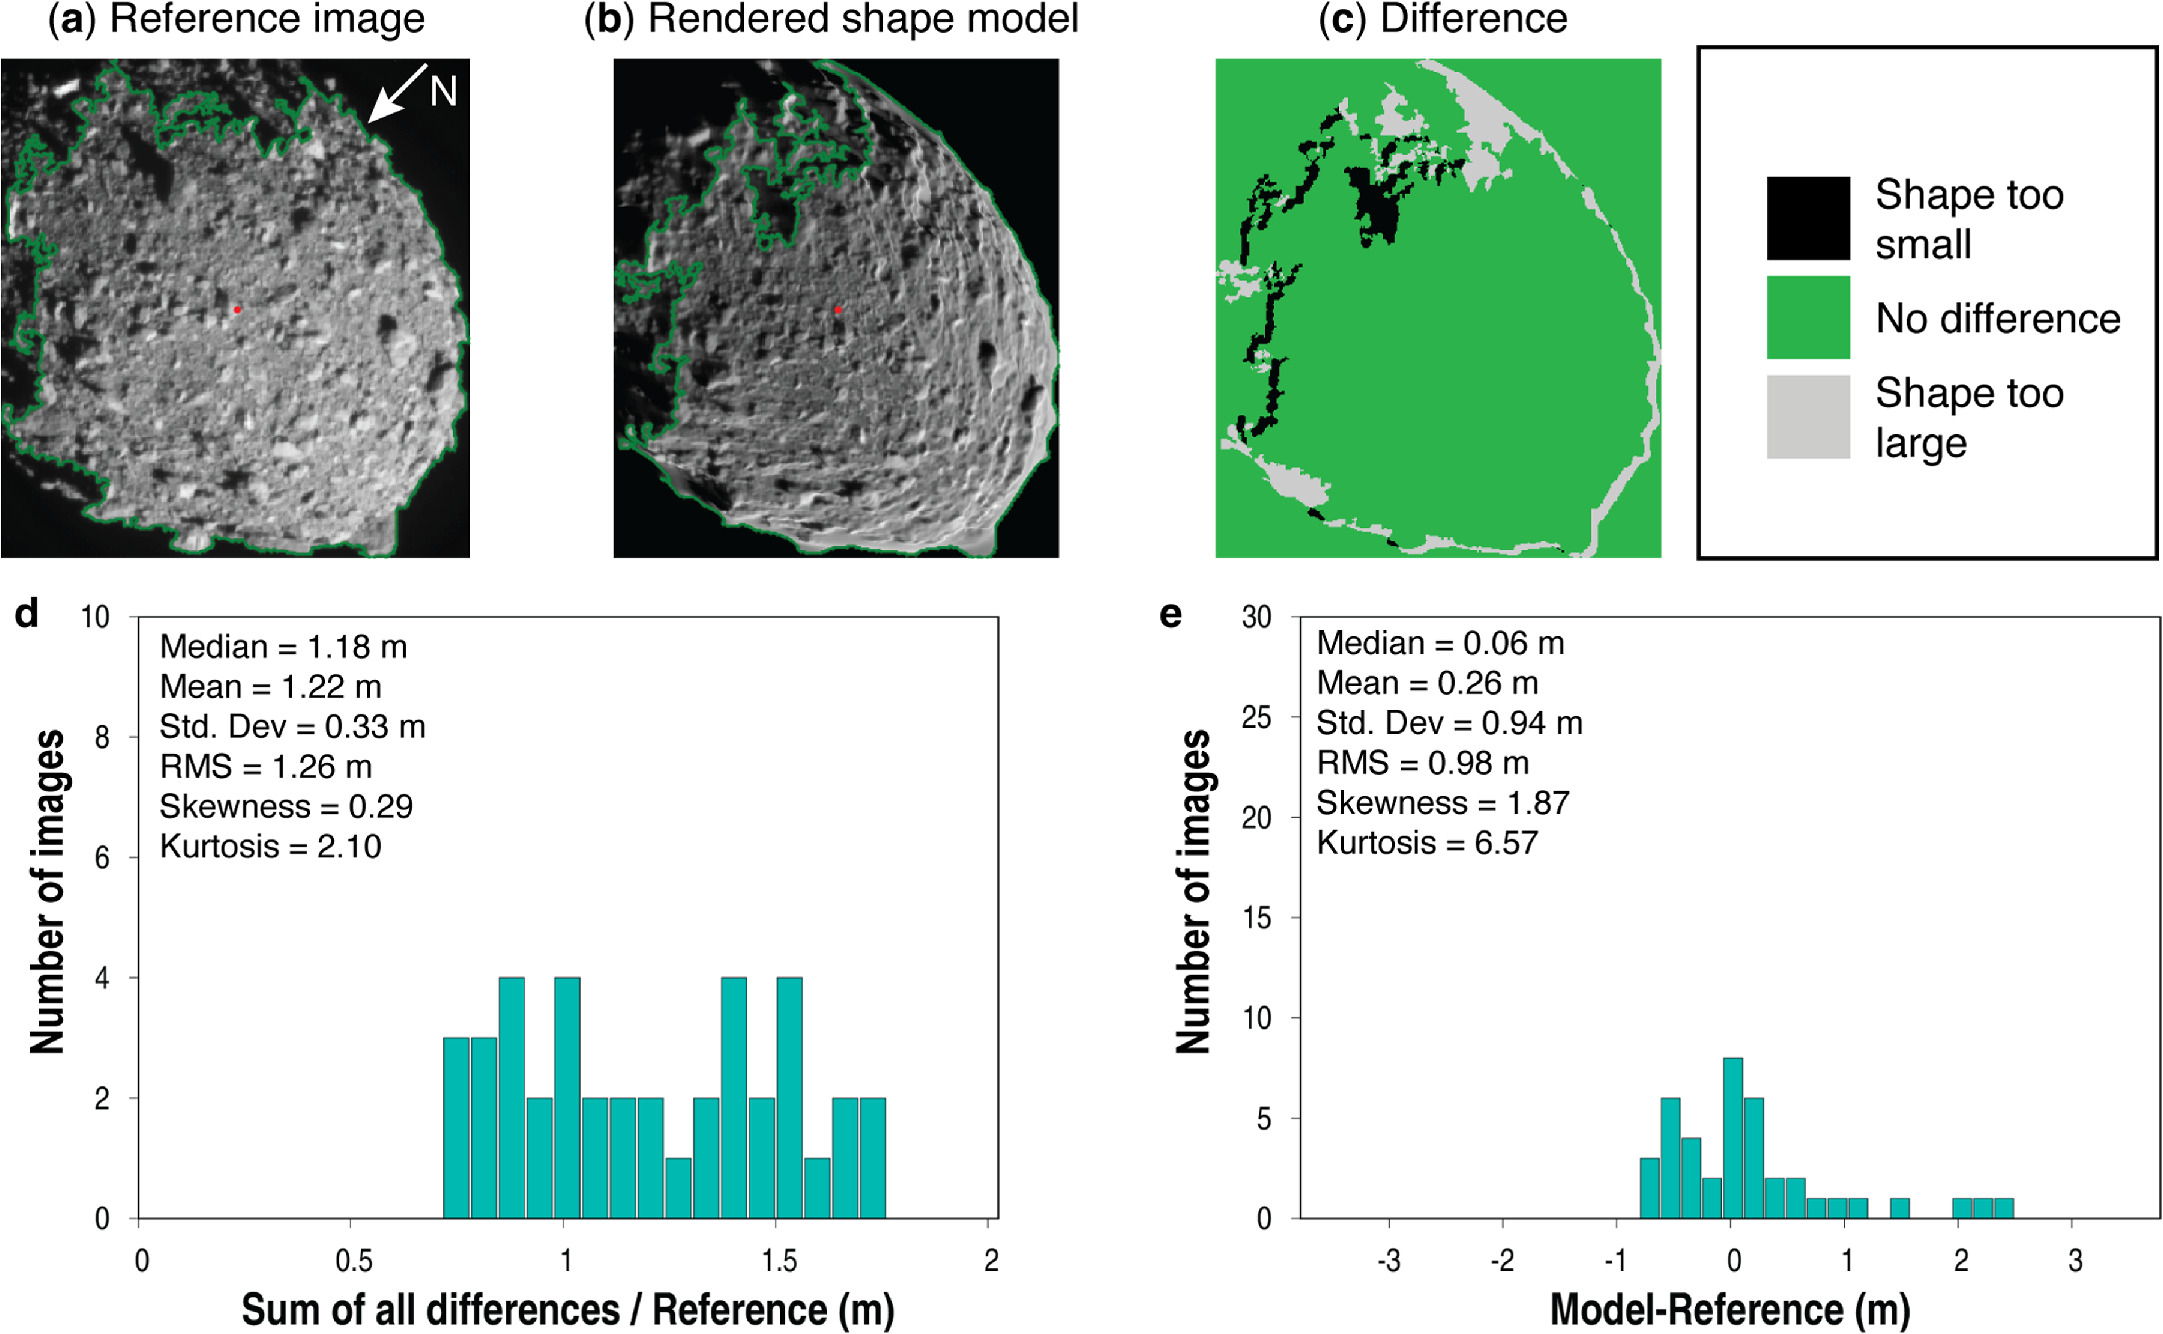
Figure 15. Limb/terminator shape model assessments. Panels (a)–(c) show an example of (a) a reference DRACO image, (b) the rendered shape model with the same lighting and viewing geometry as the reference image, and (c) the difference between the two. Panels (d) and (e) show histograms of results from limb/terminator assessments run on many DRACO images. The arrow in (a) indicates the direction of Dimorphos north (+Z).
Download figure:
Standard image High-resolution imageFor the keypoint matching method, the rendered image was rotated, translated, and scaled to minimize differences in the locations of keypoints (i.e., surface features) in the DRACO image and rendered shape model. The keypoint distance method was based on the measured distances between all keypoints in the DRACO image and rendered shape model (Figure 16). Most, but not all, matches are reasonable, so the median value based on all keypoints is used. Two images are outliers in the keypoint scale histogram; these are coarse-resolution images that were used in the updated model but not the preliminary one. The number of keypoint matches identified between an image and the rendered shape model ranged from 12 to 355, with an average of 96 and a median of 50 keypoint pairs per image.

Figure 16. Keypoint assessments. Colored lines in (a) and (b) connect features matched by the algorithm in the image and on the shape model. Panel (c) shows a metric based on differences between corresponding keypoints across many DRACO images. Panel (d) shows a model-to-image scale factor derived by comparing the distances measured between all keypoints in the reference DRACO image to the distances measured between all keypoints in the rendered shape model. The arrow in (b) indicates the direction of Dimorphos north (+Z).
Download figure:
Standard image High-resolution imageTable 4 summarizes the results of limb/terminator and keypoint assessments for the updated shape model and compares them to the corresponding values for the preliminary shape model. The updated model performs better in the limb/terminator metric than the preliminary model, as expected based on Figure 12. Much of the uncertainty that remains for the updated model based on the limb/terminator metric (on the order of 1 m) is due to image-to-image variation around the mean value of 26 cm. The keypoint metrics are both consistent with the scale of the shape model being appropriate, with image-to-image variation exceeding the −0.2% error based on all of the images. The keypoint scale error and standard deviation for the updated model are larger than for the preliminary model in part due to the inclusion of coarser-resolution images in the quality assessment. On the keypoint distance metric, the updated model performs better. Based on the ensemble of metrics, we assign uncertainties of ±1 m to the A and C axes of Dimorphos because, with the assumption of tidal locking, those are the axes that are best seen by DRACO.
Table 4. Results of Limb/Terminator and Keypoint Assessments
| Model | Limb/Terminator Metric | Keypoint Scale Metric | Keypoint Distance Metric |
|---|---|---|---|
| Preliminary a | −75 ± 200 cm b | −0.01% ± 0.38% | −11 ± 20 cm |
| Updated | 26 ± 130 cm | −0.2% ± 0.76% | 5 ± 21 cm |
Notes.
a Values from Daly, Ernst, Barnouin et al. (2023). b This is the mean of the model-reference metric (Figure 15(e)) and uses the rms from Figure 15(d) as the uncertainty because that value is larger (and therefore more conservative) than the rms of the model-reference metric. The rms in this case is a measure of how much the error varies on an image-to-image basis.Download table as: ASCIITypeset image
The error assessments that involve comparisons with DRACO images are, by their nature, limited to revealing errors in the parts of the model seen by DRACO. In order to constrain the uncertainties in the parts of the shape model not imaged by DRACO, we used lessons learned during preimpact shape modeling tests. These tests used simulated images of scaled-down shape models of Bennu, Itokawa, and an ellipsoid to build global shape models and then compared the reconstructed shape models against the "truth" shape models that were used to generate the simulated images in the first place. See Daly et al. (2022) for details.
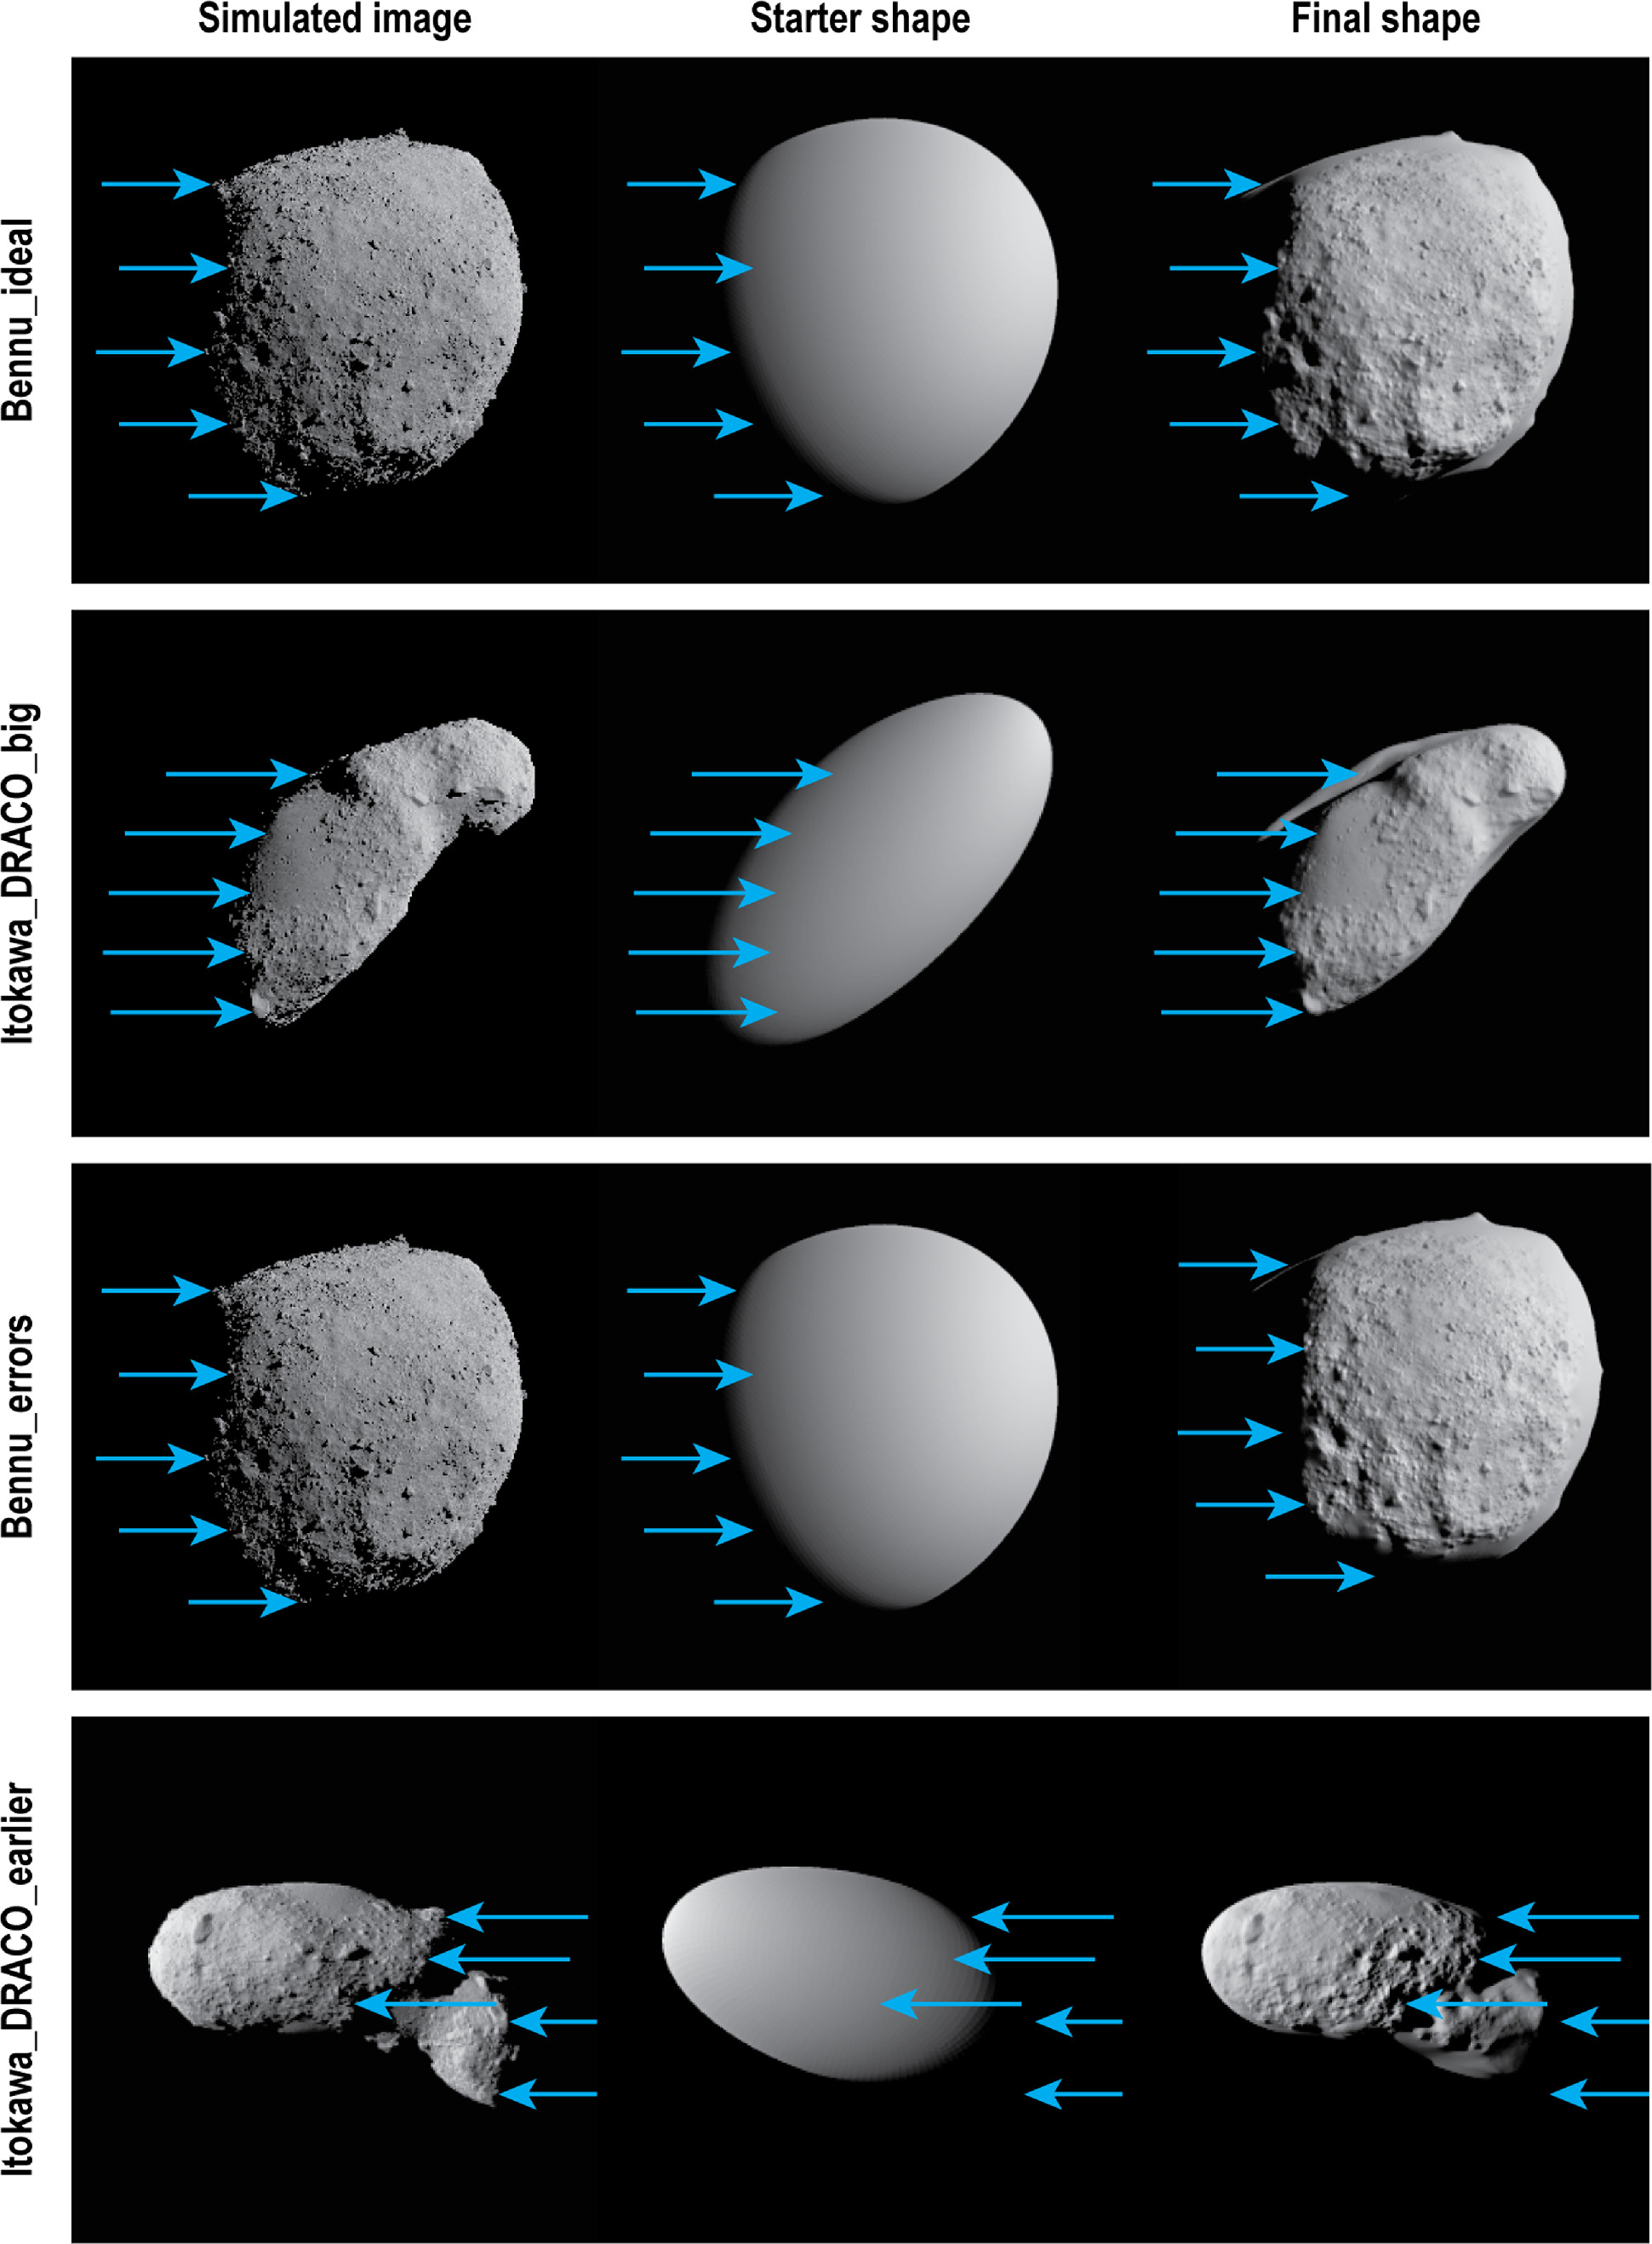
One of the key lessons from the shape modeling tests was that mismatches along the terminator of a shape model diagnose errors into and out of the DRACO image plane, which corresponds approximately to the B axis of the asteroid (under the tidal-locking assumption). Figure 17 illustrates this point by comparing the simulated images used to build the shape model and renderings of the reconstructed shape models for four shape modeling tests with larger-than-average B-axis errors. Blue arrows mark where the terminator is in the image and therefore where the terminator should be in the rendered shape model. If the blue arrows point to dark space or lit terrain on the rendered shape model, then the shape model is incorrect in that location. The better the agreement between the terminator in the image and rendered shape model, the smaller the error in the B-axis extent. Table 5 summarizes the errors in the B-axis extent from preimpact shape modeling tests. The median error in the B-axis extent is 4.4 m, with a mean of 4.2 m. For the tests with the four largest errors in B-axis extent, the mismatch between the terminator position in the starting shape is particularly bad (Figure 17). For Dimorphos, we have good agreement with the terminator position even for the starting ellipsoid, which suggests that the errors in B-axis extent are likely on the lower end. The ellipsoid shape modeling test (which appears, based on DRACO images, to be the closest analog to Dimorphos) has the smallest error in B-axis extent (−1.7 m). The agreement between the terminator position in the updated shape model versus DRACO images is excellent (Figure 12). Based on all of these considerations, we assign errors of ±4 m to the B-axis extent of Dimorphos in the updated shape model. The 5% error assumed for the volume (Table 3) is consistent with the errors reported on the A , B, and C axes of the shape model.
Figure 17. Examples of shape modeling tests with large errors in the B-axis (i.e., the axis into and out of the page). The left column shows a simulated image used to build the model, the middle column shows the starting ellipsoid, and the right column shows the SPC model made from the simulated images. Each row shows a different shape modeling test. See Daly et al. (2022) for details on the shape modeling tests done for DART. Blue arrows show the location of the terminator in the simulated images. The arrows are in the same positions relative to the image in all three columns. Offsets between the points of the arrows and the terminator in the SPC model indicate errors in the model.
Download figure:
Standard image High-resolution image
Table 5. Errors in B-axis Extent from Preimpact Shape Modeling Tests
| Test Name | Extent of B axis of Truth Model (m) | Extent of B axis of Reconstructed Model (m) | Error in B axis Extent (m) |
|---|---|---|---|
| Ellipsoid | 160 | 158.3 | −1.7 |
| Itokawa_DRACO+LEIA | 76.5 | 73.4 | −3.1 |
| Itokawa_DRACO_early a | 76.5 | 79.6 | 3.1 |
| Itokawa_DRACO | 76.5 | 73.2 | −3.3 |
| Itokawa_DRACO_earlier a | 76.5 | 82.1 | 5.6 |
| Bennu_errors | 181.9 | 191 | 9.1 |
| Itokawa_DRACO_big a | 76.5 | 88.2 | 11.7 |
| Bennu_ideal | 181.9 | 194 | 12.1 |
Note.
a The results of these shape modeling tests were not reported in Daly et al. (2022) but were broadly similar to the published tests. The Itokawa_DRACO_early and Itokawa_DRACO_earlier tests were similar to the Itokawa_DRACO test reported by Daly et al. (2022), but they were based on an earlier mission design. The Itokawa_DRACO_big test used the same images as the Itokawa_DRACO test in Daly et al. (2022), but it intentionally used a much larger starting ellipsoid.Download table as: ASCIITypeset image
4. Conclusion and Implications
The updated global shape model of Dimorphos improves on several aspects of the preliminary one reported by Daly, Ernst, Barnouin et al. (2023). The improved methods for incorporating the Didymos-lit limb and refining the starting ellipsoid will be of use for future shape modeling efforts. From a planetary defense perspective, the processes and lessons learned here will accelerate shape modeling efforts for future asteroid reconnaissance or mitigation missions. These methods can be broadly applied to science missions as well.
The analysis reported here continues to indicate that Dimorphos was an oblate object prior to the DART impact, rather than a more elongated one. That finding is consistent with the lack of robust detection of the a/b ratio of Dimorphos prior to impact (Pravec et al. 2022); however, the shapes of secondaries in similar binary systems measured by both lightcurves and radar tend to be more prolate (Ostro et al. 2006; Naidu et al. 2015; Pravec et al. 2016). More recent work on lightcurves has suggested that a substantial population of oblate secondaries may exist but has not been reported previously in the literature (P. Pravec, personal communication), in which case, the oblate shape of Dimorphos may be less unusual than thought. In any case, the oblate shape of Dimorphos provides an important constraint on the formation and evolution of the Didymos system that is driving current work on the topic (Agrusa et al. 2023; Barnouin et al. 2023).
Later this decade, the European Space Agency's Hera mission will go to the Didymos system to study the aftermath of the DART impact (Michel et al. 2022). The Hera mission will develop a detailed shape model of Dimorphos; however, Hera will observe the postimpact Dimorphos, whereas DART documented the preimpact state of the asteroid. Numerical simulations suggest that the postimpact shape may differ substantially from the preimpact shape with a crater up to 60 m in diameter (Stickle et al. 2023) or a global reshaping (Raducan et al. 2023). Recent ground-based observations suggest that the postimpact a/b ratio of Dimorphos is 1.31 ± 0.06 (S. P. Naidu et al. 2023, in preparation). This elongation is in between two of the panels in Figure 6, and the value is inconsistent with DRACO observations of the preimpact Dimorphos under the tidal-locking assumption. The fact that the more detailed analysis reported here still leads to an oblate shape provides strong evidence that the postimpact a/b of 1.31 is an indication that the DART impact created a large crater or triggered global reshaping of Dimorphos.
Both the preliminary and updated global shape models are available in the Planetary Data System (PDS) Small Bodies Node (SBN). 9 The shape models in the PDS have version numbers associated with them. The preliminary model reported by Daly, Ernst, Barnouin et al. (2023) is v003 in the PDS, and the updated model reported here is v004. Model version numbers start at v003 because v001 and v002 were interim products that had important shortcomings and were not used in team publications. The Dimorphos shape models are also available through the public Small Body Mapping Tool (SBMT; sbmt.jhuapl.edu; Ernst et al. 2018), which is a free tool for three-dimensional search, visualization, and analysis of the data from DART and many other missions. Table 6 summarizes the data that are available from each source. The global shape models are available in four resolutions with GSDs of 1.96 m, 98 cm, 49 cm, and 25 cm for v003 and 1.94 m, 97.2 cm, 48.7 cm, and 24.3 cm for v004. We recommend using the highest-resolution (smallest GSD) model for most analyses; however, the lower-resolution models have much smaller file sizes, which can be convenient for some applications. A 5 cm GSD impact site DTM that is associated with the v004 model will also be available, as will other regional DTMs. All models are also accompanied by ancillary files that describe the slope, elevation, and other geophysical information across the asteroid. These ancillary files are described in Barnouin et al. (2020).
Table 6. Data Products and Availability
| SBMT | PDS SBN | |
|---|---|---|
| Preliminary global shape model of Dimorphos (v003, four resolutions) | X | X |
| Updated global shape model of Dimorphos (v004, four resolutions) | X | X |
| High-resolution (5-cm GSD) DTM of the DART impact site | X | X |
| Regional DTMs (10-cm GSD) of all lit areas imaged by DRACO at pixel scales of <20 cm | X | |
| Geophysical map ancillary fits files for all resolutions of global shape models | X | X |
| Albedo map ancillary file for the highest-resolution global shape models | X | X |
| Coregistered and georeferenced DRACO images | X | X |
| Smithed spk and ck SPICE kernels valid for the times of all images used to construct the model and all registered but unused images | X | |
| Image backplanes | X | X |
Download table as: ASCIITypeset image
Acknowledgments
This work was supported by the DART mission, NASA contract No. 80MSFC20D0004. This work was supported by the Italian Space Agency (ASI) within the LICIACube project (ASI-INAF agreement AC No. 2019-31-HH.0). The work by P.P. was supported by the Grant Agency of the Czech Republic, grant 20-04431S.