


Abstract
Technologies are being developed to enable a robotic spacecraft to directly access Europa's ocean by penetrating its kilometers-thick ice crust. Until such time comes, however, our ability to characterize it will be limited to observations of its expression on the surface. Further, the ability to place meaningful constraints on the composition of the source brines will depend on our understanding of the chemistry associated with their freezing and emplacement. Among the body of research focused on improving this understanding, recent laboratory studies have shown that Mg-bearing salts, previously proposed as constituents of Europa's surface, have a propensity to form vitreous hydrates when flash frozen from their parent brines. The possibility that such vitreous species could form on Europa is important as their presence will be a confounding factor in their detection and identification of the underlying salt hydrates. Further, since glass formation can protect biological molecules and even microorganisms from damage caused by crystallization, they may prove to be important targets of astrobiological interest. This work explores the conditions under which vitreous salt hydrates form in order to better assess their potential for forming on Europa. Specifically, solutions of Mg- and Na-bearing salts were frozen over a range of freezing rates and interrogated with Raman spectroscopy to determine whether vitreous or crystalline species (including hydration state) formed. These results show that vitreous salt hydrates can form at freezing rates as low as ∼10 K minute−1, thus expanding their potential for occurrence on Europa beyond extreme flash-freezing scenarios such as plume deposition.
Export citation and abstract BibTeX RIS

Original content from this work may be used under the terms of the Creative Commons Attribution 4.0 licence. Any further distribution of this work must maintain attribution to the author(s) and the title of the work, journal citation and DOI.
1. Introduction
The composition of Europa's subsurface ocean is of tremendous interest for the understanding of Europa's internal geochemistry and assessing its potential habitability. NASA's next flagship mission Europa Clipper, scheduled to launch in 2024, will investigate these aspects, including characterizing the nature of liquid water on this icy moon. However, technologies for direct ocean sampling have yet to be matured, and until then, we will need to rely heavily on surface properties to deduce those of the underlying ocean. A number of experimental studies have been conducted toward this goal, such as those by Vu et al. (2016) who investigated the freezing of various Na–Mg–Cl–SO4 brine systems. These systems were chosen to represent putative subsurface ocean brines based on observations by Galileo's Near Infrared Mapping Spectrometer (McCord et al. 1998, 1999; Dalton 2007) and geochemical modeling (Marion et al. 2005; Zolotov & Kargel 2009; Zolotov 2012). They showed that hydrated Na2SO4 and MgCl2 minerals crystalize preferentially from freezing of such brine systems, even at elevated Mg2+/Na+ ratios. The latter observation is notable as it supports the hypothesis of Brown & Hand (2013) that, prior to irradiation, MgCl2 is the primary form of magnesium on Europa's surface. Subsequently, Johnson et al. (2019) used chemical divide modeling, verified with experimental data, to predict the mineral formation sequence from freezing of these brines. In this approach, it is assumed that minerals precipitate out of solution in order of their aqueous solubilities (Hardie & Eugster 1970; Eugster & Jones 1979). Consistent with experimental observations (Vu et al. 2016), mirabilite (Na2SO4•10H2O) was predicted to be the first species to freeze out of a Na–Mg–Cl–SO4 brine, which exists at pH < 8.4 due to the formation of insoluble brucite (Mg(OH)2) at higher pH. The model then predicts that either hydrohalite (NaCl•2H2O) or MgSO4 hydrates would precipitate next depending on whether sodium or sulfate ions were in excess, respectively. MgCl2•12H2O is predicted to form last with any remaining anions eventually crystallizing as acid hydrates. Therefore, depending on the mineralogy of the surface, one can potentially make meaningful inferences regarding the starting composition of the subsurface liquid reservoir.
Further recent work on the Na–Mg–Cl–SO4 system by Vu et al. (2020) has also revealed the formation of hydrated MgSO4 glasses upon flash freezing of these brines, in both molar and submolar salt concentrations. This was identified using Raman spectroscopy via a broad (full width at half maximum (FWHM) = 10.6 cm−1) sulfate-glass feature centered at 985 cm−1 (in contrast with crystalline sulfate, e.g., epsomite (MgSO4•7H2O), which exhibits a much narrower (FWHM = 3.7 cm−1) sulfate feature). Further, a lack of observed MgCl2•12H2O hydrate features, the species predicted by chemical divide modeling (Johnson et al. 2019), suggested that it was also vitrified upon flash freezing. This was confirmed by X-ray diffraction experiments, where no discernible crystalline reflections were observed in the diffraction pattern upon flash freezing. Overall, the tendency for magnesium-bearing brines to form vitreous salt hydrates as opposed to crystalline hydrated phases is consistent with the demonstrated ability of MgCl2 solutions to remain in a supercooled state for several hours at 9–14 K below the eutectic temperature (Toner et al. 2014). A recent study of Enceladus-relevant fluids (containing primarily Na–Cl–CO3) has shown that these brines can also undergo vitrification when flash frozen (Fox-Powell & Cousins 2021), thereby suggesting that glassy materials may be more common on ocean worlds than previously realized.
The possibility that vitreous salt hydrates could exist on the surface of Europa is of interest for two primary reasons. First, vitrified phases are known to protect cellular structures from damage caused by crystallization. In fact, promoting survival of microorganisms via non-crystalline freezing is relatively standard in microbiology (e.g., adding glycerol to cell stocks to allow storing them at 193 K Hollander & Nell 1954). One can therefore speculate that it may be possible for vitrified phases on Europa to preserve biosignatures or even potential endogenic organisms entrained within the ice. Such preservation potential has previously been identified in other astrobiological applications in the context of Mars by Toner et al. (2014) who demonstrated glass formation from slow cooling of perchlorate solutions (Mg(ClO4)2 and Ca(ClO4)2) and in the context of Enceladus by Fox-Powell & Cousins (2021) who demonstrated glass formation when flash freezing putative ocean brines. Second, the presence of glassy MgCl2 hydrates may hinder their detection and/or identification via vibrational spectroscopic techniques (Raman or infrared reflectance) (Vu et al. 2020). This is notable given the identification of a vibrational spectrometer as part of the strawman payload for the Europa Lander concept and the selection of a Raman instrument for development efforts under the NASA ICEE-2 program (Hand et al. 2022). Based on their study of flash-frozen brines, Vu et al. (2020) suggested that glassy MgSO4 ices could be deposited on the surface of Europa from ocean fluid erupting in a plume. As a result, an in situ Raman measurement strategy was proposed where surface material is first interrogated in their (cold) natural state to identify possible vitreous phases as these may contain microorganisms and/or clues regarding the provenance of the sample (e.g., plume origin). This is then followed by a second analysis where the sample is annealed to reveal the materials that are "hidden" in the vitreous states. Such a strategy would verify whether or not any potential sulfate glass contained magnesium and would enable identification of MgCl2 initially in a glassy state, which is indistinguishable from water ice until it crystalizes upon annealing.
As a follow-on to these studies, this paper aims to quantify and constrain the range of freezing rates over which vitreous salt hydrates form. Here, different types of binary salts that are relevant to Europa are examined over a range of concentrations and freezing rates, and the frozen products are studied with Raman spectroscopy. In doing so, this work seeks to better understand the conditions through which materials interrogated by a future landed or orbiting spacecraft could have originated from the freezing and emplacement of ocean fluids on the surface of Europa.
2. Materials and Methods
Brine samples were prepared with the desired salt concentrations (Tables 1–5) using deionized water and commercial MgSO4 (Fisher Chemical, anhydrous), MgCl2•6H2O (Fisher Chemical), NaCl (Fisher Chemical) and Na2SO4 (Sigma Aldrich, ≥99%). Aliquots of 5 μl were pipetted onto a microscope slide mounted within a Linkam LTS420 liquid nitrogen-cooled cryostage, which enables temperature control from room temperature down to 77 K to within ±0.01 K. In addition, the cryostage could be cooled at controlled rates from 0.01 K minute−1 up to a maximum of 50 K minute−1. After pipetting onto the microscope slide at room temperature, samples were cooled at a given rate to 100 K. In the case of flash-frozen samples, the cryostage was precooled to 100 K before aliquots were pipetted onto the microscope slide. Once the sample reached this temperature, it was allowed a few minutes of thermal equilibration while a suitable spot was identified for the measurement. All experiments were carried out at atmospheric pressure.
Table 1. State of Frozen 2 M MgSO4 Solutions at 100 K as a Function of Freezing Rate
| Freezing Rate (K minute−1) | State of the MgSO4 Hydrate |
|---|---|
| 20.0 | Crystalline (MgSO4•11H2O) |
| 25.0 | Crystalline (MgSO4•11H2O) |
| 26.0 | Vitreous → Crystalline (MgSO4•7H2O) |
| 26.5 | Vitreous |
| 27.0 | Crystalline (MgSO4•11H2O) |
| 27.5 | Vitreous |
| 30.0 | Vitreous |
| 35.0 | Vitreous |
| 40.0 | Vitreous |
| Flash | Vitreous |
Download table as: ASCIITypeset image
A simplistic estimate of the freezing rate associated with the flash-freezing method used here can be made as follows. Prior to deposition, the solutions were at room temperature, i.e., 293 K. After deposition, the 5 μl aliquots (∼0.005 g) were observed to "instantly" freeze; eventually reaching thermal equilibrium with the cryostage at 100 K. Estimating that it took 5 s to reach thermal equilibrium with the cryostage, yields an average cooling rate of 38.6 K s−1. A similar approach was used by Thomas et al. (2019) to estimate the rate at which small drops of aqueous salt solutions froze when pipetted directly into liquid nitrogen. In that study, the freezing rate was estimated to be 108 K s−1, which compares reasonably well with the much more sophisticated approach presented by Fox-Powell & Cousins (2021) where the freezing rate of a 1 mm diameter drop pipetted into liquid nitrogen was determined to be between 13.9 and 63.3 K s−1. It should further be noted that the discrepancy between these latter estimates is potentially attributable to Thomas et al. (2019) underestimating the time it took for a drop of solution to reach thermal equilibrium with the surrounding liquid nitrogen.
Frozen samples were observed optically using 10× and 50× Olympus BXFM microscope objectives prior to interrogation with a confocal dispersive Horiba Jobin Yvon LabRam HR Raman spectrometer configured with a 50 mW, 532 nm (frequency-doubled Nd:YAG) laser. Frequency calibration was carried out using a Si chip, which exhibits a characteristic sharp peak at 520.7 cm−1. Raman spectra were recorded at a resolution of 0.5 cm−1 per detector pixel using an 1800 grooves per mm grating. Spectral properties of the observed sulfate ν1 symmetric stretch features in vitreous and crystalline forms were determined by fitting Gaussian and Lorentzian lineshapes, respectively, using the multipeak fitting tool in Igor Pro 8 (version 8.04, Wavemetrics, Inc.).
3. Results
Micro-Raman spectroscopy has been shown to be well suited for analysis and identification of hydrated salts (Thomas et al. 2005, 2017; Wang et al. 2006; Hamilton & Menzies 2010; Vu et al. 2016, 2017; Johnson et al. 2019) and in both identifying and discriminating between their vitreous and crystalline phases (Vu et al. 2020). Prior to these cited works, the only report on Raman studies of glassy salts that are the subject of this paper (to the authors' knowledge) presented Raman spectra of MgCl2 and MgSO4 glasses covering the OH stretching (3800–3000 cm−1) and low frequency (600–10 cm−1) regions (Kanno & Hiraishi 1987). In this work glasses were formed by cooling 3.47 M salt solutions. However, those spectra (obtained more than three decades ago) are of relatively low resolution and not well suited for comparison with the current data.
In order to ensure a strong detectable Raman signal, experiments began with 2 M MgSO4. Figure 1 shows the spectrum of a sample cooled at 20 K minute−1 from room temperature to 100 K, and one that was flash frozen at 100 K. The sulfate ν1 symmetric stretch in the latter (highlighted in the inset) exhibits a broad feature centered at 984.7 cm−1 with a FWHM of 10.1 cm−1 while the former displays a sharp peak at 989.3 cm−1 with a FWHM of 3.8 cm−1. Comparison with the control spectra in Vu et al. (2020) indicated that of the broad feature in the flash-frozen sample belonged to hydrated MgSO4 glass, while that in the 20 K minute−1 sample was of meridianiite (i.e., crystalline MgSO4•11H2O). Meanwhile, the OH stretch region (3000–3800 cm−1) in both spectra shows the characteristic signatures of crystalline water ice, indicating that ice can co-exist with either vitreous or crystalline MgSO4 hydrates depending on the freezing rate. It should be pointed out that this is true for all the samples reported here, i.e., they consist of crystalline water ice mixed with the relevant salt hydrate either in crystalline or vitreous form. Of note, the region between 1050 and 2800 cm−1, which encompasses the O–H bending modes of water, was mostly featureless due to low signal strength. Therefore, this region is omitted from all figures to better display the more prominent spectral regions.
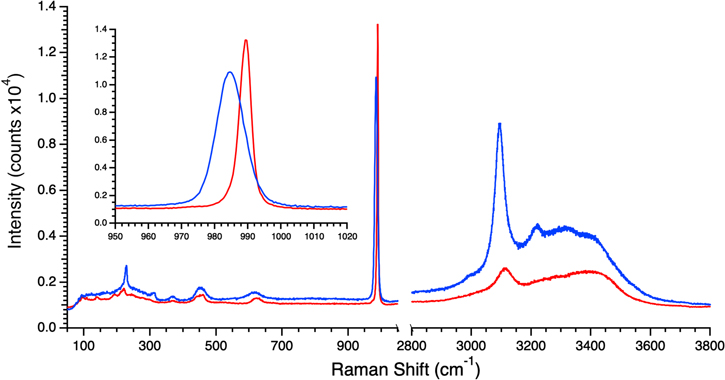
Figure 1. Raman spectra of frozen 2 M MgSO4 brines at 100 K, with the sulfate ν1 symmetric stretch region highlighted in the inset. The blue trace was obtained from a flash-frozen sample and demonstrates the lineshape (FWHM = 10.1 cm−1 and x0 = 984.7 cm−1) of the sulfate ν1 symmetric stretch feature that is characteristic of vitreous MgSO4 hydrate. The red trace was obtained from a sample that was cooled from room temperature to 100 K at 20 K minute−1 and shows the lineshape of the sulfate ν1 stretch feature that is characteristic of crystalline MgSO4•11H2O (meridianiite) (FWHM = 3.8 cm−1, x0 = 989.3 cm−1).
Download figure:
Standard image High-resolution imageA series of experiments was then conducted where the freezing rate was varied between 20 K minute−1 and flash freezing to determine the rates at which crystalline and glassy MgSO4 hydrates form, respectively. Table 1 lists the cooling rates at which experiments were conducted and whether the sample was glassy or crystalline after freezing and reaching 100 K. This latter determination was made by comparing the location and shape of the sulfate ν1 symmetric stretch feature in their Raman spectra with those in Figure 1. Crystalline MgSO4•11H2O (meridianiite) was seen to reliably form at rates of 25 K minute−1 and below while the vitreous form was seen at rates above 27.5 K minute−1, following the expectation that glasses should form more readily at higher freezing rates. However, some interesting behavior was observed between these limits where the 27.0 K minute−1 sample was crystalline while the 26.5 K minute−1 sample was vitreous. Further, the 26.0 K minute−1 sample was observed to be vitreous initially but was then observed to transition to crystalline MgSO4•7H2O (epsomite) within minutes based on comparison with the control spectra in Figure 3 of Vu et al. (2020). The former observations are attributed to the probability that the actual freezing rates of the samples were less precisely controlled in the half-degree per minute increment than that of the cryostage's thermal block. The latter behavior was possibly the result of a supercooled sample that froze quick enough to form a glass where the Raman laser was focused while the crystal nucleated at a different location within the volume and eventually crystalized throughout. When MgSO4–H2O systems freeze, metastable epsomite forms first, but is then converted to meridianiite (Peterson & Wang 2006). The observation of epsomite forming from a vitreous MgSO4 hydrate may be a fortuitous detection during the glass-to-epsomite-to-meridianiite transition. Regardless, the data suggest that at rates slower than 25 K minute−1 and faster than 28 K minute−1, crystalline MgSO4•11H2O and vitreous MgSO4 hydrate form, respectively.
In order to examine the effect of concentration as well as to establish results at salinities more consistent with those expected for Europa's ocean (Zolotov & Shock 2001), similar freezing rate experiments were conducted with 0.1 M MgSO4 solutions. Here, the first freezing rate examined was 20 K minute−1, which resulted in a vitreous MgSO4 hydrate as determined by the location and shape of the sulfate ν1 symmetric stretch feature. Therefore, further experiments were carried out with successively reduced freezing rates until the transition to crystal formation was discerned (results are summarized in Table 2). It was observed that vitreous MgSO4 hydrates formed at rates above 10 K minute−1 while crystalline MgSO4•11H2O formed at 10 K minute−1 and below.
Table 2. State of Frozen 0.1 M MgSO4 Solutions at 100 K as a Function of Freezing Rate
| Freezing Rate (K minute−1) | State of the MgSO4 Hydrate |
|---|---|
| 8.0 | Crystalline (MgSO4•11H2O) |
| 10.0 | Crystalline (MgSO4•11H2O) |
| 11.0 | Vitreous |
| 12.5 | Vitreous |
| 15.0 | Vitreous |
| 20.0 | Vitreous |
Download table as: ASCIITypeset image
Following the MgSO4 experiments, MgCl2, another Europa-relevant salt that is known to undergo crystal/glass formation upon freezing, was investigated. Again, experiments began with a concentration of 2 M to ensure Raman spectra with strong, clearly defined features. Figure 2 shows the results of these experiments where one sample was flash frozen and the other was cooled at a rate of 20 K minute−1 from room temperature to 100 K. As seen in the figure, the flash-frozen sample yielded a spectrum that was relatively smooth and featureless apart from those features attributable to water ice (e.g., dominant peak at ∼3100 cm−1). In contrast, the sample frozen at 20 K minute−1 contained many sharp peaks, with particularly prominent features at 3512 and 3460 cm−1. These peaks correspond to those reported for crystalline MgCl2•12H2O by Yang et al. (2019) and is consistent with the phase diagram of the MgCl2–H2O system (Li et al. 2016). It was therefore concluded that 20 K minute−1 freezing resulted in crystalline MgCl2•12H2O while flash freezing produced vitreous MgCl2 hydrate. A set of experiments was then conducted at freezing rates between these bounds, noting that the maximum controlled freezing rate obtainable with the cryostage was 50 K minute−1. These results are summarized in Table 3 and show that crystalline MgCl2•12H2O consistently formed at all rates at, and below, 50 K minute−1.
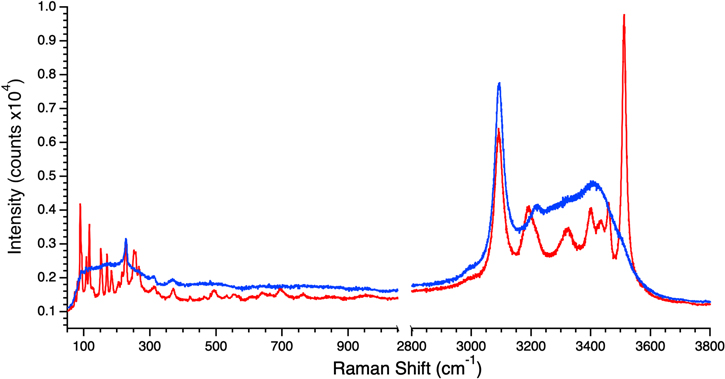
Figure 2. Raman spectra of frozen 2 M MgCl2 brines at 100 K. The blue trace was obtained from a flash-frozen sample and demonstrates the smooth, relatively featureless spectrum. The red trace was obtained from a sample that was cooled from room temperature to 100 K at 20 K minute−1 and shows the many sharp features characteristic of crystalline MgCl2•12H2O, with the most prominent at 3512 cm−1.
Download figure:
Standard image High-resolution imageTable 3. State of Frozen 2 M MgCl2 Solutions at 100 K as a Function of Freezing Rate
| Freezing Rate (K minute−1) | State of the MgCl2 Hydrate |
|---|---|
| 20.0 | Crystalline (MgCl2•12H2O) |
| 30.0 | Crystalline (MgCl2•12H2O) |
| 50.0 | Crystalline (MgCl2•12H2O) |
| Flash | Vitreous |
Download table as: ASCIITypeset image
Since the MgSO4 experiments showed that lower concentrations resulted in glassy hydrates at lower freezing rates, MgCl2 solutions were examined at reduced concentration to see if a similar trend would be observed. Initially, a 0.1 M MgCl2 solution was frozen at 15 K minute−1 and examined with Raman spectroscopy. However, this concentration turned out to be too low to observe any signals attributable to MgCl2. Therefore, the concentration was increased to 0.5 M and a sample was cooled to 100 K at 50 K minute−1. This produced a glass with a spectrum similar to that of the blue trace in Figure 2. Experiments were repeated at decreasing cooling rates until crystalline MgCl2 hydrate was consistently observed (at, and below, 5 K minute−1). These data are summarized in Table 4.
Table 4. State of Frozen 0.5 M MgCl2 Solutions at 100 K as a Function of Freezing Rate
| Freezing Rate (K minute−1) | State of the MgCl2 Hydrate |
|---|---|
| 3.0 | Crystalline (MgCl2•12H2O) |
| 5.0 | Crystalline (MgCl2•12H2O) |
| 8.0 | Vitreous |
| 10.0 | Vitreous → Crystalline (MgCl2•12H2O) |
| 12.0 | Vitreous |
| 15.0 | Vitreous |
| 20.0 | Vitreous |
| 50.0 | Vitreous |
Download table as: ASCIITypeset image
Na2SO4 solutions were examined next. First, a 0.1 M sample was cooled at 50 K minute−1 yielding the sharp (FWHM =3.6 cm−1) sulfate ν1 symmetric stretch feature at 991.0 cm−1 indicative of crystalline Na2SO4•10H2O (mirabilite). A flash-frozen sample yielded a spectrum with the same crystalline sulfate indicator (see Figure 3). Since the MgSO4 and MgCl2 experiments suggested that lower concentrations enabled glasses to form at slower freezing rates, experiments were performed with 0.05 M and 0.025 M Na2SO4 solutions. Flash freezing of these solutions all resulted in formation of crystalline Na2SO4•10H2O as summarized in Table 5. A 0.01 M solution was also flash frozen, but there was insufficient signal in its Raman spectra to detect any evidence of the sulfate stretch, crystalline or otherwise.
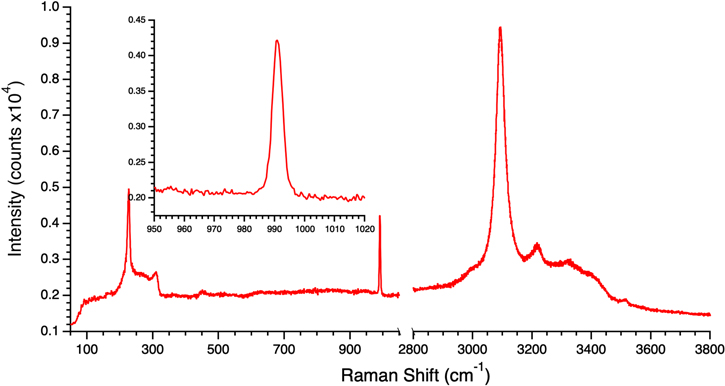
Figure 3. Raman spectrum of a frozen 0.1 M Na2SO4 brine at 100 K with the sulfate ν1 symmetric stretch region highlighted in the inset. The spectrum was obtained from a flash-frozen sample and shows the lineshape of the sulfate stretch feature that is characteristic of crystalline Na2SO4•10H2O (mirabilite) (FWHM = 3.6 cm−1, x0 = 991.0 cm−1).
Download figure:
Standard image High-resolution imageTable 5. State of Frozen Na2SO4 Solutions at 100 K as a Function of Freezing Rate
| Concentration (M) | Freezing Rate (K minute−1) | State of the Na2SO4 Hydrate |
|---|---|---|
| 0.1 | 50 | Crystalline (Na2SO4•10H2O) |
| 0.1 | Flash | Crystalline (Na2SO4•10H2O) |
| 0.05 | Flash | Crystalline (Na2SO4•10H2O) |
| 0.025 | Flash | Crystalline (Na2SO4•10H2O) |
| 0.01 | Flash | no sulfate stretch signal |
Download table as: ASCIITypeset image
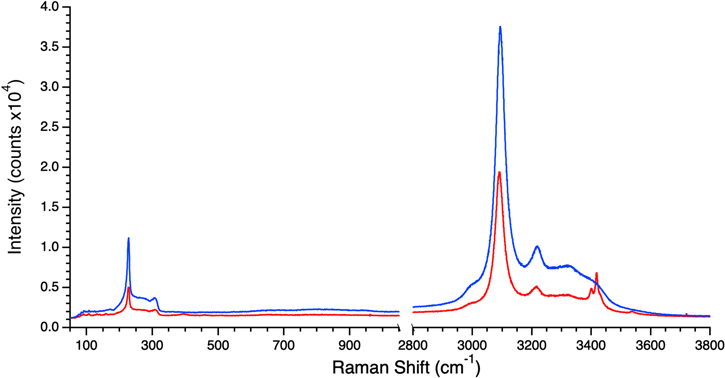
The final species studied was NaCl. Here, a 0.1 M NaCl solution was flash frozen, which yielded a water-ice-like spectrum (blue trace in Figure 4). However, when the sample was subjected to freezing at 50 K minute−1, its spectrum was characteristic of crystalline NaCl•2H2O (hydrohalite) (red trace in Figure 4). Unfortunately, given the maximum cooling rate of the cryostage, further refinement of the border between glass and crystal formation as a function of cooling rate was not possible. To rule out the possibility that hydrohalite was forming but was not being sampled in the Raman measurement, a further experiment was conducted where the solution was pipetted directly into liquid nitrogen and ground to a fine powder with a cryogenic mortar and pestle before transferring to the precooled cryostage. This procedure was meant to ensure a homogeneous sample, and the resulting Raman spectra also showed no evidence of hydrohalite. It should be noted that formation of crystalline anhydrous NaCl (halite) in the flash-frozen sample is not strictly ruled out as it is Raman inactive. However, the condition of the freezing experiment was not conducive to halite formation according to the NaCl–H2O phase diagram (Farnam et al. 2014). Therefore, the lack of hydrohalite features was interpreted as indicative of a vitreous NaCl hydrate.
Figure 4. Raman spectra of frozen 0.1 M NaCl brines at 100 K. The blue trace was obtained from a flash-frozen sample and demonstrates the smooth relatively featureless spectrum. The red trace was obtained from a sample that was cooled from room temperature to 100 K at 50 K minute−1 and shows the sharp features characteristic of crystalline NaCl•2H2O (hydrohalite) at 3400 and 3417 cm−1.
Download figure:
Standard image High-resolution image
4. Discussion
Consideration of the results presented in the previous section suggests a number of trends related to the formation of crystalline salt hydrates versus vitreous salt hydrates. As expected, crystalline hydrates were observed to form at slower cooling rates than their vitreous counterparts within a given system. When a solution is cooled at sufficiently slow rates, i.e., under equilibrium conditions, the cations in solution have a higher probability of finding their counterpart anions and arranging themselves along with surrounding water molecules in the most energetically favorable state. In other words, when cooled under equilibrium conditions, after some potential degree of supercooling, crystalline salt hydrates should be the most stable form. Conversely, if the solution is cooled sufficiently fast, salt hydrates precipitate out of solution but are "locked" in a state of disorder before crystallization can occur. Both thermodynamic and kinetic parameters thus affect the minimum cooling rate needed to avoid crystallization. It was this critical cooling rate that was the target of investigation for the systems studied here. However, due in part to the experimental limitations to accurately control the cooling rate finer than a couple degrees per minute, the critical rate could only be bound to the varying degrees as discussed in the previous section. Nevertheless, the current level of precision is likely sufficient in the context of geological processes for the emplacement of brines onto the surfaces of icy worlds.
Another trend that is apparent from the results is that solutions with lower ionic concentrations form glasses at lower cooling rates. This behavior is consistent with the previous observation of cooling rates versus glass/crystal formation. When species are in low concentration, the probability of them interacting and combining with the requisite partners to form a given hydrated salt crystal is reduced. At some point, the concentration is sufficiently low that the correct combination of species do not interact before they "freeze" in place, preserving the disorder of the liquid and forming a glass.
A final interesting observation is that glasses formed much more readily in samples with Mg cations when compare with those with Na cations. For example, in comparing 0.1 M sulfate solutions, MgSO4 was seen to form vitreous hydrates at cooling rates as low as 11 K minute−1, whereas Na2SO4 formed crystalline Na2SO4•10H2O even when flash frozen. In fact, all of the Na2SO4 solutions tested that produced a detectable sulfate stretch feature (i.e., 0.1 M, 0.05 M, and 0.025 M) formed crystalline Na2SO4•10H2O when flash frozen. The same behavior was also evident in the measured chloride salts. This may be due to the fact that Mg2+ has a higher hydration enthalpy (−1921 kJ mol−1) than Na+ (−409 kJ mol−1) (Smith 1977). In other words, since Mg2+ is a smaller ion and has a higher charge density than Na+, its interaction with the water molecules in solution would be stronger, leading to a much tighter hydration shell. As such, it should be considerably harder for the counterion to approach and combine with Mg2+ to crystallize, as compared to the more loosely bound Na+ hydration shell.
5. Conclusion
The experiments presented here were conducted with the intent to refine the range of freezing rates for which vitreous salt hydrates are expected to form from freezing of their parent brines as a function of salt concentration. In doing so, a number of trends governing the formation of vitreous salt hydrates versus their crystalline counterparts have been demonstrated. Specifically, vitreous salt hydrates form more readily at faster cooling rates and at lower ion concentrations. Further, in the examination of both Na- and Mg-bearing salts, it was seen that Mg-bearing salts have a greater propensity for forming vitreous hydrates in terms of lower freezing rates and higher concentrations. Overall, species were observed to form glasses at freezing rates ranging from flash freezing down to ∼10 K minute−1 for MgSO4 and MgCl2 solutions at concentrations on the order of those expected in Europa's ocean (i.e., 0.1 and 0.5 M, respectively). In the case of NaCl, vitreous hydrates only formed upon flash freezing, but yielded hydrohalite when cooled at 50 K minute−1. The Na2SO4 solutions, on the other hand, only produced crystalline mirabilite even when flash frozen. Unfortunately, the critical cooling rate for formation of these Na-bearing salts could not be further bounded due to limitations of the apparatus (i.e., 50 K minute−1 was the maximum cooling rate achievable with the cryostage).
Overall, these results emphasize the potential for formation of vitreous salt hydrates on Europa and other icy ocean worlds. Specifically, the relatively low critical freezing rates demonstrated here suggest that the relevance of vitreous salt hydrate formation on Europa is not limited to extreme flash-freezing scenarios such as plume deposition. For context, the so-called type III (salt-rich) particles in Enceladus' plume (i.e., 1–10 μm sized aerosols) have been estimated to freeze at a rate of 104 K s−1 (Postberg et al. 2009; Fox-Powell & Cousins 2021). Generally, the detection of vitreous salt hydrates on Europa's surface could be evidence of endogenic ocean materials, providing some insight into the provenance of the samples potentially probed by future landed missions. This, in turn, would require any in situ Raman spectrometer to not only have a broad spectral range coverage (∼100–3800 cm−1), but also high enough spectral resolution (e.g., better than 4 cm−1 in the 1000 cm−1 region) to be able to distinguish vitreous versus crystalline salt hydrates.
This research was carried out at the Jet Propulsion Laboratory, California Institute of Technology, under a contract with the National Aeronautics and Space Administration (80NM0018D0004), and was supported by JPL's Research and Technology Development program. © 2022. California Institute of Technology. Government sponsorship acknowledged.