


Abstract
We present preexplosion optical and infrared (IR) imaging at the site of the type II supernova (SN II) 2023ixf in Messier 101 at 6.9 Mpc. We astrometrically registered a ground-based image of SN 2023ixf to archival Hubble Space Telescope (HST), Spitzer Space Telescope (Spitzer), and ground-based near-IR images. A single point source is detected at a position consistent with the SN at wavelengths ranging from HST R band to Spitzer 4.5 μm. Fitting with blackbody and red supergiant (RSG) spectral energy distributions (SEDs), we find that the source is anomalously cool with a significant mid-IR excess. We interpret this SED as reprocessed emission in a 8600 R⊙ circumstellar shell of dusty material with a mass ∼5 × 10⁻⁵M⊙ surrounding a  and
and  K RSG. This luminosity is consistent with RSG models of initial mass 11 M⊙, depending on assumptions of rotation and overshooting. In addition, the counterpart was significantly variable in preexplosion Spitzer 3.6 and 4.5 μm imaging, exhibiting ∼70% variability in both bands correlated across 9 yr and 29 epochs of imaging. The variations appear to have a timescale of 2.8 yr, which is consistent with κ-mechanism pulsations observed in RSGs, albeit with a much larger amplitude than RSGs such as α Orionis (Betelgeuse).
Export citation and abstract BibTeX RIS

Original content from this work may be used under the terms of the Creative Commons Attribution 4.0 licence. Any further distribution of this work must maintain attribution to the author(s) and the title of the work, journal citation and DOI.
1. Introduction
All hydrogen-rich supernovae (SN II) with directly identified progenitor stars have been interpreted to come from systems with initial mass <20 M⊙ (Smartt 2015). With the exception of the blue supergiant progenitor of the peculiar SN II 1987A (Hillebrandt et al. 1987; Arnett et al. 1989), the yellow supergiant progenitor stars of hydrogen-poor SNe IIb (e.g., Aldering et al. 1994), and the luminous blue variable (LBV) progenitor stars to SNe IIn (e.g., Gal-Yam & Leonard 2009), all of these systems are red supergiants (RSGs). These stars have massive, extended, hydrogen envelopes and make up the majority of directly identified progenitor stars to core-collapse SNe (SNe 2003gd, 2004A, 2004et, 2005cs, 2006my, 2008bk, 2009hd, 2009kr, 2009md, 2012A, 2012aw, 2012ec, 2016cok, 2017eaw, 2018aoq, 2020jfo, and 2022acko; Smartt et al. 2004; Maund & Smartt 2009; Elias-Rosa et al. 2010; Fraser et al. 2010; Crockett et al. 2011; Fraser et al. 2011; Kochanek et al. 2012; Maund et al. 2013; Tomasella et al. 2013; Fraser et al. 2014; Maund et al. 2014; Kochanek et al. 2017; Kilpatrick & Foley 2018; O'Neill et al. 2019; Rui et al. 2019; Van Dyk et al. 2019; Sollerman et al. 2021; Van Dyk et al. 2023a, 2023b). The lack of >20 M⊙ RSG progenitor stars of SNe II despite the fact that they make up ≈15% of RSGs following a Salpeter initial mass function and RSGs with  are observed in the LMC, M31, and M33 (Drout et al. 2012; Neugent et al. 2020; Neugent 2021a, 2021b) has been noted as the "RSG problem" (Smartt et al. 2009; Smartt 2009, although see also Davies & Beasor 2018).
Theoretically, massive RSGs are predicted to have compact oxygen cores, and many of them may collapse directly to black holes as "failed SNe," leading to a paucity of high-mass counterparts to SNe II (Sukhbold et al. 2016). This scenario broadly agrees with the light curves and nucleosynthetic yields of SNe II, which also favor lower-mass progenitor stars (Brown et al. 2013; Müller et al. 2017; Morozova et al. 2018) as well as direct evidence for a high-mass RSG in NGC 6946 whose optical counterpart disappeared (Adams et al. 2017; see also Neustadt et al. 2021a and Byrne & Fraser 2022). This source also left behind a weak infrared (IR) transient consistent with expectations for mass ejection in failed SNe (Lovegrove & Woosley 2013; Piro 2013; Fernández et al. 2018). Long time baseline follow up of nearby galaxies with deep, high-resolution imaging can constrain the fraction of disappearing stars, such as the estimate by the "Survey for Nothing" that ≈16% of massive stars produce failed SNe in Neustadt et al. (2021b), close to the value required by an upper mass threshold for successful explosions of >20 M⊙ stars. Simultaneously constraining the fractions and mass distributions of failed SNe and SN II progenitor stars is therefore a powerful tool for probing massive star structure and the latest stages of stellar evolution.
SN II progenitor stars also exhibit a wide range of circumstellar densities in their immediate vicinity (<1015 cm) as implied by flash spectroscopy (Gal-Yam et al. 2014; Khazov et al. 2016; Yaron et al. 2017; Terreran et al. 2022; Tinyanont et al. 2022), early photometric evolution (Morozova et al. 2017, 2018), as well as evidence for preexplosion variability and eruptions (Kilpatrick & Foley 2018; Jacobson-Galán et al. 2022). These features may have significant implications for the interpretation of their preexplosion counterparts in the absence of multiband, multiepoch imaging. For example, the vast majority of SN II preexplosion counterparts are identified in F814W imaging from the Hubble Space Telescope (HST; e.g., Smartt 2009; Davies & Beasor 2018). This filter is blueward of the peak of RSG spectral energy distributions (SEDs) and may be significantly impacted by circumstellar extinction in the presence of a dusty shell. Moreover, many RSGs exhibit well-known modes of variability (Stothers 1969; Jurcevic et al. 2000; Guo & Li 2002; Yang & Jiang 2011; Soraisam et al. 2018) that may become even more extreme as they approach core collapse (Yoon & Cantiello 2010; Fuller 2017; Davies et al. 2022), although SN 2016cok is a counterexample whose progenitor star exhibited very little variability (Kochanek et al. 2017). Without multiepoch imaging in which their average luminosities can be estimated, interpretation of photometry for SN II preexplosion counterparts is complicated by large systematic uncertainties.
Here we present preexplosion imaging to the nearby SN II 2023ixf discovered in Messier 101 (M101) on 2023 May 19 (Itagaki 2023). These data cover ultraviolet to mid-IR bands from 1999–2019. We demonstrate that there is a single credible progenitor candidate to SN 2023ixf and estimate its luminosity, temperature, and initial stellar mass as well as its variability and total circumstellar material (CSM) inferred from a significant mid-IR excess. We find it was significantly variable in the mid-IR and compare that timescale with well-observed RSGs. We summarize the total data set and our reduction procedure in Section 2 and the analysis and modeling of those data in Section 3. Finally, we discuss the broader implications of this progenitor candidate in Section 4 and conclude in Section 5.
We assume a line-of-sight extinction through the Milky Way of AV = 0.025 mag (assuming RV = 3.1, this is E(B − V) = 0.008 mag) from Schlafly & Finkbeiner (2011). We also adopt the latest Cepheid distance to M101 of 6.85 ± 0.15 Mpc from Riess et al. (2022). Finally, throughout this paper we reference W. V. Jacobson-Galán et al. (2023, in preparation), who demonstrate that SN 2023ixf appears to be a normal type II SN with broad lines of hydrogen. We also assume a host reddening to SN 2023ixf of E(B − V) = 0.033 mag from W. V. Jacobson-Galán et al. (2023, in preparation), derived from Na i D line absorption in optical spectra of this event. Given the small value for this line-of-sight reddening, it does not significantly impact our results and we adopt a total-to-selective extinction ratio in the host galaxy of RV = 3.1 (implying AV = 0.10 mag), however we acknowledge that this could range from RV = 2–6 (implying AV = 0.07–0.20 mag).
2. Observations of SN 2023ifx and Its Progenitor Candidate
2.1. HST
The site of SN 2023ixf was observed with HST's WFPC2, Advanced Camera for Surveys (ACS), and WFC3 over seven epochs from 1999 March 23 to 2018 March 30, or 24.2 to 5.1 yr before discovery (Table 1). Following methods described in Kilpatrick et al. (2022) and Kilpatrick et al. (2021), we used the custom python-based pipeline hst123 20 to download, align, and drizzle all HST imaging (for details, see Hack et al. 2021), and perform photometry in dolphot (Dolphin 2016). We used recommended dolphot settings for each imager as described in the respective manual. 21
Table 1. HST Photometry of the SN 2023ixf Progenitor Candidate
| MJD | Instrument | Filter | m | σm |
|---|---|---|---|---|
| (mag) | (mag) | |||
| 51260.9786 | WFPC2 | F656N | >23.433 | ⋯ |
| 51261.0390 | WFPC2 | F675W | 26.422 | 0.230 |
| 51261.1120 | WFPC2 | F547M | >26.273 | ⋯ |
| 51345.9897 | WFPC2 | F656N | >23.776 | ⋯ |
| 51346.0529 | WFPC2 | F547M | >26.416 | ⋯ |
| 52593.9933 | ACS/WFC | F435W | >27.393 | ⋯ |
| 52594.0096 | ACS/WFC | F555W | >27.099 | ⋯ |
| 52594.0215 | ACS/WFC | F814W | 24.881 | 0.059 |
| 52878.3224 | WFPC2 | F336W | >27.025 | ⋯ |
| 53045.0069 | ACS/WFC | F658N | 25.332 | 0.284 |
| 56735.8571 | WFC3/UVIS | F673N | >24.629 | ⋯ |
| 58207.4384 | ACS/WFC | F658N | >25.488 | ⋯ |
| 58207.4561 | ACS/WFC | F435W | >27.799 | ⋯ |
Note. All magnitudes are in the AB system.
A machine-readable version of the table is available.
Download table as: DataTypeset image
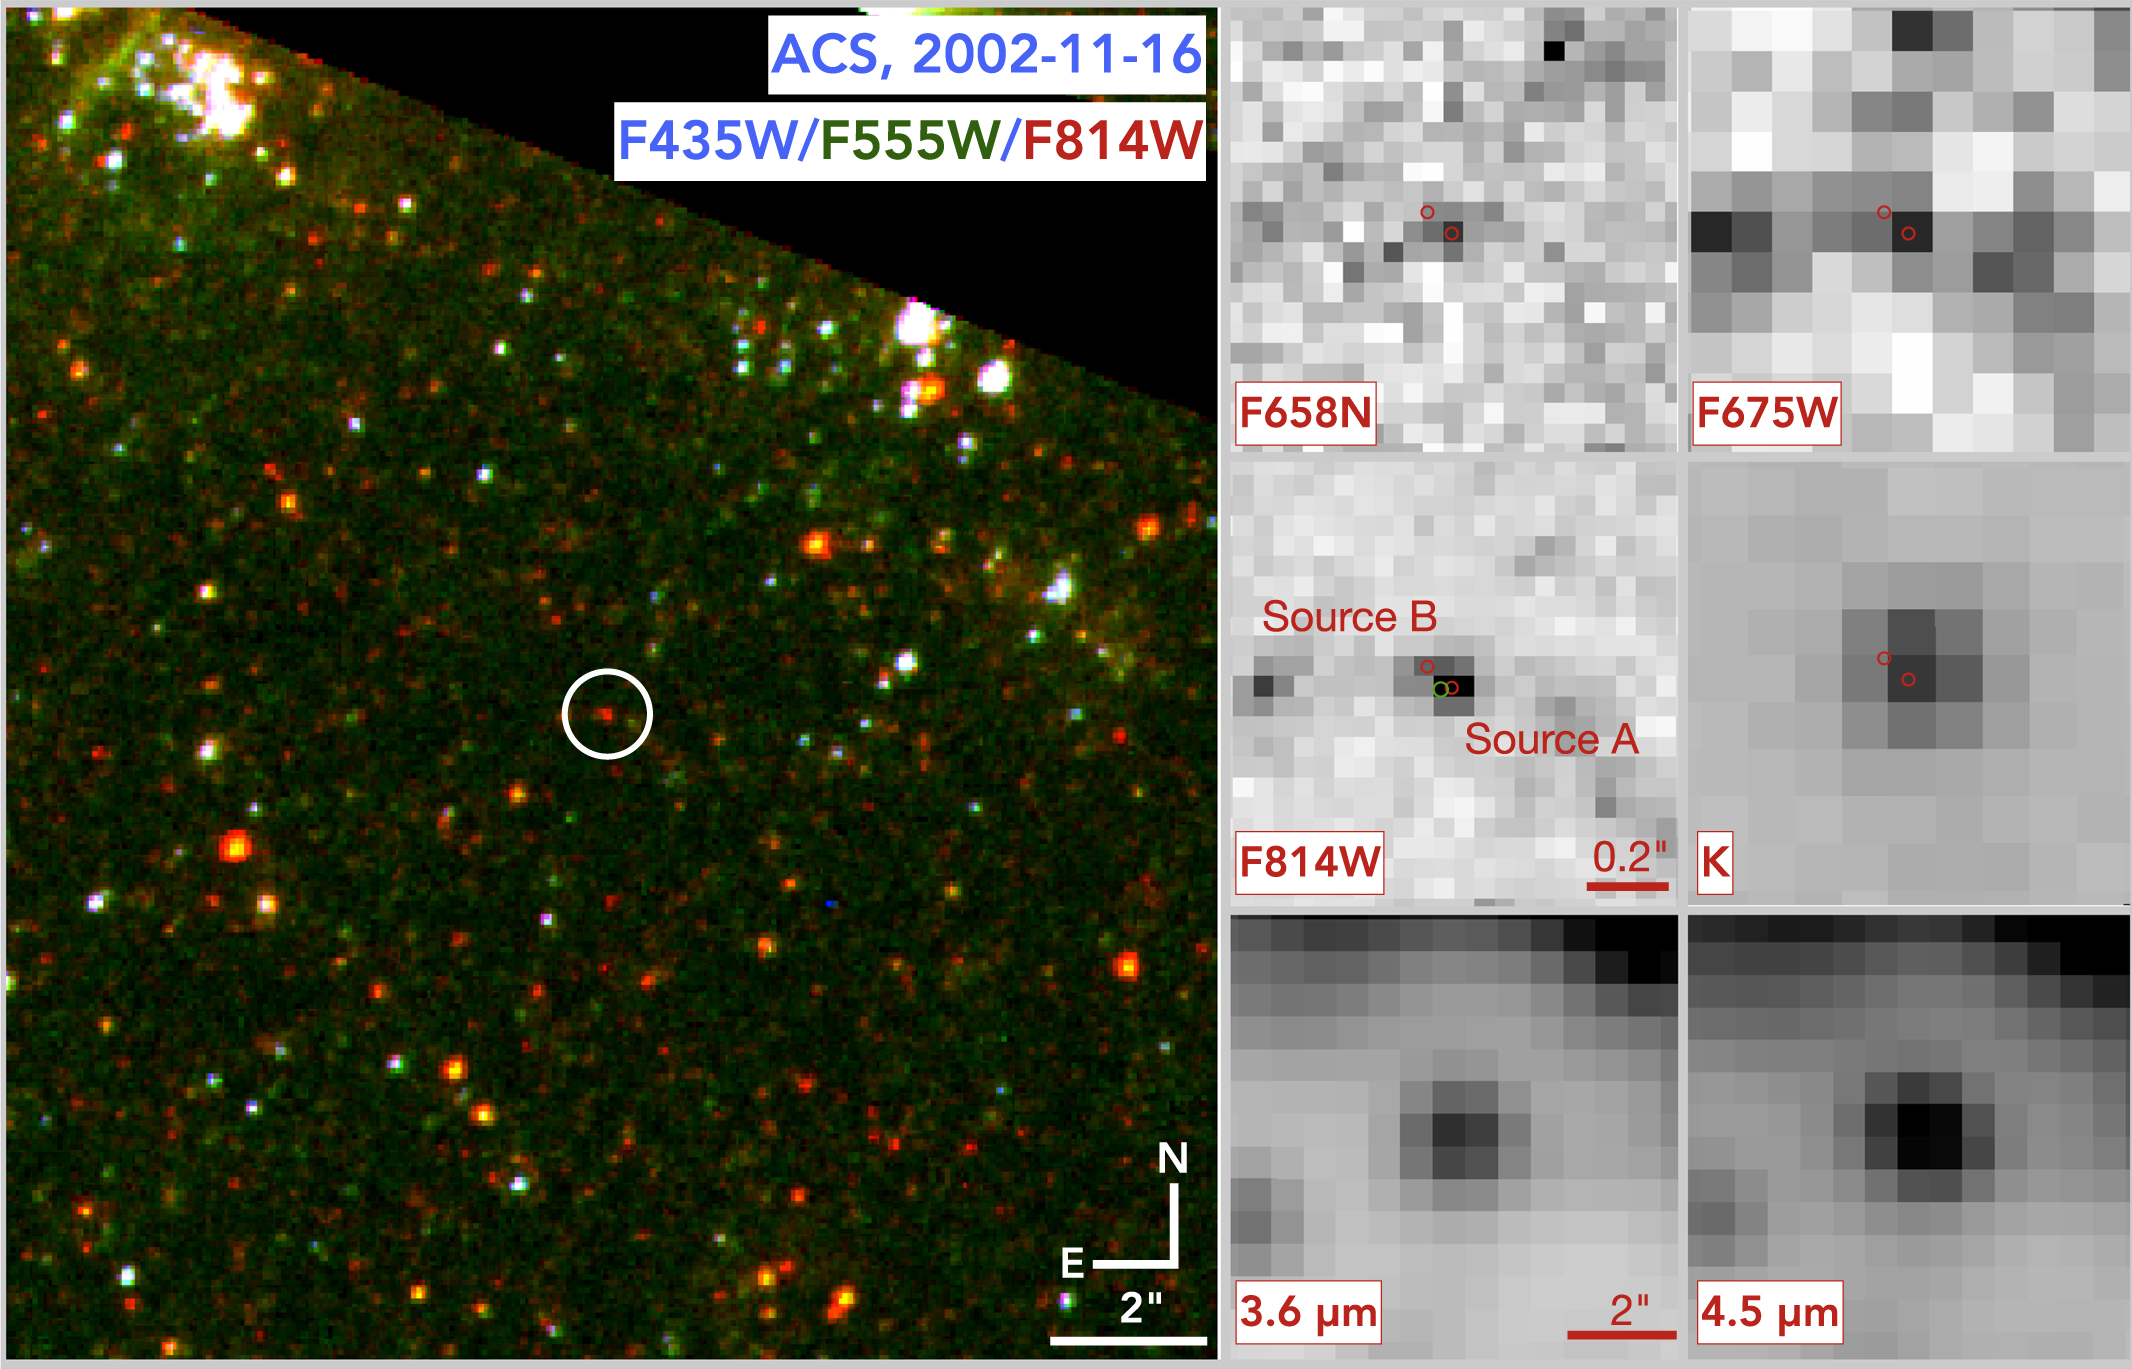
The final stacked imaging of M101 observed in 2002 by ACS is shown in Figure 1 as an RGB image (F814W, F555W, and F435W). We also show each image in which we obtain a detection of a counterpart at the explosion site of SN 2023ixf, which includes WFPC2 F675W and ACS F658N imaging. In addition, we have deep constraints in the bluer bands F336, F435W, and F555W, which we consider in the context of a binary companion below.

Figure 1. Left: a 15 4 × 131 cutout of HST/ACS imaging toward M101 in F435W (blue), F555W (green), and F814W (red). We show the approximate explosion site of SN 2023ixf as a 1'' diameter white circle. Right panels: panels showing preexplosion F658N, F675W, F658N, Gemini/NIRI K band, and Spitzer Channel 1 (3.6 μm) and 2 (4.5 μm) imaging where we detect a counterpart at the site of SN 2023ixf. The HST and K-band images are on the same scale, while the Spitzer 3.6 and 4.5 μm images show a zoomed-out scale to highlight the location of the counterpart. We show red circles corresponding to the locations of Sources A and B, close to the site of SN 2023ixf as discussed in Section 2.1. We also note the position of the SN (with the approximate systematic uncertainty 004) with a green circle in the F814W panel (see Section 3.1).
Download figure:
Standard image High-resolution imageWithin 02 of the reported position of SN 2023ixf, there are two sources detected in F814W. This is clearly seen in Figure 1 where a counterpart is located at the site of SN 2023ixf in the ACS imaging and appears as a blended source in the F814W panel. The brighter source has mF814W = 24.881 ± 0.059 mag
22
that we refer to as "Source A" (we note that this is the same source identified in Pledger & Shara 2023) and is blended with the fainter "Source B" approximately 01 (2.0 ACS/WFC pixels) to the northeast with mF814W = 25.955 ± 0.125 mag. Below we consider which, if either, of these sources may be the preexplosion counterpart to SN 2023ixf and the extent to which any blended emission from other sources may contaminate the photometry of that source in other bands with poorer resolution.
2.2. Spitzer Space Telescope/IRAC
The site of SN 2023ixf was observed over 31 epochs with the Spitzer Space Telescope Infrared Array Camera (Spitzer/IRAC) from 2004 March 8 to 2019 October 25, roughly 19.2 to 3.6 yr prior to discovery. We obtained all such imaging for the cold and warm Spitzer mission from the Spitzer Heritage Archive. 23 Following methods described in Fox et al. (2021) and Rubin et al. (2021), we applied a forward-modeling approach to estimate the Channel 1 and 2 (3.6 and 4.5 μm, respectively) fluxes of point-like emission near the site of SN 2023ixf. After stacking and mosaicking the individual epochs in MOPEX (Makovoz & Khan 2005), we identified a single point source within 2'' of the site of SN 2023ixf, originally reported in Szalai & van Dyk (2023) and Mayya (2023) and detected in all Channel 1 and 2 frames. We estimated the total flux of this source in the individual basic calibrated data (cbcd) frames across each epoch using realistic point-spread functions (PSFs) for the warm Spitzer mission and a python-based forward-modeling code. 24 This photometry is given in Table 2. We also provide the average photometry, which we use in our modeling below with added uncertainties accounting for the individual error bars and standard deviation across all epochs.
Table 2. Spitzer/IRAC Photometry of the SN 2023ixf Progenitor Candidate
| MJD | Band | Flux | Uncertainty |
|---|---|---|---|
| (μJy) | (μJy) | ||
| 53072.0903 | Ch1 | 29.80 | 2.22 |
| 53072.0903 | Ch2 | 28.97 | 2.74 |
| 53072.0903 | Ch3 | <26.78 | ⋯ |
| 53072.0903 | Ch4 | <30.60 | ⋯ |
| 53072.4901 | Ch1 | 29.01 | 2.88 |
| 53072.4901 | Ch2 | 26.55 | 3.41 |
| 53072.4901 | Ch3 | <27.00 | ⋯ |
| 53072.4901 | Ch4 | <30.72 | ⋯ |
| 55960.7226 | Ch1 | 17.82 | 2.50 |
| 55980.9934 | Ch1 | 17.50 | 2.44 |
| 56165.0117 | Ch2 | 17.85 | 2.53 |
| 56337.0654 | Ch1 | 16.96 | 2.77 |
| 56348.1056 | Ch1 | 19.52 | 2.48 |
| 56516.3523 | Ch2 | 19.01 | 2.55 |
| 56742.8361 | Ch1 | 29.45 | 2.30 |
| 56742.8361 | Ch2 | 32.09 | 1.97 |
| 56771.8253 | Ch1 | 29.94 | 2.31 |
| 56771.8253 | Ch2 | 31.37 | 1.75 |
| 56902.0136 | Ch1 | 24.27 | 3.31 |
| 56902.0136 | Ch2 | 26.52 | 3.24 |
| 57136.6924 | Ch1 | 17.71 | 2.20 |
| 57136.6924 | Ch2 | 22.66 | 1.83 |
| 57144.0597 | Ch1 | 19.24 | 2.01 |
| 57144.0597 | Ch2 | 20.47 | 1.86 |
| 57150.1719 | Ch1 | 21.23 | 1.92 |
| 57150.1719 | Ch2 | 19.67 | 1.72 |
| 57163.7124 | Ch1 | 21.37 | 1.77 |
| 57163.7124 | Ch2 | 25.15 | 1.51 |
| 57191.8234 | Ch1 | 14.30 | 2.36 |
| 57191.8234 | Ch2 | 19.11 | 2.03 |
| 57220.7940 | Ch1 | 15.19 | 2.69 |
| 57220.7940 | Ch2 | 18.19 | 2.32 |
| 57247.8227 | Ch1 | 15.53 | 2.88 |
| 57247.8227 | Ch2 | 14.94 | 2.37 |
| 57486.8506 | Ch1 | 21.44 | 2.18 |
| 57486.8506 | Ch2 | 24.44 | 1.64 |
| 57843.9334 | Ch1 | 27.66 | 2.27 |
| 57843.9334 | Ch2 | 30.23 | 2.00 |
| 57926.9005 | Ch2 | 26.65 | 1.98 |
| 58009.6705 | Ch1 | 22.82 | 2.73 |
| 58009.6705 | Ch2 | 20.87 | 2.66 |
| 58232.9534 | Ch1 | 21.63 | 2.13 |
| 58232.9534 | Ch2 | 20.51 | 1.98 |
| 58292.8692 | Ch1 | 17.46 | 1.37 |
| 58292.8692 | Ch2 | 21.34 | 1.68 |
| 58380.2202 | Ch1 | 18.29 | 2.84 |
| 58380.2202 | Ch2 | 17.32 | 2.53 |
| 58572.0773 | Ch1 | 22.39 | 2.54 |
| 58572.0773 | Ch2 | 26.20 | 2.03 |
| 58614.3896 | Ch1 | 22.33 | 2.44 |
| 58614.3896 | Ch2 | 27.38 | 1.85 |
| 58655.6803 | Ch1 | 25.47 | 2.06 |
| 58655.6803 | Ch2 | 28.60 | 1.81 |
| 58697.4982 | Ch1 | 28.49 | 2.53 |
| 58697.4982 | Ch2 | 27.30 | 2.07 |
| 58740.0119 | Ch1 | 22.42 | 3.17 |
| 58740.0119 | Ch2 | 23.75 | 2.62 |
| 58781.3131 | Ch1 | 28.26 | 3.17 |
| 58781.3131 | Ch2 | 32.80 | 2.41 |
| Average Spitzer/IRAC Photometry | |||
| ⋯ | Ch1 | 22.13 | 4.78 |
| ⋯ | Ch2 | 23.99 | 4.87 |
| ⋯ | Ch3 | <21.64 | ⋯ |
| ⋯ | Ch4 | <24.15 | ⋯ |
Note. See Section 2.2.
A machine-readable version of the table is available.
To validate our Spitzer photometry, we used our photometry code to analyze a sequence of 8–10 stars across every image. We looked for variability that may arise from instrumental effects or the position of the spacecraft at the time of observation. Our photometry indicates that all stars exhibit very little variability (i.e., at the <5% level) compared with the photometry of the SN 2023ixf counterpart across each epoch. We conclude that variations in the counterpart are intrinsic to that source as opposed to systematic effects.
In addition, there were two epochs of Channel 3 and 4 (5.4 and 8.0 μm, respectively) data obtained at the site of SN 2023ixf from the cold Spitzer mission. We do not detect any significant source of emission in either epoch and instead place a forced circular aperture with a size of 30 and 34, or approximately 2× the FWHM of the Spitzer point-response function, at the site of SN 2023ixf. From these data, we estimate a 3σ upper limit on the presence of any emission, which is given for both epochs in Table 2. We also estimate a flux-weighted average and standard deviation of all Channel 1 and 2 photometry as well as limiting fluxes for the stacked Channel 3 and 4 imaging obtained using the same method as the individual epochs, which are all given as the last four rows in Table 2.
Finally, we consider the possibility that the Spitzer counterpart is a blend of Sources A and B, or other sources not visible in the HST bands. If all sources have similar optical–IR colors, then deblending Sources A and B in the Spitzer frames could reduce the flux of the true counterpart by 27%, comparable in magnitude to our error bars on the average values. Additional follow-up observations with JWST at late times would resolve any emission at the scale of the Source A and B separation, enabling a cleaner subtraction of any blended emission. For the analysis below, we assume that the Spitzer flux is entirely dominated by the SN 2023ixf counterpart.
2.3. Ground-based IR Imaging
The NEWFIRM IR camera (Autry et al. 2003) observed M101 in the JHKs
bands from 2010 June 29 to July 1. We obtained these data as reduced and sky-subtracted image frames from the NOIRLab data archive.
25
Stacking the frames for each band in swarp (Bertin 2010) using flux scaling derived from the calibration in their image headers, we recalibrated the final coadded image using DoPhot PSF photometry (Schechter et al. 1993) and Two Micron All Sky Survey (2MASS) JHKs
photometric calibrators in the same image frame as the NEWFIRM images (Skrutskie et al. 2006). We detect a point-like counterpart within 2'' of the site of SN 2023ixf in the Ks
image, which is also the deepest NEWFIRM image overall. In summary, we find that this source has  mag, mH
> 20.36 mag, and mJ
> 20.18 mag.
mag, mH
> 20.36 mag, and mJ
> 20.18 mag.
The site of SN 2023ixf was also observed by the Gemini-North telescope with the Near-Infrared Imager (NIRI) on 2010 April 18 using the K-band continuum filter and 51 × 50 s exposures. We processed all such imaging using pyraf-based methods from the Gemini IRAF library (Cooke & Rodgers 2005) developed for NIRI, including dark-frame subtraction, flat-fielding, sky subtraction, and optimal alignment and image coadding. We performed photometry following the same methods described above for the NEWFIRM imaging, however there were only two 2MASS Ks standard stars in the NIRI image. Therefore, we use photometry of all objects other than the SN 2023ixf counterpart that are classified as bright point sources (Object type 1) by DoPhot from the calibrated NEWFIRM Ks image to calibrate the NIRI image. Similar to the NEWFIRM imaging, there is a single point-like source within 2'' of the SN 2023ixf position, shown in Figure 1. We find that this source has mK = 20.72 ± 0.08 mag.
2.4. GMOS Imaging of SN 2023ixf
Gemini-North/GMOS obtained a series of 10 × 1 s images and 3 × 60 s images in the gri bands on 2023 June 3 and 5. We obtained all such imaging from the Gemini Data Archive, 26 and following standard procedures in astropy, we removed the bias from these frames using the overscan correction. We then calibrated each frame using DoPhot photometry (Schechter et al. 1993) and Pan-STARRS standard stars in each frame of the GMOS images (Flewelling et al. 2020). To obtain the deepest possible image of the field surrounding SN 2023ixf without saturating the SN position, we masked saturated pixels from the SN and stacked all images in swarp (Bertin 2010) into a single g+r+i frame, weighting the individual frames by the inverse variance of the sky pixels across the individual bands. The final image centered on the position of SN 2023ixf is shown in Figure 2.
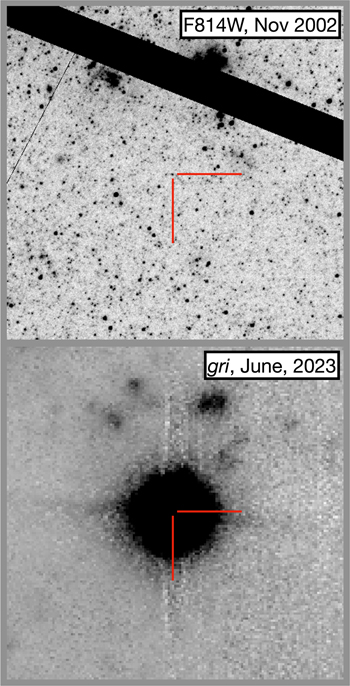
Figure 2. A part of HST/ACS F814W imaging (top) of M101 from 2002 November 16 compared with a gri image from Gemini-North/GMOS (bottom) of the same field from 2023 June showing the location of SN 2023ixf. We identify a single counterpart at the position of SN 2023ixf in the ACS image, discussed in detail in Section 3.1.
Download figure:
Standard image High-resolution image3. The Progenitor Candidate of SN 2023ifx
3.1. Aligning Pre- and Postexplosion Imaging
To establish that SN 2023ixf is associated with a candidate counterpart in preexplosion imaging, we align our postexplosion GMOS image to the ACS F814W frame and determine astrometrically whether the SN is consistent with coming from any point-like sources. Although this method can rule out an association between the SN and any preexplosion counterpart, high-resolution follow-up imaging after the SN has faded is needed to establish that any counterpart has disappeared and the association was not a chance coincidence.
We identify 108 common sources between the ACS F814W frame and Gemini g+r+i image frame, which we use to establish a coordinate transformation using the IRAF package ccmap. The rms offset from this coordinate transformation solution is 002 in both R.A. and decl. To determine the systematic uncertainty in our coordinate transformation (and following methods from Kilpatrick et al. 2021), we take half of the astrometric calibrator sources from our sample and recalculate the coordinate transformation. We then estimate the offsets between the remaining stars. Repeating this process 100 times, we find that the average offset between stars across all trials is ∼003. In total, we estimate a 004 uncertainty (1.3 pc at the distance of M101) in our alignment between the two frames.
The position of SN 2023ixf aligns with Source A (Figure 2) to within 0.8σ, while it is 2.4σ away from Source B. Thus while SN 2023ixf could be astrometrically consistent with either source, there is a strong preference for Source A in our analysis. There is no evidence for a second source in any other image frame that we analyze, and both SN 2023ixf and Source A are astrometrically consistent with being the same object as the point sources we identified in WFPC2/F675W, ACS/F658N, Gemini/NIRI K band, and Spitzer Channels 1 and 2 across all epochs. We provide all photometry of that source in Tables 1 and 2. 27
Finally, we estimate the probability of chance coincidence with Source A by noting that there are 238 sources detected at >3σ within 3'' (100 pc at the distance of M101) of that source. Therefore, there is a 4% chance of a single source landing within 1σ of the astrometric uncertainty of SN 2023ixf by chance. While this is a moderately large probability of chance coincidence, the likelihood could be reduced significantly with high-resolution follow-up imaging and, eventually, by determining whether the candidate counterpart has disappeared with follow-up observations after SN 2023ixf fades.
3.2. The SED of the SN 2023ixf Progenitor System
3.2.1. Single Blackbody Fit
Assuming that the SN 2023ixf preexplosion counterpart is dominated by a single SED from its progenitor star and with no variability between each epoch (though see the Spitzer analysis in Section 3.3), we can model the nature of this source from the ultraviolet to mid-IR. We initially adopt a simple blackbody spectrum and derive its temperature and luminosity using a Markov Chain Monte Carlo (MCMC) approach in the python-based package emcee. Assuming the distance, Milky Way extinction, and host extinction given above, we derive the in-band magnitudes for a blackbody spectrum of a given temperature and luminosity using the filter transmission functions for each space- and ground-based bandpass and using pysynphot. Following methods in Kilpatrick et al. (2021), we fit a blackbody model by sampling the posterior distribution over the range of model parameters, and report their posterior means and standard deviations.
Following this method, we find that the SN 2023ixf progenitor candidate is consistent with a  and Teff = 1640 ± 20 K blackbody as shown in Figure 3. This implied photospheric temperature is extremely low, even for the latest M supergiant spectral types (i.e., the coolest RSGs have Teff = 3400–3500 K; Levesque et al. 2006; Davies et al. 2013; Davies & Beasor 2018). The photospheric radius implied by Teff = 1640 K (≈2900 R⊙) suggests that we are seeing material extended well beyond the envelope of an RSG such as a shell of CSM in the local environment around the SN 2023ixf progenitor star. We infer that the photosphere in the IR is dominated by a component of host dust, and instead turn to a multicomponent SED fit below.
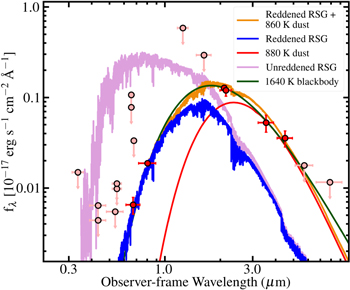
Figure 3. SED of the preexplosion counterpart to SN 2023ixf, with red circles denoting detections and pink circles denoting upper limits (described in Section 3.2). We fit the HST, Spitzer, and ground-based photometry with a 1640 K blackbody (green), which describes the data but is much cooler than typical effective temperatures for the RSG progenitor stars of SNe II (e.g., Smartt 2015). We also show an RSG SED for a reddened RSG supergiant with a Teff = 3920 K photosphere inside of a 880 K dust shell exhibiting mid-IR excess (orange; from Kilpatrick & Foley 2018) as well as the intrinsic stellar SED without reddening. The individual components of the overall reddened RSG SED (reddened star, dust shell, and unreddened star) are shown in blue, red, and purple, respectively. The SED of the preexplosion counterpart to SN 2023ixf is available as data behind the figure.(The data used to create this figure are available.)
Download figure:
Standard image High-resolution image
Figure 4. A Hertzsprung–Russell diagram zoomed in on the RSG branch. The location of the SN 2023ixf progenitor candidate inferred from our RSG spectral model (Section 3.2) is shown as a red star. For context, we show the locations of other SN II progenitor stars from Smartt (2015) as red squares, the progenitor stars of the SNe IIb 1993J (Aldering et al. 1994), 2011dh (Maund et al. 2011), and 2013df (Van Dyk et al. 2014) as green circles, and the progenitor candidate of the SN Ib 2019yvr (Kilpatrick et al. 2021) as a blue diamond. The black lines are single-star evolutionary tracks from MIST (Choi et al. 2016) as described in Section 3.2.
Download figure:
Standard image High-resolution image3.2.2. MARCS RSG and Circumstellar Dust Fit
To fit the counterpart with a more realistic optical to mid-IR SED, we use a combined RSG and dusty CSM spectrum initially presented in Kilpatrick & Foley (2018) and based on DUSTY radiative transfer models (from Kochanek et al. 2012; see also Ivezic & Elitzur 1997; Ivezic et al. 1999; Elitzur & Ivezić 2001). This model uses a MARCS RSG spectrum of an arbitrary temperature and luminosity (see Gustafsson et al. 2008 for details), which is reprocessed through a shell of graphitic dust at a given temperature and mass (i.e., similar to carbon-bearing species around massive RSGs; e.g., Royer et al. 2010). In general, we fit for the RSG luminosity, stellar temperature, dust temperature, and V-band optical depth through the mass of dust. These assumptions yield a mass, luminosity, and radius for the dust assuming an r−2 density profile (see Kochanek et al. 2012; Kilpatrick & Foley 2018 for more details). Assuming a dust-to-gas ratio and wind speed, we can then derive the total mass of CSM and mass-loss rate, which we give below.
From this model, we find that the effective temperature of the counterpart is more in line with known RSGs at  K while the overall luminosity remains the same at
  . In order to fit the IR excess observed in the Spitzer bands, we require a circumstellar shell of dust with a V-band optical depth of τV
= 5.8 ± 0.2 (corresponding to AV
= 4.6 ± 0.2 mag) and an effective temperature of Tdust = 880 ± 40 K. This shell would have an effective radius of
. In order to fit the IR excess observed in the Spitzer bands, we require a circumstellar shell of dust with a V-band optical depth of τV
= 5.8 ± 0.2 (corresponding to AV
= 4.6 ± 0.2 mag) and an effective temperature of Tdust = 880 ± 40 K. This shell would have an effective radius of  R⊙ and a total dust mass of
  M⊙, or a total mass of 5 × 10⁻⁵
M⊙ assuming a dust-to-gas ratio of 0.01 in the circumstellar environment (consistent with ratios in the environments of SNe from Fox et al. 2010).
M⊙, or a total mass of 5 × 10⁻⁵
M⊙ assuming a dust-to-gas ratio of 0.01 in the circumstellar environment (consistent with ratios in the environments of SNe from Fox et al. 2010).
Assuming it was being produced by a constant wind with an r−2 profile with a velocity of vwind, the implied mass-loss rate is  . We assume a velocity of 50 km s−1 for consistency with W. V. Jacobson-Galán et al. (2023, in preparation), noting that this value is similar to other RSGs (e.g., 30–50 km s−1 for VY CMa or NML Cyg; Knapp et al. 1982; Decin et al. 2006), however high-resolution spectroscopy of unshocked material from early in the evolution of SN 2023ixf can more precisely constrain this value.
In the fits above, we do not include the ACS F658N detection despite it being spatially coincident with Source A, as this counterpart is likely dominated by Hα emission that we do not include in our model. However, assuming that the emission in this filter contains Hα and continuum emission from an RSG, we estimate that the total Hα flux density is 1.3 × 10⁻¹⁹ erg s−1 cm−2 Å−1 (corrected for host and Milky Way extinction). This corresponds to a total Hα luminosity of 4.9 × 1039 erg s−1 or 1300 L⊙. This value far exceeds the expectations for Hα emission in massive RSGs (e.g., 1 L⊙ for VY CMa in Smith et al. 2001), and so may be unassociated with the progenitor star.
RSG binaries such as VV Cephei exhibit high Hα luminosities due to mass transfer from the RSG to an early-type binary companion (Wright 1977). The extreme variability in this line suggests a change in the mass transfer rate that is correlated with the properties of the wide binary orbit for this system. However, for VV Cephei, the equivalent width of ≈7–25 Å during the most active phases of this source implies a luminosity of LHα ≈ 10–50 L⊙ (Pollmann 2005). We cannot rule out a wide binary with our optical HST limits (Section 3.2.3), which could also explain the Hα detection for an even more extreme mass transfer rate.
Assuming that the underlying star implied by our RSG model is a single source with  , we consider its initial mass by comparing to MIST (Choi et al. 2016), STARS (Eldridge & Tout 2004), Geneva (Ekström et al. 2012), and KEPLER (Woosley & Heger 2007) models. We show the derived luminosity in comparison to the MIST models in Figure 4. All models assume solar metallicity, and either a rotating or nonrotating star. In general, the final luminosity of a model SN progenitor depends on the He core luminosity, which is higher in models including rotation and overshooting. For a MIST model assuming a star at solar metallicity, we find an initial mass of 11 ± 1 M⊙. The STARS models indicate MZAMS = 11 ± 1 M⊙, while the the Geneva rotating models produce a star of similar final luminosity at MZAMS = 11−12 M⊙. Finally, the KEPLER (nonrotating) models indicate MZAMS = 12 ± 1. Thus the star could feasibly come from a system ranging from 10–13 M⊙. Second dredge-up in 6–9 M⊙ stars can increase the final luminosity substantially (e.g., Eldridge et al. 2007; Jones et al. 2013), with the stars along the asymptotic giant branch (AGB) ending up more luminous and with cooler photospheric temperatures than their more massive M-type counterparts. While our DUSTY SED models favor a higher Teff than those of AGB stars (typically Teff ∼ 3100 K) it is possible the progenitor is a cooler AGB-type star. Measurements of the nickel mass created in the explosion and the oxygen mass ejected (both after 100–200 days) will provide interesting constraints on the core mass and explosion mechanism.
Finally, we examine the consistency of our derived mass-loss rate and initial mass with prescriptions from Beasor et al. (2020). Applying their luminosity-dependent mass-loss rates, we find that for RSGs of  they predict
  –4.2 × 10⁻⁶
M⊙ yr−1,
28
which is in close agreement with our inferred value. Similarly, applying their initial mass (for 10–12 M⊙) and luminosity-dependent parameterization,
29
we derive 0.4–1.1 × 10⁻⁶
M⊙ yr−1. These values are close to our derived mass-loss rate of 1.3 × 10⁻⁶
M⊙ yr−1, especially considering the model-dependent nature of these relations, the uncertain wind velocity, and the uncertainties in the model fitting parameters.
–4.2 × 10⁻⁶
M⊙ yr−1,
28
which is in close agreement with our inferred value. Similarly, applying their initial mass (for 10–12 M⊙) and luminosity-dependent parameterization,
29
we derive 0.4–1.1 × 10⁻⁶
M⊙ yr−1. These values are close to our derived mass-loss rate of 1.3 × 10⁻⁶
M⊙ yr−1, especially considering the model-dependent nature of these relations, the uncertain wind velocity, and the uncertainties in the model fitting parameters.
3.2.3. Constraints on a Binary Companion from Optical Limits
We also consider the possibility that the progenitor star evolved in a binary and exploded as the primary star in that system. Comparing our photometry to BPASS v2.2.1 binary star models (Eldridge et al. 2017), we examine all systems for which the combined flux from the primary and secondary at the time the primary explodes is fainter than our limiting magnitudes. We emphasize that these models do not include circumstellar extinction or predictions for the mid-IR luminosity, and we only use the limits from our bluer bands where we predict the primary star to be faint in order to constrain the presence of a companion star.
Although we examine all bands contained in the BPASS models for which we have deep limits (F336W, F435W, and F555W), our most constraining limit comes from ACS F555W with mF555W > 27.1 mag, corresponding to MF555W > −2.2 mag with no additional extinction from the CSM. This could be the case for a companion at wide separations with minimal additional extinction. For BPASS models with solar metallicity, this limit excludes any systems with a secondary star with >6.4 M⊙. In scenarios where the V-band circumstellar extinction (AV = 4.4 mag, implying MF555W > −6.6 mag) is taken into account, virtually all BPASS models are consistent with our limits. A close binary therefore remains a possibility for SN 2023ixf, whose presence could better be constrained with deep optical imaging after the SN fades.
3.3. Preexplosion Variability of the Progenitor Candidate and Implications for Mass Loss
The SN 2023ixf progenitor star exhibited extreme variability in the Spitzer/IRAC bands several years before explosion (Figure 5). We show the light curve of the counterpart at 3.6 and 4.5 μm from ∼2012–2020 in Figure 5. For comparison, we also show the 3.9 μm light curve of α Orionis (Betelgeuse) from 2017 January 1 to 2022 December 12 (Taniguchi et al. 2022), but shifted in time by 4 yr so it overlaps with that of the SN 2023ixf counterpart and scaled to its average flux at ∼23 μJy. In the SED analysis above, we emphasize that we accounted for intrinsic variations in the Spitzer bands by including the standard deviation across the light curves in the average Channel 1 and 2 fluxes.
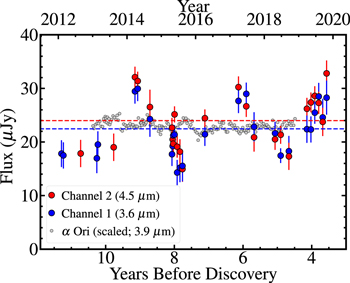
Figure 5. Light curve of the preexplosion counterpart to SN 2023ixf from Spitzer/IRAC Channel 1 and 2 observations from ∼11.3–3.6 yr prior to discovery of the SN. We note that both channels exhibit ∼16 μJy peak-to-peak variability during this time frame, with a significant peaks spaced ∼2.8 yr apart. The flux-weighted average in Channels 1 and 2 are shown as blue and red dashed lines, respectively, with their values given in Table 2. For comparison, we show the 3.9 μm light curve of Betelgeuse binned every 2 weeks from Taniguchi et al. (2022), scaled to the average flux of the SN 2023ixf counterpart at ∼23 μJy and shifted in time by 4 yr to overlap with our light curve.
Download figure:
Standard image High-resolution imageThe SN 2023ixf progenitor star exhibited significant mid-IR variability with an average of 22.44 and 23.99 μJy and peak-to-peak variability of 15.64 and 17.86 μJy at 3.6 and 4.5 μm, respectively (roughly 0.8 mag or 70% in both bands). These extreme variations appear correlated in the two Spitzer bands with approximately the same overall magnitude, which would be consistent with a mode of variability where the visible photosphere expands and contracts with at most small variations in effective temperature. We also note that these variations are similar in amplitude to the high-luminosity end of large-amplitude, cool pulsators observed in the LMC (O'Grady et al. 2020, 2023).
Moreover, the light curve from 2012–2020 exhibits as quasi-sinusoidal variation with a timescale of roughly 2.8 yr (1000 day). We infer this timescale via a Fourier transform of the Spitzer/IRAC photometry, although the sampling of the light curve and the fact that we only observe peak-to-peak variations over ∼2.5 cycles in Figure 5 suggests it is uncertain and could vary anywhere from 2.6–3.0 yr. Combined, this evidence is similar to the κ-mechanism pulsations in Betelgeuse, which are the primary mode of variability in that star and are driven by changes in the atmospheric opacity (see, e.g., Li & Gong 1994; Heger et al. 1997). Paxton et al. (2013) observe these modes with timescales of 1–8 yr directly in MESA models of RSGs where the structure of the star is resolved with sufficiently high time resolution, also in close agreement with the simulations in Yoon & Cantiello (2010) and our inferred timescale. These pulsations drive expansion and contraction in the atmosphere at a nearly constant temperature (e.g., Levesque & Massey 2020), resulting in overall changes to the luminosity from Betelgeuse.
In addition, the significant variability correlated across both bands supports the conclusion that the Spitzer counterpart is dominated by a single source. As this variability is extreme in the IR even for a single RSG, the flux is unlikely to contain significant emission from a second source (e.g., Source B) compared with the minimum flux level of our light curve in Figure 5.
Assuming this mechanism is responsible for the variability in the SN 2023ixf counterpart, the required changes in luminosity are ≈50% larger than in Betelgeuse. Our derived mass-loss rate is comparable with Betelgeuse (which has a rate from 0.2–2 × 10⁻⁶ M⊙ yr−1; Dolan et al. 2016), which matches expectations for the κ-mechanism driving strong mass loss with large variations in luminosity. However, our estimate precludes a "superwind" generated in the CSM (e.g., Yoon & Cantiello 2010; Davies et al. 2022) up to the point where our data cut off 3.6 yr before explosion. The preexplosion mass-loss rate could be enhanced if the star was significantly more active during the final 3 yr before core collapse, which is predicted by W. V. Jacobson-Galán et al. (2023, in preparation).
4. Discussion
Current estimates of the maximum luminosity of SN II progenitor stars are dominated by a handful of direct counterpart detections in the literature (e.g., Davies & Beasor 2018; Kochanek 2020), and the highest-luminosity stars in those samples contribute significant weight to statistical analyses of the distribution from which they are drawn.
Assuming the SN 2023ixf candidate counterpart is dominated by its progenitor star emission in the HST, Spitzer, and ground-based imaging, SN 2023ixf provides the best example to date of the optical to mid-IR SED of an SN II progenitor star (comparable to SN 2017eaw; Kilpatrick & Foley 2018; Rui et al. 2019; Van Dyk et al. 2019), but with a low foreground host-galaxy extinction and precise distance. The significant variability and large implied circumstellar extinction support the presence of such features in other SN II progenitor stars given the lack of multiepoch, multiband imaging in which they can be analyzed. The vast majority of directly detected SN II progenitor stars in recent analyses (Smartt 2015; Davies & Beasor 2018; Kochanek 2020) were identified from F814W imaging. Our analysis of SN 2023ixf demonstrate that it has extreme bolometric corrections when accounting for its mid-IR luminosity. This has been explored in the past as a possible explanation to the RSG problem (Walmswell & Eldridge 2012), but our dust mass estimates imply a much larger extinction than has been previously explored for SN II progenitor stars. However even with the significant stellar flux in the near- and mid-IR, the total preexplosion luminosity indicates an initial mass significantly below 20 M⊙. Future systems with Spitzer or JWST detections similar to SN 2023ixf can constrain the distribution of that extinction from their IR excess.
5. Conclusion
We have presented direct imaging showing that there is a credible progenitor candidate to the type II SN 2023ixf in M101 at 6.85 Mpc. In summary, this imaging demonstrates:
- 1.The candidate progenitor star to SN 2023ixf is most consistent with a
 RSG with an effective temperature of K. Following single-star evolutionary tracks, this would place the progenitor star's initial mass at 11 ± 2 M⊙, placing it within the range of other low- to moderate-mass RSG progenitors to SNe II (e.g., Smartt 2015).
 - 2.Modeling of the mid-IR SED from this counterpart suggests that it was enshrouded in a dusty shell of CSM similar to SN 2017eaw (Kilpatrick & Foley 2018). The implied mass-loss rate for a wind that could produce this shell divided by its wind speed is. This is comparable to more massive stars such as Betelgeuse but low compared to a "superwind" or mass-loss rates from immediately before explosion inferred in W. V. Jacobson-Galán et al. (2023, in preparation).
- 3.Spitzer/IRAC photometry exhibits significant preexplosion variability that is correlated in both bands. We also see evidence for a 2.8 yr (1000 day) timescale in this variability, similar to but generally stronger in amplitude than pulsations in other RSGs driven by opacity changes in their atmosphere (i.e., the κ mechanism; Li & Gong 1994; Heger et al. 1997; Yoon & Cantiello 2010; Paxton et al. 2013).


Future studies of the progenitor stars to SNe II will greatly benefit from multiband, multiepoch imaging of resolved stellar populations using deep optical and IR surveys of nearby galaxies, such as those by the Vera C. Rubin Observatory and Nancy Grace Roman Space Telescope (Ivezić et al. 2019; Gezari et al. 2022). To understand these stars better, their preexplosion evolution, and the exact cause of the RSG problem, only detailed SEDs and light curves from the optical to mid-IR, such as those that we present for the SN 2023ixf counterpart, can shed light on the pathways through which SN II progenitor stars evolve and explode.
Acknowledgments
We thank Divakara Mayya for providing helpful comments on our manuscript and Daisuke Taniguchi for providing comments and the Betelgeuse mid-IR light curve.
C.D.K. is partly supported by a CIERA postdoctoral fellowship and acknowledges support from a NASA grant for HST-GO-16136. M.R.D. acknowledges support from the NSERC through grant RGPIN-2019-06186, the Canada Research Chairs Program, the Canadian Institute for Advanced Research (CIFAR), and the Dunlap Institute at the University of Toronto. A.G. is supported by the National Science Foundation Graduate Research Fellowship Program under grant No. DGE1746047. A.G. also acknowledges funding from the Center for Astrophysical Surveys Fellowship at UIUC/NCSA and the Illinois Distinguished Fellowship. K.S.M. acknowledges funding from the European Unions Horizon 2020 research and innovation program under ERC Grant Agreement No. 101002652 and Marie Sklodowska-Curie Grant Agreement No. 873089. C.G. is supported by a VILLUM FONDEN Young Investigator Grant (project number 25501). J.H. was supported by a VILLUM FONDEN Investigator grant (project number 16599). S.J.S. acknowledges funding from STFC grants ST/X006506/1 and ST/T000198/1.
The UCSC team is supported in part by NASA grants NNG17PX03C and 80NSSC22K1518, NSF grant AST-1815935, the Gordon & Betty Moore Foundation, the Heising-Simons Foundation, and by a fellowship from the David and Lucile Packard Foundation to R.J.F.
The Young Supernova Experiment (YSE) and its research infrastructure is supported by the European Research Council under the European Union's Horizon 2020 research and innovation program (ERC Grant Agreement 101002652, PI: K. Mandel), the Heising-Simons Foundation (2018-0913, PI: R. Foley; 2018-0911, PI: R. Margutti), NASA (NNG17PX03C, PI: R. Foley), NSF (AST-1720756 and AST-1815935, PI: R. Foley; AST-1909796 and AST-1944985, PI: R. Margutti), the David & Lucille Packard Foundation (PI: R. Foley), VILLUM FONDEN (project 16599, PI: J. Hjorth), and the Center for AstroPhysical Surveys (CAPS) at the National Center for Supercomputing Applications (NCSA) and the University of Illinois Urbana-Champaign.
The Pan-STARRS1 Surveys (PS1) and the PS1 public science archive have been made possible through contributions by the Institute for Astronomy, the University of Hawaii, the Pan-STARRS Project Office, the Max-Planck Society and its participating institutes, the Max Planck Institute for Astronomy, Heidelberg and the Max Planck Institute for Extraterrestrial Physics, Garching, The Johns Hopkins University, Durham University, the University of Edinburgh, the Queen's University Belfast, the Harvard-Smithsonian Center for Astrophysics, the Las Cumbres Observatory Global Telescope Network Incorporated, the National Central University of Taiwan, STScI, NASA under grant NNX08AR22G issued through the Planetary Science Division of the NASA Science Mission Directorate, NSF grant AST-1238877, the University of Maryland, Eotvos Lorand University (ELTE), the Los Alamos National Laboratory, and the Gordon and Betty Moore Foundation.
YSE-PZ (Coulter et al. 2023) was developed by the UC Santa Cruz Transients Team with support from NASA grants NNG17PX03C, 80NSSC19K1386, and 80NSSC20K0953; NSF grants AST-1518052, AST-1815935, and AST-1911206; the Gordon & Betty Moore Foundation; the Heising-Simons Foundation; a fellowship from the David and Lucile Packard Foundation to R.J.F.; Gordon and Betty Moore Foundation postdoctoral fellowships and a NASA Einstein fellowship, as administered through the NASA Hubble Fellowship program, and grant HST-HF2-51462.001 to D.O.J.; and a National Science Foundation Graduate Research Fellowship, administered through grant No. DGE-1339067, to D.A.C.
This research is based on observations made with the NASA/ESA Hubble Space Telescope obtained from the Space Telescope Science Institute, which is operated by the Association of Universities for Research in Astronomy, Inc., under NASA contract NAS 526555. These observations are associated with programs 6829 (PI: Chu), 9490 (PI: Kuntz), 9720 (PI: Chandar), and 13361 (PI: Blair). This work is based in part on archival data obtained with the Spitzer Space Telescope, which was operated by the Jet Propulsion Laboratory, California Institute of Technology under a contract with NASA. Support for this work was provided by an award issued by JPL/Caltech. Based on observations obtained at the international Gemini Observatory, a program of NSFs NOIRLab, which is managed by the Association of Universities for Research in Astronomy (AURA) under a cooperative agreement with the National Science Foundation on behalf of the Gemini Observatory partnership: the National Science Foundation (United States), National Research Council (Canada), Agencia Nacional de Investigación y Desarrollo (Chile), Ministerio de Ciencia, Tecnología e Innovación (Argentina), Ministério da Ciência, Tecnologia, Inovaçőes e Comunicaçőes (Brazil), and Korea Astronomy and Space Science Institute (Republic of Korea). This work was enabled by observations made from the Gemini-North telescope, located within the Maunakea Science Reserve and adjacent to the summit of Maunakea. We are grateful for the privilege of observing the Universe from a place that is unique in both its astronomical quality and its cultural significance.
Facilities: Gemini (GMOS - , NIRI) - , HST (WFPC2 - , ACS - , WFC3) - , Mayall (NEWFIRM) - Kitt Peak National Observatory's 4 meter Mayall Telescope, and Spitzer (IRAC) - .
Software: astropy (Astropy Collaboration et al. 2022), dolphot (Dolphin 2016), DoPhot (Schechter et al. 1993), drizzlepac (Hack et al. 2021), emcee (Foreman-Mackey et al. 2013), forwardmodel (Kilpatrick & Rubin 2023), hst123 (Kilpatrick 2021), IRAF (Tody 1986), MOPEX (Makovoz & Khan 2005), progenitors (Kilpatrick 2023), pyraf (Science Software Branch at STScI 2012), swarp (Bertin 2010), and YSE-PZ (Coulter et al. 2022, 2023).
Data Availability
All data and analysis products presented in this article are available upon request. Analysis code and photometry used in this paper are available on GitHub: https://github.com/charliekilpatrick/progenitors; a copy of this material has been deposited to Zenodo: 10.5281/zenodo.8060641. The HST data used in this paper can be found in MAST: 10.17909/dqc4-yx93. The Spitzer Space Telescope data used in this paper can be found in the Spitzer Heritage Archive (IRSA 2022) (AORS: 44605696, 44605952, 45237504, 48186624, 50627072, 50627328, 50627840, 52776448, 52776704, 52776960, 52777216, 52777472, 52777728, 52777984, 52778240, 60830720, 60830976, 60831232, 60831488, 60831744, 60832000, 66022400, 66022656, 66022912, 66023168, 66023424, and 66023680). Gemini data (GN-2010A-Q-27) are publicly available on the Gemini data archive at https://archive.gemini.edu/ and NEWFIRM data (Prop IDs: 2012A-0540) are from the NOIRLab Astro Data Archive at https://astroarchive.noirlab.edu/.
Footnotes
- 20
- 21
- 22
All photometry reported throughout this paper is on the AB magnitude system.
- 23
- 24
- 25
- 26
- 27
All photometry of the SN 2023ixf progenitor candidate and metadata used in the analysis below is provided in machine-readable format at https://github.com/charliekilpatrick/progenitors/blob/main/sed/data/input/2023ixf.dat.
- 28
See Equation (3) and Table 4 in Beasor et al. (2020).
- 29
See Equation (4) in Beasor et al. (2020).