


Abstract
Spiral structures have been detected in evolved protostellar disks, driving the disk accretion toward the central protostars to facilitate star formation. However, it is still unclear if these structures can form earlier in young protostellar disks. With the Atacama Large Millimeter/submillimeter Array, we have detected and spatially resolved a very young and nearly edge-on dusty disk with a radius of only ∼20 au in the HH 211 protostellar system at submillimeter wavelength. It is geometrically thick, indicating that the submillimeter-light-emitting dust grains have yet to settle to the midplane for planet formation. Intriguingly, it shows three bright linear structures parallel to the equatorial plane, resembling a three-layer pancake that has not been seen before. The top and bottom ones arise from the warm disk surfaces, unveiling the flared structure of the disk. More importantly, the middle one is in the dense midplane of the disk and can be modeled as a trailing spiral arm excited by disk gravity, as seen in evolved protostellar disks, supporting the presence of spiral structures in the very early phase for disk accretion.
Export citation and abstract BibTeX RIS

Original content from this work may be used under the terms of the Creative Commons Attribution 4.0 licence. Any further distribution of this work must maintain attribution to the author(s) and the title of the work, journal citation and DOI.
1. Introduction
Protostellar disks play a crucial role in forming extrasolar systems, as they not only facilitate the growth of central protostars into mature stars (Shu et al. 1987), but also evolve into protoplanetary disks, which serve as the primary site for planet formation (Williams & Cieza 2011; ALMA Partnership et al. 2015; Andrews 2020). They form because the gravitationally collapsing material carries part, if not all, of the angular momentum toward the center. In the early phase of star formation, the disks are small and deeply embedded in dusty molecular cores and thus are hard to be detected and spatially resolved. In addition, magnetic braking in some collapsing models can remove the angular momentum from the collapsing material efficiently and thus prevent the disks from forming (Allen et al. 2003). Thus, it is still unclear how early they can form and what their initial structures are. It is also unclear what mechanisms can transport angular momentum within the disks or remove it from the disks so that the disk material can flow in from the outer to the inner part and then feed the central protostars. Possible mechanisms include spiral arms induced by gravitational instability (GI; Bate 1998; Kratter & Lodato 2016), disk-driven winds (Konigl & Pudritz 2000; Turner et al. 2014), and magneto-rotational instability (Balbus 2003; Turner et al. 2014).
The HH 211 protostellar system is one of the youngest systems (Froebrich 2005), allowing us to address above questions. It is located in Perseus at ∼321 pc away. Its formation started with a gravitational collapse only ∼35,000 yr ago, and the central protostar has a mass of <0.08 M⊙ (Lee et al. 2018, 2019). It is associated with a prominent jet (McCaughrean et al. 1994; Gueth & Guilloteau 1999; Hirano et al. 2006; Jhan & Lee 2021), indicating that a disk must have formed and is actively accreting onto the protostar. Previous studies have suggested the presence of a dusty disk around the protostar, which is likely nearly edge-on and spatially unresolved (Segura-Cox et al. 2016; Lee et al. 2018). Here we report the detailed structure of the disk resolved with our ALMA observation in the dust continuum at ∼4 au resolution, not only unveiling the earliest structure of a disk but also challenging the theories of disk formation during such an early phase. We also derive the physical properties of the disk and discuss how the observed structure in the disk can be formed and what can drive the accretion process.
2. Observations
The HH 211 protostellar system was mapped with ALMA in Band 7 with one pointing toward the center in Cycle 7 (Project ID: 2019.1.00570.S). It was mapped with four executions in 2021, with one on August 29, two on September 27, and one on September 29. It was observed for a total time of ∼167 minutes using 44–45 antennas and configurations of C43-9 and C43-10 with baseline lengths of 70 m–16.2 km. The maximum recoverable scale was ∼0 3. The correlator was setup to have six spectral windows, with four having a bandwidth of 0.234 GHz and a velocity resolution of 0.2 km s−1 per channel, one having a bandwidth of 0.469 GHz and a velocity resolution of 0.4 km s−1 per channel, and one having a bandwidth of 1.875 GHz and a velocity resolution of 0.8 km s−1 per channel. Since we focus on the dusty disk, line-free channels were used to derive the continuum with a bandwidth of ∼3.3 GHz centered at ∼352 GHz.
The CASA package 6.2.1.7 was used to calibrate the data. Quasars J0238+1636 and J0510+1800 were used as both the bandpass and flux calibrators. Quasar J0336+3218 was used as a phase calibrator. Line-free channels were combined to produce the continuum channels. Robust weighting factors of 2 and 0 were used for the visibility to generate the continuum maps at ∼0040 × 0025 resolution with a noise level of ∼55 μJy beam−1 (or 0.54 K) and 0022 × 0013 resolution with a noise level of ∼46 μJy beam−1 (or 1.6 K), respectively, in order to study the envelope and disk. The fourth spectral window also contained the SiO J = 8–7 line that was used to map the jet in order to determine the jet axis. A robust factor of 0.5 was used to make the SiO maps with an angular resolution of 0029 × 0018. The SiO maps have a channel width of 0.42 km s−1 and an rms of ∼2 mJy beam−1 for each channel.
3. Results
3.1. Inner Envelope and Disk
Figure 1(a) presents the continuum emission intensity map within ∼100 au of the central protostar, observed at the frequency of ∼352 GHz at a resolution of 12.8 au × 8.0 au (or 0040 × 0025). At this frequency, the continuum emission is the thermal emission arising from the dust, based on the spectral energy distribution analysis (Lee et al. 2007). The region outlined by the contours extends to the northeast (NE) and southwest (SW) from a compact central region, tracing the inner part of the flattened envelope currently collapsing (infalling) with rotation toward the center (Lee et al. 2019). The contours are crowded around the compact central region, indicative of a rapid increase in the emission intensity there, supporting a structural change from a tenuous envelope to a dense disk. Zooming into the compact central region at ∼2 times higher resolution of 7.1 × 4.1 au (or 0022 × 0013) as shown in Figure 1(b), we detect a disk and spatially resolve it in both the equatorial and vertical directions. The disk is oriented perpendicular to the SiO jet axis (as indicated by the blue and red arrows; see Figure 1(b)).
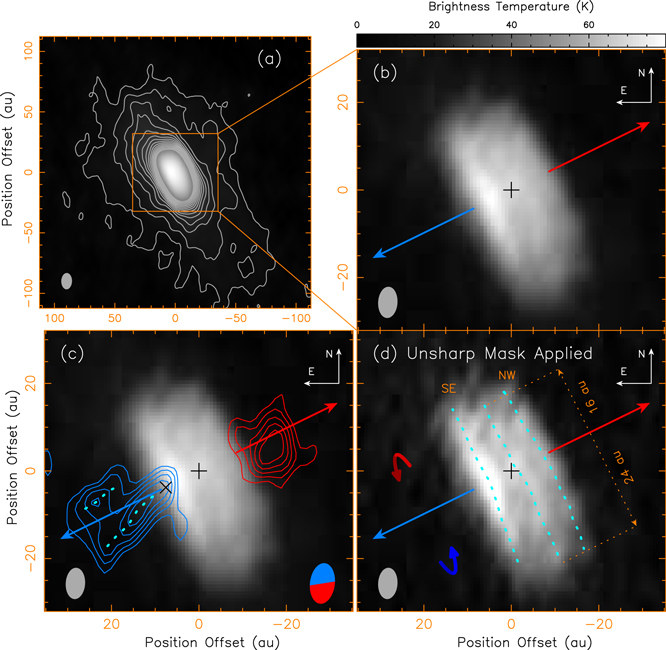
Figure 1. ALMA continuum maps toward the center of the HH 211 protostellar system at ∼352 GHz. The cross marks the position of the central protostar. The red and blue arrows indicate the axes of the redshifted component and blueshifted component of the jet axis, respectively. Panel (a) shows the continuum map at a resolution of 0040 × 0025. The contours start at 5σ with a step of 4σ, where σ = 0.54 K. Panels (b)–(d) show the continuum map at a resolution of 0022 × 0013. Panel (c) also shows SiO J = 8–7 intensity maps (contours) of the jet at high velocity in order to determine the jet base (as marked by an "x") near the central protostar. The SiO maps have a resolution of 0029 × 0018. Blue contours show the blueshifted emission integrated from Voff ∼ −34 to −21 km s−1, while red contours show the redshifted emission integrated from Voff ∼ 21 to 34 km s−1, where Voff = VLSR − Vsys, with the systemic velocity Vsys = 9.1 km s−1. The contours start from 3σ with a step of 1σ, where the noise level σ ∼ 120 K km s−1. The dotted curves show the limb-brightened edges of the jet. Panel (d) also shows the cyan dotted lines to indicate the three linear structures detected in the disk. An unsharp masking filter has been applied to the continuum map to increase the map contrast. The curved arrows indicate the rotation direction of the disk.
Download figure:
Standard image High-resolution image3.2. SiO Jet Axis
The jet has been found before to have a position angle of 116.1° (Lee et al. 2010; Jhan & Lee 2021); here at higher resolution, we can also pinpoint the closest base of the jet with the high-velocity SiO J = 8–7 intensity map to align the jet axis down to the disk scale, as shown in Figure 1(c). As discussed in Jhan & Lee 2021, the high-velocity ranges of the SiO jet are believed to trace the intrinsic jet coming from the disk, with the blueshifted velocity range being Voff ∼ −34 to −21 km s−1 and the redshifted velocity range being Voff ∼ 21 to 34 km s−1, where the velocity offset Voff = VLSR − Vsys and the systemic velocity Vsys = 9.1 km s−1. The jet has an inclination angle of ∼10° to the plane of the sky with the blueshifted component in the southeast (SE; Jhan & Lee 2021). The closest jet base can then be determined by the blueshifted component, which is tilted toward us and thus detected closer to the central protostar than the redshifted component. Interestingly the emission roughly forms a cone-like structure (although incomplete) with limb-brightened edges (marked by the dotted lines) opening to the SE and a tip pointing toward the disk, and thus the tip, which is marked by an "x" and roughly coincides with the continuum emission peak, can be defined as the closest jet base to align the jet axis. We can apply the jet axis thus obtained to the redshifted component and find that it can roughly bisect the redshifted emission at the base. Notice that the peak of the redshifted emission located in the SW of the jet axis can trace the edge of the jet, as seen in the blueshifted component.
3.3. Dusty Disk Structure
Since the disk is oriented perpendicular to the SiO jet axis, it likely has a disk axis (rotational axis) aligned with the jet axis and is thus close to edge-on with the SE side tilted toward us. As seen in Figure 1(d), it is geometrically thick and has a thickness (∼20 au) to width (∼40 au) aspect ratio of ∼0.5. Notice that in order to better see the disk structure, an unsharp masking filter has been applied to the continuum map to increase the map contrast. As indicated by the three cyan dotted lines, three bright linear structures are seen in the disk parallel to the equatorial plane, appearing as a three-layer pancake. The SE one and northwest (NW) one are similar to those detected before in another nearly edge-on but more evolved disk HH 212 (Lee et al. 2017) and are thus believed to arise from the upper surface and lower surface of the disk, respectively. In the HH 212 disk, a thick dark lane is seen in the midplane. Such a dark lane is also seen here in the HH 211 disk but bisected into two narrow dark lanes by the bright linear structure in the middle running along the equator, with the SE one broader than the NW one. This bright linear structure in the midplane is seen for the first time in a young disk and could be clumpy. It extends ∼16 au to the NE and 24 au to the SW from the jet axis and is thus asymmetric about the jet axis. Therefore, it is unlikely produced by a circular ring around the central protostar. It could be due to an asymmetric structure like a spiral arm induced by the GI to facilitate the disk accretion. The plus sign to the NW of the brightest peak along the jet axis marks the likely location of the central protostar, obtained by comparison to the disk model to be discussed later, and it has an International Celestial Reference System position  and
and  .
.
4. Disk Model
To retrieve the physical properties of the dusty disk, we model the observed disk emission and structure with a parametrized flared disk model similar to that used for the HH 212 disk (Lee et al. 2021), appropriate for a Keplerian rotating accretion disk. In this model, the dust in the disk is assumed to have the following mass density and temperature distributions in cylindrical coordinates (R, ϕ, z)

where Rt is the turnover radius to be defined below, and ρt and Tt are the dust mass density and temperature in the disk midplane at Rt, respectively. The density and temperature are assumed to decrease with the increasing radius with the power-law index p and q, respectively. As in the HH 212 disk (Lee et al. 2021), we assume p = 2 and q = 0.75. In addition, the density is assumed to decrease from the midplane to the surface due to vertical hydrostatic equilibrium with a scale height hd, while the temperature is assumed to increase from the midplane to the surface due to the radiative heating by the central protostar and mechanical heating from the wind−disk interaction. The wind−disk interaction is expected because a wide-angle wind is predicted around the observed jet coming from the innermost disk (Shu et al. 2000; Lee et al. 2022) and a possible disk wind has also been detected, fanning out from the inner disk (Lee et al. 2018). The scale height depends on the ratio of the sound speed to the angular rotation speed and thus increases with the increasing radius. However, similar to that of the HH 212 disk, the scale height is assumed to decrease at the turnover radius Rt in order to match the observation. Therefore, we assume

so that the scale height increases to ht at Rt and then drops to ht/2 at the outer radius R0. In our model, the total height of the disk to calculate the disk emission is  . The disk also contains gas with the same temperature as the dust. The gas also has the same density distribution as the dust, with a gas-to-dust mass ratio of 100.
Radiative transfer assuming LTE is used to calculate the dust emission map from the model, using the radiative transfer code in Lee et al. (2017). A major uncertainty in the model is the dust absorption opacity. At the observed wavelength of 852 μm (i.e., corresponding frequency of 352 GHz), it can be κabs ∼ 1.9 cm2 per gram of dust as derived in the HH 212 disk (Lin et al. 2021) in the same evolutionary phase and κabs ∼ 3.5 cm2 per gram of dust as extrapolated from that in the T Tauri disks (Beckwith et al. 1990). Here we use the mean value of ∼2.7 cm2 per gram of dust, with an uncertainty of ∼30%. Dust self-scattering is ignored because the HH 211 disk is much younger than the HH 212 disk, and dust grain size is expected to be much smaller than 100 μm. After the model map is calculated, we sample it on the observed u-v coverage and then make the simulated map in the same way as the observed map for comparison. We also subtract the model visibility from the observed visibility and then make the residual map to show the goodness of the fit.
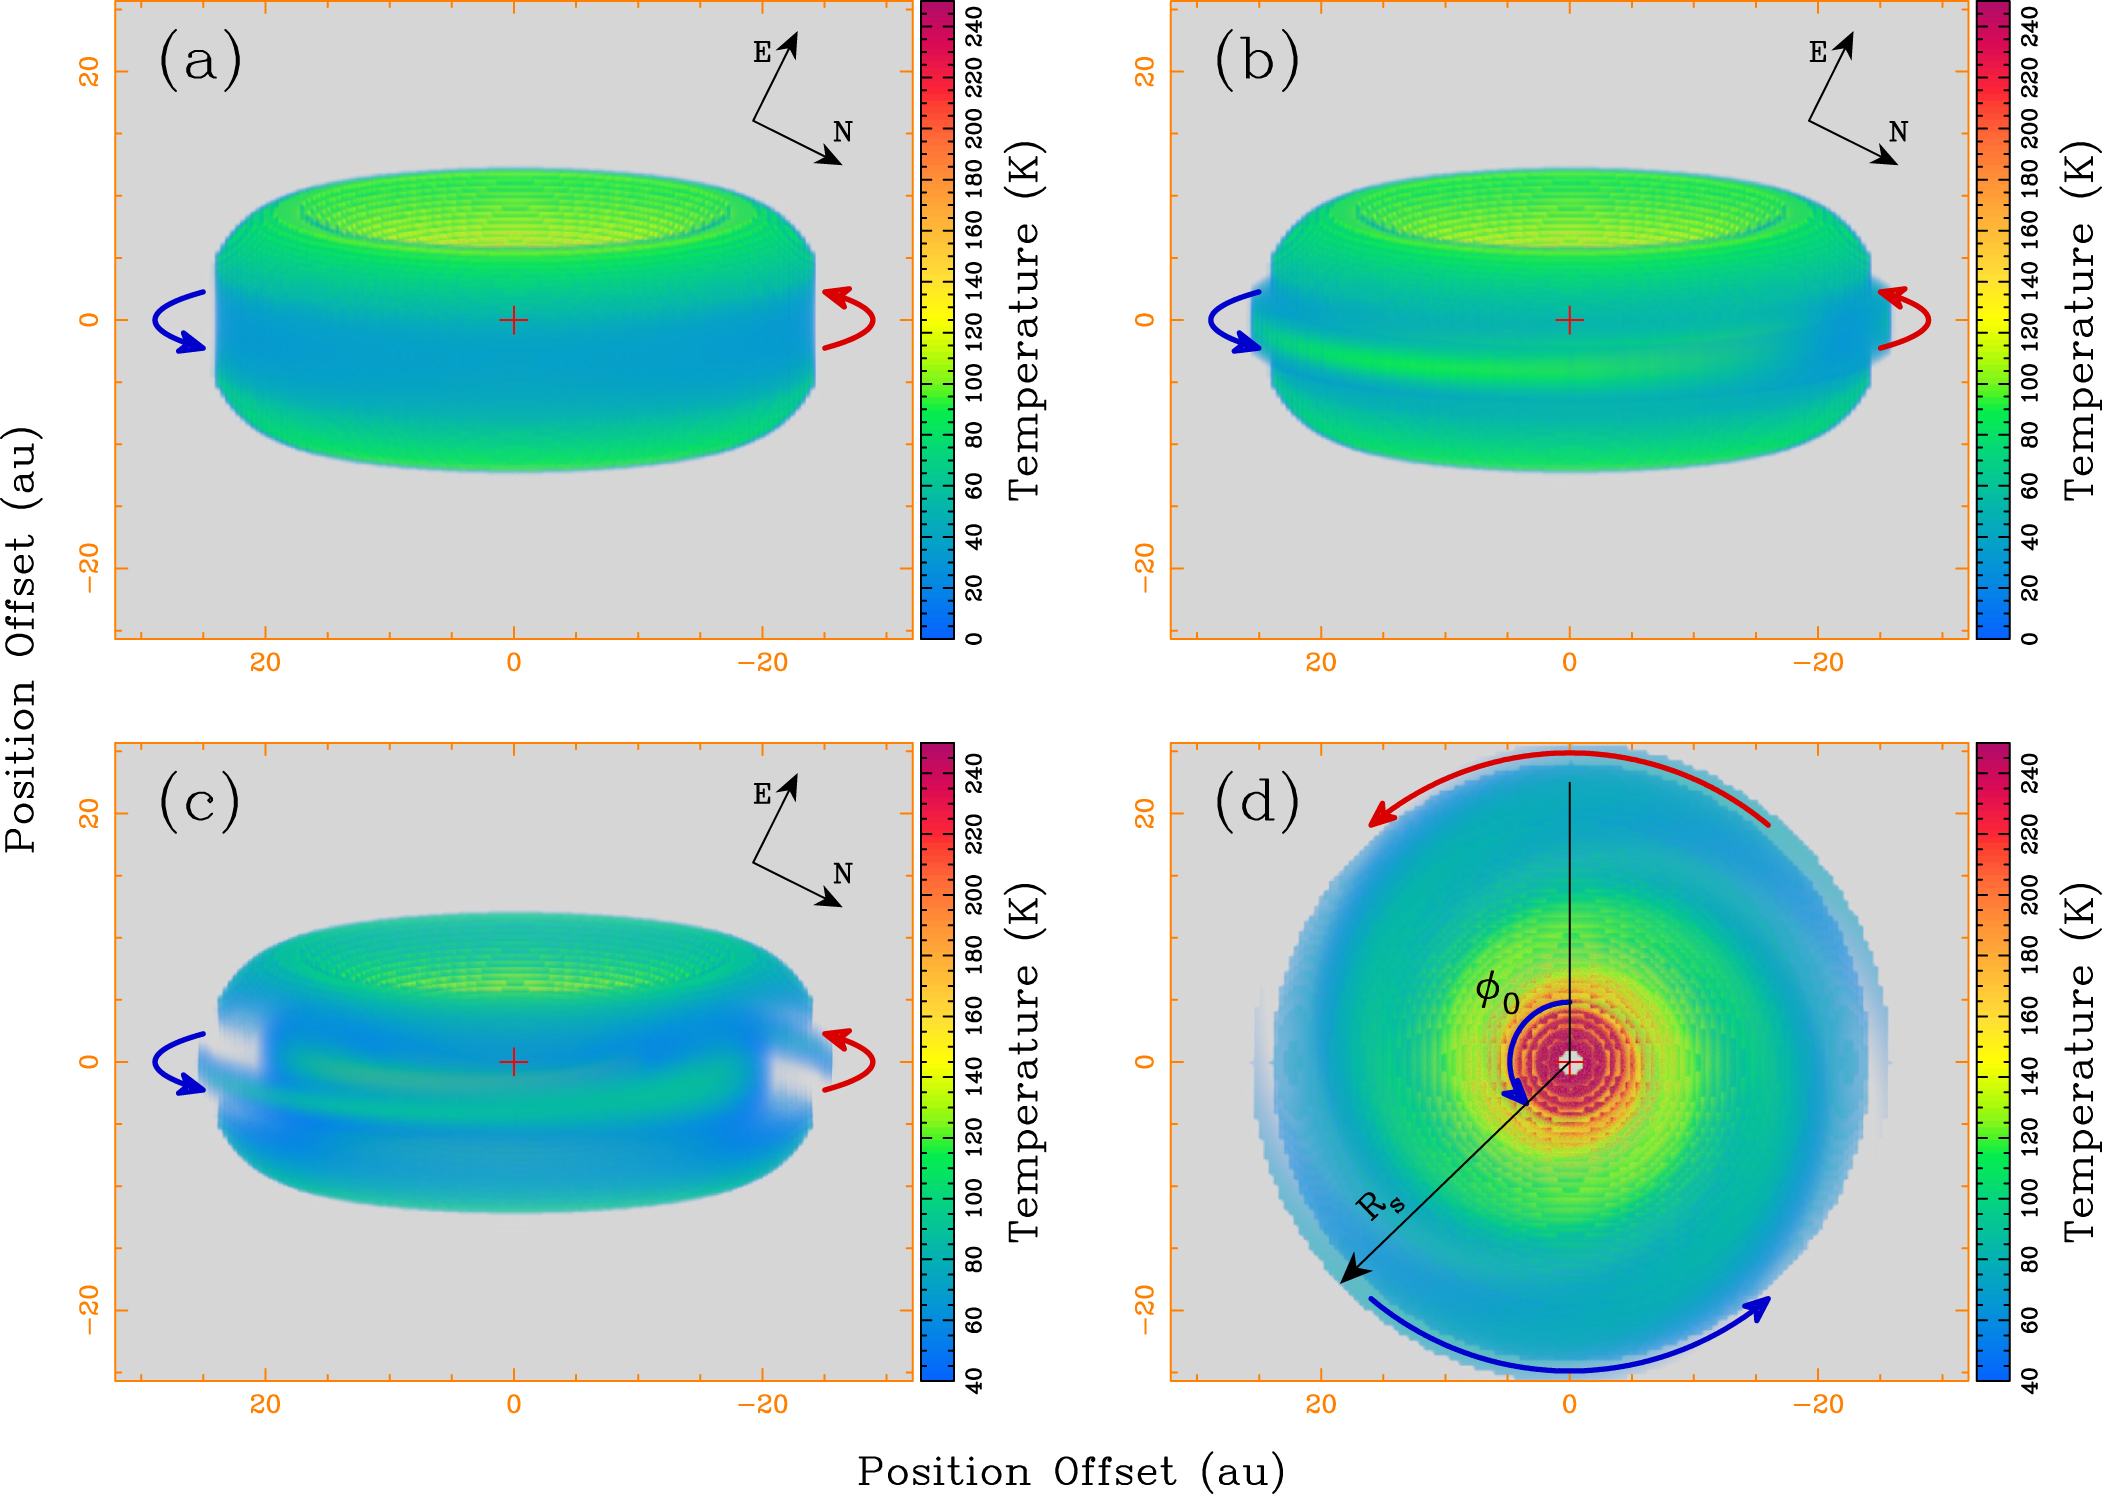
Figure 2(a) shows the best-fit model (by eye), with Rt ∼ 18 ± 4 au, R0 ∼ 24 ± 5 au, ht ∼ 6 ± 2 au, Tt ∼ 40 ± 8 K, and ρt ∼ (6.5 ± 1.3) × 10−15 g cm−3. Here the uncertainty in geometric parameters is assumed to be 20% or about a few astronomical units, which is reasonable considering our resolution of ∼4 au in the disk minor axis and ∼7 au in the disk major axis. The density and temperature are also assumed to have a 20% uncertainty, as discussed in the next paragraph below. The disk is assumed to be slightly tilted, with its (rotational) axis tilted by ∼10° to the plane of the sky as found for the jet axis (Jhan & Lee 2021) and with its nearside tilted slightly to the NW. With this inclination angle, the upper surface is tilted toward us, exposing warmer material within the inner radius. For the lower disk surface, the inner radius is blocked by the outer disk and thus invisible, and therefore only the outer radius, which is cooler, is visible. The midplane is the coolest.

Figure 2. Disk models to produce the dust emission in the HH 211 disk. (a) A disk model without a pair of spiral arms in the midplane of the disk tilted at the observed inclination angle. (b)–(d) A disk model with a pair of spiral arms in the midplane. (c) Color range is changed to start from 40 K in order to reveal the spiral arms in the inner disk. (d) The disk is face on in order to reveal the spiral arms in the whole disk.
Download figure:
Standard image High-resolution imageThe dust emission map calculated from the disk model with radiative transfer is shown in Figure 3(a), after rotating by 116 1 to match the observed position angle of the disk. As expected, the map shows only two bright linear structures arising from the disk surfaces, as seen in HH 212 (Lee et al. 2017). Figure 3(b) shows the simulated map sampled with the observed u-v coverage, and Figure 3(c) shows the residual map obtained by mapping the residual visibility as mentioned above. The best-fit model is obtained by eye by matching the observed structure and emission intensity of the SE and NW linear structures and thus reducing the residual intensity for these structures. Since the geometric parameters Rt, R0, and ht can be readily determined by matching the size and thickness of the disk, we mainly vary Tt and ρt to match the observed intensity. Furthermore, since the disk emission is mostly optically thick, Tt and ρt can be obtained by matching the observed brightness temperature and achieving the required optical depth. As shown in Figure 3(c), the absolute values of the residuals in the two linear structures are ≲13 K, which is ∼20% of the mean intensity of the observed map of the disk, and thus it is reasonable to assume a 20% uncertainty in model density and temperature as mentioned above. The SE linear structure is from the upper surface and is brighter because it is from the inner radius exposed to us. The NW linear structure is from the lower surface and is fainter because it is from the surface at a larger radius. As marked in Figure 1, the central protostar is located closer to the SE linear structure than to the NW linear structure and is to the NW of the brightest peak along the jet/disk axis because the nearside of the disk is tilted slightly to the NW. The residual map clearly shows an asymmetric linear structure in the midplane that could not be fitted by this model. The linear structure is slightly curved, as expected for a slightly inclined spiral arm. After plotting the NE and SW lengths of the linear structure measured from Figure 1(d), we find that the linear structure may extend further to the SW into the surrounding envelope and observations at higher resolution are needed to check it. Note that the residual map also shows the emission from the surrounding envelope that is not included in our model.

Figure 3. The model maps, simulated maps, and residual maps from our models. Residual maps are obtained by subtracting the model visibility from the observed visibility, with the gray and cyan contours for the positive and negative residuals, respectively. The contours start from 4σ with a step of 3σ, where σ = 1.6 K. Left column shows the maps for the disk model without a pair of trailing spiral arms in the midplane. Central column shows the maps for the disk model with a pair of trailing spiral arms in the midplane. Right column shows the maps for the disk model with a pair of slightly less-inclined trailing spiral arms in the midplane.
Download figure:
Standard image High-resolution imageNow we add a pair of spiral arms into our model in order to reproduce the observed linear structure in the midplane because the m = 2 mode is mostly seen (Pérez et al. 2016; Lee et al. 2020). The spiral arms are assumed to be trailing, as seen in more evolved disks, e.g., HH 111 (Lee et al. 2020) and Elias 2–26 (Pérez et al. 2016; Paneque-Carreño et al. 2021), with their outer tip pointing in the direction opposite to the disk rotation measured before (as indicated by the blue and red curved arrows in Figures 1 and 2) (Lee et al. 2018). The spiral arms are assumed to follow the logarithmic structure as excited by GI due to the self gravity of the disk, with the following amplitude

Here m = 2 produces a pair of spiral arms, Rs
is defined as the outer radius of the spiral arms at ϕ = ϕ0, and  is the pitch angle. Then the dust density and temperature of the disk after adding the spirals are assumed to increase in the vertical direction with the following:

where the scale height of the spiral arms is assumed to be a fraction of the disk scale height, i.e., hs = fhd. A and B are the spiral amplitude in density and temperature, respectively. Thus, in the midplane, the disk density and temperature have a variation amplitude of A/(1 + A) and B/(1 + B), respectively.
Figure 2(b) shows the best-fit model (by eye) at the observed inclination angle, revealing the spiral arm in the front. The spiral arm in the back is blocked by the disk. Figure 2(c) shows the spiral arms farther in by changing the color range to hide the material with a temperature lower than 40 K. Figure 2(d) shows the face-on view in order to view the spiral arms from the top. As seen in the resulting model map in Figure 3(d) and simulated map in Figure 3(e), the spiral arm in the outer disk produces a linear structure in the midplane. It is trailing and thus reproducing the observed asymmetry about the jet axis. In the model, the geometric parameters of the spiral arms Rs
, ϕ0, and a can be determined by the NE and SW lengths of the linear structure in the midplane, assuming that the linear structure comes from the spiral arm in the front part of the outer disk. With ϕ0 ∼ 135° (i.e.,  ) and Rs
∼ 26 au, the model produces a linear structure with an SW length of ∼24 au, as observed. Then in order to account for the length of Ri
∼ 16 au in the NE where ϕi
= 270° (i.e.,
) and Rs
∼ 26 au, the model produces a linear structure with an SW length of ∼24 au, as observed. Then in order to account for the length of Ri
∼ 16 au in the NE where ϕi
= 270° (i.e.,  ), we have
  (negative for trailing). Thus, the pitch angle is
  °, which is not much different from those of other spiral arms found in more evolved disks, e.g., HH 111 (13°−16°; Lee et al. 2020) and Elias 2–27 (∼16°; Pérez et al. 2016). Notice that the outer radius and thus the pitch angle of the spiral arms can be larger if the observed linear structure turns out to extend further to the SW into the envelope, as discussed earlier in this section.
By roughly matching the observed intensity and thickness of the linear structure in the midplane, we find that A ∼ 1, B ∼ 1, and f ∼ 0.3. Our fitting results indicate that the disk density and temperature need a variation of ∼50% in the midplane from the spiral arm region to non-spiral arm region. The material is required to be denser and warmer within the spiral arms than the original disk to match the observed intensity. The spiral arm comes from a radius of ∼15 to 26 au, where it has a midplane temperature of 90−130 K. Density enhancement is required there to provide the necessary optical depth of ∼1 for the spiral arm to be detected at the observed brightness temperature of ∼50–70 K. Also, the scale height of the spiral arms is found to be ∼30% of that of the disk in order to roughly match the thickness of the observed linear structure. Since the observed spiral arm in the midplane is not spatially well resolved in our observations, the scale height of the spiral arm could be smaller, and thus the temperature could be higher.
Nonetheless, the residual map (Figure 3(f)) still shows a faint and narrow residual emission structure on the SE edge of the spiral arm, indicating that the spiral arm should be slightly less inclined than the disk. Assuming that the spiral arm is slightly less inclined by ∼2° than the disk, this residual emission structure disappears in the residual map, as seen in Figure 3(i). In this case, the linear structure produced by the spiral arm (see Figures 3(g) and 3(h)) can also better bisect the dark lane into two narrower dark lanes, with the SE one slightly broader than the NW one, as observed.
In summary, the observed structure and emission intensity of the HH 211 disk can be roughly reproduced by our simple disk model with warm disk surfaces and a warm trailing spiral arm in the midplane. In our model, the disk has a mass of Md ∼ 0.045 M⊙ (see Appendix). Since the total mass of the disk and protostar has been estimated before to be Mt ∼ 0.08 M⊙ from the kinematic study of the disk and envelope (Lee et al. 2019), the protostar itself has a mass of M* = Mt − Md ∼ 0.035 M⊙. Hence, the protostar currently has a mass of a brown dwarf and is expected to grow later into a low-mass star with a mass of ∼0.3–0.8 M⊙ (Froebrich 2005). Comparable disk and protostellar masses are also seen in numerical simulations at early evolutionary stages (<0.1 Myr) when the protostellar mass is low (<0.1–0.2 M⊙; Tsukamoto et al. 2020). In this case, GI develops, producing spiral arms transporting angular momentum within the disk. The observed linear structure in the midplane could trace such a spiral arm, especially when the resulting Toomre Q values in our model's outer disk are <2 (see Figure 4 and Appendix for the derivation) and thus optimal for GI. The high envelope infall rate of ∼4 × 10⁻⁶ M⊙ yr−1 (Lee et al. 2019) onto the disk also supports this possibility (Tomida et al. 2017). In addition, the disk-to-protostar mass ratio is η = Md /M* ∼ 1.3, and thus GI is expected to induce prominent m = 2 spiral arms (Dong et al. 2015; Tsukamoto et al. 2020), as assumed in our model. Nonetheless, higher-resolution observations are needed to check if m ≠ 2 can also reproduce the linear structure in the midplane. The spiral arms have a scale height about 30% of the disk scale height, indicating that they start in the midplane where the density is high.

Figure 4. Toomre Q values for our simple model with a pair of trailing spiral arms in the midplane.
Download figure:
Standard image High-resolution image
5. Discussion
Spiral arms have been detected in actively accreting but more evolved systems when the disks are large (≳100 au in radius), e.g., HH 111 (Lee et al. 2020), Elias 2–27 (Pérez et al. 2016; Paneque-Carreño et al. 2021), and possibly TMC-1A (Aso et al. 2021). These spiral arms are trailing and can be induced by GI to transport angular momentum to facilitate the disk accretion (Kratter & Lodato 2016; Tomida et al. 2017). Unlike the HH 211 disk, these larger, more evolved disks have settled more or less to a thin disk geometry. In the earlier phase of star formation when the disks are still geometrically thick, hints of spiral arms have also been detected in, e.g., HH 212 (Lee et al. 2021) and L1527 (Ohashi et al. 2022; Sheehan et al. 2022). Now in the earliest phase of the HH 211 disk, which is geometrically thicker, our observations and modeling have strongly supported a presence of a trailing spiral arm in the midplane. Our result in the HH 211 disk urges us to confirm those previous hints of spiral arms in order to determine if actively accreting disks can always be gravitational unstable in order to induce spiral arms to transport angular momentum, as seen in many simulations (Tomida et al. 2017; Forgan et al. 2018; Tsukamoto et al. 2020). In simulations, when cooling is efficient, spiral arms can fragment into clumps that can grow into planets (Gammie 2001; Rice et al. 2003; Forgan et al. 2018). Hence, further work is needed to investigate the origin of the clumps seen in the HH 211 disk and if the clumps can grow into planets.
The HH 211 disk is geometrically thick, a trait also seen in the more evolved and also vertically resolved edge-on disks, e.g., HH 212 (Lee et al. 2017) and L1527 (Nakatani et al. 2020). It is flared and likely in vertical hydrostatic equilibrium, with the scale height roughly consistent with that derived from the ratio of the sound speed to the angular rotation speed, as discussed in the Appendix. This indicates that the submillimeter-light-emitting dust grains have yet to settle to the midplane. This is different from the protoplanetary disks, which are very thin in dust continuum images of ALMA (ALMA Partnership et al. 2015; Villenave et al. 2020) likely because the dust grains have grown larger and settled to the midplane (Villenave et al. 2020). Moreover, the disk in the early phase is more turbulent because it has a higher accretion rate, spiral arms perturbation induced by GI, and more energetic wind–disk interaction due to a higher mass-loss rate, possibly preventing the dust from settling to the midplane.
Our ALMA observations of the HH 211 disk also provide a strong constraint on the magnetic braking effect on the disk formation. Previous studies in this system have revealed a collapsing (infalling) and rotating flattened envelope with a centrifugal barrier at a radius of ∼20 au (Lee et al. 2019). This radius coincides with the outer radius of the disk resolved here, supporting the formation of the disk around the centrifugal barrier, without significant loss of angular momentum. This could be because the rotational axis is largely misaligned with the magnetic field axis in the collapsing core on the larger scale (Lee et al. 2019), which can reduce the magnetic braking in the envelope (Joos et al. 2012). Another possible explanation could be because of the ambipolar diffusion that increases the mass-to-flux ratio and thus reduces the magnetic braking in the envelope (Yen et al. 2023). In addition, since the material accumulates around the centrifugal barrier, the Toomre Q values are expected to decrease there, triggering GI and thus forming spiral arms, transferring material inward.
Acknowledgments
We thank the anonymous referee for useful comments. This paper makes use of the following ALMA data: ADS/JAO.ALMA#2019.1.00570.S. ALMA is a partnership of ESO (representing its member states), NSF (USA) and NINS (Japan), together with NRC (Canada), NSC and ASIAA (Taiwan), and KASI (Republic of Korea), in cooperation with the Republic of Chile. The Joint ALMA Observatory is operated by ESO, AUI/NRAO and NAOJ. C.-F.L. and K.-S.J. acknowledge grants from the Ministry of Science and Technology of Taiwan (MoST 107-2119-M-001-040-MY3, 110-2112-M-001-021-MY3) and the Academia Sinica (Investigator Award AS-IA-108-M01).
Appendix: Extended Properties of the Disk Model
Using the parametrized flared dusty disk with spiral arms model given in the main body in Section 4, we can derive the extended properties of the disk. The disk has a surface density of dust and gas given by

with the surface density of dust and gas at Rt given by

Then, the disk has a mass of

with

where  . The Toomre Q value can then be given by

where Ω is the angular rotation speed of the disk and cs is the sound speed

where μ = 2.33 and γ = 7/5 for molecular gas with H2 and helium. Since we are more interested in the outer disk around Rt, we assume

with Mt being the total mass within Rt and given by

where M* is the protostellar mass. Since the temperature increases from the midplane to the surface, we use the density-weighted temperature averaged over the disk height, i.e.,

to calculate the value of cs at R with Equation (A6) and then the value of Q(R).
With our best-fit parameters, Σt ∼ 180 g cm−2, and then the disk has a (gas and dust) mass of Md ∼ 0.045 M⊙. This in turn implies that the central protostar has a mass of M* ∼ 0.035 M⊙ because the mass of disk and protostar together has been estimated to be ∼0.08 M⊙ from the kinematic study of the disk and envelope (Lee et al. 2019). Figure 4 presents the resulting Toomre-Q values, which are <2 in the outer disk, optimal for GI. With the density-weighted temperature, the theoretical scale height is ∼cs /Ω ∼ 5.5 au at Rt, consistent with the best-fit scale height ht, supporting that the disk is close to the vertical hydrostatic equilibrium.