


ABSTRACT
Based on combined observations from the Interface Region Imaging Spectrograph (IRIS) spectrometer with the coronal emission line of Fe xxi at 1354.08 Å and SDO/AIA images in multiple passbands, we report the finding of the precursor activity manifested as the transverse oscillation of a sigmoid, which is likely a pre-existing magnetic flux rope (MFR), that led to the onset of an X class flare and a fast halo coronal mass ejection (CME) on 2014 September 10. The IRIS slit is situated at a fixed position that is almost vertical to the main axis of the sigmoid structure that has a length of about 1.8 × 10⁵ km. This precursor oscillation lasts for about 13 minutes in the MFR and has velocities in the range of [−9, 11] km s−1 and a period of ∼280 s. Our analysis, which is based on the temperature, density, length, and magnetic field strength of the observed sigmoid, indicates that the nature of the oscillation is a standing wave of fast magnetoacoustic kink mode. We further find that the precursor oscillation is excited by the energy released through an external magnetic reconnection between the unstable MFR and the ambient magnetic field. It is proposed that this precursor activity leads to the dynamic formation of a current sheet underneath the MFR that subsequently reconnects to trigger the onset of the main phase of the flare and the CME.
Export citation and abstract BibTeX RIS
1. INTRODUCTION
Solar eruptions, which are manifested as solar flares and coronal mass ejections (CMEs), are known to be the driving source of the severe space weather that affects the technological systems of our modern society. Any precursor activity that could lead to a solar eruption is both scientifically important for understanding the physics of solar eruptions and of practical use for building the capability of space weather prediction. In this letter, we report the finding of an unambiguous precursor oscillation of a hot coherent sigmoidal structure about 20 minutes before the main energy release of a flare.
The temporal evolution of a flare has been generally suggested to have three distinct phases: (1) the pre-flare phase, (2) the rise phase, and (3) the decay phase as seen in GOES soft X-ray in Zhang & Dere (2006). These three phases correspond, respectively, to (1) the onset phase, (2) the impulsive phase, and (3) the third phase, which is subdivided into the gradual and extended phases in Hudson (2011). The importance of these three distinct phases of a flare is that they are strongly correlated with the three distinct phases of kinematic evolution of the associated CME (Zhang et al. 2001; Zhang & Dere 2006). For the clarification of the nomenclature used in this paper hereafter, we refer to the three phases of a solar eruption, which consists of a coupled flare and a CME, as (1) the precursor phase, (2) the impulsive phase, and (3) the gradual phase. Here, the precursor phase denotes the period in which a possible solar activity can occur up to about one hour preceding the onset of the impulsive phase, i.e., the onset of the main energy release phase resulting in strong flare emission and CME acceleration. Compared with the impulsive and gradual phases, which have been well understood to an acceptable level (Hudson 2011, and reference therein), the precursor phase has not been well studied owing to its weak or absent signature in observations, but which holds a key for exploring the onset mechanism of solar eruptions.
The limited observational studies in the past have shown that pre-flare activities could come in a wide range of wavelengths. Previous studies showed the activities in the precursor phase as X-ray emissions in the early stage of a flare eruption (e.g., Fárník & Savy 1998; Chifor et al. 2007), as hard X-ray bursts (Harra et al. 2001), as a precursor to a Type II burst generated by the reconnection process above the expanding soft X-ray loops (Klassen et al. 2003), as non-thermal processes in microwave observations (Altyntsev et al. 2012), and as loop-top brightening to drive partial filament eruption (Awasthi et al. 2014), as well as long-time prominence oscillations (Chen et al. 2008). However, these studies generally have not revealed the causal relation between the pre-flare activity and the main phase of the flare.
The observations of precursor activity are useful for constraining or validating different models of solar eruptions, e.g., the internal tether-cutting model (see Moore & Roumeliotis 1992), the external tether-cutting or magnetic break-out model (e.g., Antiochos et al. 1999), the flux cancelation model (e.g., van Ballegooijen & Martens 1989), and the kink/torus instability of filament/flux rope model (e.g., Fan 2005; Rust & LaBonte 2005; Török & Kliem 2005; Olmedo & Zhang 2010). These models tend to show the same behavior during the main phase of a flare (see Chifor et al. 2007), but they act differently in the precursor phase. For example, one would expect to find the precursor phase brightening in the core magnetic field near the PIL in the internal tether-cutting model, and the brightening in the high corona in the break-out model. The critical onset mechanism of solar eruptions might be revealed if one could determine the location and timing of thermal and kinematic processes during the precursor phase.
In this work, a precursor transverse oscillation is reported for the first time on a hot sigmoid structure. In the past, the sigmoid has been suggested as a pre-existing magnetic flux rope (MFR; e.g., Titov & Démoulin 1999; Savcheva et al. 2012; Cheng et al. 2015). We further infer that the oscillation is caused by the interaction between the MFR and the ambient magnetic arcade. In Section 2 we present the observations and results, which are followed by discussions and a conclusion in Section 3.
2. OBSERVATIONS AND RESULTS
The event of interest is an eruption that produced a GOES X1.6 class solar flare and a fast halo CME with a speed of 1267 km s−1 on 2014 September 10. It originated in the NOAA active region (AR) 12158 at the location of N11E05 in heliographic coordinates. The flare had an onset time at 17:21 UT that signified the beginning of the impulsive phase, and a peak time at 17:45 UT based on the GOES report. This eruption was studied in the aspect of quasi-periodic pulsations originating from the flare ribbon (Li et al. 2015), slipping magnetic reconnection (Li & Zhang 2015), the formation of MFR (Cheng et al. 2015), and chromospheric evaporation (Tian et al. 2015). Unlike those works, here we focus on the precursor activity of the eruption.
2.1. Data and Data Processing
The data used in this work are mainly from the Interface Region Imaging Spectrograph (IRIS; De Pontieu et al. 2014) and Solar Dynamics Observatory (SDO; Pesnell et al. 2012). IRIS observed AR 12158 from 11:28 to 17:58 UT, spanning about 6 hr before the eruption. The IRIS slit is located at (−108'', 124'') with the observing mode of sit-and-stare, vertically crossing the sigmoid from the north to the south (see Figure 1(f)). The IRIS data have a spatial pixel size of 0 166 and a cadence of 9.5 s. The spectral pixel sizes of its FUV and NUV are 0.026 Å and 0.025 Å, respectively. For the Slit-Jaw Images (SJIs) at 1400 and 2796 Å passbands, they have a cadence of 19 s. In this work, we used the level 2 data. The wavelengths in observations were calibrated according to the cool line C ii, which almost kept stationary in the line center of 1354.288 Å during both the precursor and main phases.
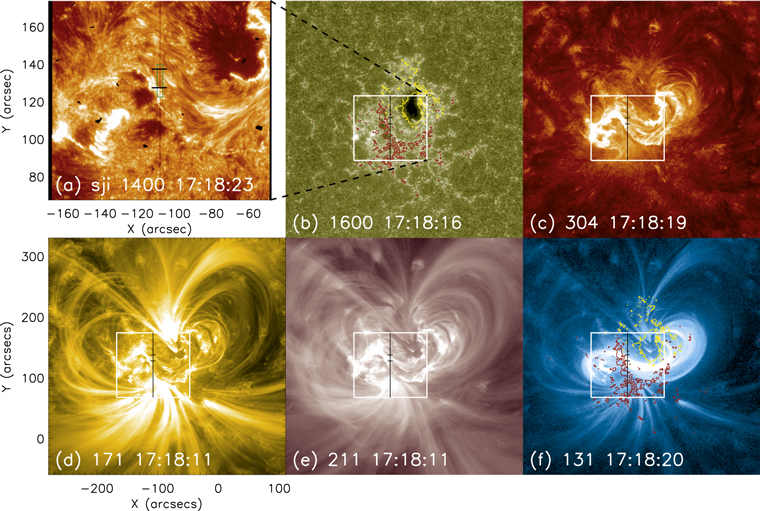
Figure 1. Surface signatures of the flare/CME on 2014 September 10 are shown in IRIS and SDO/AIA EUV images. The white boxes denote the field of view of IRIS/SJI observations. The yellow and red contours show the longitudinal magnetic fields obtained by SDO/HMI at the level of ±500 G. In this figure as well as the following ones, the black vertical lines indicate the IRIS slit and the oscillation was detected between two short black bars. (An animation of this figure is available.)
Download figure:
Standard image High-resolution imageExtreme Ultraviolet (EUV) imaging data from the Atmospheric Imaging Assembly (AIA; Lemen et al. 2012) on board SDO provide the detailed time evolution of coronal EUV structures over the full Sun. They have a typical cadence of 12 s and a pixel size of 0.6 arcsec. Similar to Tian et al. (2015), we co-aligned the images from IRIS and SDO by comparing the shape of the sunspot and compact brightening structures in SDO/AIA 1600 Å and in IRIS/SJI 1400 Å at the same moment. Then the position shifts were obtained to locate all the analyzed IRIS data according to the position of the SDOimages. The solar rotation of all SDO data was removed through registering to the moment at 17:18 UT.
2.2. Oscillation of the Flux Rope in the Precursor Phase
The studied surface signatures can be learned from the images at IRIS/SJI 1400 Å (Figure 1(a)) and at five SDO/AIA EUV passbands (see Figures 1(b)–(f)). The contours of longitudinal magnetic fields in Figures 1(b) and (f) show the surface magnetic configuration and the polarity inversion line (PIL) in AR 12158. A sigmoidal structure apparently appeared in the hot SDO/AIA 131 Å; the footpoints of the two curved arms connected the positive and negative polarities of the AR, while the straight central bar lied directly above the PIL (see Figure 1(f)). In the other EUV images of Figures 1(c)–(e) sensitive to chromospheric and low coronal temperatures, one finds ribbon-like brightening footpoints along the central axis of the sigmoidal structure. Figures 1(d)–(e) also show a multitude of arcade-like coronal loops above the PIL. Based on the unique sigmoidal shape, the temperature, and the subsequent evolution and eruption, the underlying magnetic structure of the sigmoid could be regarded as an MFR (also refer to Cheng et al. 2015). Combined with the IRIS observations, the precursor activity of this MFR could be studied.
By using a multi-Gaussian fitting method as described in Tian et al. (2015), the parameters of Doppler velocity, intensity, and line width have been deduced from the IRIS observations in the window of Fe xxi 1354.08 Å for every pixel along the slit and for every observed frame from 16:50 to 17:57 UT. The slit-time stacking plots are shown in Figures 2(a)–(c), in which the Y-axes denote the length of the slit in the unit of arcseconds and the X-axes denote the time. Figures 2(d)–(f) correspondingly present the average parameter values of all valid pixels along the slit. In Figure 2 one can easily notice that a precursor activity (isolated in the black rectangular frame in Figure 2(a)) occurred about 20 minutes before the onset of the main phase of the X1.6 flare at 17:21 UT. This precursor activity has a behavior of a wave-like oscillation with alternating red and blueshifts in the Doppler plots (Figures 2(a)–(b)). We also looked into the Doppler parameters derived from the observations of cooler chromospheric lines, but found no any corresponding oscillation. Compared with the main phase of the flare, the Doppler velocities in the precursor phase are relatively small but have conspicuous characters to reveal the interesting nature of the MFR.
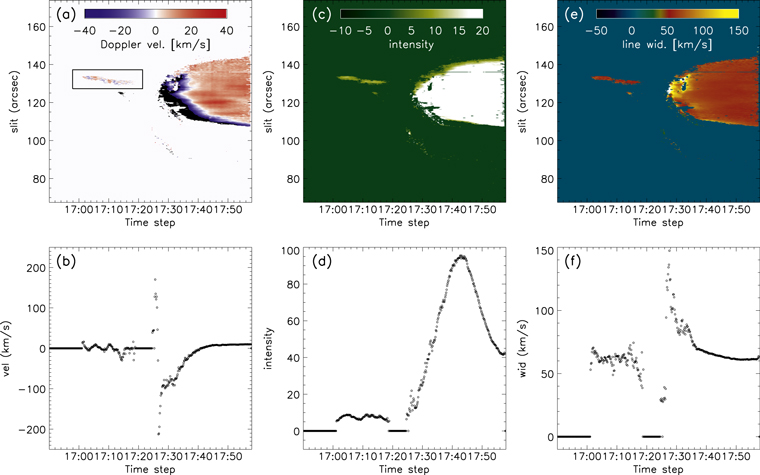
Figure 2. Distributions of the plasma Doppler velocity (panel (a)), emission intensity (panel (c)), and Doppler width (panel (e)) along the slit from 16:50 to 17:57 UT deduced from IRIS spectrum observations (top panels). Their average values of all valid pixels along the slit are shown at the bottom panels. A black rectangle in Panel (a) isolates the detected oscillation in the precursor phase that will be further illustrated in Figures 3(d)–(i).
Download figure:
Standard image High-resolution imageThe coronal structure that produced the observed oscillation can be seen better in the EUV 131 Å images (see Figure 3). The two short horizontal bars indicate the oscillation range on the slit in Figures 3(a)–(c). This precursor oscillation occurred on the core of the sigmoid. As indicated by the red arrow in Figure 3(a), the enhanced brightening at EUV 131 Å first appeared in the small portion of the sigmoid and then spread toward both the east and west sides along the sigmoid. At about 17:05 UT as seen in Figure 3(c), a long thread of brightening appeared inside the sigmoid.

Figure 3. Precursor oscillation in the sigmoid detected by IRIS. Panels (a), (b), and (c) are SDO/AIA 131 Å images revealing the sigmoid structure in the field of view same as that of IRIS/SJI images. Panels (d), (e), and (f) show the Doppler velocity, the emission intensity, and the Doppler width during the precursor phase from 16:58 UT to 17:21 UT, respectively, corresponding to the subregion (the box in Figure 2(a)), and the time profiles of their average values along the slit are presented in Panels (g), (h), and (i).
Download figure:
Standard image High-resolution imageFigures 3(d)–(i) show the precursor revealed in the sub-plots of Figure 2 (see the black box in Figure 2(a)) during 16:58–17:21 UT. Figures 3(d)–(f) plot the distributions of Doppler velocity, intensity, and line width along the slit and time. Their average values of all valid pixels along the sub-slit correspond to Figures 3(g)–(i), respectively. The deduced spectral information is now only from the structure between the two black horizontal bars in Figures 3(a)–(c). The oscillation is revealed in the alternating red and blue strips in the Doppler velocity plot in Figure 3(d), and in the sinusoidal wave pattern in Figure 3(g) from 17:01 to 17:14 UT, lasting for about 13 minutes. The precursor velocity V(t) varied within [−9,11] km s−1. After 17:14 UT, the oscillation was not showing up in the data.
Similar to that of Aschwanden et al. (1999), we fit the velocity V(t) evolution with a sine function of four free parameters (V0, V1, P, t0),

where the average velocity V0 = 2 km s−1, the oscillation magnitude V1 = 9 km s−1, an (arbitrary) initial time t0 = 105 s, and an oscillation period P = 280 s. The best-fitting curve (red) was inserted in Figure 3(g).
In the region of oscillation, the corresponding intensity distribution (Figure 3(e)) and its average value (Figure 3(h)) showed two peaks, which may indicate two episodes of energy release. The distribution of the line width only showed a weak modulation of the profiles (Figures 3(f) and (i)). In addition, both the Doppler velocity in Figure 3(g) and the line width in Figure 3(i) show impulsive onsets, which are similar to the findings in Chifor et al. (2007).
2.3. EUV Brightening of the Sigmoid in the Precursor Phase
In addition to the oscillation, an obvious plasma heating during this precursor phase was learned from the time evolution of the EUV intensity and GOES X-ray flux (see Figure 4). Figure 4(a) shows the sigmoid and its brightening core as marked by a dotted slice line between the two anchored footpoints "L0" and "L1" at 17:11 UT. Figure 4(b) presents the distance-time stacking plot of the EUV 131 Å intensity distribution along the slice line "L0"–"L1." In Figure 4(b) the first brightening (the red arrow) appeared in the sigmoid at about 17:01 UT with a distance of about 170 arcsec away from the footpoint "L0" along the sigmoid. We denote this earliest brightening in the sigmoid with a red arrow in Figure 4(a). There existed a trend for the brightening activity, which propagated toward "L0" (see the red dotted line in Figure 4(b)).

Figure 4. Brightening enhancement during the precursor phase shown in multiple observation channels. Panel (a) shows the bright sigmoid in AIA 131 Å guided by a dotted curve from "L0" to "L1," along which the distance-time plot of the EUV brightness is calculated and is presented in Panel (b). The red horizontal line denotes the cross between the dotted line "L0–L1" and the IRIS slit position. Panel (c) shows the different time evolution of the average EUV brightness at six AIA passbands (marked by the different colored bars) in a small green box in Figure 1(a). Panel (d) shows the time profiles of GOES X-ray fluxes. The earliest occurrence of the precursor EUV brightening is indicated by red arrows in panels (a) and (b). The two vertical dashed lines mark the period of the precursor oscillation.
Download figure:
Standard image High-resolution imageFigure 4(c) shows the average intensity variations within a small region of the detected oscillation area in the sigmoid (the small green box of Figure 1(a)). The plot shows the intensity profiles from 16:50 UT to 17:58 UT at IRIS/SJI 1400 Å, and SDO/AIA EUV of 1600, 304, 171, 211, and 131 Å (see the different colors indicated above). The profiles of GOES low (1–8 Å) and high band (1–4 Å) fluxes are given in Figure 4(d). The bump of precursor intensity enhancement existed in most of the wavelengths, except for 1600 Å from 17:01 UT to 17:14 UT (the two vertical dashed lines) before the onset of the flare main phase at about 17:21 UT. As the EUV emission at 1600 Å corresponds to a temperature of about 104 K and a height in the upper photosphere and the chromosphere, the absence of prior-activity at 1600 Å could suggest that the precursor activity mainly occurred above the chromosphere.
3. DISCUSSIONS AND CONCLUSION
The near sinusoidal oscillation of the sigmoid appeared to be the global oscillation of an MFR as a whole. A pre-existing MFR is strongly indicated in this case by the appearance of the typical sigmoid structures in soft X-rays and EUV images (e.g., Pevtsov et al. 1996; Aurass et al. 1999; Canfield et al. 1999; Moore et al. 2001), and of a hot channel in AIA observations (Zhang et al. 2012) as shown in Figure 5, which gives the distributions of temperature and emission measure in AR 12158 by the differential emission measure (e.g., Cheng et al. 2012). The white arrows in Figure 5 denote the area with the highest density of hot plasma that we believe is the energy source of exciting the oscillation. It also appears that the precursor oscillation is caused by the magnetic reconnection and energy release in the interaction region between the MFR and the ambient magnetic field.

Figure 5. Temperature (left panels) and emission measure maps (right panels) derived from a DEM method applied on multi-passband AIA data. These maps clearly show that the sigmoid structure has higher temperatures and denser plasma than the surroundings. The white arrows denote the location where the earliest brightening in the precursor phase occurred. The mean temperature and density in the oscillation region are estimated in the white box in Figure 5(b).
Download figure:
Standard image High-resolution image
The possible wave mode of the oscillation can be inferred from a set of relevant parameters deduced from the observations and the previous analysis in both transverse oscillations (e.g., Aschwanden et al. 1999; Nakariakov et al. 1999; Roberts 2000; Ofman & Aschwanden 2002; Tian et al. 2012; Guo et al. 2015), and longitudinal oscillations (e.g., Wang et al. 2003; Wang 2011; Kumar et al. 2015). The sigmoid has a width of w of about 18 Mm, a length L of ≈1.8 × 10⁵ km at 17:05 UT (see Figure 5(b)), and an estimated height h = L/π = 5.7 × 10⁴ km by assuming a semi-circular shape (see Aschwanden et al. 1999). Note that L is measured from the whole length of the projected sigmoid and is considered as the proxy of the full length of the conjectured MFR. The oscillation region (the white box in Figure 5(b)) has the mean temperature (T) of about 9.1 MK, the emission measure EM = 4.1 × 1028 cm−5, and a deduced mean density ni =  = 4.8 × 109 cm−3 by assuming a circular cross-section of the sigmoid, as well as an average magnetic field strength of about 30 G based on nonlinear force-free field extrapolation (Wiegelmann 2008).
We can further deduce some parameters based on the observations. Given the observed period of 280 s, the oscillation has the phase speed Vph = 2L/P ≈ 1241 km s−1. The local coronal Alfvén speed is estimated as VA = B/ ≈ 900 km s−1. The sound speed is calculated as cs = 152×
 = 459 km s−1 in the MFR. Considering a possible uncertainty of about 10%–20% in calculating the temperature, density, and length of the sigmoid, the phase speed of this oscillation is consistent with the estimated coronal Alfvén speed and is much greater than the local sound speed. Combined with the fact of transverse oscillating, this precursor oscillation follows the mode of standing fast kink magnetosonic wave. By calculating the theoretical periods of four different modes discussed in Aschwanden et al. (1999), this precursor oscillation is also theoretically consistent with a fast kink mode with a lateral displacement, of which the theoretical period is estimated as Pkink = 270 s. Therefore, we conclude that the MFR experienced a global transverse oscillation of fast kink mode before the eruption. The consistency of the observed oscillation parameters with a kink-mode oscillation of a flux rope is a further strong support for the existence of an MFR.
In summary, a precursor activity was discovered in a sigmoidal structure that is highly suggestive of the existence of an MFR during a solar eruption, i.e., the transverse oscillation of a pre-existing conjectured MFR occurring about 20 minutes before the onset of the main phase of an X1.6 class flare on 2014 September 10. The precursor oscillation had the velocities within [−9, 11] km s−1, a period of about 280 s, and a lifetime about 13 minutes, as well as the nature of a standing wave of fast kink mode as a whole. A scenario is proposed for the solar eruption in this work. In the core of the AR, the MFR had already formed and existed some time before the eruption. During this period there was no noticeable transient activity in the corona except the possible appearance of a rather static hot sigmoid in X-rays and EUV wavelengths. Somehow, the MFR became unstable and started to rise. This ascending MFR interacted with the overlying coronal loop arcade that was trying to hold down the MFR. A current sheet was formed between the ascending MFR and the overlying loop arcade, triggering magnetic reconnection and energy release. This external reconnection defined the onset of the observed precursor phase. The released energy excited the system and led to the oscillation motion of the MFR. At the end of the precursor phase, a vertical current sheet forming underneath the MFR started to reconnect. This internal magnetic reconnection defined the onset of the observed impulsive or main phase of the eruption, leading to the flare and the CME.
G.P.Z. thanks Dr. H. Tian for careful guidance in analyzing IRIS data. The work is supported by the National Natural Science Foundation of China (11322329, 11533008, 11025315, 11221063, and 11303049), the Chinese Academy of Science Project KJCX2-EW-T07, and the National Key Basic Research Science Foundation (G2011CB811403 and G2011CB811402). J.Z. is supported by NSF AGS-1156120 and NSF AGS-1249270.