


Abstract
We explore the characteristics of carbon stars within our Galaxy through a comprehensive analysis of observational data spanning visual and infrared (IR) bands. Leveraging data sets from IRAS, the Infrared Space Observatory, Akari, the Midcourse Space Experiment, the Two Micron All Sky Survey, the Wide-field Infrared Survey Explorer (WISE), Gaia DR3, AAVSO, and the SIMBAD object database, we conduct a detailed comparison between the observational data and theoretical models. To facilitate this comparison, we introduce various IR two-color diagrams (2CDs), IR color–magnitude diagrams (CMDs), and spectral energy distributions (SEDs). We find that the CMDs, which utilize the latest distance and extinction data from Gaia DR3 for a substantial number of carbon stars, are very useful for distinguishing carbon-rich asymptotic giant branch (CAGB) stars from extrinsic carbon stars that are not in the AGB phase. To enhance the accuracy of our analysis, we employ theoretical radiative transfer models for dust shells around CAGB stars. These theoretical dust shell models demonstrate a commendable ability to approximate the observations of CAGB stars across various SEDs, 2CDs, and CMDs. We present the infrared properties of known pulsating variables and explore the infrared variability of the sample stars by analyzing WISE photometric data spanning the last 14 years. Additionally, we present a novel catalog of CAGB stars, offering enhanced reliability and a wealth of additional information.
Export citation and abstract BibTeX RIS

Original content from this work may be used under the terms of the Creative Commons Attribution 4.0 licence. Any further distribution of this work must maintain attribution to the author(s) and the title of the work, journal citation and DOI.
1. Introduction
The asymptotic giant branch (AGB) phase is divided into the early AGB (E-AGB) and the thermally pulsing AGB (TP-AGB) phases (e.g., Iben & Renzini 1983). Carbon-rich AGB (CAGB) stars are generally believed to be the evolutionary successors of M-type oxygen-rich AGB (OAGB) stars that are in the E-AGB phase. When the OAGB stars of intermediate mass (1.55 M⊙ ≤ M < 4 M⊙, for solar metallicity) go through third dredge-up processes, which occur due to thermal pulses in the AGB phase, the C/O ratio can become larger than one, and thus O-rich dust formation ceases and the stars become visual CAGB stars (Groenewegen et al. 1995), which are now CAGB stars in the TP-AGB phase. After that phase, C-rich dust grains start forming and the stars evolve into infrared carbon stars, which are CAGB stars with thick C-rich dust envelopes and high mass-loss rates (e.g., Suh 2000). More evolved or massive OAGB stars also undergo the TP-AGB phase. Almost all AGB stars are long-period variables (LPVs) with large amplitude pulsations (e.g., Höfner & Olofsson 2018).
A carbon star is typically a CAGB star, but there are other types of carbon stars. Generally, a classical (or intrinsic or type C–N) carbon star is known as a CAGB star. And there are nonclassical or extrinsic carbon stars that are not in the AGB phase: barium (Ba) stars, CH (or C–H) stars, dwarf carbon (dC) stars, J-type (or C–J) stars, and early R-type (R-hot or RH) stars (e.g., Green 2013; Abia et al. 2020).
Extrinsic carbon stars of the Ba, CH, and dC types are hypothesized to be binary systems, featuring one giant (or dwarf) star and another in the form of a white dwarf. The white dwarf was once a CAGB star involved in a mass transfer process, providing C-rich material (Lü 1991; Li et al. 2018; Abia et al. 2022). While these stars exhibit carbon enhancement, the C/O ratio in the envelope is not necessarily greater than one. CH stars, identified as Population II stars, share similarities in evolutionary state, spectral peculiarities, and orbital statistics with Ba stars. They are considered the older, metal-poor analogs of the latter (Escorza et al. 2017).
The nature of J-type or R-type extrinsic carbon stars is not yet clearly known. Late R-type stars are known to be similar to CAGB stars (Zamora et al. 2009). On the other hand, early R-type (R-hot or RH) stars are believed to be single stars that merge from binary stars that consist of a red giant and a white dwarf (Zhang & Jeffery 2013; Abia et al. 2020). The anomalous He flash after the merger of red giant stars has been suggested as a cause of the carbon enhancement in RH stars (Zhang & Jeffery 2013). J-type carbon stars are suspected to represent a short and luminous stage in the evolution of an R-hot star (Zhang & Jeffery 2013; Abia et al. 2020).
Various IR observational data are available from the Infrared Astronomical Satellite (IRAS), Infrared Space Observatory (ISO), Midcourse Space Experiment (MSX), AKARI, Two Micron All Sky Survey (2MASS), and Wide-field Infrared Survey Explorer (WISE). These data have been very useful for identifying carbon stars and understand their nature. Additionally, the Near-Earth Object WISE Reactivation (NEOWISE-R) mission (Mainzer et al. 2014) has conducted photometric observations at 3.4 and 4.6 μm since 2013.
Recently, the Gaia Data Release 3 (DR3) provided useful data in visual bands for more than one billion stars (Rimoldini et al. 2023). The newly obtained distance (Bailer-Jones et al. 2021) and extinction (e.g., Lallement et al. 2022) data derived from the Gaia DR3 data can be useful for finding the absolute luminosity of a large number of carbon stars in our Galaxy.
In this study, we explore the properties of carbon stars within our Galaxy. In Section 2, we furnish lists of known carbon stars across various subclasses. For the sample of carbon stars, we conduct cross-identifications with counterparts from IRAS, AKARI, MSX, 2MASS, WISE, Gaia DR3, and the American Association of Variable Star Observers (AAVSO; international variable star index; version 2023 December 12; Watson et al. 2022).
Section 3 presents diverse infrared two-color diagrams (2CDs) and color–magnitude diagrams (CMDs) for distinct subclasses of carbon stars, juxtaposed with theoretical models of CAGB stars. This comparison aims to unveil potential differences in their infrared properties. Section 4 outlines the theoretical radiative transfer models for dust shells enveloping CAGB stars.
In Section 5, we compare observed spectral energy distributions (SEDs) of CAGB stars with theoretical models, exploring the properties of CAGB stars in depth. Section 6 details the spatial distributions of carbon stars across various subclasses throughout our Galaxy. In Section 7, we present the infrared properties of known Mira variables among the CAGB stars and investigate the infrared variability of all sample stars. This analysis is carried out by scrutinizing WISE photometric data in the W1 and W2 bands spanning the last 14 years. In Section 8, we present a new catalog of CAGB stars. Finally, Section 9 consolidates and summarizes the key findings and results of this paper.
2. Carbon Stars in Our Galaxy
In this section, we compile lists of known carbon stars spanning various subclasses, drawing from diverse literature sources and the Strasbourg Astronomical Data Centre (CDS) SIMBAD astronomical database. For the recently acquired sample of carbon stars, we perform cross-identifications with counterparts from IRAS, AKARI, MSX, 2MASS, WISE, Gaia DR3, and AAVSO.
Suh (2022) presented a catalog of CAGB stars within our Galaxy, divided into two parts: one based on the IRAS Point Source Catalog (PSC; 4118 objects) and the other on the AllWISE source catalog (5366 objects). However, this catalog includes (extrinsic) carbon stars not in the AGB phase (refer to Section 1) and objects with uncertain chemistry. To enhance the catalog's reliability, we utilize a fresh sample of carbon stars in our Galaxy, discerning CAGB stars from other subclasses of carbon stars. The inclusion of distance and extinction information from the new Gaia DR3 data proves beneficial for this purpose.
2.1. Sample Stars
We have compiled lists of known carbon stars in our Galaxy from both the literature and CDS SIMBAD astronomical database, as detailed in Tables 1 and 2. Table 1 comprises the sample stars with corresponding IRAS counterparts (CS_IC), while Table 2 lists stars without IRAS counterparts (CS_NI). The tables provide references and the numbers of selected objects for each subclass of carbon stars.
Table 1. Sample of Carbon Stars (CS) with IRAS Counterparts (CS_IC)
| Subclass | Reference | Number | Selected | IRAS | Ba-CH_IC | RH_IC | J-type_IC | RCB_IC | CAGB_IC |
|---|---|---|---|---|---|---|---|---|---|
| CAGB-IRAS | Suh (2022) | 4118 | 4118 | 4118 | 4 | 3 | 78 | 35 | 3523 a |
| CS | Alksnis et al. (2001) | 6891 | 6817 b | 3799 | 6 | 4 | 98 | 26 | 3574 |
| CAGB | Chen & Yang (2012) | 974 | 963 c | 962 | 0 | 0 | 2 | 4 | 938 |
| J-type | Chen et al. (2007) | 113 | 112 d | 103 | 1 | 1 | 97 | 1 | 6 |
| CS | Abia et al. (2022) | 827 | 818 b | 574 | 0 | 5 | 78 | 0 | 292 |
| CS | Li et al. (2018) | 2650 | 2624 b | 349 | 0 | 0 | 13 | 1 | 328 |
| Ba | Lü (1991) | 389 | 389 | 168 | 166 | 1 | 0 | 0 | 0 |
| Ba (mostly) | Escorza et al. (2017) | 437 | 437 | 176 | 167 | 2 | 2 | 0 | 1 |
| dC (mostly) | Green (2013) | 1211 | 1211 | 1 | 0 | 0 | 0 | 0 | 1 |
| CS | SIMBAD CS | 21,743 | 7541 e | 3641 | 0 | 4 | 95 | 5 | 3511 |
| CS | Gaia DR3 CS | 30,023 f | 19,863 g | 4498 | 0 | 0 | 89 | 6 | 4132 |
| Total h | ⋯ | ⋯ | ⋯ | ⋯ | 181 | 5 | 100 | 39 | 4909 |
Notes.
a Color-selected objects without any other evidence are excluded. b Sources with duplicate SIMBAD identifiers are excluded. c Wrongly classified objects are excluded. d IRAS 18006-3213 is an OH/IR star. e CDS SIMBAD main type C* in our Galaxy. f C-rich stars from Gaia DR3 spectra for LPVs (Lebzelter et al. 2023). g Objects in our Galaxy. h Duplicate objects are excluded.Download table as: ASCIITypeset image
Table 2. Sample of Carbon Stars (CS) without IRAS Counterparts (CS_NI; AllWISE or Gaia DR3 Sources)
| Subclass | Reference | Number | Selected | Non-IRAS | Ba-CH_NI | dC_NI | RH_NI | J-type_NI | CAGB_NI |
|---|---|---|---|---|---|---|---|---|---|
| CAGB-WISE | Suh (2022) | 5366 | 2440 a | 2440 | 24 | 2 | 28 | 69 | 1663 |
| CS | Alksnis et al. (2001) | 6891 | 6817 b | 3018 | 28 | 2 | 31 | 75 | 2022 |
| CAGB | Chen & Yang (2012) | 974 | 963 c | 1 | 0 | 0 | 0 | 0 | 1 |
| J-type | Chen et al. (2007) | 113 | 112 d | 9 | 0 | 0 | 0 | 8 | 0 |
| CS | Abia et al. (2022) | 827 | 818 b | 244 | 0 | 0 | 230 | 1 | 3 |
| CS | Li et al. (2018) | 2650 | 2624 b | 2275 | 1442 | 6 | 204 | 124 | 75 |
| Ba | Lü (1991) | 389 | 389 | 221 | 221 | 0 | 0 | 0 | 0 |
| Ba (mostly) | Escorza et al. (2017) | 437 | 437 | 261 | 244 | 0 | 1 | 0 | 0 |
| dC (mostly) | Green (2013) | 1211 | 1211 | 1210 | 25 | 1086 | 0 | 2 | 2 |
| CS | SIMBAD CS | 21,743 | 7541 e | 3901 | 80 | 448 | 203 | 78 | 1789 |
| CS | Gaia DR3 CS | 30,023 f | 19,863 g | 15,365 h | 2 | 2 | 0 | 66 | 1857 + (7470) i |
| Total j | ⋯ | ⋯ | ⋯ | ⋯ | 1707 | 1087 | 230 | 131 | 2254 + (7470) i |
Notes.
a Color-selected objects without any other evidences are excluded. b Sources of duplicate SIMBAD identifiers are excluded. c Wrongly classified objects are excluded. d IRAS 18006-3213 is an OH/IR star. e CDS SIMBAD main type C* in our Galaxy. f C-rich stars from Gaia DR3 spectra for LPVs (Lebzelter et al. 2023). g Objects in our Galaxy. h Denoted by GC(all)_NI. i Candidate objects for new CAGB stars solely identified from Gaia DR3 spectra and absolute magnitudes (denoted by GC-CAGB_NI; see Section 3.6). j Duplicate objects are excluded.Download table as: ASCIITypeset image
We present the sample of carbon stars in two parts: one (CS_IC) based on the IRAS source catalog for brighter or more isolated objects (Table 1), and the other (CS_NI) based on the AllWISE or Gaia DR3 source catalog for less bright objects or those in crowded regions (Table 2). While most CS_IC objects have AllWISE or Gaia DR3 counterparts, CS_NI objects lack IRAS counterparts.
For each carbon star outlined in Tables 1 and 2, we meticulously assigned specific subclasses by referencing pertinent literature and the CDS SIMBAD database. The subclasses include Ba or CH stars (Ba-CH_IC and Ba-CH_NI), dC stars (dC_NI; relevant only for non-IRAS objects), R-hot stars (RH_IC and RH_NI), J-type stars (J-type_IC and J-type_NI), R Coronae Borealis (RCB) stars (RCB_IC; considered only for IRAS objects), and CAGB stars (CAGB_IC and CAGB_NI). Ambiguous cases, where the carbon-rich nature was unclear due to conflicting information (e.g., certain C-type objects identified as OAGB stars), were omitted from the selection.
RCB variables, which are a class of hydrogen-deficient carbon (HdC) stars, are believed to be formed via the merger of two white dwarf stars. Some RCB stars were known to be CAGB stars or J-type carbon stars in previous studies.
While the IR color-selection method using a 2CD is beneficial for distinguishing between CAGB and OAGB stars (e.g., Suh & Hong 2017; Suh 2022), we acknowledge its potential unreliability for a significant proportion of AGB stars compared to spectroscopic or spectrophotometric methods. To enhance the reliability of our carbon star sample, we excluded objects solely classified based on the IR color-selection method without additional supporting evidence.
In this study, we have identified CAGB stars from a substantial sample of carbon stars spanning various subclasses (refer to Tables 1 and 2), leveraging information from diverse literature sources, the CDS SIMBAD database, and examining their IR properties through 2CDs, CMDs, and SEDs (refer to Sections 3 and 5).
The criteria for classifying CAGB stars can be summarized as follows: (1) they exhibit characteristics indicative of being carbon-rich stars from the spectroscopic information (see Section 2.4); (2) their IR properties (2CDs, CMDs, and SEDs) align with those of known CAGB stars; (3) their absolute magnitudes are brighter than −6 mag in the IR[12] or W3[12] bands (refer to Section 3); (4) there is no conclusive evidence of J-type or complex binary star characteristics; (5) Mira variables can be considered as AGB stars (refer to Section 7).
For all the sample stars, we carefully cross-identified available counterparts from IRAS, Akari, MSX, 2MASS, WISE, Gaia DR3, AAVSO (version 2023 December 12; Watson et al. 2022), and the CDS SIMBAD object database.
2.2. Infrared Photometric Data
2MASS (Cutri et al. 2003) provided fluxes in the J (1.25 μm), H (1.65 μm), and K (2.16 μm) bands. WISE (Jarrett et al. 2011) mapped the sky in four bands (3.4, 4.6, 12, and 22 μm; W1, W2, W3, and W4). The field-of-view pixel sizes of the IRAS, MSX, AKARI PSC, AKARI Bright Source Catalog (BSC), 2MASS, and WISE images are 0 75 × (45–46), 18
 3, 10'', 30'', 2'', and 275, respectively.
Table 3 lists IR bands used in this work for 2CDs and CMDs. For each band, the reference wavelength (λref) and zero-magnitude flux (ZMF) value, which are useful for obtaining theoretical model colors (see Section 4) and SEDs, are also shown. For more detailed description of IR photometric data and ZMF, refer to Section 2.1 in Suh (2021).
Table 3. IR Bands and Zero-magnitude Flux Values
| Band | λref | ZMF | Telescope | References |
|---|---|---|---|---|
| (μm) | (Jy) | |||
| K[2.2] | 2.159 | 666.7 | 2MASS | Cohen et al. (2003) |
| W1[3.4] | 3.35 | 306.682 | WISE | Jarrett et al. (2011) |
| W2[4.6] | 4.60 | 170.663 | WISE | Jarrett et al. (2011) |
| IR[12] | 12 | 28.3 | IRAS | Beichman et al. (1988) |
| W3[12] a | 12 | 28.3 | WISE | Jarrett et al. (2011) |
| W4[22] | 22.08 | 8.284 | WISE | Jarrett et al. (2011) |
| IR[25] | 25 | 6.73 | IRAS | Beichman et al. (1988) |
| IR[60] | 60 | 1.19 | IRAS | Beichman et al. (1988) |
Note.
a For W3[12], we use a new reference wavelength and zero-magnitude flux for theoretical models (see Section 4.2 in Suh 2020).Download table as: ASCIITypeset image
In this work, we use only good-quality observational data in all wavelength bands for the photometric data (quality better than 1 for the IRAS, AKARI, and MSX data; quality better than U for the WISE data).
2.3. The IRAS Data
Given the low angular resolution of IRAS, utilizing AllWISE or 2MASS counterparts derived from the positions of cross-matched AKARI or MSX sources (which possess higher angular resolution, as discussed in Section 2.2) improves the reliability of the data (e.g., Suh 2021).
There are 245,889 sources in the IRAS PSC and 173,044 in the Faint Source Catalog (FSC). This study utilizes the combined source catalog of IRAS, as presented by Abrahamyan et al. (2015), consisting of 345,163 sources with 73,770 associated sources from the PSC and FSC. A correction is applied, acknowledging that IRAS PSC 17501-0333 is distinct from IRAS FSC F17499-0334 due to differing Akari PSC counterparts with distinct flux values. Consequently, a combined source catalog of 345,164 sources with 73,769 associated sources is employed.
In contrast to the approach taken by Abrahamyan et al. (2015), this study utilizes FSC data (position and flux) only for the 32,079 associated sources with FSC flux at 12 μm fainter than the average FSC flux. For the brighter 41,690 associated sources, PSC data are preferred, as they yield higher-quality data.
For all 345,164 IRAS sources, AKARI, MSX, AllWISE, 2MASS, OGLE4, Gaia DR3, and AAVSO counterparts are identified using the following method. The AKARI PSC, MSX, and AKARI BSC counterparts are cross-identified by selecting the nearest source within 60'', utilizing the position provided in the IRAS PSC or FSC. Subsequently, the AllWISE, 2MASS, Gaia DR3, and AAVSO counterparts are cross-identified using the best position among the available AKARI PSC, MSX, or AKARI BSC counterparts. The position of the IRAS source is employed only in cases where there is no AKARI or MSX counterpart. When a Gaia DR3 counterpart is present, the Gaia position can be used as the best position for the IRAS source.
Due to the substantial beam size of IRAS, some sources represent multiple objects. Notably, certain IRAS objects recognized as CAGB stars (e.g., IRAS 17209-3318 and 10151-6008) are now identified as multiple objects. These particular objects are excluded from the CS_IC list. The majority of these objects find inclusion in the CS_NI list, with consideration given to SIMBAD information and their counterparts in AKARI, WISE, and Gaia DR3. It is important to note that there are no duplicate objects in the CS_IC and CS_NI lists.
2.4. Spectroscopic Data
The SIMBAD astronomical database provides useful information on the optical and IR spectra for the sample stars. AAVSO (Watson et al. 2022) also provides spectroscopic information for a large proportion of sample stars.
In identifying important dust features for AGB stars, IRAS Low Resolution Spectrograph (LRS; λ = 8–22 μm) data are useful (Kwok et al. 1997). The class E (the 10 μm silicate feature in emission) and class A (the 10 μm silicate feature in absorption) objects are typically OAGB stars. Class C (the 11.3 μm SiC feature in emission) objects are generally carbon stars.
Among the 715 IRAS LRS sources identified as class C, 713 were initially categorized as CAGB stars by Suh (2022), with only two exceptions (IRAS 13136-4426: S-type star; IRAS 22306+5918: composite object). However, further examination reveals that 23 objects (9 J-type stars, 3 OAGB stars, 11 others) deviate from the CAGB classification, leaving a total of 690 confirmed CAGB stars.
Additionally, the ISO Short Wavelength Spectrometer (SWS: λ = 2.4–45.4 μm) data can be employed for analysis (see Section 5.1). The ISO SWS catalog by Sloan et al. (2003) encompasses high-resolution spectral data from 1271 observations.
Carbon stars exhibit diverse gas-phase emission or absorption features in the near-IR (NIR) and mid-IR (MIR) bands, attributable to circumstellar molecules such as C2, CO, CN, HCN, and C2H2 (e.g., Lançon & Wood 2000). Identification of 139 cool carbon stars in the NIR spectrophotometric survey of the Infrared Telescope in Space was conducted by Le Bertre et al. (2005), based on the conspicuous presence of molecular absorption bands at 1.8, 3.1, and 3.8 μm. These objects were duly considered in the CAGB lists presented by Suh & Kwon (2011) and Suh (2022).
The Gaia DR3 LPV (Lebzelter et al. 2023) data provided the low-resolution Red Photometric (RP) spectra in visual wavelength bands to identify carbon stars for the 1,720,558 LPV candidates. Li et al. (2018) presented a catalog of 2651 carbon stars from the optical spectra of the Large Sky Area Multi-Object Fiber Spectroscopic Telescope (LAMOST). While these spectra in the visual bands may exhibit limitations for objects with thick dust envelopes or those experiencing significant extinction (e.g., Suh 2022), they remain valuable for identifying visual carbon stars within a substantial sample of observed objects.
Using Gaia RP spectral data for the LPV candidates, 30,023 objects can be classified as carbon stars (Suh 2022) using the selection criteria (7 < median_delta_wl_rp < 11 and GBP < 19 mag) outlined in Section 2.4 of Lebzelter et al. (2023). Among these, 19,863 objects are located in our Galaxy. From these 19,863 objects, 4498 have IRAS counterparts and 15,365 do not. It is noteworthy that most of the 4498 objects with IRAS counterparts are already well known as carbon stars in various literature sources and SIMBAD. Among them, we identify 4132 objects as CAGB_IC objects.
The 15,365 objects without IRAS counterparts are considered candidate carbon stars identified from Gaia DR3 spectra (denoted as GC(all)_NI; refer to Table 2) without any additional evidence. From this group of 15,365 GC(all)_NI objects, we select candidates for CAGB stars (GC-CAGB_NI objects) based on their IR properties (refer to Section 3.6).
2.5. Distances and Galactic Extinction
The recently obtained distance information (Bailer-Jones et al. 2021) and extinction data from Lallement et al. (2022), derived from Gaia DR3 data, play a crucial role in determining the absolute luminosity of a significant number of carbon stars in our Galaxy.
For the majority of carbon stars, distances derived from Gaia DR3 data are readily available. In instances where Gaia DR3 distances are absent, we turn to distances from SIMBAD (mainly obtained from Hipparcos) when accessible. In cases where such information is unavailable for CAGB stars, we determine the distance through a comparative analysis between the observed SED and the theoretical CAGB model SED, as elaborated in Section 5.3.
Having established the distance and position of each object, we obtained extinction values (AV ) in the visual band from the data server provided by Lallement et al. (2022). Expanding our analysis, we can calculate extinction values in Gaia, 2MASS, and other bands, employing the optical-to-MIR extinction law presented by Wang & Chen (2019).
The obtained distance and extinction data are used in the construction of various IR 2CDs and CMDs, as detailed in Section 3. Note that the extinction data are applied to the colors and magnitudes using the K[2.2] band data for the IR 2CDs and CMDs presented in Section 3.
3. Infrared Properties of Carbon Stars
In this section, we investigate IR properties of known carbon stars in our Galaxy presented in Section 2. Using various observational data, we present useful IR 2CDs and CMDs for the large sample of carbon stars compared with the theoretical models for CAGB stars (see Section 4) and distinguish CAGB stars from other subclasses of carbon stars. Table 3 lists the IR bands used for the IR 2CDs and CMDs presented in this work (see Section 2.2).
Although the photometric fluxes are less useful than a full SED, the large number of observations in various wavelength bands can be used to form a 2CD, which can be compared with theoretical models. IR 2CDs are useful for statistically distinguishing various properties of AGB stars and post-AGB stars (e.g., Epchtein et al. 1990; Suh & Kwon 2011; Suh 2015).
Figures 1 and 2 show various IR 2CDs using different combinations of observed IR colors for various subclasses of carbon stars (see Tables 1 and 2). For comparison, we also plot OAGB stars from Suh (2022). We juxtapose the observations on the IR 2CDs with the theoretical dust shell models for CAGB stars (refer to Section 4). Generally, the theoretical dust shell models for both OAGB and CAGB stars demonstrate a commendable ability to reproduce the observed points. However, certain objects deviate significantly from the theoretical models. This discrepancy may arise from AGB stars with nonspherical dust envelopes, which are not accurately represented by the theoretical dust shell models. Additionally, the substantial effects on IR colors caused by the large amplitude pulsations of AGB stars, along with instances of thermal pulses (superwinds), may contribute to the observed deviations.

Figure 1. IRAS–2MASS 2CDs for various subclasses of CS_IC objects (see Table 1) and special subgroups of CAGB stars (see Section 3) compared with theoretical models (see Section 4). For CAGB models (AMC, Tc = 1000 K): τ10 = 0.0001, 0.01, 0.1, 0.5, 1, 2, and 4 from left to right. For each subclass, the number of objects is shown. The number in parenthesis denotes the number of objects plotted on the 2CD with good-quality observed colors. See Section 3.1.
Download figure:
Standard image High-resolution image
Figure 2. WISE–2MASS 2CDs for CS_IC and CS_NI objects (see Tables 1 and 2) compared with theoretical models (see Section 4). For CAGB models (AMC, Tc = 1000 K): τ10 = 0.0001, 0.01, 0.1, 0.5, 1, 2, and 4 from left to right. For each subclass, the number of objects is shown. The number in parenthesis denotes the number of objects plotted on the 2CD with good-quality observed colors. See Section 3.3.
Download figure:
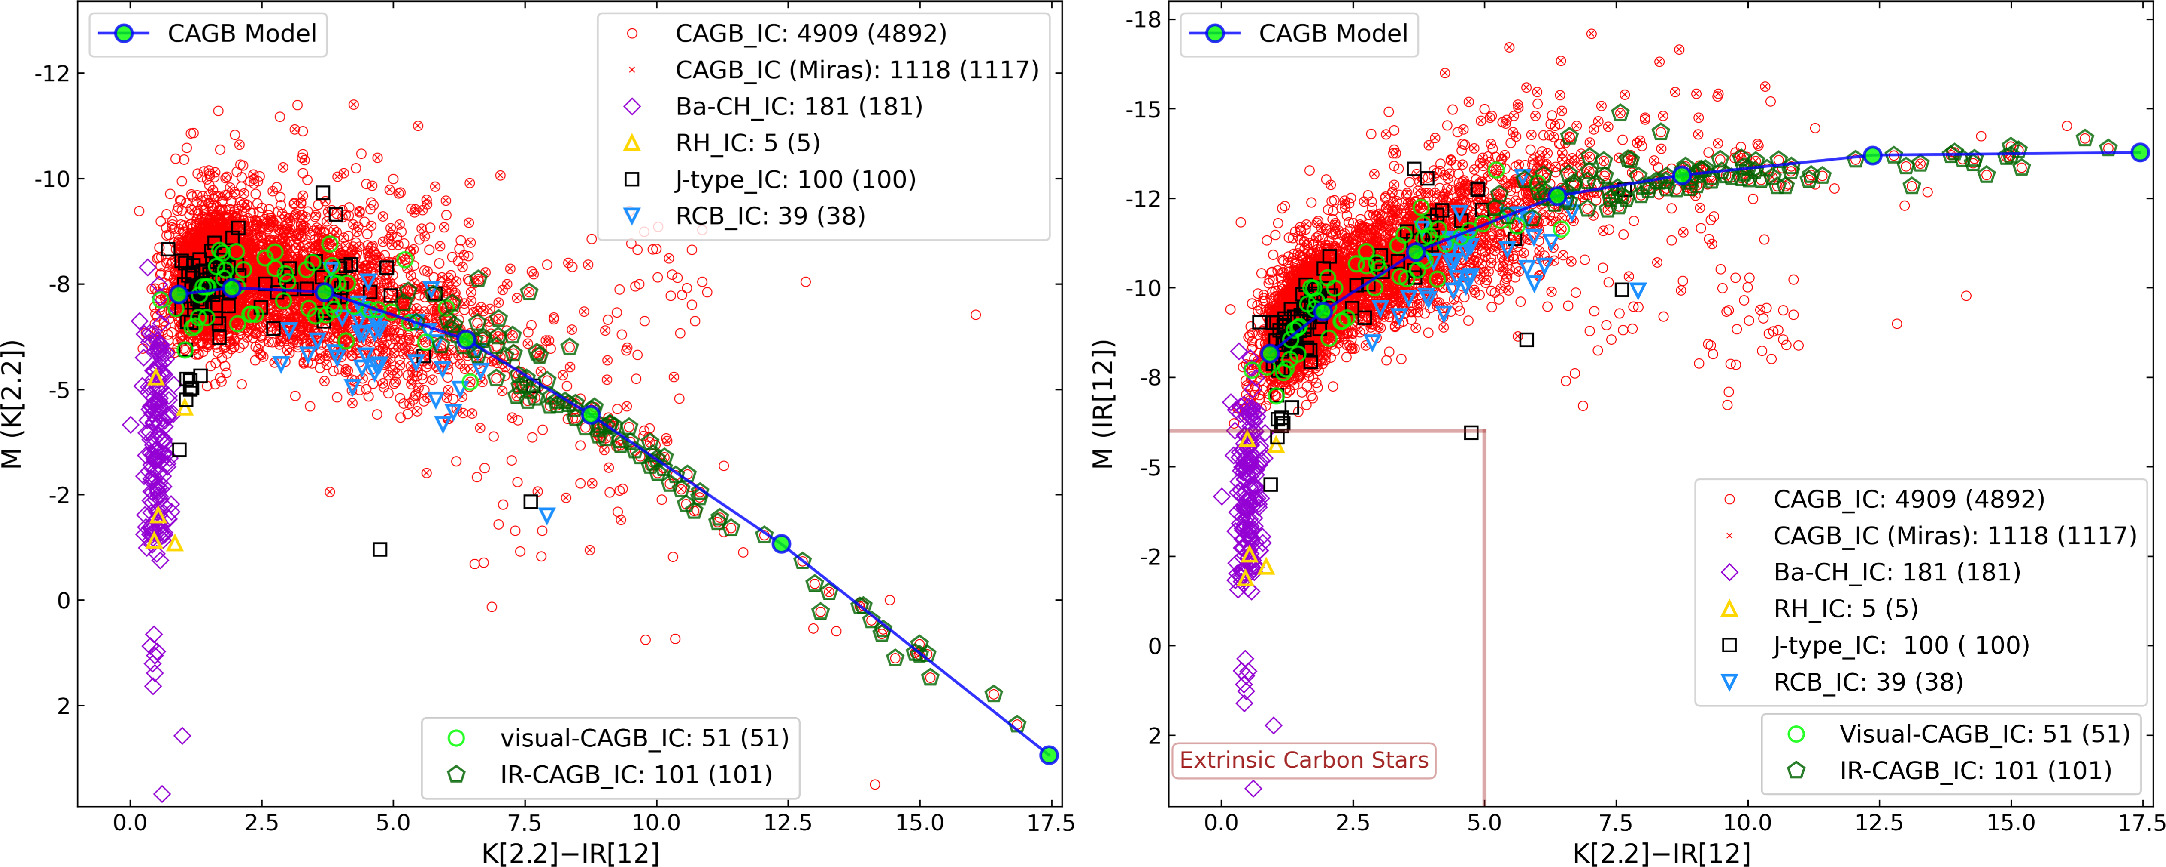
Standard image High-resolution imageFigures 5 and 6 show CMDs using IR bands. We find that the CMDs, which utilize the latest distance and extinction data from Gaia DR3 for a substantial number of carbon stars, are very useful for distinguishing CAGB stars from extrinsic carbon stars that are not in the AGB phase.
A specific subset of 152 well-known CAGB stars are notably highlighted on all the 2CDs and CMDs, encompassing 51 visual-CAGB_IC objects and 101 IR-CAGB_IC objects, for which detailed SEDs are compared with theoretical models (see Section 5.1). Among the 152 CAGB stars, a simple single dust shell model incorporating amorphous carbon (AMC) and SiC dust effectively reproduces the observed SEDs for the majority of objects. However, certain objects require more intricate models, such as detached or double shells or nonspherical dust envelopes (refer to Section 5.2). The 12 objects necessitating more complex models, as indicated exclusively in Figure 1, consist of two visual-CAGB_IC (detached shell) objects and 10 CAGB_IC (double shell) objects.
3.1. The IRAS 2CD
The upper panel of Figure 1 illustrates an IRAS 2CD using IR[25]−IR[60] versus IR[12]−IR[25]. We observe that the basic theoretical model tracks can provide a rough explanation for the observed points. This 2CD has been extensively utilized since van der Veen & Habing (1988; note that those authors did not perform zero-magnitude calibrations for their 2CD), who divided it into eight regions representing different classes of celestial bodies. Building on theoretical dust shell models for AGB stars and post-AGB stars, Suh (2015) presented potential evolutionary tracks from AGB stars to post-AGB stars and ultimately to planetary nebulae on this 2CD. In our work, we categorize this 2CD into four regions (from R1 to R4) to enhance the classification of carbon stars.
On the IRAS 2CD, CAGB stars trace a "C"-shaped curve, with visual CAGB stars and extrinsic carbon stars primarily located in the lower left region (R1) and extending to the right side (R2). IR CAGB stars, or infrared carbon stars, situated on the right side (R2), exhibit thicker dust envelopes with larger dust optical depths (see Section 1 for the evolution of CAGB stars). Among them, 51 visual-CAGB_IC objects are positioned in R1 and R4, while all 101 IR-CAGB_IC objects are in R2 (with only one object located in R4 requiring a complex model).
A group of stars in the upper left region (R4) comprises visual carbon stars, including the early phase of CAGB stars, which exhibit excessive flux at 60 μm due to remnants of an earlier phase when the stars were OAGB stars (see, e.g., Chan & Kwok 1990). Notably, the 12 objects requiring more complex models, such as detached or double shell models, are located in region R4 on the 2CD. This subset includes two visual-CAGB_IC (detached shell) objects and 10 CAGB_IC (double shell) objects (refer to Section 5.2).
Furthermore, the region R4 hosts various subclasses of extrinsic carbon stars, primarily binary stars, and some CAGB stars with intricate dust envelopes, potentially arising from binary interactions or the presence of substantial planets.
Most extrinsic carbon stars (Ba, CH, and RH stars) in regions R1 and R4 are not found in R2, while J-type extrinsic carbon stars that may exhibit CAGB-like nature are scattered across all regions (R1, R2, and R4). In particular, extrinsic carbon stars of Ba and CH types are notably concentrated in the far left region.
On the far right side (R3), where most post-AGB stars and planetary nebulae are distributed (e.g., Suh 2015), there are only three CAGB stars in our sample.
3.2. IRAS and 2MASS 2CDs
The lower panel of Figure 1 displays an IRAS–2MASS 2CD using IR[12]−IR[60] versus K[2.2]−IR[12]. Galactic extinction is taken into account for the K[2.2]−IR[12] color, as explained in Section 2.5. On this 2CD, the differentiation between OAGB and CAGB stars becomes more distinct. Visual carbon stars occupy the lower left region of this 2CD due to their relatively bluer K[2.2]−IR[12] colors than others. Specifically, extrinsic carbon stars of Ba and CH types are notably concentrated in the far left region.
3.3. WISE and 2MASS 2CDs
Figure 2 shows 2CDs using W3[12]−W4[22] versus K[2.2]−W3[12]. Galactic extinction is taken into account for the K[2.2]−W3[12] color. The upper panel shows carbon stars with IRAS counterparts (CS_IC) while the lower panel shows those without (CS_NI). In general, the theoretical dust shell models for both OAGB and CAGB stars demonstrate a satisfactory ability to replicate the observed points on these IR 2CDs. Noticeable differences emerge between CS_IC and CS_NI objects. CS_IC objects, being more evolved and brighter in the MIR bands, exhibit much redder K[2.2]−W3[12] colors.
A distinctive group of CS_NI objects deviates from other carbon stars in the upper left region of the 2CD. These objects display bluer K[2.2]−W3[12] colors but redder W3[12]−W4[22] colors, and the reason for this phenomenon remains unclear. Given that many known extrinsic carbon stars (binary stars) are situated in this region, there could be a potential connection with the binary nature of extrinsic carbon stars, such as radiation from white dwarfs.
Figure 3 displays error-bar plots for W3[12]−W4[22] versus K[2.2]−W3[12] for all carbon stars. In this diagram, we present averaged colors and their errors (standard deviations) for all sample stars across various subclasses. We find that CS_NI objects consistently exhibit redder W3[12]−W4[22] colors for extrinsic carbon stars of Ba, CH, dC, and RH types.

Figure 3. Error-bar plot of the WISE–2MASS 2CD for all carbon stars (CS_IC and CS_NI objects; see Figure 4). See Section 3.3.
Download figure:
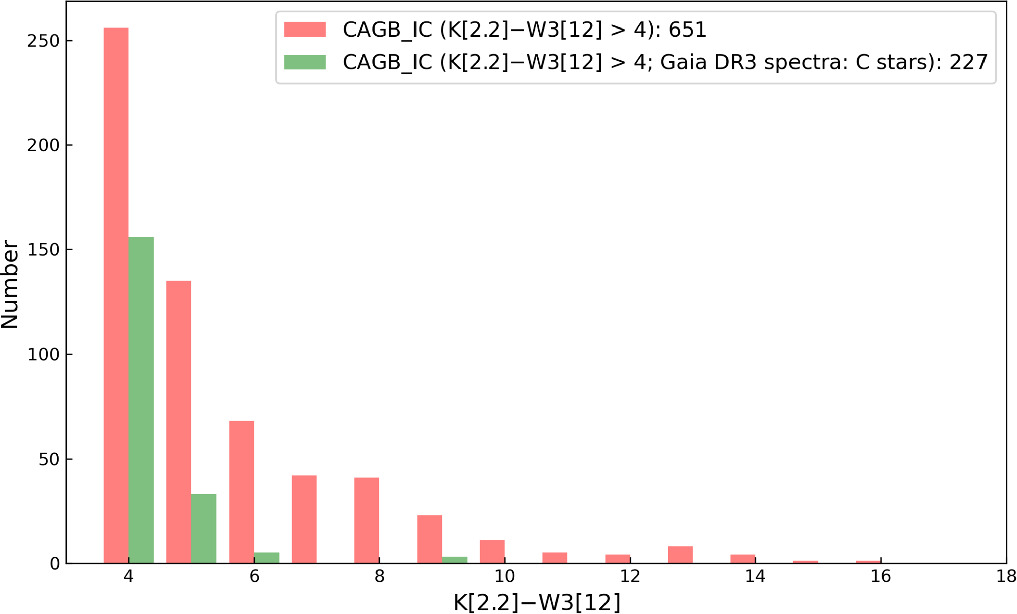
Standard image High-resolution imageOut of the 4909 CAGB stars, 4132 (84%) can be classified as C-rich stars based on the Gaia DR3 spectra (see Section 2.4). However, when focusing on CAGB stars with thick dust shells (K[2.2]−W3[12] > 4), the percentage drops to 34%. Figure 4 shows histograms of the K[2.2]−W3[12] colors for CAGB stars (CAGB_IC objects) with thick dust shells. This affirms that the Gaia DR3 spectral data can be more effective for stars characterized by thinner dust shells.

Figure 4. Histograms of the K[2.2]−W3[12] colors for CAGB stars (CAGB_IC objects) with thick dust shells. CAGB stars that can be classified as C-rich stars based on the Gaia DR3 spectra are compared with all CAGB stars. See Section 3.3.
Download figure:
Standard image High-resolution image3.4. IR CMDs
Utilizing the recently acquired distance (Bailer-Jones et al. 2021) and extinction data from Lallement et al. (2022), derived from the Gaia DR3 data, facilitates the determination of absolute magnitudes and unreddened colors across a broad spectrum (see Section 2.5). Leveraging this information for a significant number of carbon stars in our Galaxy, we present various CMDs that prove instrumental in distinguishing between CAGB (or intrinsic carbon) stars and extrinsic carbon stars.
Figure 5 displays CMDs using K[2.2]−IR[12] color and absolute magnitudes in K[2.2] and IR[12] bands for various subclasses of carbon stars with IRAS counterparts (CS_IC objects). Since objects with thicker dust shells exhibit redder K[2.2]−IR[12] colors, most CAGB stars are characterized by colors that are redder than those of extrinsic carbon stars. The distinction between CAGB stars and extrinsic carbon stars is apparent on these IR CMDs.

Figure 5. IRAS–2MASS CMDs for carbon stars with IRAS counterparts spanning various subclasses (see Table 1). For CAGB models (AMC, Tc = 1000 K): τ10 = 0.0001, 0.01, 0.1, 0.5, 1, 2, and 4 from left to right (see Section 4). For each subclass, the number of objects is shown. The number in parenthesis denotes the number of objects plotted with good-quality observed data. See Section 3.4.
Download figure:
Standard image High-resolution imageExtrinsic carbon stars of subclasses Ba, CH, and RH are notably distinguishable from CAGB stars on these CMDs, displaying dimmer absolute magnitudes in the IR[12] and K[2.2] bands and bluer K[2.2]–W3[12] colors. However, J-type stars, representing another subclass of extrinsic carbon stars, demonstrate properties shared with both CAGB stars and other extrinsic carbon stars. Remarkably, we find that RCB stars exhibit very similar properties to CAGB stars, making it challenging to distinguish them on these CMDs.
The left panel of Figure 5 displays a CMD using K[2.2]−IR[12] color and magnitudes at K[2.2]. CAGB stars exhibit brighter absolute magnitudes at K[2.2] only in bluer K[2.2]−W3[12] color ranges, because more evolved CAGB stars with redder K[2.2]−IR[12] colors have thicker circumstellar dust shells. These dense dust shells absorb radiation at shorter wavelengths (e.g., K[2.2]) and emit at longer wavelengths.
The right panel of Figure 5 illustrates a CMD using K[2.2]−IR[12] color and magnitudes at IR[12]. CAGB stars exhibit brighter absolute magnitudes at IR[12] across all K[2.2]–W3[12] color ranges. We find that the absolute magnitudes at the IR[12] band are brighter than −6 for all CAGB stars.
Figure 6 presents CMDs utilizing K[2.2]−W3[12] and W3[12]−W4[22] colors, along with absolute magnitudes in K[2.2], W3[12], and W4[22] bands for various subclasses of carbon stars (CS_IC and CS_NI). The left panels display CMDs for CS_IC objects, which exhibit similar characteristics to those depicted in Figure 5, while the right panels feature CS_NI objects.

Figure 6. WISE–2MASS CMDs for carbon stars spanning various subclasses (see Tables 1 and 2). For CAGB models (AMC, Tc = 1000 K): τ10=0.0001, 0.01, 0.1, 0.5, 1, 2, and 4 from left to right (see Section 4). For each subclass, the number of objects is shown. The number in parenthesis denotes the number of objects plotted with good-quality observed data. See Section 3.4.
Download figure:
Standard image High-resolution imageIn the upper four panels of Figure 6, CMDs are presented using the K[2.2]−W3[12] color. Given that objects with thicker dust shells manifest redder K[2.2]−W3[12] colors, the majority of CAGB stars exhibit colors that are redder than those of extrinsic carbon stars. More evolved CAGB stars exhibit redder K[2.2]−W3[12] colors but dimmer absolute magnitudes at K[2.2] due to their thicker circumstellar dust shells.
Notably, CAGB_IC objects are distributed across a wide range of K[2.2]−W3[12] colors, whereas CAGB_NI objects tend to concentrate in bluer K[2.2]−W3[12] colors. This distinction arises from the general trend of CAGB_IC objects being brighter or more evolved than CAGB_NI objects. Conversely, extrinsic carbon stars, whether CS_IC or CS_NI objects, tend to cluster in bluer K[2.2]−W3[12] colors and dimmer absolute magnitudes.
For all CAGB stars, we consistently observe absolute magnitudes in the W3[12] band that are brighter than −6, mirroring our findings in the case of the IR[12] band.
In the lower two panels of Figure 6, CMDs are shown using the W3[12]−W4[22] color and absolute magnitudes at W4[22]. For nearly all CAGB stars, the absolute magnitudes in the W4[22] band are brighter than −5. CS_IC objects are distributed across a limited range of W3[12]−W4[22] colors, while CS_NI objects are distributed across a much wider range into the bluer and redder spectrum. The reason for this phenomenon remains unclear (see Section 3.3).
3.5. Different Subclasses of Carbon Stars
The CMDs (see Figures 5 and 6) prove valuable in distinguishing CAGB (intrinsic carbon) stars from extrinsic carbon stars, particularly when comparing magnitudes in MIR bands (IR[12], W3[12], and W3[22]). We find that the absolute magnitudes in the IR[12] or W3[12] band are brighter than −6 for all CAGB stars. In contrast, extrinsic carbon stars of Ba, CH, dC, and RH types consistently exhibit dimmer magnitudes than CAGB stars in the MIR bands. J-type stars, constituting another subclass of extrinsic carbon stars, are distributed across a broader range of magnitudes, demonstrating properties that are shared with both CAGB stars and other extrinsic carbon stars.
Figure 7 displays error-bar plots for CMDs using W3[12] versus K[2.2]−W3[12] and W4[22] versus W3[12]−W4[22]. These diagrams present averaged colors and magnitudes and their errors (standard deviations) for all sample stars across various subclasses.

Figure 7. Error-bar plots of averaged colors and magnitudes for various subclasses of carbon stars. For each subclass, the number of objects is shown. The number in parenthesis denotes the number of objects plotted with good-quality observed data. See Section 3.5.
Download figure:
Standard image High-resolution imageFigure 8 presents histograms depicting the observed absolute magnitudes in W3[12] and W3[22] bands for different subclasses of carbon stars. The plots clearly delineate the distinction between CAGB stars and extrinsic carbon stars, with CAGB stars consistently brighter than −6 mag in the W3[12] band (−5 mag in the W4[22] band). Conversely, most Ba, CH, dC, and RH type extrinsic carbon stars exhibit dimmer magnitudes. Some J-type carbon stars are as faint as other extrinsic carbon stars, while others are as bright as CAGB stars.

Figure 8. Histograms of observed absolute magnitudes for various subclasses of carbon stars. The vertical lines indicate theoretical magnitudes for CAGB models CA1 and CA7 (see Table 4). See Section 3.5.
Download figure:
Standard image High-resolution imageIn contrast to typical extrinsic carbon stars, certain J-type carbon stars, such as IRAS 20166+3717 and IRAS 21566+5309, are recognized as Mira variables (AGB stars). This observation may be attributed to their binary nature, wherein one star is an AGB (not an RGB or a red dwarf) star, and the mass transfer process enhances the 13C content.
3.6. Carbon Stars from Gaia DR3 Spectra
As discussed in Section 2.4, there are 15,365 candidate objects for carbon stars identified from Gaia DR3 spectra (denoted by GC(all)_NI; refer to Table 2) without any other evidence. We selected candidate objects for new CAGB stars when their absolute magnitudes in the W3[12] band are brighter than −6. There are 7470 candidate objects for new CAGB stars identified solely from Gaia DR3 spectra and absolute magnitudes (denoted by GC-CAGB_NI; see Table 2).
When selecting the 7470 GC-CAGB_NI objects, special considerations were given to Mira variables (597 Miras are identified through AAVSO). Among these 597 Miras, the absolute magnitudes at the W3[12] band were dimmer than −6.5 for 43 objects according to the Gaia DR3 distances. Since Miras can be considered as AGB stars, we calculated theoretical distances assuming that the absolute magnitudes in the W3[12] band are −6. We found that the Gaia DR3 distances were too small compared to the theoretical distances for the 43 objects. By using the mean distances from Gaia DR3 and theoretical distances, the absolute magnitudes for the 43 objects became brighter than −6. Therefore, we have used the mean distances for the 43 Mira variables.
4. Theoretical Dust Shell Models
On all of the 2CDs and CMDs in Figures 1–8, theoretical models for AGB stars are plotted to be compared with the observations. To compute theoretical model SEDs for CAGB stars, we employ radiative transfer models for spherically symmetric dust shells around central stars. The radiative transfer code RADMC-3D, 1 following the same methodologies as utilized by Suh & Kwon (2013a) and Suh (2015, 2020), is employed. Refer to Suh (2020) for details about the theoretical models and their limitations.
Table 4 details the parameters for seven models representing typical CAGB stars and six models representing typical OAGB stars. We assume a continuous power-law (ρ ∝ r−2) dust density distribution with a dust formation temperature (Tc ) of 1000 K. The inner radius of the dust shell is determined by Tc , and the outer radius is set at the point where the dust temperature reaches 30 K. Spherical dust grains with a uniform radius of 0.1 μm are assumed. The dust optical depth (τ10) is taken at 10 μm as the fiducial wavelength. We assume a stellar blackbody temperature (T*) in the range 2000–3000 K and a stellar luminosity (L*) in the range 1 × 10³–2 × 10⁴ L⊙.
Table 4. Models for Typical AGB Stars
| Model | Class | Dust a | τ10 | T* | L* |
|---|---|---|---|---|---|
| (K) | (103 L⊙) | ||||
| LM1 | OAGB | silicate | 0.001 | 3000 | 1 |
| LM2 | OAGB | silicate | 0.01 | 3000 | 2 |
| LM3 | OAGB | silicate | 0.1 | 3000 | 3 |
| CA1 | CAGB | AMC | 0.0001 | 3000 | 5 |
| CA2 | CAGB | AMC | 0.01 | 2700 | 5 |
| CA3 | CAGB | AMC | 0.1 | 2500 | 5 |
| CA4 | CAGB | AMC | 0.5 | 2500 | 7 |
| CA5 | CAGB | AMC | 1 | 2200 | 8 |
| CA6 | CAGB | AMC | 2 | 2000 | 10 |
| CA7 | CAGB | AMC | 4 | 2000 | 10 |
| HM4 | OAGB | silicate | 7 | 2000 | 10 |
| HM5 | OAGB | silicate | 15 | 2000 | 20 |
| HM6 | OAGB | silicate | 30 | 2000 | 20 |
Note.
a See Section 4 for details. For all models, Tc = 1000 K.Download table as: ASCIITypeset image
For OAGB stars, we use optical constants of warm and cold silicate dust from Suh (1999). We use warm silicate for OAGB stars with thin dust shells (three models with τ10 ≤ 3) and cold silicate for OAGB stars with thick dust shells (three models τ10 > 3).
For CAGB stars, the optical constants of AMC and SiC dust grains are sourced from Suh (2000) and Pégourié (1988), respectively. Additionally, for MgS dust, we utilize the optical constants of Mg0.9Fe0.1S, a composition close to pure MgS, as provided by Begemann et al. (1994). We adopt three distinct dust opacity models: a simple mixture of AMC and Mg0.9Fe0.1S (30% by mass), a simple mixture of AMC and SiC (30% by mass), and pure AMC.
5. CAGB Stars in Our Galaxy
We have selected CAGB stars from the sample of carbon stars spanning various subclasses (see Section 3). In this section, we compare observed SEDs of the CAGB stars with theoretical models (see Section 4) and explore the properties of CAGB stars in depth.
5.1. Model SEDs for CAGB Stars
From the sample of 4909 CAGB stars with IRAS counterparts (referred to as CAGB_IC objects; see Table 1), we have selected a subset comprising 152 relatively well-known CAGB objects (e.g., Suh 2000; Groenewegen et al. 2002; Chen & Yang 2012; Groenewegen 2022). Within this subset, encompassing 51 visual-CAGB_IC objects characterized by thin dust shells (τ10 < 0.5) and 101 IR-CAGB_IC objects featuring thick dust shells (τ10 ≥ 0.5), we have meticulously computed detailed theoretical model SEDs (see Section 4) that demonstrate a commendable ability to replicate the observations.
The photometric data utilized for this analysis encompass observations from IRAS, AKARI, MSX, 2MASS, WISE, and Gaia DR3. Submillimeter observational data from the James Clerk Maxwell Telescope (Groenewegen et al. 1993) are also incorporated where available. And IR spectral data from IRAS LRS (Kwok et al. 1997) and ISO SWS (Sloan et al. 2003) are used when accessible.
It is important to note that the theoretical dust shell model used in this work does not consider gas-phase radiation processes (see Section 4). Consequently, the CAGB model SEDs may not accurately reproduce observed SEDs in the visual and NIR bands in detail. In many cases, distinguishing whether the extinction (or emission) in the visual and NIR bands is of circumstellar or interstellar origin proves challenging. Therefore, Galactic extinction is not considered in SED plots.
Figures 9 and 10 showcase the SEDs for 16 selected objects from the CAGB star sample. These are juxtaposed with theoretical model SEDs arranged in ascending order of dust optical depths (τ10). τ10 is indicated in the lower right corner of the respective SED diagram. The theoretical models employ a simple mixture of AMC and SiC (20%–30% by mass) as well as pure AMC for dust (refer to Section 4). Specifically, Figure 7 displays SEDs of eight visual CAGB stars (chosen from 51 visual-CAGB_IC objects with τ10 < 0.5). On the other hand, Figure 8 illustrates SEDs of eight IR CAGB stars (selected from 101 IR-CAGB_IC objects with τ10 ≥ 0.5).

Figure 9. Observed SEDs compared with simple dust shell models: eight visual CAGB stars (visual-CAGB_IC). See Section 5.1.
Download figure:
Standard image High-resolution image
Figure 10. Observed SEDs compared with simple dust shell models: eight IR CAGB stars (IR-CAGB_IC). See Section 5.1.
Download figure:
Standard image High-resolution imageFor objects with available ISO SWS spectra (Sloan et al. 2003), the target dedicated time number is indicated in parenthesis next to each object's name. Moreover, for objects identified as Mira variables by AAVSO, it is explicitly mentioned that they are Miras, and the pulsation period is given in parenthesis.
For the 152 selected CAGB stars, a simple single dust shell model incorporating AMC and SiC dust effectively reproduces the observed SEDs for the majority of objects. However, some objects necessitate more complex models, such as detached or double shells, or nonspherical dust envelopes (refer to Section 5.2).
5.2. Objects That Show Complex SEDs
Among the 152 CAGB stars whose detailed SEDs are compared with theoretical models (see Section 5.1), 12 stars exhibit complex SEDs that may necessitate more sophisticated models, including detached or multiple shells or nonspherical dust envelopes.
Figure 11 showcases the SEDs for six objects selected from the aforementioned 12 stars, for which relatively simple detached or double dust shell models can provide a rough reproduction of the SEDs. In the top panels, for the two displayed objects, we employ detached (Tc = 130 K) silicate dust shells to reproduce the excessive emission at 30–200 μm. For the next four objects displayed in the middle and bottom panels, we utilize double shell models: AMC dust shell and detached (Tc = 80–116 K) silicate dust shell, replicating the excessive emission at 30–200 μm as well as in other wavelength bands. However, achieving a more detailed replication would necessitate more advanced models, such as those incorporating multiple nonspherical dust envelopes. Exploring such intricacies is beyond the scope of this work.

Figure 11. Observed SEDs compared with more complex models (detached or double dust shell models): two CAGB stars in the upper panels with detached (O-rich) dust shell models and four other CAGB stars with double (C-rich and O-rich) dust shell models. See Section 5.2.
Download figure:
Standard image High-resolution imageIn Section 3.1, we discussed visual carbon stars (objects in region R4 on the IRAS 2CD; see Figure 1) that exhibit excessive flux at 60 μm due to remnants from an earlier phase when the stars were OAGB stars. This suggests the existence of CAGB stars with detached silicate dust shells, which potentially do not display silicate dust features due to significant detachments. These objects may share characteristics with single-star-type silicate carbon stars that do exhibit silicate dust features (Kwon & Suh 2014), although it is worth noting that most known silicate carbon stars are believed to be binary systems.
5.3. Distances Obtained from CAGB Model SEDs
When comparing the observed SED with the corresponding theoretical model SED for CAGB stars, we can determine the distance that best fits the observed SED. The theoretical distance for each object is indicated in the lower right corner of the respective SED diagrams in Figures 9–11. Subsequently, these theoretical distances can be compared with the observed distances obtained from Gaia DR3 (Bailer-Jones et al. 2021).
Out of 4909 CAGB_IC objects, distances for 4839 objects are available from observations (4834 from Gaia DR3 and five objects from Hipparcos), and distances for 152 objects are determined using theoretical model SEDs. Among the 152 objects with theoretical distances, 82 objects have both theoretical and observed distances (80 from Gaia and two from Hipparcos), while 70 objects have only the distance derived from model SEDs.
In Figure 12, a comparison is presented between distances obtained from observations and those obtained from theoretical model SEDs for the 82 objects with both sets of distances. The diagram reveals a notably strong correlation: the coefficients of determination (R2) is larger than 0.79, indicating the reliability of the theoretical models.

Figure 12. Comparison of distances obtained from observations (Gaia DR3 and Hipparcos) and the ones obtained from theoretical model SEDs (see Section 5.3).
Download figure:
Standard image High-resolution imageTherefore, we employed the mean values of distances obtained from observations (Gaia DR3 or Hipparcos) and distances derived from model SEDs for the 82 objects possessing both sets of distances. For the remaining 70 objects lacking observed distances, we utilized the distances derived from model SEDs.
Out of the 2254 CAGB_NI objects, distances for all objects are accessible from Gaia DR3, and 117 Mira variables have been identified through AAVSO. Among these 117 Miras, the absolute magnitudes in the W3[12] band were found to be dimmer than −6 for three objects based on Gaia DR3 distances. Since Miras can be considered as AGB stars, we compared the observed SEDs with the CAGB model SEDs, despite their simplicity due to fewer observed points.
Our analysis revealed that Gaia DR3 distances for the three Miras were underestimated compared to the distances obtained from the CAGB model SEDs. Utilizing the mean values of distances from Gaia DR3 and theoretical model distances, the absolute magnitudes for the three Mira variables became brighter than −6. Consequently, we have chosen to use the mean distances for these three Mira variables.
6. Spatial Distribution of Carbon Stars
Figure 13 illustrates the spatial distributions of carbon stars in Galactic coordinates. Notably, we observe a higher concentration of CAGB stars toward the Galactic plane than for most extrinsic carbon stars (only CAGB stars, CH stars, and dC stars are depicted in this diagram).

Figure 13. Spatial distributions of AGB stars (CAGB_IC and CAGB_NI) in Galactic coordinates.
Download figure:
Standard image High-resolution imageIn Figure 14, the number distributions of Galactic latitudes and distances from the Galactic plane are presented for various subclasses of carbon stars. Mean values and standard deviations are provided alongside each subclass name. Once again, our analysis reveals that CAGB stars exhibit a pronounced concentration toward the Galactic plane compared to the majority of extrinsic carbon stars.

Figure 14. Distances from the Galactic plane for various subclasses of carbon stars (see Section 6).
Download figure:
Standard image High-resolution imageAs previously discussed in Section 1, CH stars are regarded as the older, metal-poor analogs to Ba stars (Escorza et al. 2017). The histograms presented in the lower panels of Figure 14 illustrate the distribution of distances from the Galactic plane for both Ba stars and CH stars. It is evident that the distances for CH stars are notably greater than those for Ba stars, providing clear confirmation that CH stars indeed serve as older, metal-poor analogs to Ba stars.
7. Infrared Properties of Pulsating Variables
Most AGB stars are commonly considered to be LPVs featuring outer dust envelopes (e.g., Suh 2021). LPVs are categorized into small-amplitude red giants (SARGs), semiregular variables (SRVs), and Mira variables (e.g., Soszyński et al. 2013). While majority of SRVs and a significant proportion of SARGs may also be in the AGB phase, it is established that all Mira variables are in the AGB phase (e.g., Höfner & Olofsson 2018).
The consensus in the scientific community holds that more evolved (or more massive) AGB stars tend to display larger pulsation amplitudes, longer pulsation periods, and higher mass-loss rates (De Beck et al. 2010; Suh & Kwon 2013b; Groenewegen 2022).
7.1. Period–Color and Period–Magnitude Relations
Within the sample of 7163 CAGB stars (4909 CAGB_IC and 2254 CAGB_NI objects; see Section 2), 1154 Mira variables have been identified through AAVSO. Additionally, among the 7470 candidate objects for new CAGB stars, identified solely from Gaia DR3 spectra and absolute magnitudes (GC-CAGB_NI objects), 597 Miras have been identified through AAVSO.
The left panels of Figure 15 depict period–color relations for the Mira variables. The plot illustrates the K[2.2]–W3[12] color versus pulsation periods for CAGB stars. Despite noticeable scatter, a meaningful relationship between IR color and pulsation period is discernible among Mira variables.

Figure 15. Period–color and period–magnitude relations for Mira variables in the CAGB sample. For each subclass, the number of objects is shown. The number in parenthesis denotes the number of objects plotted with good-quality observed data. See Section 7.1.
Download figure:
Standard image High-resolution imageOn the right panels of Figure 15, period–magnitude relations (PMRs) for the Mira variables are presented. The plot illustrates M (W3[12]) versus pulsation period for CAGB stars. The primary cause of the scatter appears to be uncertainties in distances.
In contrast to Miras in our Galaxy, those in the Magellanic Clouds exhibit robust linear-like PMRs with minimal scatter when the wavelength exceeds about 3 μm (Suh 2020). The study finds that Mira variables in the Magellanic Clouds demonstrate relatively large coefficients of determination (R2 = 0.6–0.85) in the linear relationship across wavelength bands in the range 3–24 μm. This phenomenon is attributed to the objects being at similar distances and experiencing less extinction.
7.2. Finding IR Variations of CAGB Stars from WISE Data
Suh (2021) investigated the variability of AGB stars in the W1[3.4] and W2[4.6] bands using WISE data. Additionally, Groenewegen (2022) studied the variation of a sample of AGB stars in our Galaxy and the Magellanic Clouds using WISE data. This paper further explores the variability of carbon stars with a new sample of stars and updated NEOWISE-R data.
Our focus is on all known extrinsic carbon stars (refer to Tables 1 and 2) and 7163 CAGB stars (CAGB_IC and CAGB_NI objects, excluding GC-AGB_NI objects). We investigate their variability in the W1[3.4] and W2[4.6] bands over the past 14 years. For this analysis, we use the AllWISE multiepoch photometry table acquired in 2009–2010 and the NEOWISE-R data (the 2023 data release), providing 18 epochs with two observations annually between 2014 and 2022.
Our analysis aims to identify Mira-like variations in the WISE light curves using a simple sinusoidal light-curve model. The Lomb–Scargle periodogram, a widely used statistical algorithm for detecting periodic signals (Zechmeister & Kürster 2009; VanderPlas 2018), is employed. The periodograms are computed using the AstroPy implementation. Additional details about the algorithm can be found in VanderPlas (2018) and Suh (2021).
For all the sample stars, we generated light curves using WISE data and produced Lomb–Scargle periodograms. As emphasized by Suh (2021), WISE data for a substantial proportion of AGB stars in our Galaxy, primarily bright stars, are either saturated or exhibit significant scatter, rendering variation parameters unreliable. To ensure robust results, we selected objects with over 200 observed points, R2 larger than 0.6, and Lomb–Scargle power exceeding 0.6.
Only for 227 objects are pulsation parameters reliably obtained from WISE light curves. As anticipated, no extrinsic carbon stars exhibit Mira-like variations in the WISE light curves. All 227 objects are identified as CAGB stars, comprising 129 CAGB_IC objects and 98 CAGB_NI objects. Among these CAGB stars, 87 are recognized AAVSO Mira variables with identified periods; the remaining 140 objects are not identified as Mira variables by AAVSO.
In the left panels of Figure 16, we present PMRs for known Mira variables from AAVSO and the 227 objects with obtained pulsation periods from WISE data. PMRs derived from WISE light curves exhibit significantly larger scatter than those obtained from AAVSO data.

Figure 16. Period–magnitude relations for Mira variables and candidates for Mira variables found from WISE data. See Sections 7.2 and 7.3.
Download figure:
Standard image High-resolution imageThe upper two panels of Figure 17 display Lomb–Scargle periodograms using OGLE4 light curves in the I (0.8 μm) band (Iwanek et al. 2022) and WISE light curves in the W2[4.6] band (this work) for two CAGB stars, namely Mira variables IRAS 18010–2626 and [M2003b] dj10, according to AAVSO. While the light curves in the I (0.8 μm) and W2[4.6] bands share similar characteristics, the W2[4.6] band shows a smaller amplitude. In contrast to the OGLE4 periodogram, the Lomb–Scargle periodogram from the WISE light curve exhibits multiple peaks with similar power values due to the regular interval of WISE data acquisition (every 6 months).

Figure 17. Lomb–Scargle periodograms for six CAGB stars with known periods (AAVSO Miras). The top panels display OGLE4 (I-band) light curves for two selected CAGB stars. Subsequently, the following six panels present WISE light curves for all six CAGB stars. The corresponding AAVSO periods for these six CAGB stars are 413, 365, 1060, 445, 442, and 302 days. See Sections 7.2 and 7.3.
Download figure:
Standard image High-resolution imageDue to the existence of multiple peaks with similar Lomb–Scargle power values, the precise determination of periods using only WISE data is challenging. As emphasized by Suh (2021), secondary or tertiary periods might represent the true periodicity for specific objects, potentially overshadowing the primary period.
7.3. Candidates for New Mira Variables Found from WISE Data
In the right panels of Figure 16, we again present the PMRs, but for those 227 objects based on WISE light curves, we prioritize secondary (or tertiary) periods for 44 objects (red symbols) that deviate significantly from the general trends of Miras. The revised PMRs based on WISE light curves display considerably less scatter. Out of the 227 CAGB stars with pulsation periods determined from WISE light curves, 140 objects (lime symbols) are not identified as Mira variables by AAVSO.
Figure 17 presents Lomb–Scargle periodograms for six selected CAGB stars from the group of 87 objects identified as Mira variables by AAVSO. The obtained pulsation periods from WISE data are similar to the periods from AAVSO.
Figure 18 showcases Lomb–Scargle periodograms for eight selected CAGB stars from the group of 140 objects not identified as Mira variables by AAVSO. It is important to note that for the last two objects, the secondary period was selected. These 140 objects could potentially be candidates for newly discovered Mira variables.

Figure 18. Lomb–Scargle periodograms using WISE light curves for eight CAGB stars with unknown periods (AAVSO). They could be candidates for new Mira variables. Note that the secondary period was used for the last two objects. See Section 7.3.
Download figure:
Standard image High-resolution image
8. A New Catalog of CAGB Stars in Our Galaxy
In this study, we have assembled a novel sample of CAGB stars drawn from known carbon stars and explored various properties associated with them. We introduce a new catalog comprising 7163 CAGB stars (4909 CAGB_IC and 2254 CAGB_NI objects; see Tables 1 and 2) in our Galaxy.
For the 4909 CAGB_IC objects (see Table 1), Table 5 lists the CAGB_IC number, IRAS identifier, CDS SIMBAD main identifier, Gaia identifier, position (R.A. and decl. J2000), source of the position (SP), AllWISE identifier, variable type from AAVSO, period (in days) from AAVSO, period (in days) from WISE data (see Section 7.2), distance in parsecs (dist_pc), and source of the distance (SD). The sources of the position are categorized into two groups: (1) G3: Gaia DR3, (2) AP: Akari PSC.
Table 5. CAGB_IC Objects a (13 Columns, 4909 Rows)
| No. | IRAS | SIMBAD_id | Gaia_id | R.A. | Decl. | SP b | AllWISE_id | A_Type | A_Period | WISE_period | dist_pc | SD c |
|---|---|---|---|---|---|---|---|---|---|---|---|---|
| 1 | 19118+1020 | IRAS 19118+1020 | DR3 4309357708491415552 | 288.54703101 | 10.43097188 | G3 | J191411.33+102551.5 | ⋯ | ⋯ | ⋯ | 3911.8 | G |
| 2 | 21458+4539 | Case 662 | DR3 1974364515721462656 | 326.93394427 | 45.89813167 | G3 | J214744.15+455353.1 | SRA | 514.0 | ⋯ | 2101.7 | G |
| 3 | 21458+5244 | [ABC90] cyc 27 | DR3 2173236138784903296 | 326.89962901 | 52.97894764 | G3 | J214735.90+525844.1 | SR | 386.0 | ⋯ | 5046.6 | G |
| 4 | 00533+5503 | IRAS 00533+5503 | DR3 423450072786302208 | 14.05721350 | 55.33304974 | G3 | J005613.76+551958.9 | M | 344.5 | ⋯ | 8051.5 | G |
| 5 | 00535+5923 | V* V721 Cas | DR3 426094260814792576 | 14.13762143 | 59.66223355 | G3 | J005633.03+593943.9 | M | 585.9 | ⋯ | 2769.3 | G |
| 6 | 00538+6410 | V* V881 Cas | DR3 524221378626364160 | 14.23383979 | 64.45034263 | G3 | J005656.16+642701.2 | SR: | ⋯ | ⋯ | 5456.5 | G |
| 7 | 00539+5621 | IRAS 00539+5621 | DR3 423994365404423040 | 14.22248683 | 56.62959076 | G3 | J005653.41+563746.1 | SR | 306.0 | ⋯ | 4954.7 | G |
| 8 | 17552-2814 | PN H 1-45 | DR3 4062646712567004416 | 269.59108375 | −28.24784676 | G3 | J175821.90-281452.7 | ZAND+M | 416.2 | ⋯ | 1770.1 | G |
| 9 | 13078-5828 | IRAS 13078-5828 | DR3 6062228557472426880 | 197.72661782 | −58.74670061 | G3 | J131054.41-584447.8 | M | 444.3 | 460.3 | 8262.7 | G |
| 10 | 13078-6012 | IRAS 13078-6012 | DR3 6055840669782220544 | 197.75262618 | −60.47458390 | G3 | J131100.64-602828.2 | M | 433.9 | ⋯ | 8036.3 | G |
| 11 | 06344-1656 | V* V368 CMa | DR3 2946796410619430144 | 99.16446215 | −16.99285239 | G3 | J063639.49-165934.1 | SRB | 194.0 | ⋯ | 4091.6 | G |
| 12 | 06344-0124 | IRAS 06344-0124 | ⋯ | 99.25662000 | −1.45002000 | AP | J063701.62-012701.7 | ⋯ | ⋯ | 839.8 | 4000.0 | S |
| 13 | 06347-1203 | IRC -10133 | DR3 2953571120234692736 | 99.26478306 | −12.09544908 | G3 | J063703.56-120543.5 | MISC | 160.0 | ⋯ | 1574.7 | G |
| 14 | 06348+3114 | IRAS 06348+3114 | DR3 3435862859142788352 | 99.52239512 | 31.19535495 | G3 | J063805.33+311143.6 | L | ⋯ | ⋯ | 2212.8 | G |
| 15 | 06349+2250 | C* 3277 | DR3 3379346655806590208 | 99.49454391 | 22.80064937 | G3 | J063758.71+224802.3 | LB | 172.5 | ⋯ | 3033.4 | G |
| 16 | 20176-1458 | IRAS 20176-1458 | DR3 6875984878440208512 | 305.11527656 | −14.82426347 | G3 | J202027.67-144926.9 | SR | 354.0 | 374.2 | 13,527.4 | GS |
| 17 | 05185+0718 | LEE 18 | DR3 3241334169578902656 | 80.30572294 | 7.35537774 | G3 | J052113.38+072119.4 | SRB | 277.2 | ⋯ | 957.1 | G |
| 18 | 05186+1551 | IRAS 05186+1551 | DR3 3394034241365927936 | 80.36858711 | 15.90941185 | G3 | J052128.46+155433.8 | M | 298.7 | ⋯ | 9326.0 | G |
| 19 | 19122+1830 | Case 185 | DR3 4516021020719021440 | 288.60342816 | 18.59832942 | G3 | ⋯ | MISC | 215.0 | ⋯ | 2152.6 | G |
| 20 | 19122+2318 | IRAS 19122+2318 | DR3 2022495667287340800 | 288.59025215 | 23.39755057 | G3 | ⋯ | SR | 176.0 | ⋯ | 2414.6 | G |
| 21 | 21468+5747 | V* V493 Cep | DR3 2202334748365238144 | 327.10479972 | 58.01428062 | G3 | J214825.15+580051.2 | SRB | 390.0 | ⋯ | 6170.8 | G |
Notes.
a See Table 1 and Section 8. b The source of the position: (1) G3: Gaia DR3, (2) AP: Akari PSC. c The source of the distance: (1) G: Gaia DR3, (2) GS: Gaia DR3 and model SED (mean value), (3) H: Hipparcos, (4) HS: Hipparcos and CAGB model SED (mean value), (5) S: model SED.Only a portion of this table is shown here to demonstrate its form and content. A machine-readable version of the full table is available.
Download table as: DataTypeset image
For the 2254 CAGB_NI objects (see Table 2), Table 6 lists the CAGB_NI number, CDS SIMBAD main identifier, Gaia identifier, position (R.A. and decl. J2000 from Gaia DR3), AllWISE identifier, variable type from AAVSO, period (in days) from AAVSO, period (in days) from WISE data (see Section 7.2), distance in parsecs (dist_pc), and source of the distance (SD).
Table 6. CAGB_NI Objects a (11 Columns, 2254 Rows)
| No. | SIMBAD_id | Gaia_id | R.A. | Decl. | AllWISE_id | A_Type | A_Period | WISE_period | dist_pc | SD b |
|---|---|---|---|---|---|---|---|---|---|---|
| 1 | KisoC1-38 | DR3 432154116070047232 | 0.37424664 | 64.91885902 | J000129.81+645507.8 | SR | 253.6 | ⋯ | 8629.5 | G |
| 2 | [TI98] 0000+3021 | DR3 2861332746177405696 | 0.75359455 | 30.63984305 | J000300.86+303823.4 | M | 253.2 | ⋯ | 11,740.0 | G |
| 3 | NIKC 1-28 | DR3 423280885436848128 | 0.92486743 | 59.73694096 | J000341.96+594413.0 | M | 259.0 | 246.3 | 4809.5 | G |
| 4 | KisoC1-46 | DR3 432237129193547392 | 1.43538322 | 65.51587342 | J000544.48+653057.1 | SR | 121.6 | ⋯ | 4350.8 | G |
| 5 | KisoC1-47 | DR3 423227524761428480 | 1.43800744 | 59.49667112 | J000545.12+592948.0 | SR | 274.4 | ⋯ | 5385.3 | G |
| 6 | CGCS 11 | DR3 432115255205278208 | 2.29989983 | 65.02399643 | J000911.97+650126.3 | ⋯ | ⋯ | ⋯ | 6730.9 | G |
| 7 | KisoC1-53 | DR3 431355664475998976 | 2.89769938 | 63.30855466 | J001135.45+631830.8 | SR | 310.7 | ⋯ | 5892.5 | G |
| 8 | [I81] C 3 | DR3 429650768615042560 | 3.01956677 | 61.54713277 | J001204.70+613249.6 | SR | 192.3 | ⋯ | 5332.3 | G |
| 9 | [I81] C 5 | DR3 431338617735738240 | 3.31931379 | 63.03340946 | J001316.63+630200.3 | SR | 255.5 | ⋯ | 5554.2 | G |
| 10 | BC 110 | DR3 528876019357498112 | 3.44344370 | 68.29170688 | J001346.40+681730.2 | SR: | 130.0 | ⋯ | 4655.8 | G |
| 11 | [I81] C 4 | DR3 429556004454036480 | 3.62955399 | 60.92529709 | J001431.09+605531.0 | SR | 152.9 | ⋯ | 8384.2 | G |
| 12 | [I81] M 67 | DR3 429135887932964992 | 3.77838467 | 60.14894424 | J001506.82+600856.1 | LPV | 278.0 | ⋯ | 5998.7 | G |
| 13 | KisoC1-65 | DR3 431374871565656320 | 4.46342775 | 63.06836065 | J001751.22+630406.1 | SR | 103.9 | ⋯ | 6861.2 | G |
| 14 | CGCS 38 | DR3 430469973497669632 | 5.02739175 | 61.98879143 | J002006.57+615919.6 | SR | 209.4 | ⋯ | 8237.9 | G |
| 15 | KisoC1-70 | DR3 431035294271577088 | 5.50380093 | 63.49398185 | J002200.91+632938.3 | ⋯ | ⋯ | ⋯ | 4568.3 | G |
| 16 | KisoC1-75 | DR3 430400498104743808 | 6.02907819 | 61.70314714 | J002406.97+614211.3 | SR | 364.3 | ⋯ | 5600.7 | G |
| 17 | BC 79 | DR3 421752628690357632 | 6.07930817 | 56.88220974 | J002419.04+565255.9 | L | ⋯ | ⋯ | 7893.4 | G |
| 18 | KisoC1-78 | DR3 431011345534262784 | 6.16820049 | 63.23646455 | J002440.36+631411.2 | SR | 55.6 | ⋯ | 6756.6 | G |
| 19 | KisoC1-81 | DR3 428878499133379840 | 6.59766229 | 61.30082116 | J002623.44+611803.0 | SR | 153.0 | ⋯ | 7797.5 | G |
| 20 | C* 3222 | DR3 2793301598079856512 | 6.72477116 | 17.55777751 | J002653.94+173328.0 | LB | ⋯ | ⋯ | 7080.7 | G |
| 21 | KisoC1-83 | DR3 527881893347020672 | 6.84269872 | 66.76993732 | J002722.25+664611.8 | SR | 269.5 | ⋯ | 7180.3 | G |
Notes.
a See Table 2 and Section 8. b The source of the distance: (1) G: Gaia DR3, (2) GS: Gaia DR3 and model SED (mean value).Only a portion of this table is shown here to demonstrate its form and content. A machine-readable version of the full table is available.
Download table as: DataTypeset image
The source of the distance information (SD; see Section 5.3) in Tables 5 and 6 is categorized into five groups: (1) G: Gaia DR3, (2) GS: Gaia DR3 and CAGB model SED (mean value), (3) H: Hipparcos, (4) HS: Hipparcos and CAGB model SED (mean value), (5) S: CAGB model SED.
In Tables 5 and 6, only 21 rows of the catalogs are shown. The full catalogs are available in machine-readable format.
9. Summary
We have made an in-depth investigation into the infrared properties of carbon stars within our Galaxy, employing a comprehensive analysis of observational data across visual and IR bands. Utilizing data sets from IRAS, Akari, MSX, 2MASS, WISE, and Gaia DR3, we conducted an extensive comparison between observational data and theoretical models. The comparison involve the use of various 2CDs, CMDs, and SEDs.
We have found that the CMDs, which utilize the latest distance and extinction data from Gaia DR3 for a substantial number of carbon stars, are very useful for distinguishing CAGB stars from extrinsic carbon stars that are not in the AGB phase. In the case of all CAGB stars, the absolute magnitudes in the IR[12] or W3[12] bands are brighter than −6. In contrast, extrinsic carbon stars of Ba, CH, dC, and RH types are notably distinguishable from CAGB stars on various CMDs, displaying dimmer absolute magnitudes in the MIR bands. However, J-type stars, constituting another subclass of extrinsic carbon stars, demonstrate properties shared with both CAGB stars and other extrinsic carbon stars.
We have performed radiative transfer model calculations for CAGB stars, exploring various parameters of central stars and spherically symmetric dust shells. A comprehensive comparison of theoretical models with observations on various IR 2CDs, CMDs, and SEDs reveals a notable agreement.
For selected CAGB stars, the observed SEDs are compared with theoretical models, with a simple single dust shell model of AMC and SiC dust reproducing SEDs effectively for most objects. Some objects require more complex models, such as detached or double shells or nonspherical dust envelopes.
We have established theoretical distances for 152 CAGB stars, optimizing the fit to the observed SED by comparing it with the corresponding CAGB model SED. A comparison between distances derived from observations and those obtained from theoretical model SEDs reveals a significantly strong correlation, affirming the reliability of the theoretical models.
We have studied the IR properties of known variable stars, revealing that for Mira variables, IR colors intensify in reddish hues, and absolute magnitudes brighten with longer pulsation periods. Furthermore, we investigated the IR variability of carbon stars by analyzing WISE photometric data spanning the last 14 years. Through a detailed examination of WISE light curves for all sampled stars, we have identified useful variation parameters for 227 CAGB stars.
We have presented a novel catalog of CAGB stars, offering enhanced reliability and a wealth of additional information, including distances obtained from Gaia DR3 and model SEDs, and variational parameters from AAVSO and WISE light curves. We have identified CAGB stars from a substantial sample of carbon stars spanning various subclasses, leveraging information from diverse literature sources and the SIMBAD database, and examining their IR properties through 2CDs, CMDs, SEDs, and variations. The resulting catalog introduces 7163 CAGB stars, categorized as 4909 CAGB_IC and 2254 CAGB_NI objects within our Galaxy.
Acknowledgments
I thank the anonymous referee for constructive comments and suggestions. This work was supported by a funding for the academic research program of Chungbuk National University in 2023. This research was supported by Basic Science Research Program through the National Research Foundation of Korea (NRF) funded by the Ministry of Education (2022R1I1A3055131). This research has made use of the SIMBAD database and VizieR catalog access tool, operated at CDS, Strasbourg, France. This research has made use of the NASA/IPAC Infrared Science Archive, which is operated by the Jet Propulsion Laboratory, California Institute of Technology, under contract with the National Aeronautics and Space Administration.