


Abstract
The detection of a gravitational-wave signal and subsequent electromagnetic transient from a neutron star merger in 2017 is consistent with expectations of neutron star mergers as an r-process element production site. Within the first few days post-merger, the kilonova spectra are consistent with a blackbody illuminating a mix of heavy, r-process elements. With increasing time, the kilonova transitions to the non-LTE regime where the level populations and ionization balance are determined by both collisional and photoprocesses. Detailed cross section data for electron-impact processes involving the relevant species are often not available. In such circumstances, it is reasonable to use approximate methods as baseline data for use in spectral modeling, and it is useful to evaluate the accuracy of such methods against more sophisticated collision calculations when possible. We describe new calculations of the electron-impact excitation cross sections of Pt i–iIi using the DARC R-matrix codes. Using collisional-radiative models, we show that, at plasma conditions expected in kilonovae, the expressions of van Regemorter and Axelrod are insufficient for producing electron-impact excitation data for complex, heavy species such as the low charge states of Pt. Through comparisons with data generated with the relativistic distorted wave approach, as implemented in the Flexible Atomic Code, we show the distorted wave method produces cross section data that, when incorporated into spectral models, predicts strong spectral feature distributions similar in intensity to those from models built on data computed with the R-matrix approach for the considered ions and plasma conditions.
Export citation and abstract BibTeX RIS

Original content from this work may be used under the terms of the Creative Commons Attribution 4.0 licence. Any further distribution of this work must maintain attribution to the author(s) and the title of the work, journal citation and DOI.
1. Introduction
Ejected neutron-rich material from binary neutron-star mergers (NSMs) has long been proposed as a site of rapid neutron capture (r-process) nucleosynthesis (Burbidge et al. 1957). A gravitational-wave (GW) signal from a binary NSM, GW170817, was realized by the LIGO/VIRGO collaboration in 2017 (Abbott et al. 2017). This GW signal prompted follow-up observations across the entire electromagnetic spectrum to localize the position of the event (see Table 1 of Abbott et al. 2017), and observe the time-evolving spectral signatures. At early times (∼days) post-merger, the spectra are consistent with a thermal blackbody impinging on a mix of heavy, likely r-process rich material. The strengths of absorption features in this quasi-blackbody spectrum are determined by the opacities and abundances of the ejecta material. Substantial computational efforts have been made to provide these opacities from large-scale structure calculations (see for example the works of Fontes et al. 2020; Tanaka et al. 2020; Taghadomi et al. 2022 and references therein, including the recent LANL-NIST opacity database; Olsen et al. 2021).
To date, spectral features of Sr (Z = 39) have been identified by multiple independent analyses of the spectra in the first few days post-merger (Watson et al. 2019; Domoto et al. 2022; Gillanders et al. 2022; Perego et al. 2022), along with possible detections of Ce (Z = 58), La (Z = 57), and Zr (Z = 40)(Domoto et al. 2022; Gillanders et al. 2022). Searches for ions of gold and platinum were unsuccessful (Gillanders et al. 2022). As the ejecta expands, it is accompanied by a decrease in density and decoupling from the radiation field, driving the local conditions away from local thermodynamic equilibrium (LTE). Using the non-LTE (NLTE) supernovae modeling code SUMO (Jerkstrand et al. 2012), adapted for kilonovae, Pognan et al. (2022) showed that as soon as a few days post-merger the differences between LTE and NLTE opacities can approach several orders of magnitude, depending on the ion and energy levels. These changes are accompanied by the evolution from an absorption spectrum to an emission spectrum, marking the transition to the "nebular" phase (Hotokezaka et al. 2021).
From Spitzer infrared (IR) observations of the late-time remnant of GW170817 at +43 and +74 days post-merger, Kasliwal et al. (2022) inferred the presence of short-lived isotopes of some of the heaviest elements, e.g., the platinum group, lanthanides, and actinides. This late-time IR emission is possibly explained by one or more heavy elements with either low-energy allowed transitions or fine-structure transitions between low-lying metastable levels (Hotokezaka et al. 2022). Nd ii, for example, has 18 levels beneath 1 eV, which can be considered metastable, and many of the low-lying excited configurations in Nd ions can emit in the IR. Elements with open 5d shells, such as Os (Z = 76), lead to low-energy even-parity configurations of the form 5dN , 5d(N−1)6s, and 5d(N−2)6s2, from which the number of metastables can be exceptionally high, e.g., W iii with 71 metastable levels. For the open d-shell elements, these levels are typically low in energy (∼eV), efficiently populated in low temperature and/or density environments, and given their large lifetimes can act as additional sources of excited state populations. Laboratory studies of W i excitation and emission in NLTE plasmas (Johnson et al. 2020) showed that excitation from metastable levels can dwarf the direct excitation from the ground level. NLTE modeling of Au i by McCann et al. (2022) showed that even for electronically simple systems the metastable populations can be far from their LTE proportions at NSM-like conditions.
In the nebular phase, the conditions are insufficient to maintain LTE-like level populations. Consequently the ionization balance and level populations are instead determined by the competing ionization, recombination, and excitation processes, including both thermal (e.g., electron-impact excitation and/or ionization, recombination) and nonthermal processes, such as ionization by energetic electrons produced by β decays. Comprehensive and state-resolved cross section data for many of these processes are currently unknown for most if not all of the heavy elements potentially present in kilonovae.
Several efforts have explored NLTE kilonova models using either a single species with detailed atomic data inputs or broader models using empirical formulae to represent the necessary processes. Hotokezaka et al. (2021) explored a one-dimensional model comprised of Nd ii– iv with collision data calculated with HULLAC (Bar-Shalom et al. 2001), where Nd ii appeared foremost in the ionization balance across a wide range of ejecta conditions. Using a single-zone model composed of the first four ion stages of Te, Ce, Pt, and Th (with solar abundances), Pognan et al. (2021) explored both steady-state and time-dependent kilonovae models with a modified version of the supernovae code SUMO (Jerkstrand et al. 2012). Pognan et al. (2021) utilized collision strengths generated from the approximate formulae provided in van Regemorter (1962), Axelrod (1980), and empirical formulae to represent thermal and nonthermal processes (e.g., Lotz 1967; Shull & van Steenberg 1982). Notably, the doubly and triply ionized species such as Ce iii and Ce iv were most abundant. In both Pognan et al. (2021), Hotokezaka et al. (2021), the time-evolution of the thermodynamic properties depends strongly on both the bulk properties, that is, the elemental abundances and densities, and the microphysics, i.e., the many atomic parameters characterizing the relevant collisional processes.
It is now well established that, beyond a few days post-merger, the conditions in the kilonovae begin to depart from Saha equilibrium and LTE, and an NLTE treatment is required to understand its spectral evolution (Pognan et al. 2022). However, the data necessary to advance the accuracy and applicability of these NLTE models are largely absent. Though only one kilonova has been observed thus far, the next LIGO observing run (beginning 2023 March), and the success of the recently launched James Webb Space Telescope, suggests that multiple kilonovae may be observed in the coming years. Atomic data are critically needed to understand the NLTE collision dynamics of the heavy elements possibly formed in NSMs.
We report here the expansion of the work of McCann et al. (2022) to the low ion stages of platinum, Pt i–iii, where the successive openings of the 5d shell present a unique opportunity to further understand the role of metastable levels in low-electron-density environments. Furthermore, these calculations provide tests of the validity of widely used empirical expressions for characterizing electron-impact excitation, and perturbative distorted wave (DW) methods for providing the required atomic data for emerging data needs related to NLTE models of kilonovae.
This manuscript proceeds as follows. In Section 2, we detail our electronic structure calculations with GRASP0, which provide a foundation for subsequent R-matrix (RM) electron-impact excitation cross section calculations for Pt i–iii. We also report independent calculations of the atomic structures using the Flexible Atomic Code (FAC; Gu 2008), which form the basis of DW electron-impact excitation calculations. In Section 3, we describe our RM electron-impact excitation calculations, relativistic DW calculations, and compare these data against approximation formulae commonly used in literature when detailed excitation data are unavailable. In Section 4, we incorporate our electron impact data sets in collisional-radiative (CR) models of Pt i–iii using ColRadPy (Johnson et al. 2019), probe differences between LTE and NLTE spectral models of Pt i–iii, and investigate the astrophysical impacts of improved electron-impact excitation data. Conclusions are presented in Section 5.
2. Electronic Structure Calculations
To produce accurate sets of effective collision strengths (ECSs) used for CR and/or NLTE modeling of Pt i–iii, and to investigate the possible inaccuracies of these calculated data, we pursued multiple calculations of their atomic structures. First, we employ the relativistic atomic structure package GRASP0 (Parpia et al. 1996), which uses the Multi-Configurational Dirac Fock method, to generate optimized orbitals for Pt i–iii. These optimized orbitals are later used to describe each ion stage in a separate RM electron-impact excitation calculation (see Section 3). Given the computational resources required for the RM calculations, the number of included configurations in the GRASP0 calculations must be restricted to those required to accurately depict the electronic structures of the target(s). For Pt i–iii, the final GRASP0 calculations used 23, 19, and 12 electron configurations, yielding 2779, 5065, and 1639 levels, respectively. The configurations for each ion stage were chosen based on their proximity in energy to known energy levels, i.e., their expected propensity for mixing via configuration interaction (CI), and/or their possible resonances in the RM calculation. Lists of the included configurations for all present calculations are provided as supplementary files.
To test the accuracy of the GRASP0 calculations (which utilize a restricted configuration set), we employed the FAC (Gu 2008) to explore the effect of increasing numbers of configurations on the computed quantities. In the FAC, atomic state functions are variationally determined as linear combinations of configuration state functions in the presence of a model central potential. The parameters of the model potential are determined by minimizing the energy of a fictitious "mean configuration," typically the known ground configuration, although several configurations may be necessary for neutral and near-neutral systems (see discussion in McCann et al. 2022).
The FAC calculations were carried out as follows. Starting with the configuration sets used in the GRASP0 calculations, the configurations used to optimize the radial potential were varied to include one or more of the experimentally observed electronic configurations (with the exception of Pt i, discussed below), and the resulting energies and transition rates were compared to known data in the NIST ASD (Kramida et al. 2020) and the literature. For Pt i, a large number of mean configurations constructed in this way lead to an incorrect identification of the ground state in most cases, and failed to produce by over an order of magnitude the energies of the low-lying 5d96s and 5d86s2 levels around ∼0.1 eV. The greatest agreement between computed and known level energies was found by optimizing the central potential for a mean configuration generated from equal parts 5p65d96s, 5p55d106s, and 5p65d86s2, which was used in all subsequent Pt i calculations.
For Pt ii and Pt iii, the difficulties described above for Pt i were not found. Instead, we searched for the choice of configurations that yielded the greatest agreement between our calculations and the known energies of Pt ii (Blaise et al. 1992) and Pt iii (Ryabtsev et al. 1993). 3 The final choice of mean configurations was chosen as equal parts 5dN , 5dN−16s, and 5dN−26s6p for Pt ii (N = 9) and Pt iii (N = 8). In lists or descriptions of configurations, the closed shells are omitted for clarity. The calculations carried out in this manner are hereafter referred to as FAC (small scale).
To investigate the impact of our limited configuration set in the GRASP0 calculations on the energies and transition rates, we increased the configurations included in the FAC calculations in successive layers. The first CI layer consisted of the configurations 5dN + {5d, 6s, 6p, 6d, 5f, 6f} (with N = 9, 8, 7 for Pt i– iii, respectively), and each subsequent layer of CI was constructed by single or double promotion(s) out of these configurations up to n = 8, and ℓ = 4. 4 The test calculations with ℓ ≥ 5 states included showed little effect on both known energy levels and transition rates while increasing the computational demands substantially. The states with ℓ > 4 were thus excluded. In total, 122 configurations were used at the largest CI step. For Pt ii and Pt iii, the same configuration sets were used with the modification of 5d shell occupancy adjusted accordingly. This computational scheme yielded 82,571, 149,160, and 224,534 levels in the even parity and 76,996, 143,552, and 182,919 levels in the odd parity for Pt i–iii, respectively. The number of added configurations in each step is not of equal size or importance, although the relevant quantities are sufficiently converged by the final CI layer, showing differences ≪1% for energies and transition rates between the final two CI layers. Calculations carried out in this manner are hereafter referred to as FAC (large scale).
Comparisons of the computed level energies for Pt i–iii to the values in literature are presented in Figure 1. In the GRASP0 calculations, a total of 32, 40, and 153 levels were matched and shifted to literature energies for Pt i–iii, respectively. Matching between the computed and literature energy levels was aided by the jj2lsj code (Gaigalas et al. 2017). Literature energies were taken from the NIST Atomic Spectra Database (ASD; Kramida et al. 2020), where the majority of the levels are sourced from the experimental work of Blaise et al. (1992). Energy level and transition rate data for Pt iii were digitized from the tables of Ryabtsev et al. (1993). In the following comparisons, only levels and transition rates that were matched across all four data set are compared.

Figure 1. Percent difference of computed energy levels and values derived from experimental observations for Pt i (left), Pt ii (center), and Pt iii (right). Data are shown for GRASP0 (black ×), small-scale FAC calculations with the same GRASP0-equivalent configuration set (red □), and large-scale FAC calculations (blue □).(The data used to create this figure are available.)
Download figure:
Standard image High-resolution imageThe computed GRASP0 energy levels agree with those in literature within 11.2% ± 19.0%, 10.7% ± 6.5%, and 3.6% ± 1.0% for Pt i–iii, respectively. Uncertainties are stated at the 1σ level. Poorer agreement is found for the small-scale FAC calculations: 23.5% ± 53.4%, 12.5% ± 9.3%, and 3.6% ± 1.4%. The poor agreements for the small-scale FAC calculations of Pt i are largely driven by the choice of central potential, which was chosen to optimize the known transition rates and energies of the lowest-lying energy levels. The large-scale FAC calculations show improved agreement in the level energies with increased CI: 12.7% ± 20%, 8.6% ± 4.0%, and 0.9% ± 0.6%. Compared to GRASP0, the large-scale FAC calculations show worse agreement for Pt i, comparable agreement for Pt ii, and a factor of 4 improvement in the computed energies for Pt iii.
Comparisons of the computed versus literature transition rates for Pt i–iii are shown in Figure 2. We note again that only the transitions whose upper and lower levels were both matched to experimentally derived levels and shifted to those energies are shown. The solid and dashed lines in Figure 2 indicate perfect agreement, and agreement within a factor of 4, respectively. In Pt i, the GRASP0 data exhibit the greatest agreement with experimentally known transition rates, with 49% of the rates agreeing within a factor of 2, and 75% agreeing within a factor of 4. For the two FAC calculations using both small and large configuration sets, similar metrics show 34% of the transitions' rates agree within a factor of 2, and 76% agree within a factor of 4. For Pt ii, the GRASP0 calculations yield 39% of the sixty-seven compared rates within a factor of 2, and 85% within a factor of 4. The FAC calculations, on average, show slightly better agreement, ∼71% within a factor of 2, and 97% within a factor of 4. For the strongest lines of Pt ii, the GRASP0 and FAC calculations generally agree within 30%.
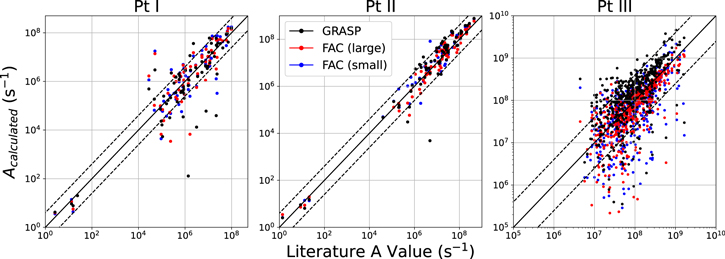
Figure 2. Comparisons of computed transition rates for Pt i (left), Pt ii (middle), and Pt iii (right) between the present calculations and literature values. Data are shown for GRASP0 (black), small-scale FAC (blue), and large-scale FAC calculations (red) described in text. Solid black lines indicate perfect agreement (y = x), and dashed bars indicate the regions of agreement within a factor of 4.(The data used to create this figure are available.)
Download figure:
Standard image High-resolution imageInterestingly, Pt iii shows larger scatter in the comparisons of individual rates, but statistically improved agreement across all calculations. In total for Pt iii, we compared transition rates for 468 transitions matched between the present calculations and those in Ryabtsev et al. (1993), from which the GRASP0 calculations recover 46% of the rates within a factor of 2 and a further 80% within a factor of 4. For the FAC calculations, the improvement with increasing configurations is minor, increasing from 72% within a factor of 2 (small-scale) to 80% (large-scale), and 80% within a factor of 4 to 85% within a factor of 4. We note again that these comparisons are made to transition rates reported in Ryabtsev et al. (1993), who used Cowan's suite of codes and a limited set of electronic configurations. In the present GRASP0 and FAC calculations, the odd-parity states are strongly mixed with (among others) the configuration 5d66s6p. Moreover, the level compositions of the odd-parity states reported in Ryabtsev et al. (1993) show a very high percent composition of 5d76p (∼92% on average). As such, it is difficult to assess the accuracy of either calculation. A more reliable metric is likely a comparison between all three present GRASP0 and FAC calculations. The median percent difference between the GRASP0 and small-scale FAC calculations using the same configuration set is 52%, increasing to 57.5% when comparing the GRASP0 and large-scale FAC calculations.
In total, comparisons between experimentally derived levels and transition rates and the present GRASP0 and FAC calculations show that the choice of configurations in the targeted GRASP0 calculations are suitable to describe the necessary atomic structures for subsequent electron-impact excitation calculations. From Figures 1–2, we find that the GRASP0 calculation outperforms the small-scale FAC calculation in producing energy levels and transition rates most similar to those derived from previous experimental studies. In some cases, e.g., the large-scale FAC calculations for Pt iii, the much greater number of configurations leads to improved agreement with experimental transition rates and energy levels. However, the improvements are minor, and are potentially offset by the increased computational costs. In all three ions, both the GRASP0 and small-scale FAC calculations produce similar atomic structures, lending confidence to their use in the subsequent RM and DW electron-impact excitation calculations.
3. Electron-impact Excitation
3.1. R-matrix Calculations
In a previous work, McCann et al. (2022), we utilized the RM approach to compute electron-impact excitation cross sections for Au i (Z = 79). We extend these calculations to platinum (Z = 78), using an approach similar to that in McCann et al. (2022). The details of RM theory are provided in Burke (2011), and we utilize here the parallel version of the Dirac atomic RM codes for the Dirac–Coulomb Hamiltonian case (Ballance 2020). A brief overview of the computational details are provided below.
For Pt i, the CI expansion has 2779 levels, 300 of which were included in the subsequent close-coupling expansion calculation. The scattering calculation is broken into two parts, one with partial waves J = 0.5–14.5, and a second set with J = 15.5–35.5, where each J value includes both parities. Higher partial waves with J ≥ 36.5 are accounted for with a top-up procedure as described in Burgess (1974), Burgess & Tully (1992). In the scattering calculation of Pt i, the basis size for the lower partial waves is 30, and 20 for the higher partial waves, resulting in a maximum of 1832 channels. For the two sets of partial waves, the final Hamiltonian dimensions are (57,379)2 and (36,640)2, respectively. To resolve the resonances at lower energies, the first set of partial waves is calculated on two grids: 0.0001–1.5 Ryd, with a spacing of 0.0001 Ryd (15,000 points), and a second grid between 1.5 and 3 Ryd with a stepsize of 0.0005 Ryd (3000 points). The second set of partial waves is calculated on a coarser grid from 0.001 to 3 Ryd with a spacing of 0.001 Ryd (3000 points), with the top-up procedure applied.
The RM scattering calculation for Pt ii is carried out similarly. The close-coupling expansion is reduced to 450 levels, and the calculation is carried out for two sets of partial waves, which are combined afterward. The lower set, with J = 0–14 and a continuum basis set size of 20, results in 3,048 channels. The second set, J = 15–35, is carried out with the same continuum basis set size, resulting in Hamiltonian dimensions for the lower and higher partial waves of (67, 824)2 and (60, 960)2, respectively. The lower partial waves are computed on a fine grid of 18,000 points spanning 0.0001–1.8 Ryd (spacing 0.0001 Ryd), and 4000 points spanning 1.8–3.8 Ryd (spacing 0.0005 Ryd). The higher partial waves are computed on a grid of 3800 points between 0.001–3.8 Ryd with a spacing of 0.001 Ryd, with a top-up procedure applied.
For Pt iii, the 1,639 levels were reduced to 600 in the scattering calculation. Two sets of partial waves, J = 0.5–14.5, and J = 15.5–35.5, are computed on differing energy grids in order to resolve the resonances. The lower partial waves, with a continuum basis size of 24, yield a Hamiltonian with dimension (101, 090)2, which is solved on a grid of incident electron energies of 0.0001–2 Ryd (20000 points, spacing 0.0001 Ryd). For 2–4 Ryd, the lower partial waves are solved on a coarser mesh with 10,000 points (step size 0.0002 Ryd). The second set of partial waves used a continuum basis size of 20 and yields a Hamiltonian with dimensions (83, 680)2. The second partial wave set is computed on an energy grid spanning 0.02–4 Ryd with a spacing of 0.02 Ryd (200 points), with a top-up procedure applied.
The calculated electron-impact excitation cross sections, σif , are related to the collision strength Ω in atomic units by

where ki is the energy of the incident electron in Rydbergs, gi is the statistical weight of the initial state, and ao is the Bohr radius. The collision strengths Ω are converted to ECSs, ϒ, by averaging over a Maxwellian velocity distribution at each electron temperature, Te, by

where Ef is the excess electron energy after excitation, and k is the Boltzmann constant. The RM collision strengths presented here (see supplementary files) are distributed in the adf04 file format of ADAS (Summers 2004), and are compatible with both ADAS (Summers et al. 2006) and the open-source modeling code ColRadPy (Johnson et al. 2019).
3.2. Approximate Collision Data from van Regemorter Formulae
For many elements and charge states, little to no electron-impact excitation data may be available, and it is desirable to approximate the ECSs based on known atomic parameters. For NLTE applications, approximate collision data are commonly generated for, e.g., supernovae models (Jerkstrand et al. 2012), from the expressions provided in van Regemorter (1962), hereafter labeled VR. We use the expressions as reported in Pognan et al. (2021), where the ECSs for allowed (E1) transitions are taken as

with the Gaunt factors integrated over the electron velocity distribution P(y) (discussed below), λ is the transition wavelength in cm, Aji is the transition rate, and gi is the statistical weight of the level i. We adopt the same cutoff between allowed and forbidden transitions as that in Pognan et al. (2021), such that the ECSs for transitions with oscillator strengths beneath 10−3 are calculated as

where gi and gj are the statistical weights of levels i and j. This approximation for forbidden transitions is originally sourced from Axelrod (1980), where the expression derives from an empirical fit to close-coupling calculations for Fe iii and Fe vi by Garstang et al. (1978). We note that the forbidden transition collision strengths calculated in this manner are temperature-independent.
In total, the expressions of van Regemorter (1962), Axelrod (1980) produce ECSs from values for the transition rates, wavelengths, statistical weights, and P(y) factors, which are themselves a function of (ΔE/kTe). For neutral and singly ionized systems, we use the P(y) curves as digitized from van Regemorter (1962). For Pt iii, the P(y) factors are calculated using a standard ADAS code (d7pyvr), which derives the factor P(y) from an estimation of the effective quantum numbers for the upper and lower levels. In this work, we utilize the van Regemorter (1962), Axelrod (1980) expressions Equations (3)–(4) together to provide a complete set of collision strength data for each ion, which is denoted by the label "VRA" in the remainder of this work.
3.3. Relativistic Distorted Wave Calculations
For highly charged systems, it is common to compute electron-impact excitation data using perturbative approaches, as the electronic potential of the highly charged nucleus dwarfs electron correlation effects. A common perturbative approach is the DW formalism, which treats the incident electron as a wave, which impinges on the target system. Computationally efficient implementations of DW electron-impact excitation are available in, e.g., AUTOSTRUCTURE (Badnell 2011), the FAC (Gu 2008), HULLAC (Bar-Shalom et al. 2001), and the Los Alamos suite of codes (Fontes & Zhang et al. 2015). For complex species such as Pt i where the electronic states are of low purity due to significant CI mixing, resonances can contribute substantially to the electron impact cross sections. In DW calculations, resonances can be included by a two-step process of electron capture followed by Auger decays(Cowan 1980). We have chosen not to include resonances in our DW calculations, in order to simulate an out-of-the-box calculation of electron-impact excitation data, that might for example be carried out to mass-produce critically needed data with limited resources.
To investigate the usefulness and accuracy of DW methods for near-neutral heavy elements, and as an added point of comparison to the RM and VR collision strengths, we generated ECSs for Pt i–iii using the relativistic DW formalism implemented in the FAC. These calculations utilized the small-scale FAC configuration sets (identical to those of the GRASP0 calculations), with the default out-of-the-box parameters for electron-impact excitation, with one modification. The internal energy grid (defaulted to six points derived from the transition energies) was modified to span 0.17–20 eV in 32 linearly spaced steps. In the absence of more accurate methods, it is expected that DW data from any of the available implementations is likely more reliable than approximate expressions such as those reported in van Regemorter (1962). This expectation is tested in Section 4 by comparison to spectral models utilizing RM data and the approximation formulae of van Regemorter (1962), Axelrod (1980).
3.4. Effective Collision Strength Results
A comparison of the van Regemorter and Axelrod (VRA), DW, and RM ECSs are shown in Figure 3. We restrict the ECS comparisons to three categories: (1) electric-dipole (E1) allowed transitions from excited states to metastable levels, including the ground level, (2) M1 transitions between metastable states, which can act to effectively redistribute metastable level population at low electron temperatures and/or densities, and (3) the 15 strongest E1 lines as predicted from CR modeling. We neglect here electron-impact excitation between excited states, as the timescale between collisions is much longer than the radiative lifetimes of the excited states at the plasma conditions of interest in kilonovae. Lastly, a final restriction is applied by only comparing ECSs for transitions matched between the FAC and GRASP0 calculations where both the upper and lower levels were shifted to experimentally derived energies.

Figure 3. Comparisons of van Regemorter (E1) and Axelrod (Forbidden) effective collision strengths (VRA) and present R-matrix data (top row), FAC distorted wave data compared to the present R-matrix data (bottom row) as a function of electron temperature. Comparisons are shown for dipole-allowed (E1) transitions (black ◊), metastable–metastable forbidden transitions (red ×; offset −0.15 eV), and the 15 strongest E1 lines (blue ◦, offset +0.15 eV) as determined from collisional-radiative models. Black, dashed, horizontal bars are shown at y = 0 to guide the eye.
Download figure:
Standard image High-resolution imageIn Pt i, the VRA expressions systematically underpredict, on average, the ECSs for both M1 (red) and allowed (black, blue) transitions. As a representative example, the median ratio of the VRA to RM collision strengths for the E1 transitions at Te = 2.5 eV, 0.23 ± 0.14, is substantially lower than the same ratio for DW and/or RM data, 1.75 ± 0.84. The same ratio applied to the forbidden collision strengths computed with the expression of Axelrod (1980) is 0.18 ± 0.11, compared to the same ratio 1.95 ± 0.75 for the DW data. The DW collision strengths systematically overestimate the collision strengths for both forbidden and allowed transitions by factors of a few or more, although with less scatter than those from the VRA formulae.
For Pt ii, the VRA expressions systematically underestimate the ECSs for both M1 and E1 transitions, with a median ratio of 0.6 ± 0.26 for E1 transitions and 0.27 ± 0.12 for the forbidden transition collision strengths using the formulae of Axelrod (1980). For E1 transitions, the DW data of Pt ii are typically within a factor of few of the RM ECS values, with a median ratio of 1.57 ± 0.43 for E1 transitions and 1.15 ± 0.41 for the considered forbidden transitions.
For Pt iii, the VRA expressions yield a systematic underprediction of the ECS's for collisions between metastable levels compared to the RM calculations. For the Axelrod (1980) forbidden collision strengths, the same ratio applied above is 0.23 ± 0.09, compared to the median ratio 0.72 ± 0.31 for the DW data. For the E1 transitions, both VR and DW yield ECS values within a factor of ∼2 for the strongest lines. The VRA ECS values for E1 transitions show considerable scatter (ratios in the range 10±1), and a median ratio 0.96 ± 0.53 at Te = 2.5 eV, compared to a comparable ratio 1.15 ± 0.39 for the present DW calculations. In total, the VRA expressions, in particular the approximation derived by Axelrod (1980) for forbidden transitions, which is presently widely used, show at-times comparable collision strengths (with some large scatter) for E1 transitions, but systematically lower ECSs by factors of a few of more for forbidden transitions, which are expected to be prominent in nebular kilonovae. In the following, the impact of these differing ECSs on spectral models is explored.
4. Collisional-radiative Modeling
It is useful to propagate the ECSs from the previous section through to spectral line intensities to determine if the large differences in ECSs (Figure 3) lead to large differences in predicted line intensities. The aim is to determine if the more approximate methods for these low charge states, the DW and VRA formalisms, can be used to produce collisionally excited spectra at kilonova-like plasma conditions.
In the low-density (coronal) regime, excited state populations are directly proportional to the electron density. At very high electron densities, conditions of LTE are met, and populations are described by a Saha-Boltzmann distribution. In between these two extremes, the CR regime, level populations are nonlinear with electron density, and the populations can be found by solving the rate equations including all of the exciting and deexciting mechanisms. In all three regimes, CR theory (Bates et al. 1962) and generalized CR theory (Summers et al. 2006) provide a conceptual framework to compute the level populations, and software implementations are widely available, such as ADAS(Summers et al. 2006) and ColRadPy (Johnson et al. 2019).
In the following, we explore CR (NLTE) models of Pt i–iii using our computed structure and Mawellian-averaged ECS data (Sections 2 –3), transformed into the widely used adf04 OPEN-ADAS file format (Summers 2004). We use the open-source CR code ColRadPy (Johnson et al. 2019) to perform the CR modeling. In order to isolate the effects of the differing ECSs on spectral models, in the following, we have utilized the same transition rates (Einstein A values) from the GRASP0 calculations underlying the RM data in all models.
4.1. Collisional-radiative Models
Low charge states of platinum (Z = 78) offer a unique opportunity to test the validity of the DW and VRA versus RM methods for computing ECSs for use in NLTE kilonovae models. In ions with open d shells, there can be many long-lived metastable states, which in turn can provide alternative sources of large populations that can efficiently populate excited states. In CR models, the metastable populations can be solved for using a steady-state approximation. However, if the plasma is evolving on a timescale similar to the time required for metastable levels to reach a steady state, then the contributions to individual line intensities must be separated into contributions from each metastable. Then, each metastable-resolved photon emissivity coefficient (PEC; "line intensity" contribution per unit metastable level population) must be weighted by the appropriate metastable population fraction. Thus, it is useful to first look at some of the PECs for Pt and determine if a steady-state approximation is valid.
As a representative example, Figure 4 shows the PEC (photons per cubic centimeter per second) for the Pt i transition 5d86s6p5D3 → 5d96s3D3 (ground) at λvac = 293.065 nm, as a function of temperature at a single electron density of ne = 108 cm−3. The metastable-resolved PECs (top panel; unweighted by lower state populations) confirm that this transition can be strongly driven by excitation from numerous metastable levels. From time-dependent CR models, we find the timescales for the metastable levels to achieve a steady state are of order ∼ seconds at temperatures ∼eV, and the densities are of order 108 cm−3. For lower electron densities of order 104 cm−3, the metastable timescale increases to ∼4000 s, lower than any expected plasma timescales in kilonovae. In environments where plasma timescales are shorter than the metastable lifetimes, a time-dependent analysis should be performed. However, in kilonovae, the presence of optical depth effects (see discussion in Pognan et al. 2022) suggests that radiation trapping may increase the equilibration time, and a time-dependent analysis of the metastable level populations may be required. In order to assess the quality of our computed atomic data, for the remainder of this work, we assume that the level populations have achieved a steady state.
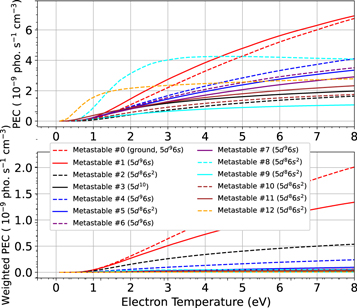
Figure 4. Metastable-resolved photon emissivity coefficient of the 5d86s6p5D3 > 5d96s3D3 (ground) transition of Pt i at λvac = 293.065 nm. The PEC is presented as a function of temperature at an electron density of ne = 108 cm−3 unweighted by population fractions (top) and weighted by equilibrium metastable population fractions (bottom).
Download figure:
Standard image High-resolution imageReturning to the PECs of Pt i, we assume steady-state population fractions of the metastable levels, which are computed by balancing the necessary excitation and deexcitation rates with ColRadPy. Figure 4 (bottom panel) shows the same PECs for the transition in Figure 4 (top panel), weighted by the steady-state metastable population fractions. Over the range of explored temperatures, nearly 70% of the emission from this transition is driven by excitation from many metastable levels, compared to only 30% of the total emission being driven by direct excitation from the ground level. This trend holds for the majority of the transitions in Pt i–iii.
Assuming steady-state conditions are achieved, we investigated a grid of CR models utilizing multiple different sets of ECSs for both forbidden and allowed transitions. In doing so, we assess spectral differences deriving from the use of DW, RM, or approximated collision strength data. For the DW models, only levels that were matched to literature energies had ECSs replaced. The modified collision strengths encompass the low-lying metastables, and the important excited states. As will be discussed later, very high-energy excited states are weakly populated, and the use of RM ECSs for these levels in the DW model introduces only minor changes in the computed models.
Figure 5 shows a representative example of the variations in spectra with plasma conditions, inclusive to those expected in the range of plasma conditions assumed in existing NLTE models of kilonovae (see Hotokezaka et al. 2021; Pognan et al. 2022) for each ion stage. The x and y scales were adjusted to show the strongest emission in each species, and a constant offset is applied to suitably separate the five presented spectral models (discussed below).
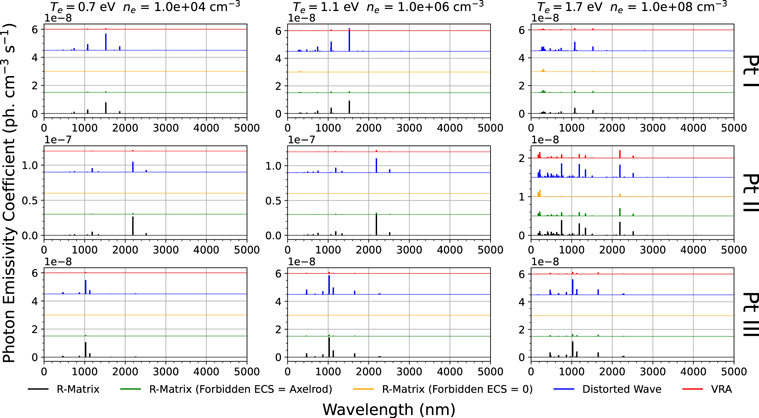
Figure 5. Synthetic spectra of Pt i (top row), Pt ii (middle row), and Pt iii (bottom row). Spectra are shown at three sets of plasma conditions for each ion stage (note the different linear x and y scales). In each figure, five NLTE models are shown and plotted with respect to their zero-points given by the colored horizontal lines. The models shown were produced from: complete R-matrix data (black), R-matrix data with forbidden ECSs replaced with their Axelrod values (green), R-matrix ECSs for allowed transitions and forbidden line ECSs set to zero (orange), FAC distorted wave data (blue), and approximate VRA ECSs for both forbidden and allowed transitions (red).
Download figure:
Standard image High-resolution imageAt low electron temperatures and densities (Figure 5, left column), a number of low-lying metastable states of Pt i are populated, resulting in several prominent IR features. Both RM (black) and DW (blue) collision strengths produce spectra, which are nearly identical at Te = 0.7 eV, and ne = 104 cm−3. Swapping the forbidden collision strengths from RM to approximate data using the expression (Equation (4)) of Axelrod (1980; green curves) yields little to no IR emission, indicating that the IR features are primarily driven by electron-impact excitation of the metastable levels. At these conditions, the radiative decays of excited states by E1 transitions thus play a minor role in redistributing population between the metastable levels. The dominance of collisional rates between metastable levels, at these plasma conditions, is reinforced by the models with forbidden collision strengths set to zero (orange curve), where IR emission is weak or absent entirely. These trends continue toward even higher electron temperatures. Across this grid of conditions, the models utilizing fully approximate VRA ECSs substantially underestimate the emission of Pt i across the full UV and/or VIS and/or IR range.
In Pt ii, the excited states are substantially higher in energy with respect to the ground level, with the lowest excited, nonmetastable state, at ∼6.4 eV above the ground level. At 0.7 eV electron temperature, only metastable states are populated. Radiative decays of these levels result in several IR emission features, the strongest of which lies at ∼2.19 μm. Just as in Pt i, we find that the DW model for Pt ii produces similar spectra to the fully RM model. With increasing temperature, excited states get significantly more populated, yielding UV emission, which is similar in intensity across most models. In the models with forbidden transition rates swapped to Axelrod data (green curve), and those with forbidden collision strengths set to zero (orange curve), the visible and near-infrared (NIR) and/or IR features are extremely weak. The use of the approximate ECSs for forbidden lines leads to a deficit in metastable population, which in turn substantially reduces the ultraviolet and visible emission lines from decays of the excited states. This results from the inefficient excitation of excited states from the ground level at these plasma conditions. This effect is most apparent in models with forbidden collision strengths set to zero (orange), where the only features are (1) UV emission from excited state decays directly to ground, and (2) weak IR emission from the weakly populated metastable level(s). With increasing temperature and/or electron density, the VRA model for Pt ii begins to predict the same strong features as the DW and RM models, although with a notable decrease in magnitude.
The impact of the quality of ECSs on spectra is most apparent in models of Pt iii (Figure 5, bottom row). At these electron temperatures (0.7–1.7 eV), the excited states of Pt iii are weakly populated, and the emission is dominated by radiative decays of metastable states. The models using VRA data, either fully or in part, predict little to no emission in the UV and/or VIS and/or IR compared to the DW and RM models. Surprisingly, the models utilizing both DW and RM data predict similar PECs for the prominent features in the visible and/or IR over a wide range of plasma conditions.
Different trends emerge with increasing electron temperature. Figure 6 shows similar data as the model grid in Figure 5, with comparable densities but higher electron temperatures of 2, 4, and 6 eV respectively. With increasing temperature, the excited states begin to be more efficiently populated, and the differences between VRA, DW, and RM models decrease in magnitude. We note that, for some of the strongest transitions in these three ion stages, the DW model predicts stronger emission for some features, owing to the overestimation of the collision strengths (see Figure 3).
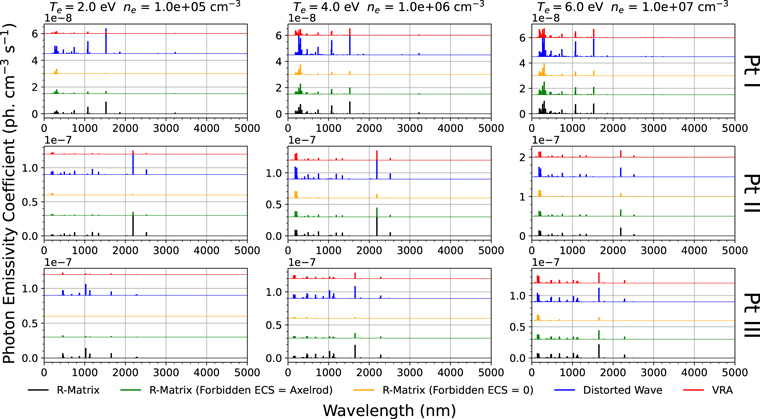
Figure 6. Synthetic spectra of Pt i (top row), Pt ii (middle row), and Pt iii (bottom row). Spectra are shown at three sets of plasma conditions with elevated temperatures (with respect to Figure 5) for each ion stage (note the different linear x and y scales). In each figure, five NLTE models are shown and plotted with respect to their zero-points given by the colored horizontal lines. The models shown were produced from: complete R-matrix data (black), R-matrix data with forbidden ECSs replaced with their Axelrod values (green), R-matrix ECSs for allowed transitions and forbidden line ECSs set to zero (orange), FAC distorted wave data (blue), and approximate VRA ECSs for both forbidden and allowed transitions (red).
Download figure:
Standard image High-resolution imageAt these elevated temperatures, the models of Pt i are less sensitive to the magnitude (or absence) of forbidden collision strengths, as excited states are more efficiently populated, and E1 transitions can effectively redistribute population between metastable levels. Pt i models with mixed VR and/or RM data (green) show similar feature distributions and intensities to both the DW and fully RM models at these temperatures. This effect is reversed in models of Pt ii–iii. Despite the elevated temperature enabling higher populations of excited states, collisions between metastable states continue to dominate, with little level population being redistributed by E1 transitions in Pt ii and Pt iii. In both ions, many of the visible and/or NIR features remain sensitive to the inclusion of the forbidden collision strengths.
The temperature grid is expanded in Figure 7, which shows CR models for Pt i–iii at Te=30 eV and ne = 1012 cm−3, conditions typical of the Compact Toroidal Hybrid (CTH) plasma apparatus at Auburn University (Bromley et al. 2020). While all three models produce similar spectra, we note that the strong lines appear sensitive to both the theoretical source of collision strengths, and the metastable populations, with PECs in the DW model comparable to or larger than their fully RM counterparts. At these elevated plasma conditions, the swapping of forbidden collision strengths to approximate data increases the intensity of lines in the vacuum ultraviolet below 200 nm, while decreasing the intensities of allowed transitions in the UV above 200 nm. In stark contrast to models at lower temperatures and densities, the models with VRA data appear to increase the strengths of some strong spectral lines across the presented spectral ranges for conditions expected in, e.g., laboratory experiments, despite the systematic underestimation (on average) of the collision strengths (recall Figure 3).
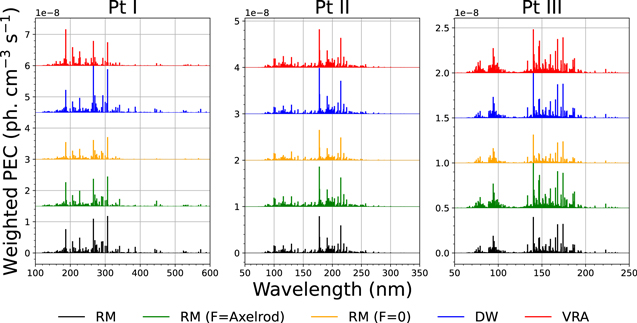
Figure 7. Synthetic spectra of Pt i–iii at Te = 30 eV, and ne = 1012 cm−3, comparable to conditions found in tokamaks (Bromley et al. 2020). Models are labeled and shown with the same color and labeling scheme as Figures 5–6.
Download figure:
Standard image High-resolution imageThough, these plasma conditions are unlikely to occur in kilonovae, Figure 7 suggests that such conditions achievable in the laboratory may be useful for benchmarking collisional excitation data. Comparisons between spectral models and observed intensities of spectral lines can provide direct tests of the level populations resulting from the theoretical cross section data. Such benchmarking experiments could be performed on devices such as the Auburn University CTH experiment, and are planned in the near future. In the following, we return to the plasma conditions most relevant to kilonovae, and test the impact of atomic data sources against the use of approximate collision data and the assumption of LTE in kilonovae modeling.
4.2. Level Populations and LTE
It has been common to assume LTE in order to compute atomic level populations in the early, photodominated portions of kilonovae. For later times where the relevance of photoprocesses decreases, it is useful to consider how far level populations are from their LTE values. In the following, we investigated the equilibrium level populations of Pt i–iii produced by models utilizing the RM, DW, and VRA data in order to facilitate comparisons to LTE models. In doing so, we have included electron-impact excitation, electron impact deexcitation, and spontaneous (radiative) decay, and the level populations can be considered as a constraint on the deviations from LTE in our models.
Several trends appear in the level populations of all three ion stages. As a representative example, Figure 8 (top) shows the level populations of Pt i at Te = 1 eV, and ne = 107 cm−3 in the three CR models considered here (VRA, DW, RM), and equivalent populations assuming LTE (green). Compared to LTE, the populations of the first few metastable levels show comparable population fractions to the LTE model. With increasing energy, the higher-energy metastable levels are lower by 1 to 2 orders of magnitude. Notably, the excited states are deficient by ∼7 orders of magnitude or more compared to LTE.

Figure 8. (Top) Pt i level population fractions with respect to ntotal = 1, at Te = 1 eV, and ne = 107 cm−3 for the R-matrix (RM; black), distorted wave (DW; blue), van Regemorter and Axelrod (VRA; red), and LTE (green) models. (Bottom) Level population ratios between distorted wave and R-matrix models (blue) and between VRA and R-matrix (red) at the same plasma conditions as a function of level index. The populations are normalized such that the sum of level populations within each model are equal to one. Levels are indexed in increasing energy order.
Download figure:
Standard image High-resolution imageIn comparisons between the present CR models, differences in the level populations are evident. Figure 8 (bottom) shows the level populations in the DW and VRA models with respect to their RM model values. At temperatures less than a few eV, the metastable populations in the DW model are comparable to the RM model, within a factor of a few. With increasing density up to 109 cm−3 (not shown), the metastable populations are driven to within ∼30% of their RM values. In the VRA model, the same populations are systematically deficient by factors of a few to an order of magnitude. Excited states show a factor of ∼2 enhancement in the DW model, owing to the larger (on average) ECSs (see Figure 3). We note that the most highly excited states are difficult to match between calculations, owing to strong mixing, insufficient laboratory data, and differing levels of CI mixing in the sets of calculations. However, the highly excited levels are expected to be very low in population at the conditions of interest. Despite the unchanged collision strengths for these levels in the DW model, i.e., the use of RM data for unmatched levels, the differences in the collision strengths for the lower-lying levels introduce variations of order 10%–20% in the equilibrium populations of the weakly populated highly excited states.
From our grid of models, we find that the differences between the DW and RM level populations tend to decrease with increasing charge state. As an example, Figure 9 shows the ratio of DW to RM model populations at Te = 1 eV (∼11,600 K), and ne = 106 cm−3. In Pt ii and Pt iii, the populations of the higher-energy metastable levels are reduced by factors of a few to an order of magnitude (with respect to the RM results) in the DW model. Excited states, however, show a general improvement in agreement with increasing charge state. Moreover, the VRA model systematically underpredicts the populations of the metastable levels, and enhances the population of the excited states with respect to the RM data. On average, the increase in equilibrium population for excited states in the VRA model appears to scale with the energy of the excited state.

Figure 9. Level population ratios between collisional-radiative models at Te = 1 eV (∼11,600 K), and ne = 106 cm−3 as a function of level index in energy order. For each ion stage, ratios are shown for distorted wave divided by R-matrix populations (blue) and van Regemorter and Axelrod divided by R-matrix populations (red). The populations are normalized such that the sum of level populations within each model are equal to one.
Download figure:
Standard image High-resolution image
Lastly, we note that the models explored here include only electron-impact excitation and deexcitation, and spontaneous radiative decay, assuming optically thin conditions. As we have shown that dipole-allowed transitions are inefficient at redistributing level population at the expected plasma conditions in late-time kilonovae, the time-evolution of the metastable levels (whose radiative decays are typically weak, A ∼ few s−1) will depend strongly on the local densities and optical depth effects. The extent to which the metastable level populations deviate from LTE and their sensitivity to optical depth effects should continue to be explored, in order to assess the detectability of their IR emission in nebular kilonovae. The present models also ignore the effects of photoexcitation, photoionization, electron impact ionization, and all recombination processes. Both ionization and recombination processes could have dramatic impacts on the ionization balance, including state-selective effects, which could drive the level populations farther from or closer to LTE values. We propose that such effects should be explored further in order to assess the quality and quantity of atomic data necessary to understand the spectral evolution of kilonovae.
With the above set of assumptions, we find that the models built on DW data produce level populations and line intensities most similar to the RM models for the features of interest in all three ions considered here. In contrast, the expressions of van Regemorter (1962), Axelrod (1980) systematically underestimate the collision strengths and resulting line intensities of these ions at plasma conditions expected in kilonovae. Clearly, both VRA and DW data are insufficient for performing line ratio diagnostics for these low charge states at kilonova-like plasma conditions, but may be quickly produced when no other data are available. These comparisons suggest that the relativistic DW approach may be more reliable than that from van Regemorter (1962), Axelrod (1980) approximations for providing "baseline" electron-impact excitation data for use in kilonovae models until more accurate (e.g., RM) data for near-neutral systems become available.
5. Conclusions
Recent NLTE models of kilonovae have motivated this study of electron-impact excitation of Pt i–iii. Building on our previous calculations for Au i–iii, we report new calculations of the electronic structures and electron-impact excitation cross sections for Pt i–iii. The electronic structures of the ions were calculated with the GRASP0 code using a compact configuration set intended as input for a subsequent electron-impact excitation calculation with the DARC RM codes. As a check on the calculated energies and transition rates, we performed larger calculations with the FAC, and recover comparable energies and transition rates to the smaller, targeted GRASP0 calculations.
Using the DARC RM codes, we report the calculations of electron-impact excitation cross sections, and derived ECSs assuming a Maxwellian electron energy distribution. Given the demanding computational requirements to perform RM electron-impact excitation calculations for heavy, complex systems, we compared the computed RM data to similar quantities calculated by the approximation formulae of van Regemorter (1962), Axelrod (1980), and relativistic DW data computed with the FAC. Over a wide temperature range, we find that the approximation expressions systematically underestimate the ECSs of both forbidden and allowed transitions for all three ions studied here. In comparison, the DW calculations tend to overestimate the ECSs for Pt i–ii, and underestimate the collision strengths for forbidden transitions in Pt iii.
We incorporated the computed ECSs into CR models carried out over a grid of plasma conditions relevant to both laboratory and NSM (kilonova) plasmas. In all three ion stages, the emission lines are dominated by excitation from low-energy, long-lived metastable levels, whose contributions can dwarf direct excitation from the ground level. At conditions relevant to kilonovae, the level populations of low-lying metastables can be comparable, within a factor of ∼few, of their LTE values, and the excited state populations are many orders of magnitude below their LTE values. The models utilizing DW data recover level populations comparable to those from models that utilize fully RM data. CR models utilizing van Regemorter (1962), Axelrod (1980) collision strengths systematically underpopulate metastable levels and overpopulate excited states compared to the RM models.
Using ColRadPy (Johnson et al. 2019), we also produced synthetic spectra across a wide range of plasma conditions. At the temperatures and densities relevant to kilonovae, the inclusion and magnitude of ECSs for forbidden transitions have a large impact on the distribution and magnitudes of spectral features. At the lower end of the temperatures and densities explored here, the models utilizing any (or all) data from the expressions of van Regemorter (1962), Axelrod (1980) produce PECs ("line intensities") substantially lower than models utilizing either RM or DW collision strengths, particularly for IR emission features expected in nebular kilonovae. At higher temperatures and densities expected in laboratory plasmas, the three models (VRA, DW, RM) produce similar distributions of features with varying intensities, suggesting that spectral measurements at such conditions may be suitable for benchmarking data produced from the present theoretical efforts. The spectral measurements of Au and Pt at these conditions are planned at the CTH facility at Auburn University to benchmark the present calculations for Pt ions, and previous work on Au ions from McCann et al. (2022).
In total, the present calculations for Pt i– iii show that the approximation formulae of van Regemorter (1962), Axelrod (1980) are not well suited for producing accurate electron-impact excitation data for use at kilonova-like conditions. In the absence of reliable RM data, the present calculations show that the relativistic DW formalism is more appropriate for producing electron-impact excitation data for lowly charged ions of Pt at kilonova-like conditions. The spectral models utilizing DW data, when compared to those utilizing van Regemorter (1962), Axelrod (1980) data, more often recover level populations and line intensities, which are most similar to those found in the spectral models built on RM data. Despite the observed relative agreement between RM and DW models, RM data are expected to be the most reliable in predicting metastable level populations, which may be responsible for IR emission in the NLTE phases of kilonovae evolution.
Given the similarities between the atomic structures of the present ions and its neighboring species on the periodic table, we expect similar conclusions may be drawn for other heavy elements of interest to kilonovae. Future work is planned to expand the present calculations to other heavy, complex species to investigate trends in other r-process elements with differing electronic structures.
Acknowledgments
This work was funded by the Science and Technology Facility Council (STFC) through the Queen's University Belfast Astronomy Observation and Theory Consolidated Grant 2020–2023 ST/T000198/1. The authors (S.D.L. and S.J.B.) gratefully acknowledge funding support from the National Science Foundation grant number 1816984.
Calculations were carried out on the Hawk supercomputer at the High-Performance Computing Center Stuttgart (HLRS) as well as on a local cluster at Queens University Belfast. The authors also gratefully acknowledge the support and computing resources provided by the Auburn University Hopper and Easley computing Clusters.
Footnotes
- 3
Digitized line and level lists of the Pt iii data from Ryabtsev et al. (1993) are available upon request.
- 4
Full lists of the configurations used in the calculations are provided as supplementary files.