


Abstract
We present a multi-epoch, multi-observatory X-ray analysis for 2FHL J1745.1–3035, a newly discovered very high-energy Galactic source detected by the Fermi Large Area Telescope (LAT) located in close proximity to the Galactic Center (l = 358 5319; b = −07760). The source shows a very hard γ-ray photon index above 50 GeV, Γγ = 1.2 ± 0.4, and is found to be a TeV emitter by the Fermi–LAT. We conduct a joint XMM-Newton, Chandra, and NuSTAR observing campaign, combining archival XMM-Newton observations, to study the X-ray spectral properties of 2FHL J1745.1–3035 over a time span of over 20 yr. The joint X-ray spectrum is best fitted as a broken-power-law model with break energy Eb ∼ 7 keV: the source is very hard at energies below 10 keV, with Γ1 ∼ 0.6, and significantly softer in the higher energy range measured by NuSTAR with Γ2 ∼ 1.9. We also perform a spatially resolved X-ray analysis with Chandra, finding evidence for marginal extension (up to an angular size r ∼ 5''), a result that supports a compact pulsar wind nebula scenario. Based on the X-ray and γ-ray properties, 2FHL J1745.1–3035 is a powerful pulsar wind nebula candidate. Given its nature as an extreme TeV emitter, further supported by the detection of a coincident TeV extended source HESS J1745-303, 2FHL J1745.1–3035 is an ideal candidate for a follow up with the upcoming Cherenkov Telescope Array.
Export citation and abstract BibTeX RIS

Original content from this work may be used under the terms of the Creative Commons Attribution 4.0 licence. Any further distribution of this work must maintain attribution to the author(s) and the title of the work, journal citation and DOI.
1. Introduction
The Galactic plane is rich with efficient accelerators producing cosmic rays (CRs, both leptons and hadrons), neutrinos (via hadronic interactions), and energetic γ-ray photons. Very high-energy (VHE, >50 GeV) γ-rays provide a direct view of some of the most extreme environments in the Galaxy: indeed, γ-rays represent an excellent probe of nonthermal astrophysical processes, since they are produced by the interaction of relativistic particles. In particular, pulsar wind nebulae (PWNe) are some of the brightest sources in the VHE sky and represent an ideal laboratory for studying phenomena around objects with extreme densities and magnetic field strengths, as well as how relativistic particle winds interact with ambient media. The spinning neutron star, or pulsar, left behind after a supernova (SN) explosion may generate a relativistic wind of electrons and positrons that interact with unheated supernova ejecta, developing a standing shock wave where the electrons and positrons are injected and accelerated into the nonthermal expanding bubble of diffuse plasma, defining the PWN (Gaensler & Slane 2006; Malyshev et al. 2009). Since PWNe have well-defined central energy sources (i.e., the pulsar) and many are close enough to be spatially resolved, they allow for studying in great depth both relativistic winds and the shocks that result from these winds colliding with the ambient medium. The radio to X-ray emission of PWNe is caused by synchrotron radiation of relativistic electrons in pulsar winds shocked in the ambient medium (Kennel & Coroniti 1984; Kargaltsev & Pavlov 2008). Additionally, the same population of relativistic electrons responsible for the PWN synchrotron emission can scatter off local photon fields, resulting in inverse Compton (IC) emission at γ-ray energies: notably, PWNe are the dominant class of TeV γ-ray Galactic sources, as observed by Cherenkov telescopes (for example, 39% of the 31 sources identified by the H.E.S.S. Galactic plane survey are PWNe; H.E.S.S. Collaboration et al. 2018). Therefore, a complete picture of the electron population in PWNe, and a full understanding of the mechanisms underlying VHE emitters, can be achieved only by constraining simultaneously the synchrotron component, using X-ray observations, and the IC one, with γ-ray data (e.g., Renaud 2009; Kargaltsev et al. 2013; Eagle 2022).
The Fermi–LAT 2FHL catalog (Ackermann et al. 2016) contains 12 VHE sources in the Galactic plane (∣b∣ < 10°) having a γ-ray photon index Γγ <1.8 and currently lack any association. Such a hard photon index reliably rules out an extragalactic origin for these objects, since at energies >50 GeV the 2FHL blazars generally exhibit a soft spectrum, with an average photon index of Γγ ∼ 3.4. In blazars, this energy range is generally observed as the descending part of the inverse Compton (IC) peak in the spectral energy distribution (SED). Prior reports have already performed and reported on the analysis for two of the 12 unassociated Galactic 2FHL targets. The first study focused on 2FHL J0826.1–4500, which was found to be a candidate shock-cloud interaction on the western edge of the Vela supernova remnant (SNR; Eagle et al. 2019). 2FHL J1703.4–4145 was the second source of the sample analyzed and was similarly found to be the byproduct of a shock-cloud interaction at the edge of a supernova remnant, SNR G344.7–0.1 (Eagle et al. 2020).
In this work, we present the results of a multi-observatory X-ray monitoring of a third source in the 2FHL VHE subsample, 2FHL J1745.1–3035. The work is organized as follows: in Section 2, we present the Fermi–LAT source properties and, in Section 3, we present the different X-ray data sets available for this target and the data reduction process and analysis performed. In Section 4, we present the results of the X-ray spectral fits, both for the single-epoch observations and for the overall, multi-epoch spectrum, and we analyze the Chandra image of the source, searching for evidence of extended emission. Finally, in Section 5, we discuss the properties of 2FHL J1745.1–3035 by combining the information derived from the X- and γ-ray data. We summarize the results of the paper in Section 6. Through the rest of the work, errors are quoted at the 90% confidence level, unless otherwise stated.
2. 2FHL J1745.1–3035
While inspecting the properties of the new VHE sources reported in the 2FHL catalog, 2FHL J1745.1–3035 stands out as one of the most intriguing. First of all, the source is located in close proximity to the Galactic Center (l = 3585319; b = −07760). From a γ-ray perspective, this source is the second brightest
11
of the 12 new unassociated VHE sources in the 2FHL sample (F>50 GeV = (2.69 ±0.63) × 10−11 erg s−1 cm−2), and presents a very hard spectrum in the γ-rays above 50 GeV (as shown in Figure 1), having photon index Γγ
= 1.2±0.4. In fact, Fermi–LAT detected a 2FHL J1745.1–3035 photon at 940 GeV, which implies that this source is a TeV emitter. Notably, such a hard γ-ray photon index safely rules out an extragalactic origin for 2FHL J1745.1–3035, since no γ-ray detected extragalactic source has similar Γγ
, and challenges our understanding of the emission mechanism that causes it.

Figure 1. Fermi–LAT spectral energy distribution of 2FHL J1745.1–3035 (violet stars). In the Fermi–LAT data above 50 GeV, the source has an impressively hard γ-ray photon index, Γγ = 1.2 ± 0.4, and is detected up to ∼1 TeV, making this object a candidate for the most powerful Galactic accelerator. We also plot, for reference, the SEDs for 4FGL J1745.8–3028e (green circles) and HESS J1745–303 (orange pentagons). In the text, we discuss the discrepancy between the 2FHL and H.E.S.S. data.
Download figure:
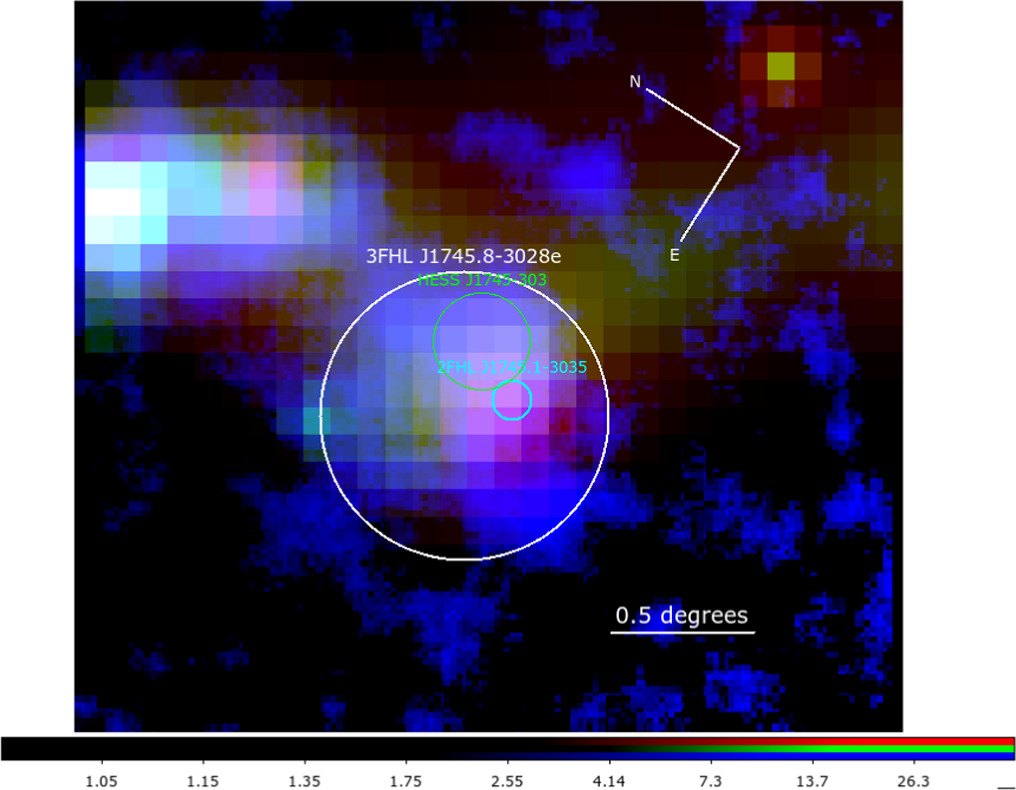
Standard image High-resolution imageAs shown in Figure 2, the 2FHL source is overlapping within the radius (r = 053) of an extended object reported in two other Fermi–LAT catalogs: namely, the Third Catalog of Hard Fermi–LAT Sources (3FHL, which reports objects detected in the 10 GeV–2 TeV range; Ajello et al. 2017, source ID: 3FHL J1745.8–3028e) and the Fourth Fermi Large Area Telescope Catalog (4FGL, which reports objects detected in the 50 MeV–1 TeV range; Abdollahi et al. 2020, source ID: 4FGL J1745.8–3028e). The 3FHL source is associated with the 4FGL one. Both the 3FHL and the 4FGL source are modeled with a disk profile with radius r = 053 ± 002 ± 026 (where the first error is statistical and the second is systematic), as originally reported in the Fermi Galactic Extended Source Catalog (FGES; Ackermann et al. 2017). There is however no source formally associated
12
to 2FHL J1745.1–3035 in the 4FGL and 3FGL catalogs. The 4FGL/3FHL Fermi source has a TeV-detected counterpart of unknown origin, HESS J1745–303, in the H.E.S.S. Galactic plane survey (H.E.S.S. Collaboration et al. 2018). As shown in Figure 1, the H.E.S.S. source has an SED significantly different from the 2FHL one, a discrepancy that can be explained with the offset between the two sources, which may indicate different physical origins.

Figure 2. Tricolor γ-ray image of the region where 2FHL J1745.1–3035 is located. We plot the 2FHL counts (>50 GeV) in red, the 3FHL counts (>10 GeV) in green, and the H.E.S.S. flux in 0.03–100 TeV band in blue. We report the 2FHL, 3FHL, and H.E.S.S. source locations: since the 3FHL (white circle) and H.E.S.S. (green circle) sources are found to be extended, we plot a circle with a radius equal to the best-fit extensions reported in the catalogs. For the 2FHL source (cyan circle), which is found to be point-like, we use the 95% confidence-level radius.
Download figure:
Standard image High-resolution imageHESS J1745–303 has already been studied in several works in the literature. Aharonian et al. (2008) performed a multiwavelength (including XMM-Newton) study of the region where the H.E.S.S. source is detected. They reported that no counterpart alone could fully explain the VHE emission detected by H.E.S.S.: however, at least part of the TeV emission might be linked either to a supernova-remnant/molecular-cloud (SNR/MC) association or to a high-spin-down-flux pulsar, or a combination of the two. Bamba et al. (2009) reported the results of a Suzaku observation of a part of the H.E.S.S. region, but found no significant nonthermal X-ray emission. Hui et al. (2011) instead analyzed the combined H.E.S.S. and 28 months Fermi–LAT SED, but did not find a conclusive explanation for the VHE emission origin.
In summary, the complexity of the observed γ-ray field and the extreme properties of 2FHL J1745.1–3035 make this source particularly interesting. Specifically, the γ-ray maps hint at a scenario where the emission observed and reported in the 2FHL catalog might not be entirely caused by the same object, or processes, causing the emission detected by H.E.S.S. (and likely in the 4FGL catalog). To better characterize this intriguing 2FHL source, we therefore performed an extended, multi-X-ray observatory follow-up campaign.
3. X-Ray Data Reduction and Analysis
We report in Table 1 a summary of the five X-ray observations of 2FHL J1745.1–3035 that have been performed between 2001 and 2023 March. In the following subsections, we describe in detail the data reduction and analysis for each instrument.
Table 1. Summary of the X-Ray Observations of the 2FHL J1745.1–3035 Counterpart
| Instrument | Sequence | Start Time | Exposure | Net count rate |
|---|---|---|---|---|
| ObsID | (UTC) | ks | 10−2 counts s−1 | |
| XMM-Newton | 0103261301 | 2001-03-21T23:12:15 | 7.6; 7.6; 4.4 | 1.07 ± 0.12; 1.29 ± 0.13; 1.99 ± 0.22 |
| XMM-Newton | 0782170601 | 2017-04-03T11:56:57 | 9.6; 9.6; 6.5 | 1.53 ± 0.13; 1.28 ± 0.12; 5.11 ± 0.29 |
| XMM-Newton | 0886010401 | 2021-03-16T19:06:37 | 21.3; 21.3; 16.5 | 0.74 ± 0.06; 0.96 ± 0.07; 2.67 ± 0.14 |
| Chandra | 23573 | 2022-05-20T08:52:56 | 22.8 | 0.59 ± 0.05 |
| NuSTAR | 60301026002 | 2023-03-27T19:01:09 | 111 | 0.68 ± 0.04; 0.74 ± 0.05 |
Note. The XMM-Newton count rates are computed in the 0.6–10 keV Band, the Chandra count rates in the 0.6–8 keV Band, and the NuSTAR count rates are computed in the 3–70 keV band. The XMM-Newton exposures and count rates are the MOS1, MOS2, and pn ones, in this order; the NuSTAR exposures and count rates are the FPMA and FPMB, in this order. All count rates are the net, background-subtracted rates. Exposures are computed after removing high background periods.
Download table as: ASCIITypeset image
3.1. XMM-Newton
The source is in the field of view of three XMM-Newton observations.
- 1.The first observation we studied is a 16 ks one, taken in 2017 and aimed specifically at finding an X-ray counterpart for 2FHL J1745.1–3035 (observation ID: 0782170601; PI: M. Ajello). In the XMM-Newton cameras' field of view, the source was found at a distance from the 2FHL centroid (and therefore at an off-axis angle) ∼3
 5; the J2000 coordinates of the XMM-Newton counterpart centroid are R.A. = 17:45:07.99 and decl. = −30:39:06.17. This source is reported in the fourth release of the XMM-Newton source catalog,
13
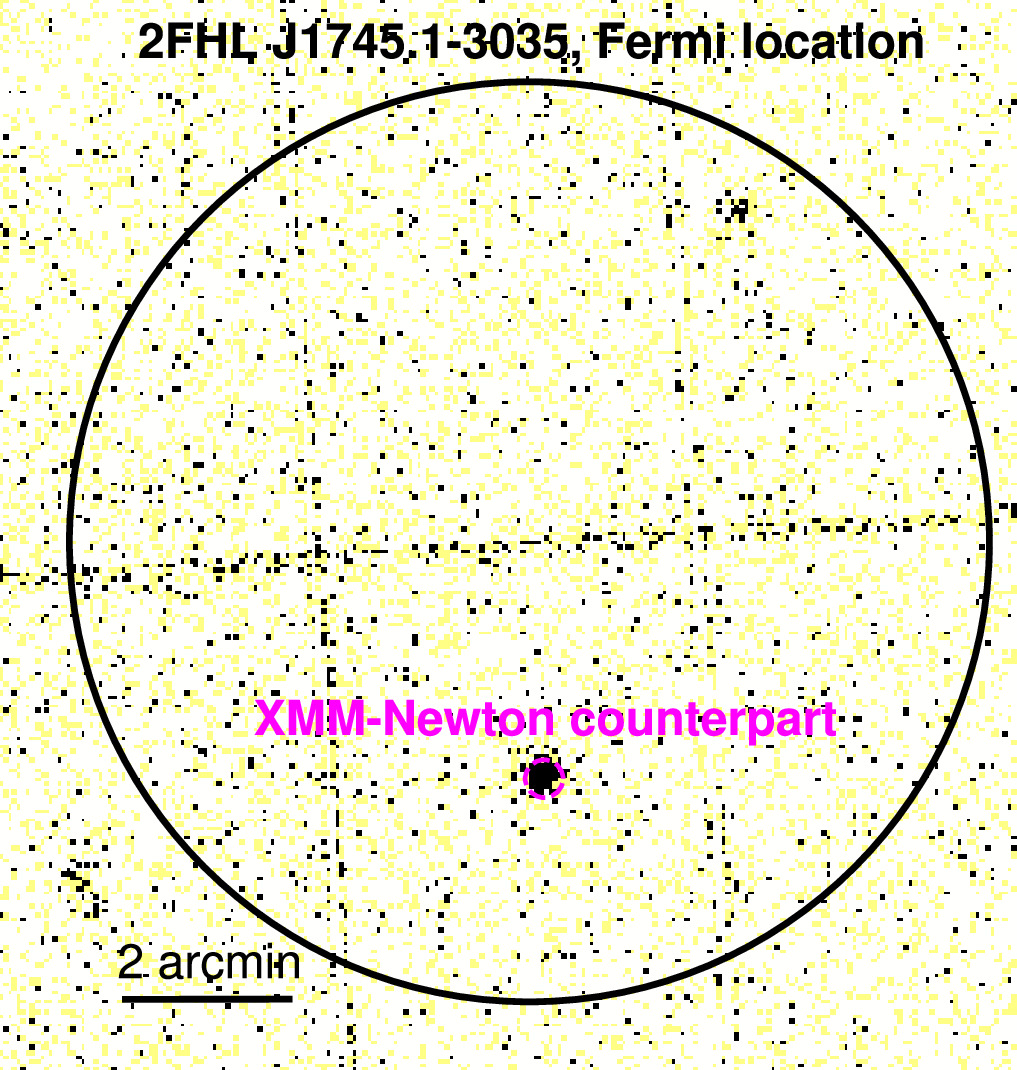
4XMM-DR13 (Zolotukhin et al. 2017; Traulsen et al. 2020; Webb et al. 2020), with source ID 4XMM J174507.9-303906 (http://xmm-catalog.irap.omp.eu/source/201032613010001). In Figure 3, we report an image of the XMM-Newton pn 0.3–10 keV observation with the Fermi–LAT 90% confidence positional uncertainty overlaid; it can be seen that the X-rays allow us to reliably identify a bright counterpart of the 2FHL source (magenta circle in Figure 3). As a safety check, we nonetheless verified the properties of the faint source that can be noticed in the upper right part of the image. This a soft X-ray source with no emission above 2 keV, which has a bright (GAB = 12.5) counterpart in the Gaia DR3 catalog (https://gea.esac.esa.int/archive/; source ID: Gaia DR3 4056681582705849600 Gaia Collaboration et al. 2016, 2023), where the source is flagged as an F-G class star (Teff ∼ 6000 K) with 100% probability. We thus safely rule it out as a possible counterpart of the 2FHL source. The detection of a bright, compact X-ray counterpart strongly supports a scenario where the 2FHL–detected emission does not have the same origin as the H.E.S.S. one, which would explain why the two objects have such different SEDs. We also note that the following Chandra and NuSTAR observations have been performed targeting the XMM-Newton–detected object. Finally, we used the Aladin web tool
14
to search for possible counterparts of the X-ray source, but none was identified in the optical images down to magnitudes RAB ∼ 22. As reported in Table 1, this observation was affected by strong flares, therefore the observation MOS (pn) net exposure time is of ∼9.5 ks (∼6.5 ks).
5; the J2000 coordinates of the XMM-Newton counterpart centroid are R.A. = 17:45:07.99 and decl. = −30:39:06.17. This source is reported in the fourth release of the XMM-Newton source catalog,
13
4XMM-DR13 (Zolotukhin et al. 2017; Traulsen et al. 2020; Webb et al. 2020), with source ID 4XMM J174507.9-303906 (http://xmm-catalog.irap.omp.eu/source/201032613010001). In Figure 3, we report an image of the XMM-Newton pn 0.3–10 keV observation with the Fermi–LAT 90% confidence positional uncertainty overlaid; it can be seen that the X-rays allow us to reliably identify a bright counterpart of the 2FHL source (magenta circle in Figure 3). As a safety check, we nonetheless verified the properties of the faint source that can be noticed in the upper right part of the image. This a soft X-ray source with no emission above 2 keV, which has a bright (GAB = 12.5) counterpart in the Gaia DR3 catalog (https://gea.esac.esa.int/archive/; source ID: Gaia DR3 4056681582705849600 Gaia Collaboration et al. 2016, 2023), where the source is flagged as an F-G class star (Teff ∼ 6000 K) with 100% probability. We thus safely rule it out as a possible counterpart of the 2FHL source. The detection of a bright, compact X-ray counterpart strongly supports a scenario where the 2FHL–detected emission does not have the same origin as the H.E.S.S. one, which would explain why the two objects have such different SEDs. We also note that the following Chandra and NuSTAR observations have been performed targeting the XMM-Newton–detected object. Finally, we used the Aladin web tool
14
to search for possible counterparts of the X-ray source, but none was identified in the optical images down to magnitudes RAB ∼ 22. As reported in Table 1, this observation was affected by strong flares, therefore the observation MOS (pn) net exposure time is of ∼9.5 ks (∼6.5 ks). - 2.The detection of an X-ray source in the XMM-Newton 2017 image allowed us to perform a search in the XMM-Newton archive aimed at finding other observations of the object. We find two such observations: the first one was taken in 2001, is 8 ks long, and targeted the pulsar PSR B1742-30 (also known as PSR J1745-3040; observation ID: 0103261301; PI: F. Jansen). In this observation, our source is found at an off-axis angle ∼10
 . We performed a cross-match between the X-ray coordinates of our target and the Australia Telescope National Facility (ATNF) Pulsar Catalog (Manchester et al. 2005).
15
The closest source to our X-ray target is indeed PSR B1742-30. Based on the information in the ATNF Pulsar Catalog, PSR B1742-30 is at an ∼200 pc distance from the Earth and has an estimated age of 546 kyr. While a displacement of (which is 0.6 pc) could be reasonably expected as a consequence of a pulsar kick, a pulsar that old would be expected to be accompanied by a bow-shock nebula at the pulsar position in X-rays, while the relic nebula left behind would not be as compact as the source that we observe either in the X-rays or in the 2FHL catalog. Furthermore, the pulsar E-dot as reported in the ATNF Pulsar Catalog is = 8.5×1033 erg s−1, a value significantly lower than those commonly measured in pulsars powering PWNe (∼1036 erg s−1; see, e.g., Mattana et al. 2009; Acero et al. 2013). We therefore conclude that the source we detect is likely not associated with the known pulsar PSR B1742-30, and would instead be a newly discovered pulsar.
. We performed a cross-match between the X-ray coordinates of our target and the Australia Telescope National Facility (ATNF) Pulsar Catalog (Manchester et al. 2005).
15
The closest source to our X-ray target is indeed PSR B1742-30. Based on the information in the ATNF Pulsar Catalog, PSR B1742-30 is at an ∼200 pc distance from the Earth and has an estimated age of 546 kyr. While a displacement of (which is 0.6 pc) could be reasonably expected as a consequence of a pulsar kick, a pulsar that old would be expected to be accompanied by a bow-shock nebula at the pulsar position in X-rays, while the relic nebula left behind would not be as compact as the source that we observe either in the X-rays or in the 2FHL catalog. Furthermore, the pulsar E-dot as reported in the ATNF Pulsar Catalog is = 8.5×1033 erg s−1, a value significantly lower than those commonly measured in pulsars powering PWNe (∼1036 erg s−1; see, e.g., Mattana et al. 2009; Acero et al. 2013). We therefore conclude that the source we detect is likely not associated with the known pulsar PSR B1742-30, and would instead be a newly discovered pulsar. - 3.More recently, in 2021, our X-ray source was serendipitously observed during a 23 ks observation of the Milky Way plane (observation ID: 0886010401; PI: G. Ponti). In this observation, the object we are studying is located at an off-axis angle ∼9.


Figure 3. XMM pn CCD 0.3–10 keV image, centered on the 2FHL J1745.1–3035 Fermi–LAT position. The black circle shows the LAT 90% confidence positional uncertainty ( ). The X-ray counterpart is uniquely detected within the LAT uncertainty region.
Download figure:
Standard image High-resolution imageFor all of the observations, the XMM-Newton standard data reduction procedure has been performed using the SAS software, version 19.0.0. To extract the source spectra, we used a circular region with radius rsrc = 20'', while the background spectra were extracted from a circle having radius rbkg = 45'' located in proximity to the source and visually inspected to avoid contamination from bright targets. Finally, given the different exposure times of the three observations, we adopted a different spectral binning for each of them: the 2001 and 2017 spectra are binned with 7 counts per bin, while in the 2021 observation, we binned the MOS spectra with 10 counts per bin and the pn spectrum with 15 counts per bin.
3.2. Chandra
2FHL J1745.1–3035 was observed in 2022 May with a ∼25 ks Chandra ACIS-I observation (PI: S. Marchesi). The data set, obtained by the Chandra X-ray Observatory, is contained in the Chandra Data Collection (CDC) cdc.191 doi:10.25574/cdc.191. We performed a standard data reduction using the CIAO software (Fruscione et al. 2006), version 4.14. We then followed the standard astrometric correction procedure reported in the Chandra threads
16
to correct the astrometry of our Chandra image by using as a reference the USNO-A2.0 astrometric standards catalog (Monet 1998). We find and apply offset corrections ΔR.A. = R.A.Chandra—R.A.USNO = 0 471 and Δdecl. = decl.Chandra —decl.USNO = 0278. We detect the Chandra counterpart of 4XMM J174507.9-303906 at the position R.A. = 17:45:08.03 and decl. = −30:39:06.76, just 07 away from the 4XMM source centroid.
In Figure 4, we report a zoom-in of 4XMM J174507.9-303906 in the Chandra 2–7 keV image (top left), in the smoothed XMM-Newton PN 2–10 keV image (top right), in the DSS2-red survey (bottom left; McLean et al. 2000) and in the UKIRT Infrared Deep Sky Survey (UKIDSS) DR11PLUS J, H, and K band survey (bottom left, center, and right; Warren et al. 2007). As can be seen, no clear counterpart of the X-ray source is detected in the optical, where the two closest targets to the X-ray source are two objects both classified as stars with 100% probability in the Gaia DR3 catalog (these GAIA sources are plotted as cyan circles in the figure). There are instead two faint near-infrared sources in the proximity (distance ≲1'') of the Chandra centroid, as reported in the UKIDSS–DR6 Galactic Plane Survey (Lucas et al. 2008). 17 We flag these sources as U1 (UKIDSS ID: J174507.94+429192822.5, HAB = 18.1 ± 0.2; KAB = 17.2 ± 0.2) and U2 (UKIDSS ID: J174508.02+429192824.8; KAB = 17.2 ± 0.2) in Figure 4. The faintness of these sources with respect to the X-ray brightness of our target, and the high source density of this field in the near-infrared (as a reference, there are 28 UKIDSS sources within a 10'' radius from the Chandra centroid) do not allow us to reliably associate either of the UKIDSS sources to the X-ray object.

Figure 4. Zoom-in of 4XMM J174507.9-303906 in the Chandra 2–7 keV image (top left), in the XMM-Newton PN 2–10 keV image (top center), in the DSS2-red survey (top right; McLean et al. 2000) and in the UKIDSS survey (bottom right; Skrutskie et al. 2006) J, H, and K bands (bottom left, center, and right, respectively). In the XMM-Newton image, we report the 4XMM catalog position of 4XMM J174507.9-303906. For visual clarity, we overlay the smoothed Chandra contours on the other images. The positions of two Gaia sources and two UKIDSS sources are also shown as cyan and red circles, respectively.
Download figure:
Standard image High-resolution imageWe used the CIAO tool specextract to extract the Chandra source spectrum from a circle having radius r = 3'' , while the background spectrum was extracted from a r = 25'' circular region located nearby the source. The Chandra spectrum was then binned with 10 counts per bin. In Section 4.3, we will investigate in detail the presence of extended emission in the Chandra image, and the subsequent implications on the nature of 2FHL J1745.1–3035.
3.3. NuSTAR
2FHL J1745.1–3035 was observed by NuSTAR in 2023 March. Our source is located in close proximity of the Galactic Center (longitude 358481127, latitude −0804527), which means that its NuSTAR observations are strongly affected by stray light (Grefenstette et al. 2021). This is clearly visible in Figure 5, where we also report the region files which we used to extract the source and background spectra, with a radius of 30'' and 45'', respectively. Despite its challenging location, the source is clearly detected in both NuSTAR cameras. Due to the high background, we binned the spectra with 75 counts per bin, to ensure an adequate signal-to-noise ratio.

Figure 5. NuSTAR FPMA (left) and FPMB (right) observations of 2FHL J1745.1–3035: the white circle marks the position of the Fermi–LAT source, and has a radius corresponding to the γ-ray 90% positional uncertainty (r = 54). As can be seen, stray light from the nearby Galactic Center is strongly affecting the observation; for this reason, the background region (dashed cyan circle) is selected as close as possible to the source (highlighted with a yellow circle), to ensure a background characterization as accurate as possible.
Download figure:
Standard image High-resolution image4. X-Ray Data Analysis and Interpretation
4.1. Single-epoch X-Ray Fits and Variability
We perform single-epoch fits to search for potential variability in flux and photon index, both commonly observed in the X-ray spectra of PWNe (e.g., Pavlov et al. 2001; Klingler et al. 2018; Guest & Safi-Harb 2020). In particular, X-ray variability in PWNe has already been observed over timescales that vary from months to several years (e.g., the PWN embedded in the SNR Kes 75; Ng et al. 2008; Livingstone et al. 2011; Reynolds et al. 2018), and it has been linked to physical processes in both the pulsar and the surrounding nebula. Such processes include synchrotron cooling of the PWN flow, resulting in a steepening of the X-ray photon index, or Kelvin–Helmoltz instabilities in the shocked winds (Pavlov et al. 2001).
We note that we also searched for short-term variability within the observations, but we did not find any significant evidence of it. Interestingly, the 2017 and 2021 XMM-Newton observations of 4XMM J174507.9-303906 are flagged as variable by the automatic pipeline used in the 4XMM catalog (https://xcatdb.unistra.fr/4xmmdr13/xcatindex.html?detid=107821706010001 for the 2017 observation and https://xcatdb.unistra.fr/4xmmdr13/xcatindex.html?detid=108860104010001 for the 2021 observation). However, we performed a multiband, multi-instrument analysis of the 2017 observation and found no evidence of simultaneous variability in the three XMM-Newton cameras (MOS1, MOS2 and PN) up to 6 keV. At energies greater than 6 keV, a flare is detected in all three cameras, but the same flare is still detected even at energies >10 keV, where the contribution from the source becomes negligible and the emission is dominated by the background. We thus conclude that, in the 2017 observation, the variability reported in the 4XMM catalog can be ascribed to an episode of high background activity that commonly affects XMM-Newton observations. As for the 2021 observation, we compared the MOS1, MOS2, and pn light curves in different bands and once again found no evidence of consistent cross-instrument variability. We report in Appendix B a summary of the light curves we produced for the 2017 and 2021 observations.
For each epoch of the X-ray observations, we fit the available data with an absorbed power-law model, where the column density of the absorber was left free to vary. Since sources nearby the Galactic Center have been shown to be potentially affected by dust scattering (see, e.g., Jin et al. 2018), we performed a consistency check by fitting our data a first time using the XSPEC XScat model (Smith et al. 2016), and then a second time using the standard photoelectric absorption model phabs. Since the results are fully equivalent, we report below those obtained using the standard phabs model.
When fitting XMM-Newton and NuSTAR observations, we also included cross-normalization constants to account for possible differences between different cameras. We also included in the model the absorption due to our own Galaxy, NH,Gal = 9.7 × 1021 cm−2 (Kalberla et al. 2005). The best-fit results for each epoch are reported in Table 2, while in Figure 6 we plot the best-fit photon index, line-of-sight column density, and 2–10 keV flux we measure in each epoch. The single-epoch spectra and the relative best-fit models are reported in Appendix A.

Figure 6. Best-fit X-ray photon index (left), line-of-sight column density (center), and 2–10 keV flux (right) for each of the five X-ray observations of 2FHL J1745.1–3035. All observations are fitted with an absorbed single-power-law model. Downward triangles are used when only a 90% confidence upper limit is measured.
Download figure:
Standard image High-resolution imageTable 2. Best-fit Results of the Single-epoch X-Ray Spectral Fits of 2FHL J1745.1–3035
| Instrument | Observation date | χ2/d.o.f. | Photon Index | NH,los | 2–10 keV flux |
|---|---|---|---|---|---|
| (UTC) | 1022 cm−2 | 10−12 erg s−1 cm−2 | |||
| XMM-Newton 1 | 2001-03-21 | 45.1/59 |

|

|

|
| XMM-Newton 2 | 2017-04-03 | 68.0/87 |

|

|

|
| XMM-Newton 3 | 2021-03-16 | 57.8/67 |

|

|

|
| Chandra | 2022-05-20 | 4.7/10 |

| <6.4 | <0.35 |
| NuSTAR | 2023-03-27 | 30.0/46 |

|

|

|
Note. All spectra are fitted with an absorbed single-power-law model, where NH,los is the line-of-sight column density of the absorber. χ2/d.o.f. is the reduced χ2 of the fit, where d.o.f. are the degrees of freedom. In the XMM-Newton (NuSTAR) data the 2–10 keV flux is computed from the pn (FPMA) data set.
Download table as: ASCIITypeset image
As can be seen, the photon index and line-of-sight column density do not vary significantly in the three XMM-Newton observations, as well as in the Chandra observation. In all cases, the X-ray photon index is significantly hard (varying in the range ΓX = [0.2–0.7]), and the X-ray emission is absorbed by material having column density NH,los∼4–6 ×1022 cm−2. The NuSTAR best-fit results are different: most importantly, we measure an X-ray photon index that is significantly softer than those measured by the 0.5–10 keV instruments, being ΓNuS = 1.99 . The fit to the NuSTAR data also gives a slightly larger line-of-sight column density than the one measured with Chandra and XMM-Newton, which is NH,los,Nus = 1.8
 ×1023 cm−2. Such a discrepancy can, however, be explained with the fact that NuSTAR lacks the <3 keV coverage that is key to reliably constrain line-of-sight column densities smaller than 1023 cm−2.
2FHL J1745.1–3035 shows some marginal evidence for flux variability in the 2–10 keV band. In particular, the 2022 Chandra and the 2023 NuSTAR data are ∼50% fainter than the three XMM-Newton observations taken between 2001 and 2021. However, the relatively large uncertainties on the flux measurements prevent us from studying this tentative trend in further detail. We also note that, in the γ-rays, no information on source flux variability is reported in the 2FHL catalog. There is also no observational evidence for flux variability in the 4FGL source associated with the H.E.S.S. survey and reported in the Fermi–LAT data release 3 catalog (DR3, Abdollahi et al. 2022), which is an incremental version of the 4FGL catalog published in 2020 and is based on the first 12 yr of Fermi–LAT observations between 50 MeV and 1 TeV. Specifically, the source variability index (computed as the sum of the log(likelihood) difference between the flux fitted in each time interval and the average flux over the full catalog interval) is 5.1. As a reference, a value greater than 18.48. 18 over 12 intervals indicates <1% chance of being a steady source.
4.2. Joint X-Ray Spectral Fit
Since we did not find any significant line-of-sight column density variability between the four soft X-ray observations, we jointly fit all X-ray spectra by tying this parameter among the different observations. Since we instead found evidence for potential X-ray flux variability, we added to the model a cross-normalization component to take this intrinsic variability into account. We then first fit the spectra with the same absorbed power-law model we used in the single-epoch analysis.
We measure a photon index ΓX = 1.53 and a line-of-sight column density NH,los = 9.9
 ×1022 cm−2. We report in Figure 7, left panel, the single-power-law best-fit model; significant residuals are visible in the ratio between the model and the data above 10 keV. Furthermore, as expected, the best-fit photon index we measure lies between the values we obtain in the soft X-rays (ΓX ∼ 0.5, as shown in Table 2) and the value measured using NuSTAR, ΓX = 1.99
 .
.

Figure 7. Multi-epoch X-ray spectra of 2FHL J1745.1–3035: the 2001, 2017, and 2021 XMM-Newton observations are plotted in orange, red, and cyan, respectively; the 2022 Chandra observation is plotted in green; the 2023 NuSTAR observation is plotted in blue. The best-fit models (left, single power law; right, broken power law) are plotted as black solid lines. Residuals above 10 keV are clearly visible in the single-power-law best-fit model, while a significant improvement is visible in the broken-power-law fit.
Download figure:
Standard image High-resolution imageGiven this observational evidence, we performed a new fit, this time using a broken-power-law model: notably, the presence of a break at ∼5–15 keV in the X-ray spectra of PWNe has been reported in several works (see, e.g., An et al. 2014; Nynka et al. 2014; Madsen et al. 2015, 2020; An 2019; Bamba et al. 2022). Such a variation in ΓX is an intriguing challenge to our understanding of PWN emission mechanisms, since PWNe SED models do not properly fit such an X-ray feature (see, e.g., Tanaka & Takahara 2011). Consequently, additional model components, such as for example different electron injection spectra or radially dependent PWN parameters would be required.
The parameterization of the broken-power-law is

Where Γ1 and Γ2 are the low- and high-energy photon indices, K is the normalization parameter, and Eb is the energy of the break.
The results of this fit are reported in Figure 7, right panel. As it can be seen, the data are much better constrained across the whole energy range, and in particular at energies E>10 keV. We also measure a significant improvement in the fit, from χ2/d.o.f. = 248.1/264 for the single-power-law model to χ2/d.o.f. = 217.0/262 for the broken-power-law model. The photon index at energies lower than the break is Γ1 = 0.56 , in good agreement with the photon indices we measured in the Chandra and XMM-Newton spectra, while the second photon index is Γ2 = 1.87
 , a value consistent with the one measured in the NuSTAR spectra. Coherently, the best-fit break energy is Eb = 7.1
 keV, which is where the NuSTAR contribution becomes the dominant one. In Figure 8, we report the confidence contours of the break energy as a function of both photon indices: Γ1 and Γ2 are different at the >99% confidence level, a result that further favors the broken-power-law scenario over the single-power-law scenario. We also note that the best-fit column density obtained with the broken-power-law fit, NH,los = 5.1
 ×1022 cm−2, is significantly larger than the one expected on the line of sight from the neutral Hydrogen measurements by (Kalberla et al. 2005, NH,Gal = 9.7 × 1021 cm−2). Such a result supports a scenario where the X-ray emission is taking place in a dense, gas-rich environment.

Figure 8. The 68% (solid line), 90% (dashed line), and 99% confidence levels for the broken-power-law energy break as a function of the photon index before the break, Γ1 (red), and of the photon index after the break, Γ2 (blue).
Download figure:
Standard image High-resolution imageFinally, as a consistency check, and in particular to partially rule out an SNR origin for 2FHL J1745.1–3035, we fitted our data with the nei nonequilibrium ionization collisional plasma model, which is commonly used when modeling the X-ray spectra of SNRs (see, e.g., Harrus et al. 2001; Lazendic & Slane 2006; Katsuda et al. 2009; Prinz & Becker 2013; Leahy et al. 2020; Eagle et al. 2022). We report the best-fit results in Table 3: while the best-fit statistic (χ2/d.o.f. = 225.3/262) is significantly better than the one obtained using the single-power-law model, and fairly consistent with the one we obtain using the broken-power-law model, the best-fit temperature (kT = 34.4 keV) is fully unphysical. As a reference, Leahy et al. (2020) analyzed the X-ray spectra of 43 SNR of different ages, explosion energies, and circumstellar medium densities: none of them was found having kT ≥ 4 keV. Such a result reliably rules out a thermal SNR scenario for 2FHL J1745.1–3035.
Table 3. Best-fit Results of the Multi-epoch X-Ray Spectral Fits of 2FHL J1745.1–3035, for the Three Different Models Discussed in the Text
| Model | χ2/d.o.f. | NH,los | Γ1 | Γ2 | Eb | kT | τ | Z |
|---|---|---|---|---|---|---|---|---|
| 1022 cm−2 | keV | keV | 1010 s cm−3 | Z⊙ | ||||
| Single Power Law | 248.1/264 |

|

| ⋯ | ⋯ | ⋯ | ⋯ | ⋯ |
| Broken Power Law | 217.0/262 |

|

|

|

| ⋯ | ⋯ | ⋯ |
| nei | 225.3/262 |

| ⋯ | ⋯ | ⋯ |

| <5.95 |

|
Note. χ2/d.o.f. is the reduced χ2 of the fit, where d.o.f. are the degrees of freedom; NH,los is the line-of-sight column density of the absorber; Γ1 is the photon index of the single-power-law model, and the photon index before the break of the broken-power-law model; Eb and Γ2 are the energy break and the photon index at energies larger than it in the broken-power-law model, respectively; finally, kT, τ, and Z are the best-fit temperature, ionization timescale, and metallicity, derived using the nei thermal model.
Download table as: ASCIITypeset image
4.3. Chandra Spatially Resolved Analysis
The X-ray counterpart of 2FHL J1745.1–3035 does not show clear evidence for extended emission in the NuSTAR image or in the XMM-Newton images, which implies that the X- and γ-ray emitter must be compact. Extended PWN emission is however commonly observed with Chandra, and indeed a first visual evidence is visible in our Chandra ACIS-I observation as well. As shown in the top panels of Figure 9, both the unbinned Chandra image and the smoothed one present evidence for asymmetric extended emission, with a faint tail of emission detected southward of the source center.

Figure 9. (Top panels) Unbinned (left) and smoothed (center) Chandra ACIS-I 2–7 keV image of 2FHL J1745.1–3035. In both images, we plot a circle centered on the brightest pixel and having a radius corresponding at the Chandra ACIS on-axis 90% encircled energy fraction (098). (Bottom panels) On the left we show the surface brightness of our target (red) as a function of the radius; for comparison, we also show the expected trend for the Chandra PSF (blue), normalized so that, in the first bin, the PSF surface brightness is equal to the measured brightness as well as the average background surface brightness (dashed black line); the error bars represent the Poissonian error of the counts inside each annulus. On the right, we report a smoothed tricolor (red: 0.5–2 keV; green: 2–4.5 keV; blue: 4.5–7 keV) image of 2FHL J1745.1–3035. The fainter, diffuse emission is found to be softer than the central, unresolved emission.
Download figure:
Standard image High-resolution imageTo quantitatively search for extended emission in 2FHL J1745.1–3035, we perform a comparison between the 2–7 keV surface brightness radial distribution and the one obtained from a simulated PSF in the same band, computed using the ChaRT and MARX 5.5.1 tools (see e.g., Fabbiano et al. 2017; Jones et al. 2020; Ma et al. 2020; Traina et al. 2021; Silver et al. 2022, for a detailed description of this same approach in nearby active galactic nuclei). We report in Figure 9, bottom left panel, the 2–7 keV surface brightness radial profile of 2FHL J1745.1–3035, which we computed from a set of 11 annuli, where the two radii increase by 05 in each consecutive annulus, and the maximum external radius is 65, and the corresponding expected PSF profile which one would observe for a point-like source. As it can be seen, this quantitative analysis confirms the first qualitative impression, since the source surface brightness exceeds the one predicted for a point-like scenario up to ∼5''. As a caveat, we note that it has been shown (Primini et al. 2011), that that the ray tracing simulations generated by MARX will have a roughly correct total intensity but tend to have PSF wings that are broader than observations and a PSF core narrower than observed, an effect that could in principle affect our simulation as well.
Finally, the low count statistic of the Chandra spectrum prevents us from performing an energy-dependent surface brightness profile, as well as a spatially resolved spectral fit. Nonetheless, a simple tricolor image such as the one we report in Figure 9, bottom right panel, gives a first indication of the presence of two distinct sources of emission: a harder, unresolved one at the center (likely the pulsar) and a fainter, softer diffuse emission in the outskirts (in our scenario, the pulsar wind nebula). We note that Li et al. (2008) analyzed the Chandra and XMM-Newton spectra of a sample of pulsars and PWNe, and found tentative evidence for both direct correlation between the X-ray photon index of the pulsar and its age (i.e., younger pulsars have harder photon indices) and anticorrelation between the PWN photon index and the pulsar age (i.e., younger PWNe have softer photon indices). Both these trends support a young PWN scenario for 2FHL J1745.1–3035, based on the tentative observational evidence we find in the Chandra image.
5. Spectral Energy Distribution Modeling and Physical Characterization
In order to investigate the origin of the observed high-energy emission, we use the NAIMA Python package (v0.10.0, Zabalza 2015), which computes the radiation from a single nonthermal relativistic particle population. For the particle distribution in energy, we assume a power-0law shape with an exponential cutoff,

We then test a combination of free parameters (namely the normalization A, index α, and energy cutoff Ec) that can best explain the broadband spectrum. We consider three photon fields in all Inverse Compton Scattering calculations in this section, the Cosmic Microwave Background (CMB), a near-infrared (NIR) and a far-infrared (FIR) stellar photon field, set to the GALPROP values measured from a Galactic radius of 6.5 kpc.
Due to the complex γ-ray emission detected in this region, it is plausible that there is source confusion from more than one object generating the observed γ-rays (as discussed in Section 2 and visually shown in Figure 1). Indeed a reasonable broadband representation for the X- and γ-ray data requires more than one particle population and the predicted properties depend on the dominant γ-ray spectral properties we assume. We are unable to determine the presence or level of contribution from low- and high-energy components using the γ-ray data alone, so we explore two combinations of data for modeling: (1) radio, X-ray, and γ-ray data assuming the extended 4FGL and H.E.S.S. sources are the dominant γ-ray counterparts and (2) combine the same radio and X-ray data to the point-like 2FHL data. We assume two scenarios of particle distributions in each case: two-leptonic populations or a lepto-hadronic population. In an effort to constrain radio synchrotron contributions, we estimate an upper limit on the radio flux from the 1.28 GHz MEERKAT Galactic Center radio observation. 19 We discuss the results of the broadband modeling in the following sections. The model parameters that can best reproduce the two data combinations are provided in Table 4.
Table 4. Summary of the Best-fit Model Parameters for the Models Displayed in Figure 11 (4FGL+H.E.S.S.) and 10 (2FHL)
| 4FGL+H.E.S.S. | Two-leptonic | Lepto-hadronic |
|---|---|---|
We or  (erg) (erg) | 4.5 × 1044 1.6 × 1048 | We = 4.5 × 1044 Wp = 6.2 × 1050 |
| nH (cm−3) | − − | − 5000 |
αe or 
| 1.0 1.4 | αe = 1.0 αp = 2.4 |
Ee,c
or  (TeV) (TeV) | 794 3.63 | Ee,c = 794 Ep,c = 71.0 |
| Bd (μG) | 37.7 0.145 | 37.7 |
| 2FHL | Two-leptonic | Lepto-hadronic |
We or  (erg) (erg) | 1.5 × 1046 1.1 × 1048 | We = 4.5 × 1044 Wp = 2.1 × 1048 |
| nH (cm−3) | − − | − 400 |
αe or 
| 1.9 1.3 | αe = 1.0 αp = 1.9 |
Ee,c
or  (TeV) (TeV) | 617 22.4 | Ee,c = 794 Ep,c = 71.0 |
| Bd (μG) | 3.0 0.25 | 37.7 |
Note. The maximum particle energy is fixed to 2 PeV in all cases. a The total particle energy for electrons We or protons Wp, b the index for electrons αe or protons αp, c the cutoff energy for electrons or protons.
Download table as: ASCIITypeset image
5.1. Leptonic Scenario
In the case of two-leptonic particle distributions, the radio–X-ray–2FHL data combination is reasonably reproduced (as shown in the left panel of Figure 10), while no combination of parameters can adequately describe the SED composed by the radio, X-ray, 4FGL, and H.E.S.S. data and, in particular, the 4FGL data (Figure 11, left panel). This is due to the very low radio flux upper limit that forces the electron index to be harder than what is inferred by the 4FGL data (∼2). Introducing another fitting parameter such as the index to the energy cutoff (i.e., an index after the break deviating from the assumed value of 1 here) may be able to reconcile the poor fitting in the Fermi band. An index after the cutoff that is smaller than 1, for instance, would soften the cutoff shape in the synchrotron peak for the low-energy population (Population 1 in left panel of Figure 11). A final possibility would be that the particle population is more complicated than what is explored here.

Figure 10. Broadband representations for the radio, X-ray, and 2FHL γ-ray data combination. (Left) Best-fit broadband model for the leptonic scenario. Radio data is taken from Heywood et al. (2022), X-ray data is from this work, and Fermi–LAT data from Ackermann et al. (2016), Ajello et al. (2017). (Right) Best-fit broadband model for the lepto-hadronic scenario.
Download figure:
Standard image High-resolution image
Figure 11. Broadband representations for the radio, X-ray, 4FGL, and H.E.S.S. γ-ray data combination. (Left) Best-fit broadband model for the leptonic scenario. Radio data is taken from Heywood et al. (2022), X-ray data is from Section 4.2, Fermi–LAT data from Abdollahi et al. (2022), and H.E.S.S. from H.E.S.S. Collaboration et al. (2018). (Right) Best-fit broadband model for the lepto-hadronic scenario.
Download figure:
Standard image High-resolution imageAs mentioned above, the radio, X-ray and 2FHL γ-ray data combination is instead reasonably reproduced by the two-leptonic model (left panel of Figure 10). Assuming the two-leptonic scenario for both data combinations, the predicted properties are consistent with an energetic, young, and/or more evolved PWN where the extended 4FGL and H.E.S.S. γ-ray data may be an extended relic PWN and the point-like 2FHL emission may be a compact, young PWN located close to the pulsar.
5.2. Lepto-hadronic Scenario
In order to explore a hadronic scenario to the broadband data, we fit a pion decay-emission model to characterize the GeV and TeV data together combined with the previously derived leptonic component to characterize the radio and X-ray data. As shown in the right panels of Figures 11 and 10, both data combinations are adequately characterized in the lepto-hadronic scenario, and in particular we are now able to efficiently describe the SED including the 4FGL data, something that could not be done with a purely leptonic model.
We note that the fits to both data sets require very large target densities: more specifically, nH = 5000 cm−3 in the 4FGL+H.E.S.S. data set and nH = 400 cm−3 in the 2FHL data set. The high nH values are a requirement if the total proton energy Wp is not to exceed the total energy expected to be released from a typical supernova (SN) explosion  erg. Even for the highest estimate nH = 5000 cm−3 which characterizes the 4FGL+H.E.S.S. data, Wp ∼ 6 × 1050 erg challenges a hadronic γ-ray origin. However, both nH and Wp may be smaller if there is a significant contribution from nonthermal bremsstrahlung emission (true for both data combinations). A similar representation is presented in Bamba et al. (2009), showing that nonthermal bremsstrahlung radiation can dominate the high-energy emission.
In summary, the SED fitting analysis shows that the two-leptonic model efficiently describes the radio, X-ray, and 2FHL γ-ray data combination, and in particular provides the most accurate modelization of the 2FHL γ-ray spectrum. On the other hand, the lepto-hadronic representation more efficiently describes the radio, X-ray, and 4FGL+H.E.S.S. extended γ-ray emission, as shown in the right panel of Figure 11, under the condition that the ambient particle density is high, nH = 5000 cm−3. We discuss the implications for the best-fit models in more detail in the following section.
5.3. Model Interpretation
In the previous sections, we attempted to determine the most likely origin of the unique and puzzling high-energy source 2FHL J1745.1–3035 through detailed broadband modeling. We tested two data combinations assuming two energetic scenarios: (1) the 4FGL+H.E.S.S. extended γ-ray data is related to the point-like X-ray source or (2) the point-like 2FHL γ-ray data is related to the point-like X-ray source. In the previous sections, we determined that the most favorable models correspond to the lepto-hadronic model for the 4FGL+H.E.S.S. data set, while a two-leptonic model can better characterize the 2FHL data set.
The lepto-hadronic model accurately characterizes the source responsible for the 4FGL+H.E.S.S. observations, requiring a large target proton density nH = 5000 cm−3. If the distance assumed to the source corresponds to the one reported in Bamba et al. (2009), which is d = 8.5 kpc, then 2FHL J1745.1–3035 is likely located within the Galactic Center and thus among dense molecular material. In fact, HESS J1745–303 is spatially coincident with a molecular cloud (Aharonian et al. 2008) consistent with the estimate nH = 5000 cm−3, making this scenario plausible.
The two-leptonic model best characterizes the emission responsible for 2FHL observations and infers a magnetic field strength that is low compared to the average value for the ISM (∼2 μG, Han & Qiao 1994). If we assume that all of the considered data are associated in some way, a depicted scenario is one where the extended γ-ray emission (4FGL+H.E.S.S.) represents an older, diffuse, and softer spectral component whereas the point-like γ-ray emission (2FHL) represents a younger, more compact, and harder spectral component. This type of energy-dependent morphology is often observed in evolved PWNe (e.g., Aharonian et al. 2006; H.E.S.S. Collaboration et al. 2012), but could also be explained by an energetic distant SNR where the highest energy particles have already escaped and are diffusing into the ambient medium (e.g., Eagle et al. 2020). Another possible explanation includes both PWN and SNR contributions, whether they are components of the same system or not. We remark that the models do not consider any electron-to-proton ratio, acknowledging the possibility the emission may be coming from separate, unrelated sources.
A final scenario that would be compatible with the hard X-ray spectrum we measure is a compact accreting binary system where the compact object, either a neutron star or black hole, is accreting material from a stellar companion. SS 433 represents the most well-known example of such a system and is detected from radio to TeV γ-rays with extended emission originating from the outflowing jets of the accreting compact object (HAWC Collaboration et al. 2018). Accreting compact binary systems like SS 433 can be extremely luminous in the X-ray band (≳1039 erg s−1), indicating the the total jet power is much higher (Sudoh et al. 2020). The X-ray spectrum is often modeled as synchrotron emission as in the case for SS 433 (Safi-Harb et al. 2022), and can dominate over the Inverse Compton emission if the magnetic field strength is sufficiently high. Last, the X-ray emission of these systems can be variable on the timescales of days to hours. The lack of both a clear optical counterpart and of significant X-ray variability overt timescales of hours (i.e., within each observation) are however two elements that make this scenario less likely with respect to the compact PWN one.
While the models presented above provide the best representations to the broadband data, there are other limitations to be considered. The most uncertain assumption is the distance used for the modeling, which we assumed to be the same distance reported in Bamba et al. (2009) for the H.E.S.S. source, which is d = 8.5 kpc. It is possible the source generating the observed emission is closer, which would enable lower target densities and lower total particle energies. Second, other particle distributions and hence properties are possible. An alternative broadband representation includes a nonthermal bremsstrahlung component that yields reasonable results (Bamba et al. 2009). Finally, we note that a single population (leptonic or hadronic) cannot explain the broadband data without far exceeding 1051 erg in total particle energies at a distance of 8.5 kpc.
We remark that 2FHL J1745.1–3035 is unlikely to be of extragalactic origin based on the source selection from the 2FHL catalog, as discussed in Section 1. The spectral index for this source at energies above 50 GeV is much harder than the average spectral index observed for blazars above 50 GeV. Furthermore, 2FHL J1745.1–3035 is located along the Galactic plane and is potentially associated with significant extended GeV and TeV emission (4FGL and H.E.S.S. counterparts). Based on this evidence, we conclude that the most plausible scenario for 2FHL J1745.1–3035 is to be the descendant of a Galactic supernova explosion such as a PWN, SNR, or neutron star or black hole with a stellar companion, but current observations and the presented models prevent us from firmly establishing an origin.
6. Summary and Conclusions
In this paper, we studied the X- and γ-ray properties of 2FHL J1745.1–3035, a very high-energy Galactic emitter originally detected by the Fermi–LAT at energies >50 GeV. The object 2FHL J1745.1–3035 has a very hard γ-ray spectrum, with photon index above 50 GeV Γγ
= 1.2 ± 0.4, and is found to be a TeV emitter by the Fermi–LAT. A multi-observatory X-ray campaign with XMM-Newton, Chandra, and NuSTAR allowed us to reliably locate the counterpart of 2FHL J1745.1–3035 and study its properties. The source broadband X-ray spectrum is best fitted with a broken-power-law model with break energy Eb∼7 keV. The X-ray spectrum is very hard before the break, having photon index ΓX,1 = 0.6 ± 0.4, while it becomes significantly softer at higher energies, with ΓX,2 = 1.9 . The X-ray source is compact, with no evidence for extension in the XMM-Newton and NuSTAR images. However, the subarcsecond Chandra angular resolution allowed us to detect significantly extended emission up to a scale of ∼5''.
We report below the main results of our analysis.
- 1.The X-ray analysis favors a compact PWN origin for 2FHL J1745.1–3035. If this is confirmed, it would be one of the hardest PWNe ever detected in the X-rays and the hardest ever detected in the γ-rays (see Figure 5 in Kargaltsev et al. 2013). Perhaps the only other Galactic source observed to have such a hard X-ray spectrum is the Crab (e.g., Madsen et al. 2015; Zanin 2017), where the spectrum is associated with synchrotron radiation as in the case developed here for 2FHL J1745.1–3035.
- 2.The multiband observational evidence, and in particular the X-ray one, could be linked to the presence of a young nebula (t ≲ 103 yr). In fact, both the cutoff and the normalization of the synchrotron spectral curve depend on the magnetic field strength, and the final emission spectrum depends on a combination of the injected particle spectrum, the losses sustained by the population of previously injected particles and the system evolution. Due to these effects, the peak of the synchrotron curve drops in time from roughly 1 MeV at very early times to 1–10 keV when the reverse shock finally crushes the nebula (see, e.g., Gelfand et al. 2009). At the present day, Fermi–LAT has detected almost only old PWNe (e.g., Acero et al. 2013), thus making 2FHL J1745.1–3035 uniquely interesting. However, we also note that the TeV to X-ray luminosity ratio for this source is ∼5 and is expected to increase with time (Mattana et al. 2009; Kargaltsev et al. 2013). Some of the youngest PWNe/SNRs have ratios ≲2 while older systems have ratios >2 (Yamazaki et al. 2006), but the value can vary depending on the system and environment conditions.
- 3.The PWN scenario is also supported by the lack of short-term variability in the single-epoch observations, which is expected if a source is indeed a PWN, while variability might be observed in other classes of compact, X-ray-emitting Galactic sources, such as X-ray binaries or cataclysmic variable stars. We note that no observational evidence for a pulsar is reported in the literature for the 4FGL source; in particular, a blind pulsation search was performed by Hui et al. (2011) on the first 29 months of Fermi–LAT observations, but no clear evidence for periodicity was detected.
- 4.The broadband SED fitting we performed supports a scenario where the compact X-ray source is linked to the 2FHL target and is well fitted by a two-leptonic model, while the 4FGL+H.E.S.S. source requires the presence of an hadronic component to be efficiently modeled. These results are consistent with a scenario where the extended γ-ray emission (4FGL+H.E.S.S.) represents an older, diffuse, and softer spectral component whereas the point-like γ-ray emission (2FHL) represents a younger, more compact, and harder spectral component.
- 5.Given its TeV emitter nature, 2FHL J1745.1–3035 represents an ideal follow-up target for the upcoming Cherenkov Telescope Array (CTA; Acharya et al. 2013; Cherenkov Telescope Array Consortium et al. 2019). CTA will have an ∼2 times better angular resolution and an ∼5 times flux sensitivity than H.E.S.S. at 1 TeV (Cherenkov Telescope Array Consortium et al. 2019), and is therefore expected to resolve into individual point sources at least a fraction of the diffuse emission detected by H.E.S.S.. The study of the Galactic Center region is one of the Key Science Programs of the CTA Observatory and, in particular, 2FHL J1745.1–3035 will be covered by the planned 300 hr Extended Survey. Furthermore, recent preparatory studies for the ASTRI (Astrofisica con Specchi a Tecnologia Replicante Italiana) Mini-Array Observatory (Vercellone et al. 2022) suggest that observations at ∼100–300 TeV can provide important information on the emission processes in young, powerful PWNe and, in particular, can put strong constraints on the presence (or lack of) a hadronic component.
In summary, all the observational evidence shows 2FHL J1745.1–3035 is a rare Galactic Fermi–LAT source, having the hardest γ-ray photon index in the 2FHL sample and an impressively hard X-ray photon index. Combining all of this evidence hints at a scenario where 2FHL J1745.1–3035 could be a newly detected, young PWN system.
The unique properties of this target make it an ideal source for follow-up campaigns with facilities looking at the TeV sky, first and foremost CTA. Furthermore, deeper Chandra observations would allow one to perform a multiregion X-ray spectral fit to obtain a radial profile of the X-ray photon index and flux, which, if confirmed to be a PWN, could be used to test different PWN emission models to estimate properties such as the age (see, e.g., Tibaldo et al. 2017).
Acknowledgments
This research has made use of the NuSTAR Data Analysis Software (NuSTARDAS) jointly developed by the ASI Space Science Data Center (SSDC, Italy) and the California Institute of Technology (Caltech, USA). This work makes use of Matplotlib (Hunter 2007) and NumPy (Harris et al. 2020). This work has made use of data from the European Space Agency (ESA) mission Gaia (https://www.cosmos.esa.int/gaia), processed by the Gaia Data Processing and Analysis Consortium (DPAC, https://www.cosmos.esa.int/web/gaia/dpac/consortium). Funding for the DPAC has been provided by national institutions, in particular the institutions participating in the Gaia Multilateral Agreement. This publication makes use of data from the UKIRT Infrared Deep Sky Survey (UKIDSS). The UKIDSS project is defined in Lawrence et al. (2007). UKIDSS uses the UKIRT Wide Field Camera (WFCAM; Casali et al. 2007). The photometric system is described in Hewett et al. (2006) and the calibration is described in Hodgkin et al. (2009). The pipeline processing and science archive are described in Hambly et al. (2008). We thank Patrick Slane for the useful conversation and suggestions. S.M. acknowledges financial support from the European Union—Next Generation EU under the project IR0000012—CTA+ (CUP C53C22000430006), announcement N.3264 on 28/12/2021: "Rafforzamento e creazione di IR nell'ambito del Piano Nazionale di Ripresa e Resilienza (PNRR)". A.D. is thankful for the support of the Ramón y Cajal program from the Spanish MINECO, Proyecto PID2021-126536OA-I00 funded by MCIN/AEI/10.13039/501100011033, and Proyecto PR44/2129915 funded by the Santander Bank and Universidad Complutense de Madrid.
Appendix A: Single-epoch X-Ray Spectra
In this Appendix, we report in Figure 12, the single-epoch X-ray spectra of 2FHL J1745.1–3035. The best-fit models are obtained by fitting the data with an absorbed power law, as discussed in Section 4.1.

Figure 12. Single-epoch X-ray spectra of 2FHL J1745.1–3035. In the XMM-Newton observations, MOS1, MOS2, and pn spectra are plotted in black, red, and green, respectively; in the NuSTAR observations, FPMA and FPMB spectra are plotted in black and in red, respectively. The best-fit model from an absorbed power law is plotted as a solid line.
Download figure:
Standard image High-resolution imageAppendix B: Light Curves of the 2017 and 2021 XMM-Newton Observations
We report in this Appendix, in Figure 13, the XMM-Newton light curves in the 2–4, 4–6, and 6–10 keV, for the 2017 and 2021 observations of 4XMM J174507.9-303906. We derived these light curves directly from the data. As can be seen, differently to what is reported in the 4XMM catalog, no clear evidence of cross-instrument variability is visible in the 2021 observations; as for the 2017 observation, significant variability is detected only at energies >6 keV and can be attributed to a strong background flare.

Figure 13. XMM-Newton light curves in the 2–4 keV (top panels), 4–6 keV (center), and 8–10 keV band (bottom) for the 2017 (left) and 2021 (right) observations of 4XMM J174507.9-303906. MOS1 data-points are plotted in blue, MOS2 in red, and PN in cyan. The MOS1 and MOS2 light curves have been rescaled so that their average value matches the pn one.
Download figure:
Standard image High-resolution image
Footnotes
- 11
The brightest being 2FHL J1703.4–4145, which was already analyzed in Eagle et al. (2020).
- 12
The association procedure is based on a statistical Bayesian cross-correlation of a γ-ray catalog with other catalogs, as explained in detail in Ackermann et al. (2016).
- 13
- 14
- 15
The updated catalog is available at http://www.atnf.csiro.au/research/pulsar/psrcat/
- 16
- 17
- 18
Such a value corresponds to a 99% confidence level in a χ2 distribution with seven degrees of freedom, see Abdollahi et al. (2020)
- 19