


Abstract
We present the first systematic search for UV signatures from radio source-driven active galactic nuclei (AGN) feedback in Compact Steep Spectrum (CSS) radio galaxies. Owing to their characteristic sub-galactic jets (1–20 kpc projected linear sizes), CSS hosts are excellent laboratories for probing galaxy scale feedback via jet-triggered star formation. The sample consists of seven powerful CSS galaxies, and two galaxies host to radio sources >20 kpc as the control, at low to intermediate redshifts (z < 0.6). Our new Hubble Space Telescope images show extended UV continuum emission in six out of seven CSS galaxies, with five CSS hosts exhibiting UV knots cospatial and aligned along the radio-jet axis. Young (≲ 10 Myr), massive (≳ 5 M⊙) stellar populations are likely to be the dominant source of the blue excess emission in radio galaxies at these redshifts. Hence, the radio-aligned UV regions could be attributed to jet-induced starbursts. Lower near-UV star formation rates compared to other indicators suggest low scattered AGN light contribution to the observed UV. Dust attenuation of UV emission appears unlikely from high internal extinction correction estimates in most sources. Comparison with evolutionary synthesis models shows that our observations are consistent with recent (∼1−8 Myr old) star-forming activity likely triggered by current or an earlier episode of radio emission, or by a confined radio source that has frustrated growth, due to a dense environment. While follow-up spectroscopic and polarized light observations are needed to constrain the activity-related components in the observed UV, the detection of jet-induced star formation is a confirmation of an important prediction of the jet feedback paradigm.
Export citation and abstract BibTeX RIS

Original content from this work may be used under the terms of the Creative Commons Attribution 4.0 licence. Any further distribution of this work must maintain attribution to the author(s) and the title of the work, journal citation and DOI.
1. Introduction
Galaxies hosting powerful radio-luminous active galactic nuclei (AGN) are known to be profoundly affected by the extreme energy output of their central supermassive black hole (SMBH) engines (as reviewed by Alexander & Hickox 2012; Fabian 2012; Harrison 2017; Morganti 2017; Cresci & Maiolino 2018; Heckman & Best 2023). From a theoretical standpoint, quenching of star formation by energy feedback from AGN is needed to halt galaxy growth, to produce the observed galaxy luminosity function (e.g., Benson et al. 2003; Croton et al. 2006) as well as to explain the strong correlations that exist between SMBH masses and the mass, luminosity, and stellar velocity dispersions of galaxy bulges (e.g., Fabian 2012; King & Pounds 2015). Observationally, there is a wealth of evidence that SMBH activity affects the interstellar medium (ISM) of the host galaxy. Powerful radio galaxies at high redshifts (z ≥ 0.6) exhibit emission-line regions cospatial with radio emission and optical/UV continuum elongated and aligned along the radio source direction (e.g., McCarthy 1993; Best et al. 1996, 1997, 2000; Blundell et al. 1999; Inskip et al. 2005), providing a strong argument in favor of AGN feedback. On kiloparsec scales, outflows from the AGN may directly impact host galaxy evolution by influencing the formation of new stars. It has been argued that energetic AGN outflows give rise to regulating mechanisms that could potentially extinguish star-forming activity (negative feedback). In high accretion rate quasars, radiation-driven winds, and outflows could heat the surrounding gas, leading to suppression of cooling and star formation (e.g., Cano-Díaz et al. 2012; King & Pounds 2015; Tombesi et al. 2015). In the low-power accretion regime, radio jet emission dominates feedback and kinetic energy of the jet plasma drives the expulsion and/or heating of ambient gas from the galaxy core (e.g., Nesvadba et al. 2008; McNamara & Nulsen 2012). But in addition to the inhibitive mechanisms, AGN emission is also expected to boost star formation (positive feedback) in the host. Theoretical models and simulation studies have predicted shock-driven enhancement of starburst activity in the vicinity of the radio jets (Begelman & Cioffi 1989; Rees 1989; Tortora et al. 2009; Gaibler et al. 2012; Dugan et al. 2014, 2017; Fragile et al. 2017; Gardner et al. 2017) and radiative outflows (King 2005; Ishibashi & Fabian 2012; Silk 2013; Dugan et al. 2017). Observational evidence of this effect on sub-galactic scale has been limited regarding both quasar-mode (Cresci et al. 2015a, 2015b; Carniani et al. 2016) and radio-mode (Salomé et al. 2015; Santoro et al. 2015; Zovaro et al. 2020) processes, but has been growing with the advent of integral field studies of active galaxies at higher redshifts, where strong impacts of feedback are expected. The emerging picture from recent works suggests that AGN jets and outflows might be playing a double role—providing negative feedback as a fundamental large-scale mechanism that shapes the growth of an SMBH and the host, with the starburst-enhancing positive feedback acting locally and/or in episodes that occur at short timescales of a few megayears (e.g., Cresci et al. 2015b; Mukherjee et al. 2018; Tamhane et al. 2023). However, suppression of new star formation, while inferred from thermal and kinematic properties of the ISM gas, is not straightforward to observe without comparative analysis with a control sample. Feedback-induced star-forming regions, on the other hand, are expected to show a direct association with the jet emission. Hence, the detection of the theoretically predicted star formation along radio sources will be strong evidence in support of the AGN feedback paradigm.
The main objective of this work is a search for positive feedback signatures in hosts of compact, sub-galactic scale radio sources, likely representing an early stage in FRI/FRII radio source expansion. Compact Steep Spectrum (CSS) sources, Giaghertz-peaked Spectrum (GPS) sources, and High-frequency Peakers (HFP)—collectively called Peaked Spectrum (PS) sources, along with compact symmetric objects (CSOs) populate the young (or possibly, short-lived) radio source category (see O'Dea & Saikia 2021 for a review). These small yet powerful radio sources present excellent laboratories for radio-mode feedback since the interaction of the expanding radio source with the surrounding ISM is likely to be most vigorous in this infancy phase. As the galaxy-sized nuclear jets push through dense ambient medium, they drive a powerful bow shock at velocities of ∼103 km s−1 through the surrounding gas clouds (Bicknell et al. 1997; O'Dea et al. 2002; Gardner et al. 2017). The gas clouds in the vicinity of the radio source are caused to collapse, triggering the formation of new stars along the jet axis (Begelman & Cioffi 1989; Wagner & Bicknell 2011; Gaibler et al. 2012). On the other hand, shock heating excites gas in the more extended ambient clouds, causing them to accelerate outward, thereby suppressing the compression and formation of stars. Compact radio galaxies show a bimodal distribution in rates of star formation, while some appear to be passive and non-star forming, others have moderate star formation rates (SFRs) of approximately a few to a few tens of solar mass per year (e.g., Fanti et al. 2011; O'Dea & Saikia 2021; Gordon et al. 2023).
Characterized by projected radio sizes of 1–20 kpc and steep (α ≥ 0.5; flux density S ∝ν−α ) radio spectra, CSS sources are our main objects of interest in this study. Their radio size being an order of magnitude larger than PS/CSOs, CSS sources are the only compact radio sources currently resolvable at the scale of the jets. Compelling evidence for jet–ISM interaction in CSS galaxies has been the detection of strong spatial association of extended emission-line regions (EELRs) with radio structure (de Vries et al. 1997, 1999; Axon et al. 2000; Privon et al. 2008). Gas kinematics in the emission-line regions is consistent with shocks (Gelderman & Whittle 1994; Holt et al. 2008; Reynaldi & Feinstein 2013; Shih et al. 2013) combined with AGN photoionization (Labiano et al. 2005; Holt 2009; Shih et al. 2013; Reynaldi 2016) as the main excitation mechanism. Thus, the radio-EELR alignment in CSS sources strongly suggests jet-driven feedback to the host ISM.
We seek to trace star formation triggered by the radio source in the shocked ISM—a testament to radio-mode feedback operating on galaxy scales—in compact, young CSS radio galaxies. As the youngest stellar populations emit the bulk of their energy in the rest-frame UV (<0.3 μm) band, observations at UV wavelengths are ideal for investigating star formation in galaxies over timescales of ∼100 Myr; typically the O- and B-type stars with maximum main sequence lifetimes of ∼10 and 100 Myr, respectively, that are brighter in UV than at other wavelengths. We carried out the first systematic UV imaging study focused on CSS sources, in search of radio-aligned UV light from jet-induced starbursts. Following a pilot snapshot observation with the Hubble Space Telescope (HST) that detected extended UV light aligned with the radio source in the CSS host galaxy 3C 303.1 (Labiano et al. 2008), we broadened our search with a larger sample. A brief description of the motivation and preliminary findings were also published in Duggal et al. (2021). In this paper, we present a detailed analysis of the HST observations, which is organized as follows. Sections 2 and 3 contain the details of the sample, the observed and archival data, and image processing. Extinction correction, photometric measurements, and morphological decomposition methods are described in Section 4. The main results are discussed in Section 5. This section also presents a quantitative analysis of observed star formation, in conjunction with population synthesis modeling. Section 6 discusses previous research on each of the individual target galaxy in the context of this work. The conclusions are summarized in Section 7. Throughout this work, a flat ΛCDM cosmology with H0 = 69.6 km s−1 Mpc−1, ΩM = 0.3, and Ωvac = 0.7 is assumed.
2. Target Selection
Our sample consists of nine radio galaxies—seven CSS host galaxies, along with two galaxies hosting >20 kpc radio sources acting as the (non-CSS) control sample. There was no previous evidence for jet-induced star formation in any of the nine target sources. The sample details are listed in Table 1. The target galaxies are drawn from the well-defined compact radio source samples of Stanghellini et al. (1997), Fanti et al. (1990, 2001), Giroletti et al. (2005), and Burgess & Hunstead (2006), which are spread over a range in radio power (1.4 GHz luminosities given in Table 1). The targets have been chosen to represent compact radio galaxies at the low and intermediate redshift range of z ≲ 0.6, in order to eliminate strong effects due to cosmic evolution. Projected linear radio size between ∼1'' and 8'' forms another constraint for source selection, to enable resolution of optical/UV continuum at the scale of the radio source.
Table 1. Target Sample
| Source | R.A. | Decl. | z | Angular Scale | Radio Size | LS | P 1.4 GHz | Sample | Spectral Type | References |
|---|---|---|---|---|---|---|---|---|---|---|
| (J2000) | (J2000) | (kpc/arcsec) | (arcsec) | (kpc) | (1027 W Hz−1) | |||||
| (1) | (2) | (3) | (4) | (5) | (6) | (7) | (8) | (9) | (10) | (11) |
| 0258+35 | 03 01 42.40 | +35 12 21.00 | 0.017 | 0.346 | 3.8 | 1.32 | 0.001 | G05 | NLRG | 1 |
| 1014+392a | 10 17 14.20 | +39 01 23.00 | 0.536 | 6.400 | 6.1 | 39.03 a | 1.607 | F01 | NLRG | 2 |
| 1025+390 | 10 28 44.30 | +38 44 36.70 | 0.361 | 5.079 | 3.2 | 16.28 | 0.296 | F01 | NLRG | 3 |
| 1037+30 | 10 40 29.96 | +29 57 57.99 | 0.091 | 1.699 | 3.3 | 5.63 | 0.008 | G05 | NLRG | 3 |
| 1128+455 | 11 31 38.89 | +45 14 51.15 | 0.404 | 5.453 | 0.9 | 4.91 | 1.201 | F01 | BLRG | 3 |
| 1201+394 | 12 04 06.86 | +39 12 18.17 | 0.445 | 5.777 | 2.1 | 12.14 | 0.356 | F01 | NLRG | 4 |
| 1203+645 | 12 06 24.70 | +64 13 36.80 | 0.371 | 5.169 | 1.4 | 7.25 | 1.781 | O98 | BLRG | 3 |
| 1221-423 | 12 23 43.30 | −42 35 38.00 | 0.171 | 2.923 | 1.5 | 4.40 | 0.205 | B06 | NLRG | 5 |
| 1445+410a | 14 47 12.76 | +40 47 45.00 | 0.195 | 3.249 | 8.1 | 26.41 a | 0.046 | F01 | NLRG | 4 |
Note. Column (1): target galaxy. Columns (2) and (3): celestial coordinates. Column (4): redshift. Column (5): angular scale at target redshift. Column (6): angular size of the radio source (separation between the outermost component peaks, taken from source reference in column (9)). Column (7): projected linear size of radio source (calculated from columns (5) and (6)). Column (8): 1.4 GHz radio luminosity (W Hz−1). Column (9): source sample references: G05 (Giroletti et al. 2005) = low-power CSS; F01 (Fanti et al. 2001) = moderate-power CSS; O98 (O'Dea 1998) = Stanghellini et al. (1997) plus Fanti et al. (1990) = powerful CSS sources; B06 (Burgess & Hunstead 2006) = southern 3C equivalent. Column (10): NLRG/BLRG = narrow-line/broad-line radio galaxy.
References: (1) Ho et al. (1995); (2) Gandhi et al. (2006); (3) Liao & Gu (2020); (4) SDSS/DR12 spectral catalog (Alam et al. 2015); (5) Johnston et al. (2005).
a Control sample.Download table as: ASCIITypeset image
Although the UV properties of the radio galaxies were not part of the sample criteria so as to avoid any selection bias, archival photometry shows blue [NUV – r] colors for most of the sample (see Figure 1, left panel), typical of galaxies that have experienced star formation in the last ≲1 Gyr. [NUV – r versus Mr ] is an excellent diagnostic for recent star formation (Schawinski et al. 2006; Kaviraj et al. 2007) in early types, and has been extensively used as a star formation indicator in radio galaxies (e.g., Baldi & Capetti 2008) and brightest cluster galaxies (BCGs; e.g., Pipino et al. 2009). Substantial direct AGN contribution is not expected in the majority of the sample, i.e., the narrow-line radio galaxies (NLRGs; see Table 1). On the Wide-field Infrared Survey Explorer (WISE) 9 color–color plot (Figure 1, right panel), most of the compact radio source hosts lie in the starburst-dominated region, consistent with our expectation of low AGN contamination in optical/UV colors.

Figure 1. (Left panel): [NUV – r] vs. Mr color–magnitude distribution for our sample. The horizontal dashed line represents the Kaviraj et al. (2007) threshold for recent star formation: the galaxies below [NUV −r] = 5.5 are likely to show a young stellar population. GALEX-NUV and SDSS/r magnitudes are used here (r-band photometry is not available for the southern galaxy 1221-423). "⋆" indicates the galaxies with clumpy, extended star-forming regions in the HST images. (Right panel): WISE color–color plot for our sample of compact radio source host galaxies. Nearly all our sources lie around starburst IR colors. The dashed lines show classification criteria by Mingo et al. (2016) as follows: 1.6 < [W2−W3] < 3.4 and [W1−W2] < 0.5 are star-forming galaxies; [W2−W3] < 1.6 and [W1−W2] < 0.5 are passive galaxies, while galaxies with [W1−W2] > 0.5 are AGN dominated; the region with [W2−W3] > 3.4 and [W1−W2] < 0.5 belongs to (ultra)luminous infrared galaxies.
Download figure:
Standard image High-resolution image3. Observations and Data Reduction
3.1. Imaging with HST
High-resolution imaging (median FWHM ∼0 075) was obtained for the nine radio galaxies with the UVIS channel on HST's Wide Field Camera 3 (WFC3) in optical (6000–8500 Å) and near-UV (NUV; 2000–3500 Å) bands, in Cycle 25 GO program 15245 (PI: C. O'Dea) over 14 orbits. The filters and exposure details are summarized in Table 2. Filter selection was based on the need to capture the line-free continua. This allows our data to be free of contamination from emission-line regions. We utilized narrowband NUV continuum (between rest frame [C iii]λ1909 and Mg ii
λ2798) for sensitivity to emission from hot, massive (O- and B-type) stars, and medium-band optical continuum (between [O iii]λ5007 and [N ii]λ6548) to determine the optical colors.
075) was obtained for the nine radio galaxies with the UVIS channel on HST's Wide Field Camera 3 (WFC3) in optical (6000–8500 Å) and near-UV (NUV; 2000–3500 Å) bands, in Cycle 25 GO program 15245 (PI: C. O'Dea) over 14 orbits. The filters and exposure details are summarized in Table 2. Filter selection was based on the need to capture the line-free continua. This allows our data to be free of contamination from emission-line regions. We utilized narrowband NUV continuum (between rest frame [C iii]λ1909 and Mg ii
λ2798) for sensitivity to emission from hot, massive (O- and B-type) stars, and medium-band optical continuum (between [O iii]λ5007 and [N ii]λ6548) to determine the optical colors.
Table 2. Observation Details
| Source | HST Filter | Pixfrac | Exposure Time |
|---|---|---|---|
| (s) | |||
| 0258+35 | F621M | 1.0 | 1 × 700 |
| F225W | 1.0 | 1 × 1650 | |
| 1014+392 | F845M | 0.7 | 2 × 700 |
| F336W | 0.7 | 2 × 1650 | |
| 1025+390 | F763M | 1.0 | 2 × 700 |
| F336W | 0.7 | 2 × 1650 | |
| 1037+30 | F621M | 1.0 | 1 × 476 |
| F225W | 0.8 | 1 × 1770 | |
| 1128+455 | F763M | 1.0 | 2 × 700 |
| F336W | 0.7 | 2 × 1740 | |
| 120+394 | F845M | 0.8 | 2 × 700 |
| F336W | 0.5 | 2 × 1650 | |
| 1203+645 | F763M | 1.0 | 2 × 700 |
| F336W | 0.5 | 2 × 1860 | |
| 1221-423 | F689M | 0.8 | 1 × 700 |
| F275W | 0.9 | 1 × 1680 | |
| 1445+410 | F689M | 1.0 | 1 × 700 |
| F275W | 0.7 | 1 × 1680 |
Note. Pivot wavelengths for the imaging filters are given in the WFC3 Instrument Handbook (Dressel & Marinelli 2023) and are as follows: F225W: 2372.1 Å; F275W: 2709.7 Å; F336W: 3354.5 Å; F621M: 6218.9 Å; F689M: 6876.8 Å; F763M: 7614.4 Å; F845M: 8439.1 Å.
Download table as: ASCIITypeset image
The imaging data were pre-calibrated through HST's standard calwf3 pipeline (includes bias and dark current subtraction, flat fielding, and charge transfer efficiency corrections). Post-pipeline processing was done using the drizzlepac 10 software (Hoffmann et al. 2021). The tweakreg task performs astrometric alignment of the individual exposures followed by bad-pixel/cosmic-ray rejection, geometric distortion correction, and dithering to produce the final drizzled images with the task astrodrizzle. The drizzling process involves mapping the input image pixels onto pixels in the subsampled output image, taking into account the shifts and rotations between individual exposures. To avoid convolving the image with the large pixel footprint of the instrument, astrodrizzle allows the user to shrink the pixel before it is mapped into the output image by selecting the drop size via the pixfrac parameter. A smaller drop size results in higher-resolution and lower-correlated noise, but tends to reduce sensitivity to low surface brightness features. On the other hand, higher values would compromise resolution. Hence, pixfrac selection depends on science goals and is decided through visual inspection of the output image. The chosen pixel drop sizes for the final images are given in Table 2.
3.2. Archival Data
In this study, we use archival imaging and/or photometric magnitudes in the NUV, optical, infrared, and radio bands. NUV-band (1771−2831 Å) photometry with the Galaxy Evolution Survey (GALEX; Martin et al. 2005) for the sample was collected from the MAST/GALEX archive. Stacked image cutouts from the Panoramic Survey Telescope and Rapid Response System (Pan-STARRS; Chambers et al. 2016) in the g, r, i, z, y bands were obtained from the PS1 catalog (only available for eight out of nine galaxies because of Pan-STARRS' southern decl. limit of −30°. We sourced pipeline-processed radio maps (5, 8, and 15 GHz bands; A-config.) for six radio sources from the NRAO Very Large Array (VLA) Image Archive. In the case of two sources (1201+394 and 1203+645), raw uv data were obtained from the VLA Data Archive and re-reduced with standard AIPS recipes to improve spatial resolution. For 1221-423, a 12 mm radio image from the Australia Telescope Compact Array has been used (provided by Johnston et al. 2010; private communication). IR imaging and photometry data were obtained from the NASA/IPAC Infrared Science Archive. These include the WISE (Wright et al. 2010) bands—W1 (3.4 μm), W2 (4.3 μm), W3 (12 μm), and W4 (22 μm), the Two Micron All Sky Survey (2MASS; Skrutskie et al. 2006) bands—J (1.2 μm), H (1.7 μm), and Ks (2.2 μm) available for six out of nine galaxies, Spitzer (Werner et al. 2004) data from the Infrared Array Camera (IRAC; Fazio et al. 2004) Infrared Spectrograph (IRS; Houck et al. 2004) Multiband Imaging Photometer for Spitzer (MIPS; Rieke et al. 2004) instruments and their respective bands, and Herschel (Pilbratt et al. 2010) data in the Photodetector Array Camera and Spectrometer (PACS; Poglitsch et al. 2010) bands.
4. Analysis
4.1. 1D Profiles and Photometry
Surface photometry is measured by fitting elliptical isophotes to extended sources to derive radial profiles, i.e., the variation of intensity and ellipticity with radius (Jedrzejewski 1987; Milvang-Jensen & Jørgensen 1999; Cappellari 2016). This is an extensively used method of measuring photometry for radio galaxies in the literature (e.g., Govoni et al. 2000; Vaddi et al. 2016).
Figure 2 presents the optical band HST images of the target sample. We performed the isophotal analysis with the ellipse
11
routine using Python-based
12
IRAF (Tody 1993). Unrelated neighboring galaxies and stars were masked out prior to the fitting. The isophotal profiles (surface brightness, ellipticity, and position angle (PA) versus radial distance) extracted from the optical and UV images, respectively, are presented in the

Figure 2. HST optical continuum morphologies, overlaid with radio contours for the nine radio galaxies in our sample. The contours are plotted at intervals defined by 2i
× 3σ mJy beam−1 (where i = −1, 1, 2, 3, ..., 10). All panels are rotated such that north is pointed up and east is to the left. The ellipse on the lower left represents the FWHM size of the clean beam in each panel. The HST vs. VLA image registration is tied to the radio core positions in all sources. In the cases of 1128+455 and 1203+645, the core positions are approximate. A possible core position for 1203+645 identified in the 5 GHz map by Ludke et al. (1998) would shift the overlaid contours 03 toward the SE.
Download figure:
Standard image High-resolution imagePhotometry was derived based on the 1σ isophote (i.e., the isophote with intensity 1 standard deviation above the mean of the sky background) selected as the integration aperture. Systematic uncertainty in the computed magnitudes was derived by adding the Poisson noise in source flux and rms error from the sky background, in quadrature.
The photometric measurements were corrected for Galactic extinction using the scaling relation by Cardelli et al. (1989) and the E(B − V) color excess sourced from the NASA/IPAC 13 archive. We also computed internal extinction corrections for the sources with available Balmer decrement ratios. The obtained corrections and source references are listed in Table 3. Since the computed adjustments for internal dust reddening in the UV band turn out to be extremely high, we conclude that there must be very little extinction in the observed UV light, i.e., dust is not obscuring UV light significantly in the observer's line of sight. Consequently, we did not correct the photometry for internal extinction. With regard to archival data, the GALEX pipeline includes Galactic extinction correction for the cataloged magnitudes, and due to minimal dust extinction in the IR bands, corrections for WISE bands were ignored. The results from our HST photometric analysis are given in Table 4, while the photometric spectral energy distributions (SEDs) are shown in Figure 3.

Figure 3. UV-to-IR SEDs for the nine compact radio galaxies in our sample. These plots combine our photometric measurements for HST (UVIS bands), Pan-STARRS (g, r, i, z, y), and WISE (W1, W2, W3, W4) data, with cataloged GALEX (NUV and FUV), 2MASS (J, H, Ks ), Spitzer IRAS/IRS/MIPS, and Herschel/PACS imaging magnitudes where available.
Download figure:
Standard image High-resolution imageTable 3. Extinction Corrections for Optical/UV Photometry
| Source | Band | Galactic Extinction | Internal Extinction | ||||
|---|---|---|---|---|---|---|---|
| E(B − V)Gal | A(λ)Gal | Hα /Hβ | References |
E(B − V)
|
A(λ)
| ||
| (mag) | (mag) | (mag) | (mag) | ||||
| 0258+35 | F621M | 0.157 | 0.42 | 5.54 | (1) | 0.67 | 1.80 |
| F225W | 1.30 | 5.50 | |||||
| 1014+392 | F845M | 0.012 | 0.02 | ⋯ | ⋯ | ⋯ | ⋯ |
| F336W | 0.06 | ||||||
| 1025+390 | F763M | 0.009 | 0.02 | 4.73 | (1) | 0.51 | 1.03 |
| F336W | 0.05 | 2.56 | |||||
| 1037+30 | F621M | 0.016 | 0.04 | 8.82 | (1) | 1.13 | 3.06 |
| F225W | 0.13 | 9.36 | |||||
| 1128+455 | F763M | 0.015 | 0.03 | 33.87 | (2) | 2.46 | 5.05 |
| F336W | 0.08 | 12.59 | |||||
| 1201+394 | F845M | 0.022 | 0.04 | ⋯ | ⋯ | ⋯ | ⋯ |
| F336W | 0.11 | ||||||
| 1203+645 | F763M | 0.015 | 0.03 | 17.86 | (2) | 1.84 | 3.74 |
| F336W | 0.07 | 9.33 | |||||
| 1221-423 | F689M | 0.085 | 0.20 | 6.36 | (3) | 0.80 | 1.92 |
| F275W | 0.54 | 5.06 | |||||
| 1445+10 | F689M | 0.013 | 0.03 | 8.22 | (1) | 1.06 | 2.53 |
| F275W | ⋯ | 0.08 | 6.68 | ||||
Notes. A(λ) corrections computed at the pivot wavelengths of UVIS filters (Table 2). Galactic foreground extinction estimated using E(B − V) from the NASA/IRSA Milky Way reddening map (Schlafly & Finkbeiner 2011). Internal extinction is calculated from Hα and Hβ fluxes sourced from reference (1) SDSS/DR12 catalog (central 3'' aperture; Alam et al. 2015), reference (2) Liao & Gu 2020 (SDSS/DR12 3'' aperture), and reference (3) Johnston et al. 2010 (central 27 aperture).
Download table as: ASCIITypeset image
Table 4. NUV to Mid-IR Photometry of the Nine Radio Galaxies
| Band | 0258+35 | 1014+392 a | 1025+390 | 1037+30 | 1128+455 | 1201+394 | 1203+645 | 1221-423 | 1445+410 a |
|---|---|---|---|---|---|---|---|---|---|
| FUV | ⋯ | ⋯ | 21.91 ± 0.06 | 20.66 ± 0.28 | ⋯ | ⋯ | ⋯ | 21.14 ± 0.40 | ⋯ |
| NUV | 18.63 ± 0.15 | 21.75 ± 0.03 | 21.28 ± 0.04 | 19.36 ± 0.11 | 23.41 ± 0.14 | 22.46 ± 0.52 | 23.15 ± 0.22 | 19.66 ± 0.14 | 21.87 ± 0.16 |
| U | ⋯ | ⋯ | 22.66 ± 0.39 | 19.85 ± 0.22 | 22.91 ± 0.67 | 24.57 ± 1.06 | 22.74 ± 0.81 | 19.45 ± 0.43 | ⋯ |
| V | 12.32 ± 0.00 | 20.64 ± 0.24 | 18.27 ± 0.07 | 16.05 ± 0.02 | 19.54 ± 0.13 | 19.68 ± 0.16 | 20.33 ± 0.18 | 17.75 ± 0.06 | 18.47 ± 0.07 |
| g | 12.88 ± 0.01 | 22.05 ± 0.05 | 19.51 ± 0.01 | 16.01 ± 0.01 | 21.03 ± 0.01 | 21.39 ± 0.01 | 23.34 ± 0.01 | ⋯ | 19.17 ± 0.01 |
| r | 11.59 ± 0.01 | 20.30 ± 0.00 | 17.97 ± 0.01 | 15.21 ± 0.01 | 19.34 ± 0.01 | 19.64 ± 0.01 | 20.10 ± 0.01 | ⋯ | 17.73 ± 0.01 |
| i | 11.22 ± 0.01 | 19.64 ± 0.01 | 17.22 ± 0.00 | 14.83 ± 0.00 | 18.79 ± 0.01 | 18.61 ± 0.01 | 19.51 ± 0.01 | ⋯ | 17.00 ± 0.01 |
| z | 10.62 ± 0.01 | 19.41 ± 0.01 | 16.74 ± 0.01 | 14.32 ± 0.00 | 18.24 ± 0.01 | 18.05 ± 0.01 | 18.12 ± 0.01 | ⋯ | 16.58 ± 0.01 |
| y | 9.45 ± 0.01 | 17.53 ± 0.01 | 15.86 ± 0.01 | 13.21 ± 0.01 | 16.99 ± 0.01 | 16.63 ± 0.01 | 20.96 ± 0.01 | ⋯ | 15.44 ± 0.01 |
| J | 12.40 ± 0.06 | 16.59 ± 0.17 | 16.31 ± 0.10 | 14.53 ± 0.04 | ⋯ | ⋯ | ⋯ | 15.42 ± 0.13 | 16.39 ± 0.13 |
| H | 11.67 ± 0.06 | 15.70 ± 0.16 | 15.52 ± 0.11 | 13.84 ± 0.05 | ⋯ | ⋯ | ⋯ | 14.75 ± 0.13 | 15.30 ± 0.11 |
| Ks | 11.23 ± 0.05 | 15.44 ± 0.20 | 14.70 ± 0.09 | 13.36 ± 0.05 | ⋯ | ⋯ | ⋯ | 14.00 ± 0.12 | 14.81 ± 0.12 |
| W1 | 8.37 ± 0.00 | 14.70 ± 0.03 | 13.96 ± 0.03 | 12.45 ± 0.02 | 15.15 ± 0.04 | 15.04 ± 0.03 | 13.51 ± 0.02 | 11.98 ± 0.02 | 14.38 ± 0.03 |
| W2 | 8.38 ± 0.00 | 14.34 ± 0.05 | 13.36 ± 0.03 | 12.35 ± 0.01 | 14.69 ± 0.06 | 14.51 ± 0.05 | 12.43 ± 0.02 | 11.60 ± 0.01 | 13.85 ± 0.03 |
| W3 | 6.99 ± 0.00 | 10.83 ± 0.13 | 10.78 ± 0.10 | 10.44 ± 0.00 | 11.14 ± 0.14 | 11.91 ± 0.27 | 10.18 ± 0.05 | 8.53 ± 0.00 | 11.71 ± 0.14 |
| W4 | 4.96 ± 0.00 | 8.69 ± 0.46 | 8.22 ± 0.00 | 7.34 ± 0.00 | 8.01 ± 0.24 | 8.78 ± 0.00 | 7.62 ± 0.13 | 6.76 ± 0.00 | 8.76 ± 0.00 |
| IRAC1 | 16.72 ± 0.00 | 15.73 ± 0.00 | ⋯ | ⋯ | ⋯ | ⋯ | ⋯ | ⋯ | ⋯ |
| IRAC2 | ⋯ | 15.63 ± 0.00 | ⋯ | ⋯ | ⋯ | ⋯ | ⋯ | ⋯ | ⋯ |
| IRAC3 | ⋯ | 14.91 ± 0.00 | ⋯ | ⋯ | ⋯ | ⋯ | ⋯ | ⋯ | ⋯ |
| IRAC4 | ⋯ | 14.15 ± 0.00 | ⋯ | ⋯ | ⋯ | ⋯ | 12.98 ± 0.00 | ⋯ | ⋯ |
| IRS1 | ⋯ | ⋯ | ⋯ | ⋯ | ⋯ | ⋯ | 12.91 ± 0.00 | ⋯ | ⋯ |
| IRS2 | ⋯ | ⋯ | ⋯ | ⋯ | ⋯ | ⋯ | 12.57 ± 0.00 | ⋯ | ⋯ |
| IRS3 | ⋯ | ⋯ | ⋯ | ⋯ | ⋯ | ⋯ | 11.87 ± 0.00 | ⋯ | ⋯ |
| MIPS | ⋯ | 13.51 ± 0.00 | ⋯ | ⋯ | ⋯ | ⋯ | 11.84 ± 0.00 | ⋯ | ⋯ |
| PACS1 | ⋯ | ⋯ | ⋯ | ⋯ | ⋯ | ⋯ | 10.54 ± 0.00 | ⋯ | ⋯ |
| PACS2 | ⋯ | ⋯ | ⋯ | ⋯ | ⋯ | ⋯ | 10.14 ± 0.00 | ⋯ | ⋯ |
| PACS3 | ⋯ | ⋯ | ⋯ | ⋯ | ⋯ | ⋯ | 10.36 ± 0.00 | ⋯ | ⋯ |
Notes. All magnitudes are in the AB system. Bandpasses: NUV—GALEX NUV (1750–2800 Å); FUV—GALEX FUV (1350–1750 Å); V—HST/UVIS optical channel (6000–8500 Å); U—HST/UVIS ultraviolet channel 2000–3500 Å); g, r, i, z, y—Pan-STARRS1 bands; J, H, Ks —2MASS 1.2, 1.6 and 2.2 μm bands; W1, W2, W3, W4—WISE 3.4, 4.3, 12, and 22 μm bands; IRAC1, IRAC2, IRAC3—Spitzer/IRAC 3.6, 4.5, 5.8, 8.0 μm bands; IRS1, IRS2, IRS3—Spitzer/IRS 12, 16, and 25 μm bands; MIPS—Spitzer/MIPS 24 μm band; PACS1, PACS2, PACS3—Herschel/PACS 70, 100, 160 μm bands. The measured and catalog-obtained photometric magnitudes are corrected only for Galactic extinction (not for internal dust reddening; see Section 4.1).
a Control sample.Download table as: ASCIITypeset image
4.2. 2D Surface Brightness Modeling
Isophote fitting of host morphologies made it clear that there was an underlying structure in almost all cases. The ubiquitous cross-shaped residual features in the central region in most of the sample warranted further examination in terms of bulge, disk, and possible unresolved nuclear AGN source contributions. To this end, we performed two-dimensional galaxy modeling with galfit 14 (Peng et al. 2002, 2010)—an iterative algorithm for structural decomposition of imaging data based on Levenberg–Marquardt minimization. galfit creates a model from a set of user-selected components (analytic functions that describe radial intensity distribution), convolves it with the instrument point-spread function (PSF) and matches it to the input object via least-χ2 fitting. The PSF images for the WFC3 detector were generated with the HST-specific point-spread simulation tool tinytim 15 (Krist et al. 2011). The image input is required to be in counts units (produced from count rates by multiplying exposure time), so galfit can self-construct the sigma map for χ2 computations.
PSF construction. It is known that WFC3 pixels generally undersample the PSF, i.e., the full width at half-maximum (FWHM) of PSF is less than 2 pixels. As this hinders proper convolution within galfit, pixel subsampling is needed for modeling the PSF. The best way for this is to generate a tinytim PSF that is oversampled compared to data, to be convolved and re-binned within galfit before matching with data. The output tinytim PSF model has pixel dimensions 1/x of normal in each direction (for 1 < x < 10 , where x is the PSF sampling factor relative to data). We found a subsampling factor of 2 to be the optimum value for creating better-than-Nyquist sampled model PSFs for the majority of source images (in the case of 0258+25 and 1201+394, critically sampled tinytim PSF was sufficient).
Modeling strategy. A typical galfit structural component has parameters that control basic source properties—profile, scale length, shape, and orientation. Starting with a single Sérsic power law (Sersic 1968), other components can added to the model as needed to improve the fit, based on examining the residuals. Symmetric patterns, bipolar or quadrupolar features usually imply the requirement for additional components. We initially kept the entire parameter space free to vary, e.g., galaxy centroid position, effective radius, PA for the major axis, and sky background. This produced the optimum results in most cases. For some galaxies where multiple Sérsic profiles were fit, the model centroids and/or component Sérsic indices were kept fixed. The best-fitting model was selected based on the goodness of fit (reduced χ2) as well as visual inspection of residual images for remaining excess flux, oversubtracted pixels, unresolved nuclear emission, and/or symmetric patterns that result from improper fitting of disky or boxy elliptical profiles. In cases where more than one model was numerically and visually equivalent in fitting the galaxy profile, the model with a fewer number of components was deduced as the best fit.
Stars and background galaxies were masked out prior to fitting. Detached, but possibly related, sources in the vicinity of the target galaxies were also masked in order to focus on target components. These neighbors were modeled separately and usually best fit with single-component profiles. They could likely be cluster companions (e.g., the two sources toward the north in the case of 1201+394 and the southern source in 1203+645). Results of galfit modeling for the optical- and UV-band images are detailed in the
Table 5. Best-fit Parameters from galfit Modeling of Host Galaxies
| Source | Component | ΔR. A. | ΔDecl. | n | Mtotal | Reff | (α, β, γ) | Rb |

| Rs | b/a | PA |
|---|---|---|---|---|---|---|---|---|---|---|---|---|
| (arcsec) | (arcsec) | (AB mag) | (arcsec) | (arcsec) | (mag/arcsec) | (arcsec) | (°) | |||||
| (1) | (2) | (3) | (4) | (5) | (6) | (7) | (8) | (9) | (10) | (11) | (12) | (13) |
| Optical Imaging | ||||||||||||
| 0258+35 | sc | 0.2 | 0.4 | 4.0 | 12.5 | 70.9 | ⋯ | ⋯ | ⋯ | ⋯ | 0.67 | −43 |
| sc | 0.3 | 0.0 | 4.0 | 13.6 | 13.1 | ⋯ | ⋯ | ⋯ | ⋯ | 0.84 | −82 | |
| sc | 0.0 | 0.6 | 4.0 | 13.4 | 44.8 | ⋯ | ⋯ | ⋯ | ⋯ | 0.74 | +4 | |
| 1014+392 | sc | 0.01 | 0.0 | 2.2 | 20.6 | 1.1 | ⋯ | ⋯ | ⋯ | ⋯ | 0.73 | +84 |
| 1025+390 | sc | 0.2 | 0.01 | 2.0 | 18.6 | 4.6 | ⋯ | ⋯ | ⋯ | ⋯ | 0.43 | −85 |
| sc | 0.12 | 0.04 | 1.7 | 20.5 | 0.7 | ⋯ | ⋯ | ⋯ | ⋯ | 0.78 | −38 | |
| ps | 0.0 | 0.01 | ⋯ | 22.0 | ⋯ | ⋯ | ⋯ | ⋯ | ⋯ | 1.00 | ⋯ | |
| 1037+30 | sc | 0.1 | 0.2 | 9.7 | 12.1 | 17.1 | ⋯ | ⋯ | ⋯ | ⋯ | 0.51 | +84 |
| sc | 0.04 | 0.02 | 3.4 | 26.4 | 1.3 | ⋯ | ⋯ | ⋯ | ⋯ | 0.64 | −41 | |
| ps | 0.05 | 0.05 | ⋯ | 20.2 | ⋯ | ⋯ | ⋯ | ⋯ | ⋯ | 1.00 | ⋯ | |
| 1128+455 | sc | 0.08 | 0.07 | 1.0 | 20.1 | ⋯ | ⋯ | ⋯ | ⋯ | 0.6 | 0.58 | −34 |
| 1201+394 | nu | 0.1 | 0.1 | ⋯ | ⋯ | ⋯ | (4.1, 4.0, 0.4) | 0.1 | 20.3 | ⋯ | 0.85 | +35 |
| sc + m = 1 | 0.1 | 0.1 | 1.2 | 21.2 | 0.9 | ⋯ | ⋯ | ⋯ | ⋯ | 0.49 | −37 | |
| (0.3,10.5) a | ||||||||||||
| 1203+645 | nu | 0.12 | 0.14 | ⋯ | ⋯ | ⋯ | (0.1, 2.2, 0.2) | 0.2 | 20.8 | ⋯ | 0.60 | −11 |
| ps | 0.06 | 0.06 | ⋯ | 25.3 | ⋯ | ⋯ | ⋯ | ⋯ | ⋯ | 1.00 | ⋯ | |
| 1221-423 | sc | 0.01 | 0.05 | 0.3 | 19.8 | 0.3 | ⋯ | ⋯ | ⋯ | ⋯ | 0.71 | +65 |
| sc | 0.05 | 0.0 | 1.0 | 16.2 | ⋯ | ⋯ | ⋯ | ⋯ | 2.1 | 0.86 | +23 | |
| sc | 0.04 | 0.02 | 1.1 | 21.5 | 0.1 | ⋯ | ⋯ | ⋯ | ⋯ | 0.49 | +22 | |
| 1445+410 | nu | 0.08 | 0.05 | ⋯ | ⋯ | ⋯ | (1.6, 2.2, 0.5) | 0.5 | 19.8 | ⋯ | 0.67 | −65 |
| sc | 0.1 | 0.25 | 9.99 | 19.4 | 22.9 | ⋯ | ⋯ | ⋯ | ⋯ | 0.33 | −57 | |
| ps | 0.0 | 0.0 | ⋯ | 23.2 | ⋯ | ⋯ | ⋯ | ⋯ | ⋯ | 1.00 | ⋯ | |
| NUV imaging | ||||||||||||
| 1025+390 | sc | 0.02 | 0.01 | 1.5 | 20.5 | 0.8 | ⋯ | ⋯ | ⋯ | ⋯ | 0.80 | −78 |
| 1037+30 | nu | 0.01 | 0.02 | ⋯ | ⋯ | ⋯ | (1.9, 9.6, 1.1) | 2.8 | 23.5 | ⋯ | 0.32 | −47 |
| ps | 0.05 | 0.05 | ⋯ | 20.5 | ⋯ | ⋯ | ⋯ | ⋯ | ⋯ | 1.00 | ⋯ | |
| 1128+455 | sc | 0.04 | 0.01 | 1.7 | 21.4 | 1.0 | ⋯ | ⋯ | ⋯ | ⋯ | 0.54 | −30 |
| 1201+394 | sc | 0.08 | 0.02 | 2.1 | 22.9 | 0.8 | ⋯ | ⋯ | ⋯ | ⋯ | 0.35 | −35 |
| 1203+645 | sc | 0.76 | 0.48 | 1.0 | 24.3 | ⋯ | ⋯ | ⋯ | ⋯ | 0.1 | 0.31 | −69 |
| sc | 0.18 | 0.33 | 0.1 | 22.0 | 0.8 | ⋯ | ⋯ | ⋯ | ⋯ | 0.39 | −56 | |
| sc | 0.54 | 0.24 | 0.1 | 22.6 | 1.2 | ⋯ | ⋯ | ⋯ | ⋯ | 0.18 | −65 | |
| 1221-423 | sc | 0.02 | 0.05 | 2.5 | 19.4 | 1.0 | ⋯ | ⋯ | ⋯ | ⋯ | 0.98 | +8 |
Notes. galfit modeling results for the compact radio source host galaxies. Column (1): target name. Column (2): best-fit model components: sc = Sérsic (bulge) model; m = Fourier mode index; nu = Nuker (nuclear bar) model; pc = nuclear point source component. Columns (3) and (4): R.A. and decl. offsets of the component centroid from the galaxy's optical center (arcsec). Column (5): Sérsic index. Column (6): integrated magnitude of the Sérsic component. Column (7): the half-light or effective radius of the Sérsic component (arcsec). Column (8): Nuker profile indices. Column (9): effective radius of the Nuker component (arcsec). Column (10): surface brightness of the Nuker component. Column (11): scale length of the exponential disk (n = 1 Sérsic) component (arcsec). Column (12): axis ratio. Column (13): component PA (up = 0°; left = 90°).
a Fourier mode amplitude and phase angle relative to the Sérsic component axis.Download table as: ASCIITypeset image
5. Results
5.1. Continuum Morphology
The registration offset between HST and VLA images (up to 04) was eliminated by aligning the galaxy nucleus in the optical and UV images with the radio nucleus position. The optical continuum maps overlaid with VLA radio contours are shown in Figure 2. One-third of the sample exhibits disturbed morphological features, e.g., large-scale tidal tails and extended filamentary structures—clear signatures of tidal interaction—hinting at possible merger history or ongoing galaxy interactions. Galaxies 1201+394, 1203+645, and 1221-423 have well-resolved close companions that may be physically interacting; the former two being part of cluster environments. Two galaxies, 0258+30 and 1128+455, show prominent extended dust features.
Our NUV continuum images reveal extended UV emission in six out of the seven CSS host galaxies. No UV emission was detected in the two non-CSS control targets. Figure 4 shows the UV-band continuum maps relative to the visible morphology for the six UV-detected CSS galaxies. These overlays display a clear distinction between the dominant old stars and the extended clumps of NUV emission, revealing the young, massive star populations that possibly give these galaxies their blue [NUV − r] colors (Figure 1).

Figure 4. HST NUV continuum maps (smoothed with a 1 pixel Gaussian) for six CSS radio galaxies overlaid with contours of optical continuum emission. The distribution of the younger stellar populations evident from extended UV-emitting regions relative to the general galaxy morphology. All panels are rotated such that north is pointed up and east is to the left.
Download figure:
Standard image High-resolution imageA great deal of research has been done in the past to decode the observed blue/UV excesses in powerful radio galaxies when compared with passive early-type galaxies (Lilly & Longair 1984; Smith & Heckman 1989). In addition to the starburst component, several activity-related factors could also contribute to the observed UV continuum: direct nuclear light (Shaw et al. 1995), scattered AGN radiation (e.g., Tadhunter et al. 1992; Cimatti et al. 1993; Cohen et al. 1999; Holt et al. 2007), and nebular continuum from AGN-ionized emission-line nebulae (e.g., Dickson et al. 1995; Tadhunter et al. 2002; Wills et al. 2002; Holt et al. 2007). We plan to conduct follow-up observations to test for AGN-related contributions.
Our sample includes relatively low redshift sources (z ≤ 0.6), which are expected to show UV-emitting young stars, as earlier studies have found 30%–50% of powerful radio galaxies at low and intermediate redshifts z <0.7 show young stellar populations make a significant contribution to the UV/optical continua, after taking into account the AGN-related components (Aretxaga et al. 2001; Tadhunter et al. 2002; Wills et al. 2002, 2004; Tadhunter et al. 2005). Further, young and intermediate-age (a few megayears to 1 Gyr old) stellar populations have been detected in compact radio galaxies (Labiano et al. 2008; Holt 2009). In light of these findings, we suggest that while it is possible that the flux near the galaxy cores in UV-bright hosts (Figure 4) could be AGN-contaminated and possibly also include emission due to circumnuclear starbursts; the more extended regions and UV knots detected farther from the nucleus (∼3–4 kpc in most cases) are likely to be shining with considerable emission from newborn, massive stars.
Figure 5 presents one of the main results of this paper: a comparison of the NUV extent with radio jet structure. We find a remarkable spatial correlation between the size and PAs of the UV regions and radio lobes. The UV regions are strongly aligned along the jet axis in five out of six CSS hosts—1025+390, 1037+30, 1128+455, 1203+645, and 1221-423. The radio/UV cospatiality in these sources strongly suggests jet-driven starbursts, as the jet propagates through, a dense ISM shock triggers star-forming activity by compressing the nearby gas clouds. The CSS host 1201+394 shows a small UV knot (of ∼8 kpc projected linear width) peripheral to the nucleus and the radio core, with slight elongation along the direction of the jet. It is interesting to note that the apparent offset of the young star population means that it is unlikely to be a nuclear starburst or AGN-related continuum feature, but might be a result of starburst activity induced at a previous epoch when the radio source was smaller, before the lobes expanded farther outward to their current size.
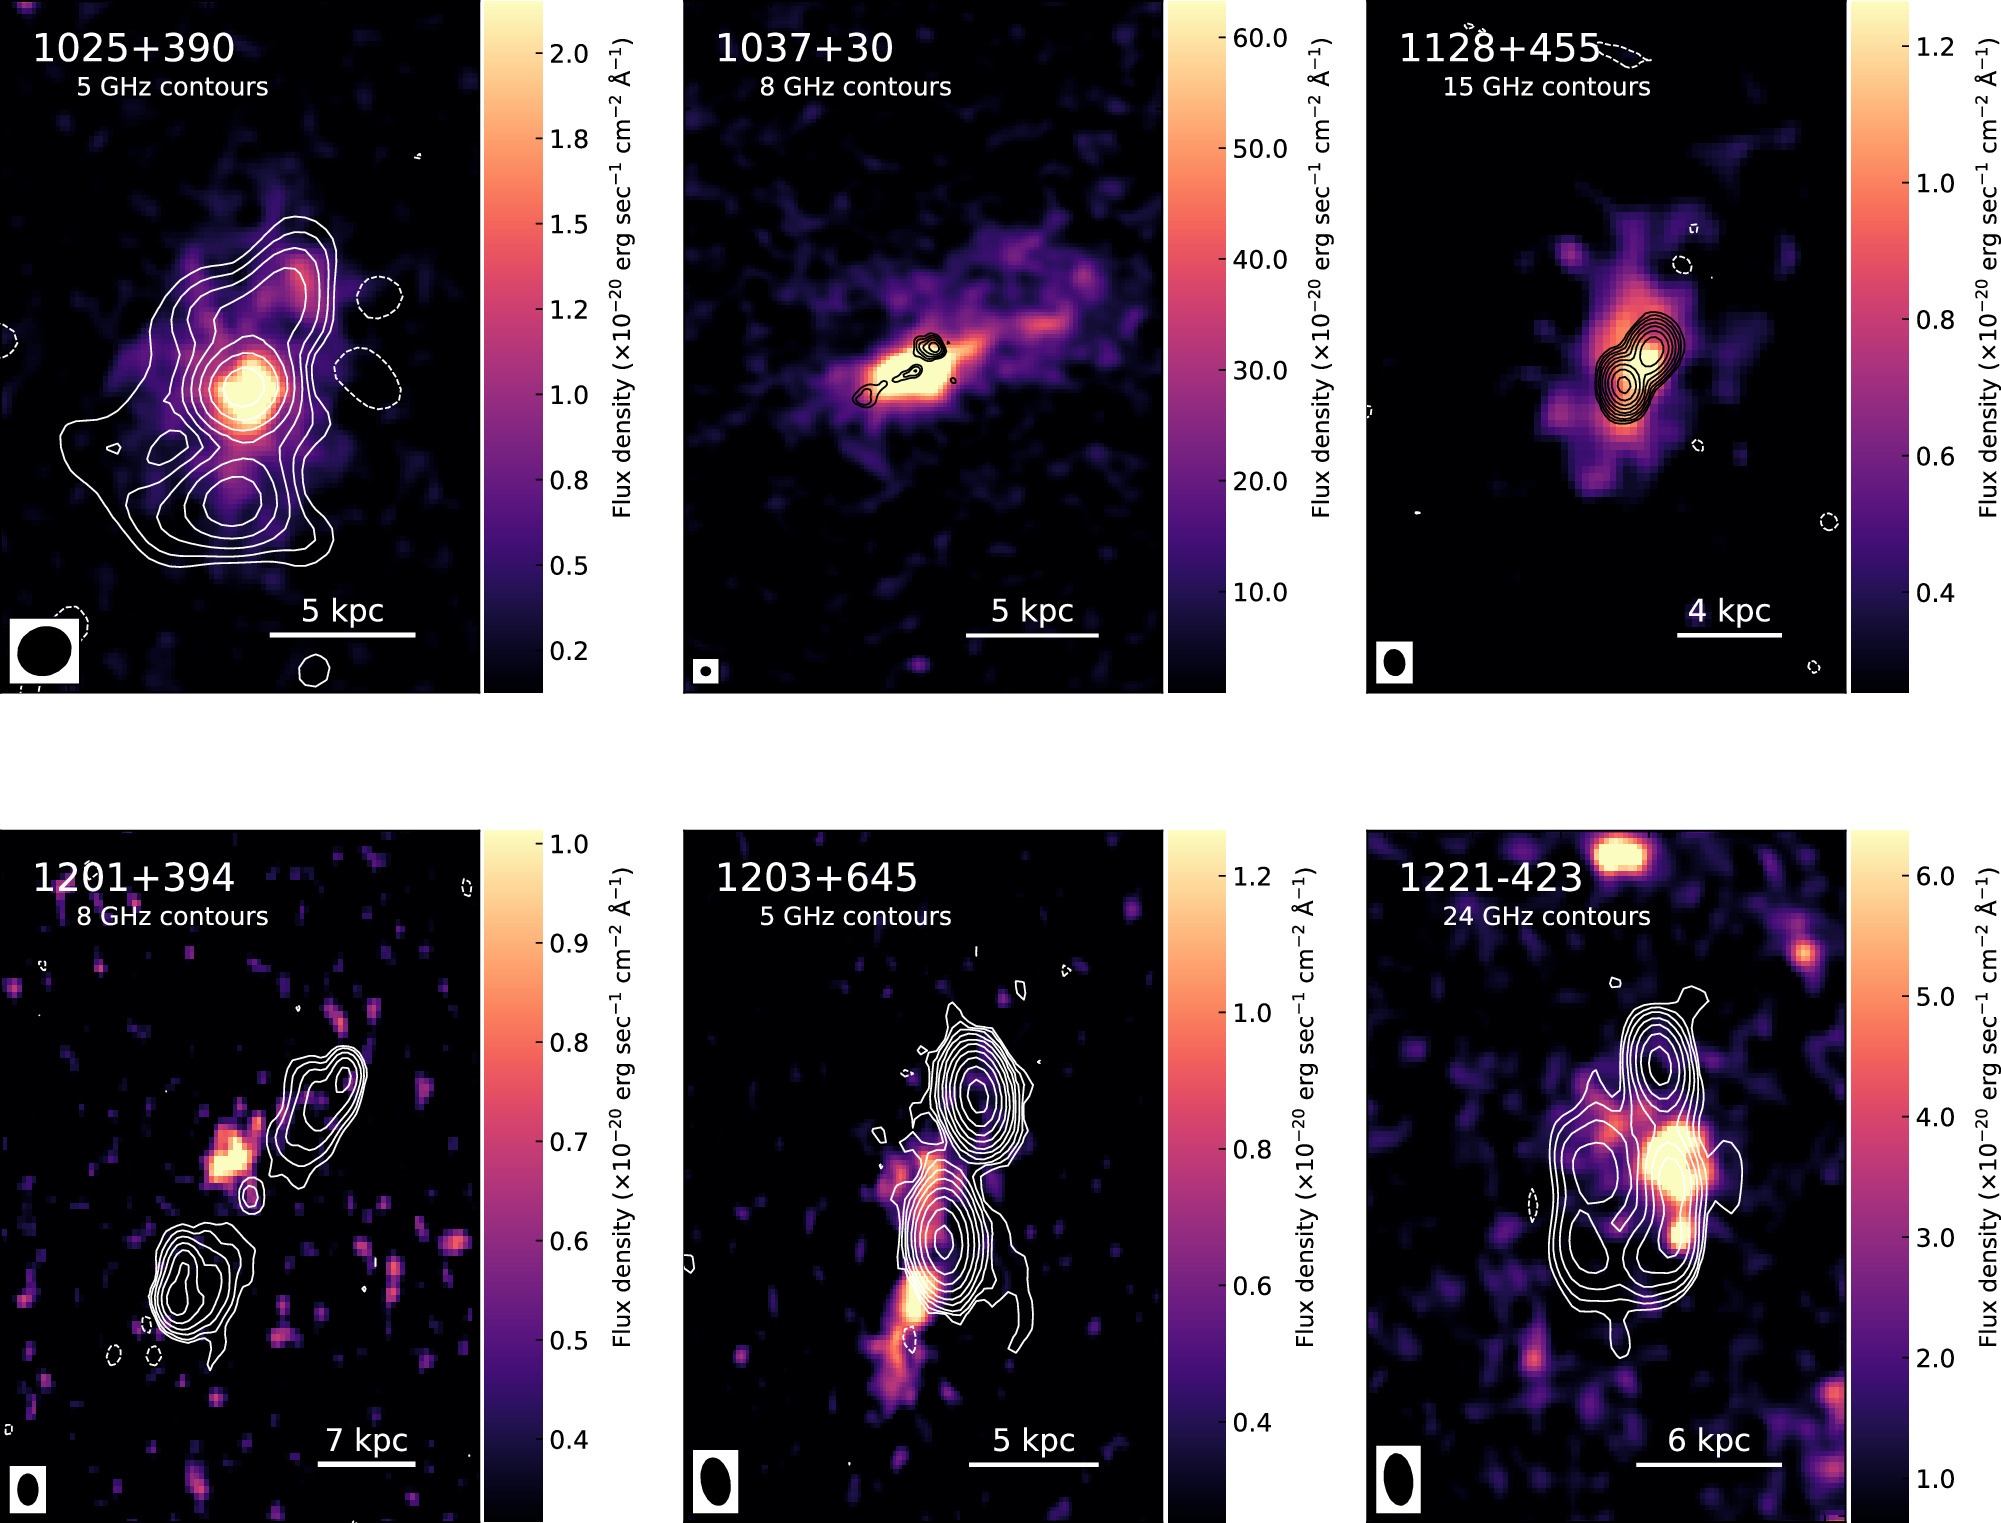
Figure 5. HST NUV continuum maps (smoothed with a 1 pixel Gaussian) for six CSS radio galaxies overlaid with radio emission contours. The contours are plotted at intervals defined by 2i
× 3σ mJy beam−1 (where i = −1, 1, 2, 3, ..., 10). The UV-emitting regions show remarkable alignment with radio morphology, strongly suggesting jet-induced shock-triggered starbursts due to the expanding radio source. All panels are rotated such that north is pointed up and east is to the left. The ellipse on the lower left represents the FWHM size of the clean beam in each panel. The HST vs. VLA image registration is tied to the radio core positions in all sources. In the case of 1128+55 and 1203+645, the core positions are approximate. A possible core position for 1203+645 identified in the 5 GHz map by Ludke et al. (1998) would shift the overlaid contours 03 toward the SE, further coinciding with the UV tail.
Download figure:
Standard image High-resolution imageIn some of these cases, the UV regions extend beyond the apparent radio source influence. Galaxy-wide starbursts are not uncommon in compact radio galaxies, having been found in both CSS and GPS hosts (Holt et al. 2007, 2008). The UV emission spreads out to ∼3 kpc beyond the radio source in 1128+455, while the tidally disrupted BCG 1037+30 has distinct star-forming clumps/filaments scattered out to roughly ∼8 kpc projected distance. Some of these UV regions lie beyond the radio lobes but are aligned along the radio source axis. This could be due to star formation triggered by the bow shock—the shock front expands outside the radio lobe and will cause compression of massive clouds in its path (Begelman & Cioffi 1989; Carvalho & O'Dea 2002; Wagner & Bicknell 2011). The possible causes for the presence of the more dispersed young stellar populations could be—generic gas infall in local gas-rich environments, star formation fueled by merger events (likely in the hosts that exhibit tidal features, e.g., 1037+30 and possibly 1203+645) or persisting starburst activity originally ignited by an earlier cycle of radio emission whose remnant is no longer energetic enough to be observed in the high (gigahertz) frequency range. We delve into the latter scenario in light of the ages of star formation activity in Section 5.5. The ∼15 kpc tail-like feature extending beyond the galactic continuum in 1203+645 is a peculiar case, discussed in detail in Section 6.
A comparison of PAs of the observed structure in the optical and UV continua with the radio source axis is presented in Table 6. The PA measurements follow from our isophote fitting analysis in Section 4.1, where we selected the photometric aperture based on the isophotal ellipse of intensity 1σ higher than the mean sky background. As this aperture forms the outermost boundary that encompasses the measured total flux of the galaxy, we use the major axis angle of the 1σ boundary ellipse as the overall position angle of the extended structure in the optical/UV for our orientation comparisons with the jet axis. The PAs of the stellar continuum and radio emission in the sample do not show any general trend (Figure 6). The direction of the UV emission, however, shows a clear correlation with radio source orientation. In Figure 7, we examine the offset between the radio and UV major axes considering source redshifts and 1.4 GHz luminosity. We do not find any dependence of UV/radio PA alignment on radio power or redshift. This extends similar results observed by Labiano et al. (2008), with a GPS-dominated compact source sample, to CSS sources. The redshift versus radio-UV alignment comparison in Figure 7 also shows agreement with the observed redshift trend in radio-EELR alignment in the literature—unlike large-scale radio sources that only show the alignment effect at z > 0.6, CSS sources can exhibit aligned light at all redshifts (e.g., Privon et al. 2008; Saikia 2022).

Figure 6. A comparison of the PAs of the observed structure of the stellar (left panel) and the NUV continua (right panel), as measured from the HST imaging, with radio source PAs. The general stellar population in the sample does not show a spatial relationship with jet direction, while star-forming UV regions are closely correlated with the radio source axis. The dots mark the line with slope unity. The error bars are smaller than the plot markers.
Download figure:
Standard image High-resolution image
Figure 7. Examination of the observed alignment [UV PA–radio PA] with respect to source redshifts (left panel) and 1.4 GHz radio luminosity (right panel). The error bars are smaller than the plot markers.
Download figure:
Standard image High-resolution imageTable 6. Observed PAs
| Source | z | HST(V) | HST(UV) | Jet Axis |
|---|---|---|---|---|
| (deg) | (deg) | (deg) | ||
| (1) | (2) | (3) | (4) | (5) |
| 0258+35 | 0.017 | 150 | ⋯ | 41 |
| 1014+392 | 0.536 | 109 | ⋯ | 70 |
| 1025+390 | 0.361 | 70 | 63 | 82 |
| 1037+30 | 0.091 | 36 | 24 | 39 |
| 1128+455 | 0.404 | 54 | 64 | 44 |
| 1201+94 | 0.445 | 23 | 45 | 44 |
| 1203+645 | 0.371 | 132 | 73 | 71 |
| 1221-423 | 0.171 | 156 | 86 | 93 |
| 1445+410 | 0.195 | 157 | ⋯ | 22 |
Notes. Major-axis PAs of the outermost (1σ) isophote of the observed structure in optical and NUV bands, as compared to the radio source axis. The angles are measured from the horizontal in the north-up/east-left image orientation.
Download table as: ASCIITypeset image
Other than the radio source-inducing star formation in the host ISM, jet–cloud alignment in compact radio galaxies may hint at a possible observational selection effect. In a scenario suggested by some studies of powerful compact radio sources (e.g., Tadhunter et al. 2011, 2021; Dicken et al. 2012; Emonts et al. 2023), the radio sources might so happen to be expanding into an ISM that is unusually rich in cool gas, e.g., the densest parts of the extended, but asymmetrical merger debris or in the plane of a gas-rich disk (in case of a late-type galaxy host). The subsequent boosting of the radio flux caused by the jet–cloud interactions as the jets expand into the ISM could lead to these compact radio sources being preferentially selected in radio flux-limited samples. The dense, cool gas will then be likely to trace regions of star formation even if not interacting with the radio source. Therefore, the radio-UV alignments might be explained by the jets expanding into the densest parts of large-scale gas structures where star formation is already taking place. This effect could be a factor in some of the gas-rich CSS hosts in our sample.
5.2. galfit Modeling
Our objectives for modeling the surface brightness profiles of our sample were threefold: (a) to extract morphological information about the compact source hosts in optical and UV bands—Do they show signs of interactions, e.g., asymmetric or irregular features, hidden companions? What are the sizes and PAs of UV-emitting knots relative to the radio source? (b) to detect any hidden nuclear structure like bars or unresolved point source; (c) to disentangle dust features resolved by HST in some of these galaxies (e.g., extended dust loops around the core of 0258+35; dense egde-on lane across 1128+455). These would be clearly discernible in the residual images after the visible components of the galaxy have been subtracted.
Clear evidence of substructure is confirmed in all the sources that show irregular isophotes in the visible band. Most galaxies in the sample are fit by a combination of galaxy bulge profiles (Sérsic indices of n = 2 and higher). A pure disk component (n = 1 Sérsic) is not detected in the majority of sources, consistent with the general finding that CSS sources tend to be hosted in massive ellipticals. However, one-third of the sample is found to be without a detectable bulge. These galaxies are best fit by either a pure exponential disk (1128+455), a pure bar (1203+645), or a bar plus an exponential disk (1201+394). Bulgeless galaxies hosting AGN activity are a rare phenomenon (e.g., Desroches & Ho 2009; Satyapal et al. 2009) and remarkably interesting in light of the well-known BH-bulge scaling relations. However, in our case, this may be an observation bias, as it is possible that bulges in these z > 0.3 galaxies might be too faint to be detected in our imaging. Deeper, higher-resolution observations would be needed to confirm their bulgeless nature. In the subsample of five galaxies with detectable bulges, three galaxies need a Nuker profile (which translates into the detection of a nuclear bar structure), either instead of or in conjunction with Sérsic components, to properly fit the surface brightness distribution in the core. It is interesting to note that some studies (e.g., Knapen et al. 2000; Hao et al. 2009) have found a correlation between the presence of stellar bars and AGN activity. In addition, our fitting suggests the presence of faint compact source components in the nuclei of about half of the targets—typically in the sources classified in the literature as NLRGs. This is consistent with faint nuclear emission due to obscuration. Another possibility is that some compact radio galaxies may have weak nuclear activity from a radiatively inefficient low-luminosity AGN, as opposed to a bright, quasar-like nucleus.
In the UV band, the bright knots are mostly best fit with single-component models (Sérsic or Nuker profiles), with an index range of 0.1 < n < 3. The one exception is an extended tail-like feature exhibited by 1203+645 in the UV continuum, where two more low-index Sérsic components (of flat but sharply truncated intensity curves) are needed for a close fit. The fit for 1025+390 shows an ∼3 kpc-sized UV-bright knot in the path of the jet. The presence of such sub-galactic UV clusters is consistent with star-forming regions. The UV-band fitting for 1037+30 maintains the nuclear compact source suggested with the optical fit; although given the disturbed, irregular inner structure of the galaxy, the point source component may not be reliable.
The 2D fitting results in the optical and UV for the nine galaxies are discussed further individually in Section 6.
5.3. High versus Low Excitation
A key requirement for predicting AGN activity-related UV emission is the estimate of the power of the accretion process. Accretion efficiency correlates with excitation type in radio galaxies (Hardcastle et al. 2007; Hardcastle 2009; Best & Heckman 2012). High-excitation radio galaxies (HERGs), i.e., those with strong high-excitation-level emission lines in their optical spectrum, have larger total energy output than the weak-lined Low-excitation radio galaxies (LERGs). These two AGN divisions differ fundamentally based on whether the accretion onto the central SMBH is radiatively efficient or inefficient. HERGs typically have accretion rates between 1% and 10% of their Eddington rate, whereas LERGs predominately accrete at a rate <1% of the Eddington rate. Because of the large radiative output of the strongly accreting HERG, they are expected to be more capable of producing a non-stellar UV continuum by scattering of accretion radiation as well as by ionizing gas in host ISM, compared to the LERG types.
The HERG/LERG distinctions for our radio galaxy sample are listed in Table 7. We use two different methods for this classification, based on the availability of nuclear emission-line measurements for the sample. The first approach is the excitation index (EI), defined by Buttiglione et al. (2010), which combines flux ratios of emission lines Hα λ 6563, Hβ λ 4861, [O i]λ6300, [O iii]λ5007, [O ii]λ3727, [S ii]λ6716+λ6731, and [N ii]λ6583 (see Table 7 caption for EI definition). In this system, the galaxies for which the nuclear spectra show EI >0.95 are categorized as H. For the cases where data for the higher (rest) wavelength lines are not available, we switch to the excitation diagnostic by Jackson & Rawlings (1997), where the sources with an [O ii]/[O iii] flux ratio >1 are classified as LERGs.
Table 7. Excitation Classification Based on Emission-line Strengths
| Source | EI | [O ii]/[O iii] | Type | Reference | |
|---|---|---|---|---|---|
| (1) | (2) | (3) | (4) | (5) | |
| 0258+35 | 0.27 | ⋯ | LERG | (1) | |
| 1014+392 | ⋯ | ⋯ | LERG | (2) | |
| 1025+390 | 0.64 | ⋯ | LERG | (3) | |
| 1037+30 | 0.51 | ⋯ | LERG | (3) | |
| 1128+455 | 0.89 | ⋯ | LERG | (3) | |
| 1201+394 | ⋯ | 15.24 | LERG | (4) | |
| 1203+645 | 1.53 | ⋯ | HERG | (3) | |
| 1221-423 | ⋯ | 1.66 | LERG | (4) | |
| 1445+410 | 0.98 | 0.22 | HERG | (1, 4) |
Note. Column (1): target name. Column (2): excitation Index (separation = 0.95). Column (3): [O ii]/[O iii] line flux ratio. Column (4): deduced LERG/HERG class.
References: (1) EI = log([O iii]/Hβ
)  [log([N ii]/Hα
)+log([S ii]/Hα
)+log([O i]/Hα
)], Buttiglione et al. (2010); (2) Classified by Gendre et al. (2013); (3) EI values given by Liao & Gu (2020); (4) LERG/HERG distinction based on [O ii]/[O iii] line ratio (>1 corresponds to LERG), Jackson & Rawlings (1997). The emission-line data were sourced from Emonts (2006) (0258+35), Johnston et al. (2010) (1221-423), and the SDSS/DR12 spectral catalog (1201+394 and 1445+410; Alam et al. 2015).
[log([N ii]/Hα
)+log([S ii]/Hα
)+log([O i]/Hα
)], Buttiglione et al. (2010); (2) Classified by Gendre et al. (2013); (3) EI values given by Liao & Gu (2020); (4) LERG/HERG distinction based on [O ii]/[O iii] line ratio (>1 corresponds to LERG), Jackson & Rawlings (1997). The emission-line data were sourced from Emonts (2006) (0258+35), Johnston et al. (2010) (1221-423), and the SDSS/DR12 spectral catalog (1201+394 and 1445+410; Alam et al. 2015).
Download table as: ASCIITypeset image
Out of the nine radio galaxies in our sample, seven are consistent with LERG-type emission lines. This includes five of the UV-detected CSS galaxies. Due to their low-power accretion, the observed UV continuum in these galaxies is not expected to have a significant contribution from scattered AGN radiation; although nebular continuum emission from regions shocked and ionized by the expanding radio lobes (e.g., Dickson et al. 1995) may still have some contribution to the extended UV emission, which demands further investigation. Of the two radio sources diagnosed as HERGs, the CSS galaxy 1203+645 exhibits radio-aligned UV light and is likely to have contamination from AGN-related factors in the UV. This is consistent with its broad-line radio galaxy (BLRG) nature and activity-dominated IR colors (Figure 1). The other HERG radio source 1445+410 is a control source, larger than the CSS radio size, from which our imaging did not detect any UV emission.
5.4. Quantifying Star Formation
5.4.1. Estimates from Observed Photometry
The extinction-corrected photometric measurements can be used to estimate rates of star formation (SFR; in units of solar mass per year), utilizing several young star tracers over a range of wavelengths—UV/optical indicators probe the direct stellar light emerging from galaxies (e.g., Kennicutt 1998; Salim et al. 2007; Calzetti 2013), while mid/far-IR bands probe the stellar light reprocessed by dust (e.g., Kennicutt 1998; Rieke et al. 2009; Cluver et al. 2017). Recombination lines (primarily Hα) and forbidden emission lines in metals also help estimate star formation using the ionizing photon rate, as traced by the gas ionized by massive stars. It should be noted here that the SFRs derived from the Hα line and mid-IR continuum estimators are likely to represent upper limits due to possible AGN contamination.
We derive SFRs using multiple tracers to be able to draw better conclusions on stellar populations by comparison of results at different wavelengths. We note that the observed flux-to-SFR calibrations are prone to systematic uncertainties from the initial mass function (IMF; an empirical function that describes the initial distribution of masses for a population of stars), dust content, and metallicity. So, the assumed IMF and other model parameters are taken into account in these estimates to aid our subsequent comparative analysis with synthesized data.
UV continuum. The integrated spectrum of galaxies in the UV band is dominated by young stars and the star-forming rate scales linearly with luminosity. We use the Kennicutt (1998) calibration (Equation (1)) to compute SFRs from the HST/UV observations, while the GALEX-specific conversion relation by Salim et al. (2007) (Equation (2)) is used for estimating SFRs with archival GALEX photometry. Both of these relations are derived using a Salpeter IMF with mass limits of 0.1 and 100 M⊙. The luminosities Lν and LGALEX are in units of erg s −1 Hz −1, and valid over the wavelength ranges of 1500–2800 and 1300–1800 Å, respectively.


Scaling relations usually adopt the continuous star formation approximation, i.e., it is assumed that the SFR has remained constant over timescales that are long compared to the lifespan of the dominant UV-emitting population (<108 yr). Therefore, it is worth noting here that if star formation has been active in a region on a timescale shorter than about 100 Myr, the cumulative UV emission of massive stars is still increasing in luminosity, and so, the UV-based SFR would consequently be underestimated. Kennicutt (1998) found that an ∼106 yr old population in a continuous burst would yield SFRs that are 57% higher than those given in Equation (1).
Ionized gas emission. Young, massive stars produce copious amounts of ionizing photons that ionize the surrounding gas. Only stars of masses ≳10 M⊙ and lifetimes of <20 Myr would produce enough photon flux to ionize the nebulae. Hence, emission-line-generated SFR measures are expected to be independent of older star formation history, and so, are more sensitive to changes in SFR over short timescales (approximately a few megayears) than other tracers (e.g., Kennicutt 1998; Calzetti 2013). Kennicutt (1998) gives the conversion factor to compute the SFRs from the recombination Hα line (Equation (3)) employing the same Salpeter IMF (0.1–100 M⊙) as the UV-band relations. Zhuang & Ho (2019) derive an SFR calibration for active galaxies based on the forbidden [O ii]λ3727 doublet (Equation (4)) that separates the contribution from the AGN narrow-line region to that arising from the H ii regions. LHα , L[O II], and L[O III] are the total, extinction-corrected luminosities in erg s−1.


where x = log(1.54020 + 1.26602R + 0.167977R2) + 8.93 and R = log([N ii]/[O ii]).
Mid-IR continuum. An indirect SFR diagnostic, the mid-IR emission traces the dust heated by UV-luminous, young stellar populations; for which the IR SED is more luminous and peaks at shorter wavelengths (∼10–100 μm). Rieke et al. (2009) derived the linear correlation between SFR and single-band 24 μm IR luminosity at the galaxy-wide scale (Equation (5)). We use WISE 22 μm (W4) band luminosity, expressed in units of solar luminosity, for our IR SFR estimates.

Composite calibrations. Kennicutt et al. (1672) developed scaling relations from linear combinations of optical emission-line luminosities with single-band IR luminosity to produce internal attenuation-corrected SFRs. We use these to draw comparisons with SFRs from other indicators not corrected for internal dust extinction. LHα and L[O II] are extincted luminosities in erg s−1.


The star-forming rates estimated from the various tracers are given in Table 8. We find that the UV-derived SFRs are in general the lowest compared to those produced from other indicators. This suggests low AGN contamination in the observed UV continuum. Two BLRG hosts—1128+455 and 1203+645—show an order of magnitude higher Hα- and IR-SFRs compared to their UV estimates. For 1128+455, ubiquitously high SFRs with all diagnostics are consistent with its IR-ultraluminous classification on the WISE color–color plot (Figure 1). In the case of 1203+645, emission-line luminosities and mid-IR continuum will likely have contributions from AGN-ionized regions, given the evidence of nuclear photoionization in its EELRs (e.g., Shih et al. 2013; also see Section 6). For the rest of the NLRG sample, the comparison of SFRs from the different tracers suggests that significant activity-related UV contribution is unlikely.
Table 8. Estimates of SFRs from Various Indicators
| Source | SFRHST/UV | SFRGALEX | SFRHα | SFR[O II] | SFR22μm | SFR22μm + Hα | SFR22μm+[O II] |
|---|---|---|---|---|---|---|---|
| (M⊙ yr−1) | (M⊙ yr−1) | (M⊙ yr−1) | (M⊙ yr−1) | (M⊙ yr−1) | (M⊙ yr−1) | (M⊙ yr−1) | |
| (1) | (2) | (3) | (4) | (5) | (6) | (7) | (8) |
| 1025+390 | 1.97 | 5.41 | 5.42 | 8.85 | 55.69 | 45.57 | 67.76 |
| 1037+30 | 1.21 | 1.47 | 0.83 | 2.55 | 5.35 | 5.0 | 7.35 |
| 1128+455 | 2.04 | 0.99 | 11.95 | 4.84 | 90.16 | 75.55 | 98.16 |
| 1201+394 | 0.56 | 3.00 | ⋯ | ⋯ | 54.61 | ⋯ | ⋯ |
| 1203+645 | 1.95 | 1.03 | 38.18 | 3.41 | 106.32 | 112.6 | 114.76 |
| 1221-423 | 6.87 | 4.37 | 1.09 | 3.89 | 38.12 | 29.06 | 45.16 |
Note. SFRs from observed fluxes in different bands for the six UV-detected CSS host galaxies. The estimates are computed from scaling relations detailed in Section 5.4.1. All UV, IR, and emission-line luminosities used in these calculations are corrected for Galactic (foreground) extinction only. The composite SFR diagnostics in columns (7) and (8) include internal attenuation correction by definition. In the case of the host 1201+394, the required line-emission data are not available. Note that AGN photoionization may have contributed to the Hα emission and mid-IR continuum used here as star formation tracers, so these SFR estimates represent upper limits.
Download table as: ASCIITypeset image
Another explanation for the low UV SFRs could be that the dust clouds in the host galaxy absorb some of the UV light. In our sample, it is certainly possible that some of the UV light has been absorbed; however, this appears unlikely due to the high internal extinction estimates (see Section 4.1). A possible scenario could be that a jet-induced star-forming region is mixed with dust clouds in the host ISM, which acts as a dust screen—while the UV light from the near side of the dust envelope reaches the observer without much extinction, the UV emission generated behind the screen gets highly attentuated. Then, the observed UV and SFR detections will essentially be lower limits. Similar dust obscuration of gas undergoing a jet-induced outflow has been observed in higher redshift radio galaxies (Humphrey et al. 2006).
The effects of AGN jet emission on galactic dust are also of particular relevance to this scenario, owing to the sub-galactic sizes of the radio sources. It is possible that the jets ejected from a newly triggered AGN, or recurring jet emission in the same direction as an earlier outburst (e.g., in double-double radio sources or restarted radio galaxies, Schoenmakers et al. 2000; Stanghellini et al. 2005; Saikia & Jamrozy 2009; Shulevski et al. 2012; Nandi et al. 2019) sweep aside the dust clouds in their path, thereby clearing dust along the jet axis and reducing the absorption of the UV light from star-forming regions in the vicinity of the jet. Such an event could explain the low UV attenuation in the observer's line of sight.
5.4.2. Comparison with Stellar Population Models
We now compare the HST/UV photometry of the UV-detected subset of our sample with evolutionary models from the stellar population synthesis code starburst99 17 (Leitherer et al. 1999, 2010, 2014; Vázquez & Leitherer 2005) to examine star formation models and stellar ages that are consistent with a population of stars that could (i) cause the UV continuum emitting clumpy regions in the jet vicinity, and (ii) produce sufficient ionizing photons to power the nebula.
starburst99 provides predictive SEDs of a young stellar population from the far-UV (FUV) to the near-IR, with varying parameters—IMF, mass range, metallicity, and whether the starburst continuously formed stars (expressed in terms of SFR), as opposed to the single burst scenario (in which case a given starburst mass evolves through time). We consider both continuous and instantaneous star formation models that include stellar and nebular emission, with varying power-law index α for the Salpeter IMF and different mass cutoffs. Near-solar metallicity is chosen (Z = 0.008) since all the scaling relations used in the previous section for SFR estimations are computed assuming solar abundance (e.g., Kennicutt 1998; Calzetti 2013). Using synthetic photometry packages synphot (STScI Development Team 2018) and stsynphot 18 (STScI Development Team 2020), each model SED is redshifted to the redshift of the target source and then convolved with the relevant HST filter transmission curve. The redshift-corrected and bandpass-convolved model is then used to compute the predicted effective stimulus (effstim, Equation (8)), i.e., integrated flux in the given filter bandpass in the desired flux units, which in our case were erg s−1 cm−2 Å−1 so as to be readily comparable with flux units of HST observations.

where λ is the wavelength, Pλ is the filter throughput and Fλ is the bandpass-convolved model flux distribution. These artificial fluxes synthesized from starburst models can then be directly compared with our observed, extinction-corrected photometry.
Emission in the UV continuum. For each source, we obtained predicted fluxes for models at ages between 1 Myr and 1 Gyr. This gave us estimates of the SFRs or the initial starburst masses required to produce the observed UV continuum at different epochs in the evolution of a young stellar population. Tables 9 and 10 list the results for continuous and instantaneous bursts, respectively, for three chosen epochs—1 Myr, the earliest available stellar age with starburst99 models; a reasonably young 10 Myr and the intermediate age of 100 Myr. The selection of these epochs illustrates the general trend in the amount of star formation with each order of magnitude in age. Figure 8 shows the detailed variation of the predicted values with time for all the model scenarios.

Figure 8. starburst99 population synthesis-derived parameters vs. starburst age for the six CSS hosts showing radio-aligned star-forming regions. The left axes indicate SFRs for continuous starburst models (Models 1–3 in Table 9). The solid black line marks the observed SFR derived from HST/UV flux using the calibration from Kennicutt (1998). The blue-colored areas indicate starburst ages corresponding to the best-fit model (Model 1; solid blue line). An ∼1–8 Myr old continuously star-forming nebula is most consistent with the observed UV emission in our CSS sample. On the right axes, we plot the variation of predicted initial starburst masses required to produce the observed flux with age, in an instantaneous starburst scenario. In this case, the tested models generally agree that an ∼10 7– 108 M⊙ burst triggered ∼1–10 Myr ago would produce the hot, massive stars that generate the observed UV.
Download figure:
Standard image High-resolution imageTable 9. Continuous Star Formation
| Source |
 (fuv) (fuv) |
 (Qtot) (Qtot) |
 (fuv)/ (fuv)/ (Qtot) (Qtot) | ||||||
|---|---|---|---|---|---|---|---|---|---|
| (M⊙ yr−1) | (M⊙ yr−1) | ||||||||
| 1 Myr | 10 Myr | 0.1 Gyr | 1 Myr | 10 Myr | 0.1 Gyr | 1 Myr | 10 Myr | 0.1 Gyr | |
| Model 1 | |||||||||
| 1025+90 | 11.8 | 1.5 | 0.9 | 7.1 | 2.0 | 2.0 | 1.66 | 0.75 | 0.45 |
| 1037+30 | 7.5 | 1.0 | 0.6 | 1.1 | 0.3 | 0.3 | 6.82 | 3.33 | 2.00 |
| 1128+455 | 12.0 | 1.5 | 0.9 | 15.6 | 4.4 | 4.3 | 0.77 | 0.34 | 0.21 |
| 1201+394 | 3.2 | 0.4 | 0.2 | ⋯ | ⋯ | ⋯ | ⋯ | ⋯ | ⋯ |
| 1203+645 | 11.6 | 1.5 | 0.9 | 49.3 | 13.8 | 13.8 | 0.24 | 0.11 | 0.07 |
| 1221-423 | 65.8 | 8.6 | 4.9 | 1.4 | 0.4 | 0.4 | 47.0 | 21.5 | 12.25 |
| Model 2 | |||||||||
| 1025+390 | 90.6 | 9.5 | 2.8 | 97.0 | 23.5 | 23.2 | 0.93 | 0.40 | 0.12 |
| 1037+30 | 60.2 | 6.6 | 1.7 | 14.8 | 3.6 | 3.5 | 4.07 | 1.83 | 0.49 |
| 1128+455 | 92.0 | 9.6 | 2.8 | 213.5 | 51.7 | 51.1 | 0.43 | 0.19 | 0.05 |
| 1201+394 | 24.5 | 2.5 | 0.8 | ⋯ | ⋯ | ⋯ | ⋯ | ⋯ | ⋯ |
| 1203+645 | 89.3 | 9.3 | 2.7 | 676.2 | 163.7 | 161.8 | 0.13 | 0.06 | 0.02 |
| 1221-423 | 516.8 | 55.3 | 14.7 | 19.5 | 4.7 | 4.7 | 26.5 | 11.77 | 3.13 |
| Model 3 | |||||||||
| 1025+390 | 30.1 | 2.7 | 1.1 | 51.4 | 8.7 | 8.6 | 0.59 | 0.31 | 0.13 |
| 1037+30 | 21.8 | 2.0 | 0.7 | 7.9 | 1.3 | 1.3 | 2.76 | 1.54 | 0.54 |
| 1128+455 | 30.3 | 2.7 | 1.1 | 113.1 | 19.2 | 18.9 | 0.27 | 0.14 | 0.06 |
| 1201+394 | 8.0 | 0.7 | 0.3 | ⋯ | ⋯ | ⋯ | ⋯ | ⋯ | ⋯ |
| 1203+645 | 29.6 | 2.6 | 1.1 | 358.2 | 60.8 | 59.7 | 0.08 | 0.04 | 0.02 |
| 1221-423 | 181.1 | 16.2 | 6.2 | 10.3 | 1.7 | 1.7 | 17.58 | 9.53 | 3.65 |
Notes.
 (fuv) and
  (Qtot) are the estimated SFRs that would produce the observed UV continuum and the required number of ionizing photons, respectively, at age epochs of 106, 107, and 108 yr. The starburst99 models used for the estimates are normalized to a continuous SFR of 1 M⊙ yr−1, solar abundance (Z = 0.008), and lower mass limits of 1 M⊙. (1) Salpeter IMF of slope α = 2.35 and upper mass cutoff Mup = 100 M⊙; (2) Salpeter IMF of slope α = 3.30 and upper mass cutoff Mup = 100 M⊙; (3) Salpeter IMF of slope α = 2.35 and upper mass cutoff Mup = 30 M⊙. For the source 1201+394, the Hα luminosity needed for estimating Qtot was not available.
Download table as: ASCIITypeset image
Table 10. Instantaneous Star Formation
| Source | log M(fuv) | log M(Qtot) | log M(fuv)/log M(Qtot) | ||||||
|---|---|---|---|---|---|---|---|---|---|
| (log M⊙) | (log M⊙) | ||||||||
| 1 Myr | 10 Myr | 0.1 Gyr | 1 Myr | 10 Myr | 0.1 Gyr | 1 Myr | 10 Myr | 0.1 Gyr | |
| Model 1 | |||||||||
| 1025+390 | 7.1 | 7.6 | 8.8 | 6.9 | 9.2 | 13.7 | 1.03 | 0.83 | 0.64 |
| 1037+30 | 6.9 | 7.5 | 8.5 | 6.1 | 8.4 | 12.9 | 1.13 | 0.89 | 0.66 |
| 1128+455 | 7.1 | 7.6 | 8.8 | 7.2 | 9.5 | 14.1 | 0.99 | 0.80 | 0.62 |
| 1201+394 | 6.5 | 7.1 | 8.2 | ⋯ | ⋯ | ⋯ | ⋯ | ⋯ | ⋯ |
| 1203+645 | 7.1 | 7.6 | 8.8 | 7.7 | 10.0 | 14.6 | 0.92 | 0.76 | 0.60 |
| 1221-423 | 7.8 | 8.4 | 9.4 | 6.2 | 8.5 | 13.0 | 1.26 | 0.99 | 0.72 |
| Model 2 | |||||||||
| 1025+390 | 8.0 | 8.2 | 8.8 | 8.0 | 9.8 | 13.9 | 1.00 | 0.84 | 0.63 |
| 1037+30 | 7.8 | 8.0 | 8.5 | 7.2 | 9.0 | 13.0 | 1.08 | 0.89 | 0.65 |
| 1128+455 | 8.0 | 8.2 | 8.8 | 8.4 | 10.2 | 14.2 | 0.95 | 0.80 | 0.62 |
| 1201+394 | 7.4 | 7.6 | 8.3 | ⋯ | ⋯ | ⋯ | ⋯ | ⋯ | ⋯ |
| 1203+645 | 8.0 | 8.1 | 8.8 | 8.9 | 10.7 | 14.7 | 0.90 | 0.76 | 0.60 |
| 1221-423 | 8.7 | 8.9 | 9.5 | 7.3 | 9.1 | 13.2 | 1.19 | 0.98 | 0.72 |
| Model 3 | |||||||||
| 1025+390 | 7.5 | 7.6 | 8.7 | 7.7 | 9.1 | 13.7 | 0.97 | 0.84 | 0.64 |
| 1037+30 | 7.4 | 7.5 | 8.4 | 6.9 | 8.3 | 12.9 | 1.07 | 0.90 | 0.65 |
| 1128+455 | 7.5 | 7.6 | 8.7 | 8.1 | 9.5 | 14.0 | 0.93 | 0.80 | 0.62 |
| 1201+394 | 6.9 | 7.0 | 8.2 | ⋯ | ⋯ | ⋯ | ⋯ | ⋯ | ⋯ |
| 1203+645 | 7.5 | 7.6 | 8.7 | 8.6 | 10.0 | 14.5 | 0.87 | 0.76 | 0.60 |
| 1221-423 | 8.3 | 8.4 | 9.4 | 7.0 | 8.4 | 13.0 | 1.19 | 1.00 | 0.72 |
Notes. M(fuv) and M(Qtot) are the estimated total mass of an instantaneous starburst that would produce the observed UV continuum and the required number of ionizing photons, respectively, at age epochs of 106, 107, and 108 yr. The starburst99 models used for the estimates assume an instantaneous burst of star formation, solar abundance (Z = 0.008) and lower mass limits of 1 M⊙. (1) Salpeter IMF of slope α = 2.35 and upper mass cutoff Mup = 100 M⊙; (2) Salpeter IMF of slope α = 3.30 and upper mass cutoff Mup = 100 M⊙; (3) Salpeter IMF of slope α = 2.35 and upper mass cutoff Mup = 30 M⊙. For the source 1201+394, the Hα luminosity needed for estimating Qtot was not available.
Download table as: ASCIITypeset image
On comparison of the synthetic model estimates with the extinction-corrected HST/UV fluxes, we find that in general (i) the closest fit to the observed, low SFRs (a few solar masses per year, column (2) in Table 8) is the model normalized to a continuous SFR of 1 M⊙ yr−1, with a Salpeter IMF of slope 2.35, upper and lower mass limits of 100 and 1 M⊙, respectively, and solar abundances where Z = 0.020 (i.e., Model 1 in Table 9 and Figure 8). An ∼106 yr old continuously star-forming nebula is most consistent with the regions emitting UV continuum in the CSS hosts. The other two models considered approaching the observed low SFRs at late (>10 Myr in most cases) epochs. (ii) If an instantaneous burst is assumed, the initial starburst masses of 107 M⊙–108 M⊙ are required for a rapid starburst triggered between 106 and 107 yr ago, to result in a population of hot stars producing the observed UV flux in the target sample. The variation between models is relatively small in this case.
Can the nebula be powered by hot stars? We consider whether the observed FUV continuum is consistent with a sufficient number of hot stars that could ionize the nebula. The number of ionizing photons required to power the nebula is given by

where να is the rest frequency of the Hα emission line and h is a Planck constant. The Case B recombination scenario is assumed (Osterbrock & Ferland 2006), as is usual for most computations concerned with SFRs, for a nebula that is optically thick to ionizing photons.
We compare the total number of ionizing photons derived using Hα luminosities with the starburst99 predictions for ionizing photon numbers in the H i, He i, and He ii continuum (spectral range below ∼912 Å) versus age, for each stellar synthesis model. Hα flux measurements for our CSS galaxies are taken from previous spectroscopic studies in the literature (sources listed in Table 3). The 3'' aperture for the slit spectra includes nuclear emission as well as the more extended ionized gas regions.
The SFRs and starburst masses that would produce the estimated number of ionizing photons are included in Tables 9 and 10, respectively. In the case of continuous production of stars, our results show that the observed rates of star formation are comparable to or higher than those required by our best-fitting model (i.e., an ∼106 yr old SED with a Salpeter IMF slope of 2.35 and upper mass limit of 100 M⊙) in most of the sources. Hot, young stars could therefore provide the bulk of the photons ionizing emission-line nebulae, in the majority of CSS galaxies in our sample. The other two continuous starburst models considered are generally inconsistent with our source sample at most epochs. Considering the instantaneous case, the masses of the initial starburst required to produce the expected amount of photons lie between ∼106 and 1010 M⊙ over the source sample. These values remain more or less constant over different models. Note that this calculation does not take into account AGN photonization for excitation of the nebular clouds, in the case of CSS sources with a HERG progenitor. So, the required SFRs and starburst masses should, in general, be considered upper limits.
The last column of Tables 9 and 10 indicates the ratio of SFRs (or starburst masses) needed to account for observed flux to those needed for producing ionizing photons. A ratio >1 would mean that enough ionizing photons are generated from the young stellar population to ionize the nebula. The resulting ratios are all of order unity, suggesting that FUV emission, due to the young stellar population has sufficient strength to power the emission-line nebula. This is consistent with our hypothesis that UV light is produced by young stars rather than scattered nuclear light or AGN-ionized nebulae.
5.5. Age of Starbursts versus Radio Source Lifetimes
Compact radio source ages have been estimated in the literature from their kinematic as well as radiative properties. From proper motion considerations, multi-epoch observations of compact CSO jets show hotspots propagating outward (with respect to the galaxy nucleus) with velocities in the range of ∼0.04–0.4c, with a median value of ∼0.1c (O'Dea & Saikia 2021). The corresponding dynamical ages evident from these velocities are of the order of ∼10 2– 103 yr for CSOs (e.g., Owsianik & Conway 1998; Owsianik et al. 1998; Polatidis et al. 2002; An & Baan 2012), while for the relatively larger CSS sources, dynamical ages of 104–105 yr have been estimated (e.g., Giroletti et al. 2005).
Spectral aging estimates, that take into account the synchrotron radiative lifetimes of electrons in the jet lobes, also suggest similar values. Lobe-dominated CSS sources have been found to have typical radiative ages of ∼10 3–105 yr (e.g., Murgia et al. 1999; Murgia 2003).
Here, we consider the jet lobe propagation method for estimating the ages of our compact radio source sample. Assuming a typical advance velocity of 0.1c, we roughly calculate dynamical ages for the six CSS radio sources in Table 11. Two of these sources, 0258+30 and 1037+30, were also part of the Giroletti et al. (2005) sample. Their study estimated a 4.5 × 10⁴ yr kinematic age for the CSS source in 1037+30 assuming an expansion velocity of 0.2c. For 0258+35, the radio structure shows no hotspots to measure the jet advancement, but Giroletti et al. (2005) have estimated a radiative age of 9 × 10⁵ yr. These values are in agreement with our estimates.
Table 11. Dynamical Age Estimates for the UV-detected CSS Sample
| Source | Tdyn |
|---|---|
| (yr) | |
| 1025+390 | 1.6 × 10⁴ |
| 1037+30 | 5.6 × 10⁴ |
| 1128+455 | 4.9 × 10⁴ |
| 1201+394 | 1.2 × 10⁵ |
| 1203+645 | 7.3 × 10⁴ |
| 1221−423 | 4.4 × 10⁴ |
Note. Tdyn = LS/v, where LS is projected linear separation at source redshift (listed in Table 1) and v is the expansion velocity in the source rest frame (≈ 0.1c).
Download table as: ASCIITypeset image
Our analysis shows the star-forming activity that would emit the observed UV continuum to be older, at ≤ 106 yr, than the mean CSS radio source age of ∼104 yr. For star formation induced as a result of jet propagation, the newly produced stellar population would be expected to have ages comparable to radio source expansion timescales. There are a few explanations for the apparent gap in our age estimations.
First, as described in Section 5.4.1, UV-to-SFR scaling relations inherently produce highly underestimated star-forming rates, and hence, the SFR values from Table 8 we use to calibrate our models are, in fact, lower limits. Higher SFRs correspond to much younger (≲1 Myr) starburst ages, as evident from the population synthesis curve (Figure 8).
Second, the youngest stellar population simulated by starburst99's predictive modeling is 1 Myr old. This puts a constraint on star formation timescales accessible for approximately a few solar masses per year of continuous production. For reference, massive O-types have a lifespan of <6 Myr. So the UV emission by a typical O-type star during its first million years on the main sequence is not taken into account by evolutionary synthesis. Due to this inherent model limitation, the possibility that the observed UV is radiated by hot, luminous stars that are at a much younger stage (≲ 105 yr) is not ruled out.
Third, the jets may be older than estimated from their projected linear sizes. Evidence exists that compact (CSS and PS) radio sources can signify restarted radio activity (e.g., O'Dea et al. 2001; Stanghellini et al. 2005; Saikia & Jamrozy 2009; Tremblay et al. 2010; Shulevski et al. 2012; O'Dea & Saikia 2021). A known example of these rejuvenated scenarios is fortuitously part of our observed CSS sample (0258+35; Section 6), where fainter, lower-frequency radio emission from an earlier phase of activity exists distinct from newborn steep-spectrum radio lobes. It is possible that the ∼106 yr old stars suggested by the models were produced in star-forming activity ignited by an older episode of radio emission, that may or may not have faded/cooled beyond detectable limit. Low-frequency radio observations of our source sample could help provide deeper insight in this context. Interestingly, in the case of double-double radio galaxies (which are typical examples of recurring jet outbursts in the same direction, e.g., Schoenmakers et al. 2000; Nandi et al. 2019), it has been shown that the strength of the alignment effect in optical and UV emission correlates with the linear size of radio source (Best et al. 1996; Kaiser et al. 2000), and hence, presumably with the age of the radio source.
Further, it is possible that the radio source is confined to the compact scales due to being frustrated by interaction with a dense host galaxy ISM (e.g., van Breugel 1984; Wilkinson et al. 1984; O'Dea et al. 1991). This would mean that the radio source could be much older than its dynamical age estimate; the interaction with host ISM having slowed down the jet propagation (e.g., De Young 1991; Higgins et al. 1999; Wang et al. 2000). Simulations suggest that the jets could remain frustrated for about 1–2 Myr in sufficiently dense environments (O'Dea & Saikia 2021). In this case, the radio source will not be as young as estimated from proper motion-based arguments and thus capable of inducing star formation that results in the approximately a few megayear-old stellar population suggested by the UV emission. Observations to trace molecular gas and column densities from X-ray absorption (e.g., Sobolewska et al. 2019) will help probe the likelihood of this scenario in our CSS sample.
Another, albeit less likely, possibility is that the star formation we detect could be triggered in a galaxy merger or be a hybrid of jet-induced and merger-induced starbursts. It is known that features consistent with merger interactions (companion objects and/or distorted isophotes for instance) are a common occurrence in PS/CSS sources (O'Dea & Saikia 2021). The majority of CSS sources in our sample show evidence of a merger history, owing to their perturbed morphologies (Figure 2). This prompts us to consider the case where a common merger event triggered both nuclear activity and star formation in the host, or a Fanti et al. (2011)−like composite scenario where star-forming activity was triggered due to a past merger, subsequently enhanced by the AGN jet outburst. This might, in principle, explain the existence of an intermediate-age stellar population that is older than the young radio source (∼10 4–105 yr). However, in a case where star formation and AGN are triggered by the same event, studies show an ∼10 7–109 yr time delay between the onset of the starburst and the start of radio activity (e.g., Tadhunter et al. 2005; Labiano et al. 2008; Tremblay et al. 2010; Fanti et al. 2011), corresponding to the timescale over which gas is transported from kiloparsec to sub-kiloparsec scales following a merger. The stellar population expected in this scenario would be much older than the ∼106 yr ages detected in our study. Hence, merger-related scenarios are less likely to have contributed to generating the young stellar populations observed in the CSS sample.
6. Discussion of Individual Sources
In this section, we coalesce the results of our study on the nine radio galaxies in our sample, and discuss our findings in the context of previous research on each of these sources.
0258+35. This well-studied radio source is hosted in the early-type giant NGC 1167 with an optical spectrum typical of a LINER AGN (Emonts 2006). Radio data display two pairs of jet lobes—an inner luminous, steep-spectrum pair spanning ∼3 kpc (Giroletti et al. 2005), embedded in large-scale (∼240 kpc) outer jets with extremely low surface brightness that are ∼110 Myr old (Shulevski et al. 2012; Brienza et al. 2018). This nested jet structure and the contrast in spectral indices of the inner and outer lobes point to recurrent activity with an ∼100 Myr quiescent phase and led to its interpretation as a restarted radio galaxy (Shulevski et al. 2012), though other evolutionary scenarios have also been suggested (Brienza et al. 2018). Giroletti et al. (2005) derived the age for the young CSS source as ∼0.9 Myr and cited dynamical arguments to suggest that the compact radio source will likely not grow out into an extended FRI/II structure. The sharp bend in the southern (inner) lobe indicating interaction with a dense surrounding ISM supports this source confinement scenario. This argument further agrees with the turbulent jet–ISM interaction in the heart of the galaxy, as evident in the H i absorption observations (Murthy et al. 2019). The presence of a massive molecular gas outflow, evidently driven by the young radio source, was detected in the central region of the galaxy in recent CO(1–0) observations (Murthy et al. 2022). At larger scales, the CO emission forms a ring of molecular gas of ∼10 kpc radius, which is found to be coincident with low star-forming activity along the faint spiral arms (Gomes et al. 2016).

Figure 9. HST broadband (F702W; de Vries et al. 1997) morphology in 1203+645, host to the CSS radio source 3C 268.3. The F702W filter includes [O iii] line emission (de Vries et al. 1999). All panels are rotated such that north is pointed up and east is to the left. (a) Contours from the optical line-free continuum image from this study overlaid on the de Vries et al. F702W image. The ∼15 kpc tail-like feature extending beyond the galactic continuum. (b) F702W image overlaid with contours of the UV-emitting regions from our data. (c) F702W broadband emission with VLA 5 GHz radio contours. The ellipse on the lower left represents the FWHM size of the clean beam. (d) HST UV-band image of 1203+645 from this work overlaid with de Vries et al. F702W contours. The line-emission tail closely aligns with the extended, likely star-forming regions.
Download figure:
Standard image High-resolution image
Figure 10. SExtractor identification of individual UV clumps, farther away from the circumnuclear region, in the merging system of 1221-423. A detection was defined as a minimum of 5 pixels of the source brighter than the 3σ flux threshold. The circles represent the Kron apertures used for photometric measurements of the likely star-forming regions in the spiral arms of the CSS host parent galaxy (white) and the southern companion (magenta).
Download figure:
Standard image High-resolution imageOur HST/UV continuum imaging did not detect signs of a young stellar population, consistent with NGC 1167's passive, non-star-forming [NUV − r] and IR colors (Figure 1). This is in agreement with Emonts' (2006) result of no young star signature in the optical spectrum. However, given the clear evidence of jet–cloud interaction in the vicinity of the radio source from cold gas kinematics (Murthy et al. 2022) and X-ray emission coincident with the CO outflow region (Fabbiano et al. 2022), the non-detection of star-forming UV emission is a puzzling result. Dust obscuration of UV light could be a possible explanation for this paradoxical observation. The visible band HST image indeed shows intricate dust lanes in the nuclear region, clearly observable in the residual image (Figure 11).

Figure 11. 0258+35. Top: target HST image, 2D composite galfit model, and residual image (= data − model). Bottom (left): 1D surface brightness profile fit rendered from galfit using the ellipsect software. The solid red line marks the galaxy light profile, dashed lines trace the individual component profiles, and the solid blue line shows the sum of all components comprising the final model. (Right): galaxy radial profiles from isophote fitting with iraf/ellipse. Surface brightness μ, ellipticity  , and major-axis PA θ (from north to east) as a function of the semimajor axis r1/4. Where not visible, the error bars are smaller than the plot markers.
Download figure:
Standard image High-resolution imageOur best-fit galfit model is a combination of three Sérsic bulges—an inner, fairly compact bulge with Reff ∼ 5 kpc, and two larger-scale components with Reff ∼ 16 and ∼25 kpc; all centered within ∼05 of the optical nucleus and having de Vaucouleurs elliptical (n = 4) intensity profiles with a steep central core and extending outer wing.
1014+392. The highest redshift source in our sample, 4C 39.29 is a Type 2 quasar with a powerful optical narrow-line spectrum. Classified as a LERG (Gendre et al. 2013), the AGN accretion in 1014+392 is radiatively inefficient. The spatial coincidence of the ∼15 kpc extended optical emission-line regions with the brighter radio lobe suggests that the radio jet could have ionized the emission-line gas (Gandhi et al. 2006).
Optically, the source fits cleanly with an n = 2 elliptical model for the host galaxy with a 1'' effective radius, which translates to ∼6 kpc at z = 0.536. Our HST imaging did not detect continuum UV emission in the host.

Figure 12. 1014+392. Top: target HST image, 2D composite galfit model, and residual image (= data − model). Bottom (left): 1D surface brightness profile fit rendered from galfit using the ellipsect software. (Right): galaxy radial profiles from isophote fitting with iraf/ellipse. Surface brightness μ, ellipticity , and major-axis PA θ (from north to east) as a function of the semimajor axis r1/4. Where not visible, the error bars are smaller than the plot markers.
Download figure:
Standard image High-resolution image1025+390. This elliptical galaxy is host to the CSS source 4C 39.32 which has a relatively amorphous double-lobe radio morphology. The radio core identified in Rossetti et al. (2006) aligns with HST optical and UV nuclei, with the bent northwest (NW) jet tail coinciding with the northern UV knot lying ∼5 kpc from the core (also appears as an extended arm-like structure in the optical; see Figure 13). The spatial alignment in this case strongly suggests that the clustered young stellar population in the path of the jet is due to shock-triggered star formation. Fanti et al. (2011) found a 0.06−0.1 Gyr old young stellar population in the host with their optical-UV SED fitting, while our modeling results show ≲5 Myr old stellar population.

Figure 13. 1025+390. Top: target HST image, 2D composite galfit model, and residual image (= data − model). Bottom (left): 1D surface brightness profile fit rendered from galfit using the ellipsect software. The solid red line marks the galaxy light profile, dashed lines trace the individual component profiles and the solid blue line shows the sum of all components comprising the final model. (Right): galaxy radial profiles from isophote fitting with iraf/ellipse. Surface brightness μ, ellipticity , and major-axis PA θ (from north to east) as a function of the semimajor axis r1/4. Where not visible, the error bars are smaller than the plot markers.
Download figure:
Standard image High-resolution imageOur best-fit optical galfit model for this source is a relatively flat bulge with Reff ∼ 3.5 kpc and an outer, more elliptical Sérsic component of an ∼23 kpc effective radius. Our fit suggests a nuclear point source, ∼4 magnitudes fainter than the bulge, is likely present. In the bluer band, fitting shows the Reff = 4 kpc UV bright core along with an ∼3 kpc wide northern clump, best-fit with two distinct n ≈ 1 Sérsic profiles.
1037+30. The relatively nearby (z = 0.091) CSS source 4C 30.19 lies in the chaotic central galaxy of the Abell 923 cluster (Giroletti et al. 2005). Marked by prominent tidal features and a disturbed-elliptical/irregular morphology (González-Serrano & Carballo 2000), it also exhibits a highly complex nuclear structure as evident from the twisted isophotes and optical galfit residuals (Figure 14). SED fitting analysis by de Ruiter et al. (2015) concluded that 1037 + 30's FUV to mid-IR SED is dominated by young stellar component rather than the AGN, consistent with its clearly starburst-aligned IR colors (Figure 1). The extended, radio-aligned continuum UV detected in our imaging is hence not likely to be highly contaminated with AGN-related radiation. 1037+30 is hence a strong candidate for jet-induced star formation, considering the ≲10 Myr-aged starburst population that our data suggests. This hypothesis is also supported by evidence of UV-bright kiloparsec-scale filamentary structure in some BCGs, attributed to star formation induced by the jets and/or compression inside X-ray cavities (e.g., Tremblay 2015).

Figure 14. 1037+30. Top: target HST image, 2D composite galfit model, and residual image (= data − model). Bottom (left): 1D surface brightness profile fit rendered from galfit using the ellipsect software. The solid red line marks the galaxy light profile, dashed lines trace the individual component profiles and the solid blue line shows the sum of all components comprising the final model. (Right): galaxy radial profiles from isophote fitting with iraf/ellipse. Surface brightness μ, ellipticity , and major-axis PA θ (from north to east) as a function of the semimajor axis r1/4. Where not visible, the error bars are smaller than the plot markers.
Download figure:
Standard image High-resolution image
Figure 15. 1128+455. Top: target HST image, 2D composite galfit model, and residual image (= data − model). Bottom (left): 1D surface brightness profile fit rendered from galfit using the ellipsect software. (Right): galaxy radial profiles from isophote fitting with iraf/ellipse. Surface brightness μ, ellipticity , and major-axis PA θ (from north to east) as a function of the semimajor axis r1/4. Where not visible, the error bars are smaller than the plot markers.
Download figure:
Standard image High-resolution image
Figure 16. 1201+394. Top: target HST image, 2D composite galfit model, and residual image (= data − model). Bottom (left): 1D surface brightness profile fit rendered from galfit using the ellipsect software. The solid red line marks the galaxy light profile, dashed lines trace the individual component profiles and the solid blue line shows the sum of all components comprising the final model. (Right): galaxy radial profiles from isophote fitting with iraf/ellipse. Surface brightness μ, ellipticity , and major-axis PA θ (from north to east) as a function of the semimajor axis r1/4. Where not visible, the error bars are smaller than the plot markers.
Download figure:
Standard image High-resolution image
Figure 17. 1203+45. Top: target HST image, 2D composite galfit model, and residual image (= data − model). Bottom (left): 1D surface brightness profile fit rendered from galfit using the ellipsect software. The solid red line marks the galaxy light profile, dashed lines trace the individual component profiles and the solid blue line shows the sum of all components comprising the final model. (Right): galaxy radial profiles from isophote fitting with iraf/ellipse. Surface brightness μ, ellipticity , and major-axis PA θ (from north to east) as a function of the semimajor axis r1/4. Where not visible, the error bars are smaller than the plot markers.
Download figure:
Standard image High-resolution image
Figure 18. 1221-423. Top: target HST image, 2D composite galfit model, and residual image (= data − model). Bottom (left): 1D surface brightness profile fit rendered from galfit using the ellipsect software. The solid red line marks the galaxy light profile, dashed lines trace the individual component profiles and the solid blue line shows the sum of all components comprising the final model. (Right): galaxy radial profiles from isophote fitting with iraf/ellipse. Surface brightness μ, ellipticity , and major-axis PA θ (from north to east) as a function of the semimajor axis r1/4. Where not visible, the error bars are smaller than the plot markers.
Download figure:
Standard image High-resolution image
Figure 19. 1445+410. Top: target HST image, 2D composite galfit model, and residual image (= data − model). Bottom (left): 1D surface brightness profile fit rendered from galfit using the ellipsect software. The solid red line marks the galaxy light profile, dashed lines trace the individual component profiles and the solid blue line shows the sum of all components comprising the final model. (Right): galaxy radial profiles from isophote fitting with iraf/ellipse. Surface brightness μ, ellipticity , and major-axis PA θ (from north to east) as a function of the semimajor axis r1/4. Where not visible, the error bars are smaller than the plot markers.
Download figure:
Standard image High-resolution image
Figure 20. 102+390. Top: target HST image, 2D composite galfit model, and residual image (= data − model). Bottom (left): 1D surface brightness profile fit rendered from galfit using the ellipsect software. (Right): galaxy radial profiles from isophote fitting with iraf/ellipse. Surface brightness μ, ellipticity , and major-axis PA θ (from north to east) as a function of the semimajor axis r1/4. Where not visible, the error bars are smaller than the plot markers.
Download figure:
Standard image High-resolution imageVisible band galfit fitting gives an n = 3.4 Sérsic bulge (effective radius ∼2 kpc) and a larger (Reff ∼ 30 kpc) n = 10 Sérsic component with a 20 AB mag nuclear point source, as the best fit. This model offers the lowest  but does not result in a clean fit, which is expected for a highly perturbed galaxy, likely undergoing interaction. In the UV band, the fitting is limited to the central region with higher surface brightness, while the more dispersed extended UV regions are excluded by galfit. The central region is fit by a nuclear bar profile of radius of ∼5 kpc and a 20 AB mag point source component (as in the optical fit).

Figure 21. 1037+30. Top: target HST image, 2D composite galfit model, and residual image (= data − model). Bottom (left): 1D surface brightness profile fit rendered from galfit using the ellipsect software. (Right): galaxy radial profiles from isophote fitting with iraf/ellipse. Surface brightness μ, ellipticity , and major-axis PA θ (from north to east) as a function of the semimajor axis r1/4. Where not visible, the error bars are smaller than the plot markers.
Download figure:
Standard image High-resolution image
Figure 22. 1128+455. Top: target HST image, 2D composite galfit model, and residual image (= data − model). Bottom (left): 1D surface brightness profile fit rendered from galfit using the ellipsect software. (Right): galaxy radial profiles from isophote fitting with iraf/ellipse. Surface brightness μ, ellipticity , and major-axis PA θ (from north to east) as a function of the semimajor axis r1/4. Where not visible, the error bars are smaller than the plot markers.
Download figure:
Standard image High-resolution image
Figure 23. 1201+394. Top: target HST image, 2D composite galfit model, and residual image (= data − model). Bottom (left): 1D surface brightness profile fit rendered from galfit using the ellipsect software. (Right): galaxy radial profiles from isophote fitting with iraf/ellipse. Surface brightness μ, ellipticity , and major-axis PA θ (from north to east) as a function of the semimajor axis r1/4. Where not visible, the error bars are smaller than the plot markers.
Download figure:
Standard image High-resolution image
Figure 24. 1203+645. Top: target HST image, 2D composite galfit model, and residual image (= data − model). Bottom (left): 1D surface brightness profile fit rendered from galfit using the ellipsect software. (Right): galaxy radial profiles from isophote fitting with iraf/ellipse. Surface brightness μ, ellipticity , and major-axis PA θ (from north to east) as a function of the semimajor axis r1/4. Where not visible, the error bars are smaller than the plot markers.
Download figure:
Standard image High-resolution image
Figure 25. 1221-423. Top: target HST image, 2D composite galfit model, and residual image (= data − model). Bottom (left): 1D surface brightness profile fit rendered from galfit using the ellipsect software. (Right): galaxy radial profiles from isophote fitting with iraf/ellipse. Surface brightness μ, ellipticity , and major-axis PA θ (from north to east) as a function of the semimajor axis r1/4. Where not visible, the error bars are smaller than the plot markers.
Download figure:
Standard image High-resolution image
1128+455. The host galaxy of this broad-line (Liao & Gu 2020) CSS radio source shows strong spiral characteristics with a dense dust lane aligned edge-on along the major axis. Fanti et al. (2011) found a 0.06−0.1 Gyr old young stellar population in the host with their optical-UV SED fitting. Our results from starburst modeling indicate ≲10 Myr ages. Murgia et al. (1999) computed the synchrotron-radiation timescale for this radio source to be 1.7 × 10⁴ yr. This suggests that the radio-aligned UV-emitting regions could have starburst contributions from past merger events or subsisting star formation ignited by an earlier cycle of radio emission. Being a BLRG, this galaxy may also have contamination from nuclear activity-related emission in the UV band.
An exponential disk with a scale length of Reff ∼ 3 kpc fits this galaxy well. The giant, galaxy-wide dust lane is clearly visible in the residual image, as is the extended filament structure not fitted by the model. Having a pure disk structure, this galaxy could be one of the rare bulgeless AGN hosts (e.g., Desroches & Ho 2009; Satyapal et al. 2009; Jiang et al. 2011). Deeper and higher-resolution observations are needed to confirm the bulgeless nature, as the bulge might escape detection due to the dust lane and/or the (relatively) high redshift. The UV emission is best fit with an n = 1.7 Sérsic component of an ∼5 kpc effective radius.
1201+394. Another one of the higher redshift sources in our sample, 1201+394 is a cluster-centric BCG (Yuan et al. 2016). Our HST imaging revealed two other galaxies in the vicinity; we carried out surface brightness measurements for these likely cluster companions as well. The host exhibits a messy, highly twisted isophotal profile in the optical. The combination of a 1.2 kpc wide nuclear bar and an exponential disk of effective radius of ∼6 kpc produces the cleanest residuals for the apparently bulgeless galaxy profile, though a fixed centroid and m = 1 Fourier mode modification (amplitude am
= 0 35 and 105 phase angle relative to the disk component axis) needed to model this galaxy suggests a lopsided brightness structure (Peng et al. 2002).
The UV-band image shows an extended clumpy region near the core, fit with an n = 2 Sérsic component of 4.6 kpc effective radius. The 1201+394 host lies on the boundary of the AGN division on the WISE diagnostic color plot (Figure 1), so the ∼10 kpc wide UV knot may include some activity-related UV emission. Considering the young ≲5 Myr old stellar population indicated by the continuous star formation models and the CSS source's (dynamical) age, we suggest that the star-forming activity in this BCG host could have been ignited due to gas infall and/or gas compression from possible X-ray cavities, and eventually enhanced by the radio source.
We also separately fit the other two sources detected close to the target CSS host in the optical image that were masked out for the analysis of 1201+394. The galaxy to the far NW has a 1σ aperture magnitude of 21.58 ± 0.37 (corrected for Galactic extinction), and is best fit by an n = 2 Sérsic profile of Reff = 05. The other neighboring source, detected closer to the host, is best fit with an extended profile of an n = 4 Sérsic, with Reff = 325; though the faint outer regions in the profile may have light contribution from 1201+394 in this case.
1203+645. This peculiarly shaped BLRG (Holt et al. 2008; Westhues et al. 2016; Liao & Gu 2020) is the extensively studied host to the most powerful radio source in our sample, 3C 268.3. Located in a cluster, this galaxy has clear signs of tidal interactions (elongated, bent arm-like structures in the north–south direction), and a neighboring source 2'' to the southwest (SW), which is likely a cluster companion. The radio emission has an asymmetric double-lobed morphology with a faint, possible core detected at 5 GHz (Ludke et al. 1998; Gilbert et al. 2004) about 1.5 kpc south of the northern lobe. Our HST/VLA overlays do not take this possible core position into account, instead, we align our images by matching the optical center with the midpoint of the 5 GHz radio map. (Aligning w.r.t the possible core would shift the overlaid contours 03 toward the south, further coinciding with the extended UV regions). Murgia et al. (1999) found the radiative age for the CSS source to be 3.5 × 10⁴ yr.
The best-fitting model for the optical source is an ∼1000 pc nuclear bar along with a faint (25.3 AB mag) nuclear point source. The north–south filamentary structure was masked for the purpose of 2D modeling. The UV emission is spread out to about 22 away from the optical center of the source, hence is likely a tail of extended emission. Three Sérsic components at distinct centroids, with the largest effective radius of ∼6 kpc, are needed to fully fit the UV regions. The low Sérsic indices (0.1−1) indicate a rather flat core and sharply decreasing intensity outward. This is consistent with clumpy, star-forming regions.
The bright source to the SW of the CSS host in the optical image is likely a cluster companion. It shows a 1σ magnitude of 22.94 ± 0.53 (corrected for Galactic extinction) and best fits with a nuclear bar profile (α = 2, β = 2.1, γ = 0.8) of effective radius of ∼0.6 kpc.
The galaxy 1203+645 has previously been imaged with HST in the broadband (de Vries et al. 1997, 1999) and narrowband (Axon et al. 2000; Privon et al. 2008) optical filters. Figure 9 compares the de Vries et al. broadband image with our optical and UV-band data. The bright [O iii]-line-emitting tail (de Vries et al. 1999) extending well beyond the galactic continuum in our optical image (overlaid contours) is an interesting feature. The line-emission tail closely aligns with the ∼15 kpc extended UV continuum regions as well as the radio source. This strongly suggests that while the peculiar NW–SE filaments (seen in our line-free continuum image) might have been a result of galactic interaction in the cluster environment, the expanding jet is likely driving shocks that ionize the line-emitting gas and caused starburst activity in the extended tail structure. Narrow emission-line regions in this galaxy reveal dense, radio source-aligned ionized gas clouds in the ISM. Spatially resolved kinematic analyses (Labiano et al. 2005; Holt 2009; Shih et al. 2013) have suggested that a combination of AGN photoionization and shock ionization might be responsible for emission-line regions. Reynaldi (2016) agrees that shocks were triggered by jet–cloud interaction and must be taken into account to explain the spatial behavior of emission lines. H i absorption has been detected in the northern lobe of 3C 268.3 (Labiano et al. 2006) and found to be consistent with the H i being produced in emission-line clouds in the vicinity of the radio source, further supporting the jet–ISM interaction hypothesis. The findings support our argument that jet-induced star formation might be the cause of the UV-bright tail.
The WISE colors for this galaxy show AGN-dominant IR emission, which would explain the high 22 μm luminosity (heavy contribution from AGN-heated dust) and much higher SFR estimates compared to other bands. Westhues et al. (2016) analyzed the optical-to-IR SED for 1203+645 and estimated broadband far-IR (8–1000 μm) SFR of 17.4 M⊙ yr−1.
1221-423. Part of an interacting galaxy pair, this face-on spiral hosts a young CSS radio source emerging from a LINER nucleus in a gas-rich environment. The irregular radio structure is evidence of a vigorous jet–ISM interaction that has caused the southern jet to be bent in a 180◦ turn. Strong extended line emission has been observed in this radio galaxy with spatial structure suggestive of both AGN-ionized regions and star formation signature (Anderson et al. 2013). Three distinct stellar populations have been found in an earlier study by Johnston et al. (2005): the old (∼15 Gyr) population in the outer boundary, the intermediate-age (∼300 Myr) population around the core and along the tidal tail with a southern companion galaxy, and a young star population (∼10 Myr) near the nucleus and blue knots. The more recent starburst episodes were attributed to tidal interactions with the companion galaxy; the same event has also been suggested to have triggered the radio source, after an ∼100 Myr interval. The radiative age of the CSS source has been estimated to be 105 yr (Safouris et al. 2003), which led Johnston et al. (2005) to conclude that there must be a substantial time delay between the most recent star formation and the birth of the radio source. However, considering the striking spatial correlation of star-forming regions with jet structure, we suggest that the gas infall from the ongoing galactic interaction proposed to have triggered the AGN, might also have ignited star formation near the nuclear region, which was then enhanced by the expanding jet. This could explain the southern filament extending out to about ∼1 kpc from the nucleus and the UV knot cospatial with the southern radio peak (Figure 5). Observing a low index of the 4000 Å break in the nuclear region, Johnston et al. (2005) confirmed the presence of recent star formation. The AGN contribution to the blue excess is likely to be less than half the total UV light (Johnston et al. 2005). Further, optical continuum modeling by Johnston et al. (2010) found evidence of an ∼5 Myr old stellar population in the nuclear region of the host, consistent with our results (Figure 8).
In the R- and V-band imaging of Johnston et al. (2005), 1221-423 host was fit with a de Vaucouleurs bulge of half-light radius of 42 kpc plus an exponential disk. Our best-fit visible band galfit model is a combination of a flat, sharply truncated Sérsic bulge (n = 0.3) and a Rs ∼ 6 kpc exponential disk component oriented at 42° w.r.t. the bulge and brighter by 3 orders of magnitude. The inner 1 kpc also shows another disky component, fainter than the other two components. The nuclear UV emission is best fit with an n = 2.5 Sérsic component of an ∼3 kpc effective radius. Another UV knot about a kiloparsec from the nucleus coincides with the southern radio lobe and so is likely jet induced.
The UV clumps scattered along the spiral arms (Figure 4) are likely H ii-emitting star-forming nebulae. We extracted photometry for each individual knot (shown in Figure 10), using SExtractor source detection, with a 3σ threshold. The circumnuclear region was left out due to its spatial association with the AGN jet. Table 12 lists the aperture size and observed magnitude of each knot.
Table 12. SExtractor Photometry of the Outlying UV Clumps in the 1221-423 System
| Region # | Aperture Radius | Kron Magnitude |
|---|---|---|
| (arcsec) | (mag) | |
| 1 | 0.30 | 22.37 ± 0.77 |
| 2 | 0.26 | 21.81 ± 0.59 |
| 3 | 0.35 | 23.17 ± 1.11 |
| 4 | 0.28 | 23.98 ± 1.61 |
| 5 | 0.36 | 22.24 ± 0.72 |
| 6 | 0.34 | 23.28 ± 1.16 |
| 7 | 0.38 | 23.25 ± 1.15 |
| 8 | 0.34 | 23.55 ± 1.32 |
| 9 | 0.34 | 23.80 ± 1.48 |
| 10 | 0.34 | 22.87 ± 0.96 |
| 11 | 0.34 | 23.22 ± 1.13 |
| 12 | 0.38 | 23.02 ± 1.04 |
| 13 | 0.39 | 21.50 ± 0.51 |
| 14 | 0.40 | 21.86 ± 0.60 |
| 15 | 0.39 | 23.06 ± 1.05 |
| 16 | 0.37 | 23.55 ± 1.32 |
| 17 | 0.39 | 23.27 ± 1.16 |
Note. Projected spatial scale at source redshift is 2.923 kpc/''.
Download table as: ASCIITypeset image
1445+410. The host galaxy of an ∼26 kpc steep-spectrum radio source. Although it lies in the region of high star formation activity on the WISE color plot (W2−W3 >1.6; Figure 1), our imaging observations did not detect UV continuum in this galaxy. A recent study by Nascimento et al. (2022) found a low SFR of 0.05 M⊙ yr−1 over the last 50 Myr in the host, using stellar population synthesis with Sloan Digital Sky Survey (SDSS)/DR12 spectral data.
Best-fit galfit model for this galaxy is an n = 10 Sérsic ellipse of ∼70 kpc half-light radius, along with a bar structure of radius of ∼1.6 kpc offset from the optical centroid by 02. The fit also suggests a faint nuclear point source component with an integrated magnitude of 23.2 (AB mag).
7. Summary and Conclusions
We obtained and analyzed subarcsecond resolution HST imaging for seven CSS radio galaxies against two larger radio galaxies as control. The radio galaxies with >20 kpc-sized radio sources do not show star-forming UV emission. We use the visible band observations and archival IR data for these galaxies to examine their stellar continuum morphology and optical-IR SED. For the galaxies where UV continuum emission is detected, the UV data were compared with the optical and radio maps. We also modeled the UV continuum with synthesized spectra of stellar populations of different ages. Our key findings are summarized below:
- 1.About half of the sample has large-scale perturbed morphological features—large-scale tidal tails in 1037+30, faint extended arm-like structure in B1128+455, extended x-shaped filaments in 1203+645, the 1221-423 system—that hint at probable merger history or ongoing interactions. Two CSS hosts in the sample (1201+394 and 1203+645) are located in galaxy clusters and show close neighboring galaxies that are likely gravitationally interacting cluster companions.The presence of strong spiral and/or disk-like structure in three out of seven CSS galaxies in the sample (0258+25, 1128+455, and 1221-423) is an interesting result since PS/CSS sources are generally hosted in large ellipticals (see O'Dea & Saikia 2021 for a review) with very few known late-type hosts. Observations with larger samples of compact radio galaxies could test for this effect.
- 2.Surface brightness modeling of the line-free optical continuum shows that almost all of the host galaxies in the sample exhibit isophotal twists with highly varying ellipticity in their radial profiles and heavy 2D-model residuals in the core, which suggests mildly (e.g., 1025+390) to highly complex (e.g., 1037+30) nuclear structure. Four galaxies may be rare bulgeless AGN hosts; deeper observations are needed to confirm this because of their higher redshifts (0.3 < z < 0.6).The best-fit models for four out of seven CSS radio galaxies in the sample show a faint nuclear point source component. This suggests that these are possibly home to low-luminosity AGN (1025+390, 1037+30, and 1445+410) or a broad-line AGN that is heavily obscured (1203+645).
- 3.NUV continuum maps reveal spatially resolved, clumpy emission in six out of seven CSS hosts. The UV emission clearly comes from extended star-forming regions beyond the nucleus. While direct UV light from the AGN will not contribute significantly to the extended emission, some fraction of the observed UV excess may arise from continuum emission from ionized gas nebulae and/or scattered AGN radiation. Follow-up integral field unit spectroscopic observations are needed to spatially resolve nebular emission in the extended UV regions, while polarized UV imaging can help constrain the scattered UV contamination.
- 4.Continuum UV emission is aligned along the kiloparsec-scale steep-spectrum radio lobes in five CSS galaxies (plus possible alignment in 1201+394). Three CSS galaxies with aligned UV light (1025+390, 1037+30, and 1221-423) are strong candidates for jet-induced star formation; while others (1128+455 and 1203+645) may have added contribution from radiative outflows in the jet-aligned regions, or need deeper UV observations (1201+394). In general, these detections expand the sample size for the suspected footprint of positive radio source feedback; 3C 303.1 has been the only known CSS candidate for radio source-triggered star formation so far (Labiano et al. 2008; O'Dea 2009).
- 5.Low (approximately a few to a few tens of solar mass per year) rates of star formation are observed in the UV-bright CSS hosts, though these are lower limits by what could be a significant margin. This is likely because (i) existing UV-to-SFR calibrations inherently underestimate SFRs, and (ii) while our high internal extinction corrections show that heavy line-of-sight dust obscuration in the host galaxies is unlikely, ISM dust mixed with star-forming regions may act as a screen, obscuring and/or highly attenuating the UV light coming from new stars on the far side of the dust clouds. This could also explain the undetected UV emission in 0258+35 as its host galaxy harbors massive dust lanes.Activity-related contribution to the observed UV is unlikely in four sources that are hosted in NLRGs since the UV-derived SFRs are found to be the lowest among all other tracers. The WISE 22 μm-derived SFRs, on the other hand, are likely contaminated by nuclear activity (i.e., dust heated by the AGN) and hence represent upper limits.
- 6.Young stellar population produced in a recent (∼1–8 Myr old) continuous starburst is most consistent with the observed UV continuum in the CSS galaxies. However, given the limitations of the synthesis modeling and SFR calibrations, we do not rule out a <1 Myr old stellar population. The dynamical radio source ages of the sample range from 0.01–0.1 Myr. This suggests the starbursts could have been induced by the current young radio source, or in a past episode of jet activity. It is also possible that the radio source might be confined to a small size by a dense ISM environment, in which case it could easily trigger the starbursts that produce the ∼1–10 Myr old stellar population. X-ray observations will help probe the jet frustration scenario.Although most CSS hosts show disturbed morphologies typical of galactic interactions, observed star formation is unlikely to have been triggered due to a merger event, since our estimates show starbursts too young for merger-driven gas infall timescale. Assuming an instantaneous single burst, an initial 107–108 M⊙ starburst triggered ∼1–10 Myr ago would likely produce enough hot massive stars to generate the observed UV.
- 7.The observed UV flux is consistent with the emission-line nebula being ionized by hot, massive stars. The young stellar population would produce a significant fraction of the ionizing photons required to power the nebula, although other sources (e.g., photoionization by the AGN) may also contribute to certain regions of the nebula.
Our results show that compact, young radio galaxies hold the key to understanding jet–ISM interplay on sub-galactic scales. Recent simulation studies of radio-mode feedback have found that most of the star formation occurs in the first few megayears (e.g., Mukherjee et al. 2018; Bourne & Sijacki 2021), in agreement with our observations. Detection of radio-aligned star-forming regions, even in low- to moderate-power CSS hosts, is a promising diagnostic of the mechanically driven positive AGN feedback that stimulates galaxy growth on short timescales. The presence of jet-induced star formation confirms a salient prediction of the radio jet feedback model in AGN host galaxies. Further investigation with integral field observations of the ionized gas kinematics as well as measurements of cold molecular gas distribution in the CSS hosts, will shed more light on the extent and efficiency of the positive feedback mechanism.
All Python codes and Jupyter notebooks created for the analyses in this paper are available in publicly accessible online repositories 19 Duggal (2023a) and Duggal (2023b).
Acknowledgments
C.D. thanks Dr. Biny Sebastian for performing radio imaging for some of the archival VLA data, and Dr. Sravani Vaddi for sharing her PyRAF photometry scripts. C.D., C.O., and S.B. acknowledge support from the Natural Sciences and Engineering Research Council (NSERC) of Canada. This research has made use of NASA's Astrophysics Data System Bibliographic Services. This research has made use of the NASA/IPAC Extragalactic Database (NED), as well as the NASA/IPAC Infrared Science Archive (IRSA), which are funded by the National Aeronautics and Space Administration and operated by the California Institute of Technology. This research has made use of Mikulski Archive for Space Telescopes (MAST) data products—Hubble Source Catalog (STScI 2016), GALEX/MCAT (STScI 2013), and the Pan-STARRS1 DR2 Catalog (STScI 2022). This work is based in part on observations made with the Spitzer Space Telescope, which was operated by the Jet Propulsion Laboratory, California Institute of Technology under a contract with NASA.
Facilities: HST - Hubble Space Telescope satellite, VLA - Very Large Array, Sloan - , CTIO:2MASS - , WISE - Wide-field Infrared Survey Explorer, GALEX - Galaxy Evolution Explorer satellite, PS1 - Panoramic Survey Telescope and Rapid Response System Telescope #1 (Pan-STARRS).
Software: Ned Wright's Cosmological Calculator (Wright 2006), SAOImage ds9 (Joye & Mandel 2003), numpy (Harris et al. 2020), astropy (Astropy Collaboration et al. 2013, 2018, 2022), matplotlib (Hunter 2007), ipython (Perez & Granger 2007), extinction (Barbary 2016), reproject (Robitaille et al. 2020), EllipSect (Añorve 2020), drizzlepa c (Hoffmann et al. 2021), IRAF (National Optical Astronomy Observatories 1999), tinytim (Krist et al. 2011), galfit (Peng et al. 2002; Peng & Ho 2010), stsynphot (STScI Development Team 2020), starburst99 (Leitherer et al. 1999), aips (van Moorsel et al. 1996), SExtractor (Bertin & Arnouts 1996).
Appendix: Atlas of Images and Galaxy Fitting Results
The following pages contain the images and plots showing the results of ellipse photometric analysis (referenced in Section 4.1) and galfit morphological decomposition (referenced in Section 4.2), of HST observations of the entire sample.
A.1. Visible-band HST Imaging
1D and 2D surface brightness modeling for the nine target radio galaxies. Blue regions mark the masked-out objects (Figures 11–19).
A.2. NUV-band HST Imaging
Footnotes
- 9
WISE telescope (Wright et al. 2010).
- 10
- 11
- 12
- 13
- 14
- 15
- 16
- 17
- 18
- 19
The code repositories are archived at 10.5281/zenodo.10343543, 10.5281/zenodo.10343523, and also available at https://github.com/chetnaduggal.