


Abstract
We present the discovery of Ursa Major III/UNIONS 1, the least luminous known satellite of the Milky Way, which is estimated to have an absolute V-band magnitude of  mag, equivalent to a total stellar mass of
  M⊙. Ursa Major III/UNIONS 1 was uncovered in the deep, wide-field Ultraviolet Near Infrared Optical Northern Survey (UNIONS) and is consistent with an old (τ > 11 Gyr), metal-poor ([Fe/H] ∼ −2.2) stellar population at a heliocentric distance of ∼10 kpc. Despite its being compact (rh = 3 ± 1 pc) and composed of few stars, we confirm the reality of Ursa Major III/UNIONS 1 with Keck II/DEIMOS follow-up spectroscopy and identify 11 radial velocity members, eight of which have full astrometric data from Gaia and are co-moving based on their proper motions. Based on these 11 radial velocity members, we derive an intrinsic velocity dispersion of
  km s−1 but some caveats preclude this value from being interpreted as a direct indicator of the underlying gravitational potential at this time. Primarily, the exclusion of the largest velocity outlier from the member list drops the velocity dispersion to
  km s−1, and the subsequent removal of an additional outlier star produces an unresolved velocity dispersion. While the presence of binary stars may be inflating the measurement, the possibility of a significant velocity dispersion makes Ursa Major III/UNIONS 1 a high-priority candidate for multi-epoch spectroscopic follow-ups to deduce the true nature of this incredibly faint satellite.
Export citation and abstract BibTeX RIS

Original content from this work may be used under the terms of the Creative Commons Attribution 4.0 licence. Any further distribution of this work must maintain attribution to the author(s) and the title of the work, journal citation and DOI.
1. Introduction
Wide-field digital photometric surveys have revealed a rich landscape of substructure in the Milky Way halo since their inception in the early 2000s. The Sloan Digital Sky Survey (Abazajian et al. 2009) made an immense impact, brokering the discoveries of many faint Milky Way dwarf galaxy satellites (e.g., Willman et al. 2005a, 2005b; Belokurov et al. 2006, 2007, 2009, 2010; Zucker et al. 2006). Another waterfall of Milky Way dwarf galaxy discoveries (e.g., Bechtol et al. 2015; Drlica-Wagner et al. 2015; Koposov et al. 2015; Laevens et al. 2015a, 2015b; Homma et al. 2016, 2018) came with the assembly of photometric catalogs such as those of Pan-STARRS 3pi (Chambers et al. 2016), the Dark Energy Survey (DES; Abbott et al. 2018), and the Hyper Suprime-Cam Subaru Strategic Program (HSC-SSP; Aihara et al. 2018a, 2018b).
Ongoing surveys, such as the Dark Energy Local Volume Explorer (DELVE; Drlica-Wagner et al. 2021, 2022) and the Ultraviolet Near Infrared Optical Northern Survey (UNIONS; Ibata et al. 2017), have continued to bolster the known Milky Way satellite dwarf galaxy population (Mau et al. 2020; Cerny et al. 2021, 2023a, 2023b; Smith et al. 2023). The Gaia space telescope (Gaia Collaboration et al. 2016, 2021) has also been revolutionary, with its proper-motion measurements providing additional constraints for characterizing and discovering both dwarf galaxies (e.g., Pace & Li 2019; Torrealba et al. 2019b; McConnachie & Venn 2020a, 2020b) and globular clusters (e.g., Torrealba et al. 2019a; Pace et al. 2023).
Classical globular clusters are typically bright and compact stellar systems, while dwarf galaxies are orders of magnitude more diffuse than globular clusters at similar magnitudes and cover a much broader range in characteristic size. Willman & Strader (2012) proposed that the key physical distinction between these two types of systems is that the dynamics of dwarf galaxies cannot be explained through a combination of baryonic processes and Newton's laws, while globular clusters can be explained in such a way. Therefore, in the framework of ΛCDM cosmology, dwarf galaxies are thought to lie at the center of their own dark matter halos. The faintest known dwarf galaxies (sometimes called ultrafaint dwarf galaxies or UFDs; Simon 2019) are observed to have dynamical masses (measured from stellar kinematics) many orders of magnitude larger than the mass implied by the total luminosity (dynamical mass-to-light ratios (M/L) ∼103 M⊙/L⊙). Dynamical analysis of globular clusters, on the other hand, shows that they do not have appreciable amounts of dark matter and are comprised solely of baryonic matter.
Willman & Strader (2012) also suggested that a significant dispersion in the distribution of stellar metallicities could be used as a proxy for the presence of a dark matter halo. It is argued that the shallow potential wells of globular clusters are unable to retain the products of stellar feedback and thus form a stellar population of a single metallicity. In contrast, it is argued that dwarf galaxies can retain gas and have prolonged star formation histories, leading to self-enrichment. Significant metallicity dispersions have often been used to distinguish between dwarf galaxies and globular clusters in this way (e.g., Leaman 2012; Kirby et al. 2013; Li et al. 2022).
In parallel with the increase of dwarf galaxy discoveries, a number of faint Milky Way satellites of ambiguous nature have also been unearthed. These systems are typically small in physical extent (half-light radius rh ≲ 15 pc), well within the virial radius of the Milky Way (heliocentric distance D⊙ ≲100 kpc), and faint (absolute V-band magnitude MV ≳ −3 mag). 13 Beyond these general observations, these tiny Milky Way satellites are still poorly understood for two reasons: (1) in these observed properties, they lie at the interface of dwarf galaxies and globular clusters, and (2) their internal dynamics and chemical properties are not well studied en masse.
Diagnostics such as size (e.g., Balbinot et al. 2013; Conn et al. 2018), stellar mass segregation (e.g., Koposov et al. 2007; Kim et al. 2015), and comparison to the dwarf galaxy stellar mass–metallicity relation (e.g., Jerjen et al. 2018) have been used to argue that some of these systems are more likely to be ultrafaint star clusters (i.e., ones lacking dark matter). However, neither the presence nor the lack of a dark matter halo has been demonstrated conclusively for any one of these systems.
Dynamically confirming the nature of any one of these faint, ambiguous satellites could extend either the globular cluster or the dwarf galaxy luminosity functions by up to a few orders of magnitude, and could extend the dwarf galaxy scale-length function by up to a factor of 10. Globular clusters are valuable for studying the evolution of the interstellar medium and stellar populations over cosmic time (e.g., Krumholz et al. 2019; Adamo et al. 2020) while dwarf galaxies have proven to be powerful probes of star formation (e.g., Bovill & Ricotti 2009), chemical enrichment (e.g., Ji et al. 2016a, 2016b; Hayes et al. 2023; Ji et al. 2023), and the nature of dark matter (e.g., Lovell et al. 2012; Wheeler et al. 2015; Bullock & Boylan-Kolchin 2017; Applebaum et al. 2021). The faintest and smallest dwarf Milky Way satellites are particularly constraining. Their total number may be used to constrain alternative models, such as "warm" dark matter (Lovell et al. 2012), or "fuzzy" dark matter (Nadler et al. 2021). In addition, their characteristic densities place strong constraints on self-interacting dark matter models (Errani et al. 2022; Silverman et al. 2023). Additional studies of these faint, ambiguous systems, including their radial velocity and metallicity measurements, will be needed to further understand individual satellites as well as how the characteristics of globular cluster and dwarf galaxy populations extend to such faint magnitudes and parsec length scales.
In this paper, we detail the discovery and characterization of Ursa Major III/UNIONS 1 (UMa3/U1), the least luminous Milky Way satellite detected to date. Line-of-sight velocities of candidate member stars obtained through follow-up spectroscopic observations may imply a significant radial velocity dispersion, but repeat radial velocity measurements are needed to conclusively demonstrate whether dark matter is present in this system. We refer to this system as UMa3/U1 as its identity as a dwarf galaxy or star cluster is not clear at this time. In Section 2 we summarize the discovery data set, the detection of the system, and the follow-up spectroscopy. In Section 3, we characterize the structural parameters of UMa3/U1, as well as its distance, luminosity, dynamics, and orbit. Finally, in Section 4, we discuss the classification of UMa3/U1, and summarize our results.
2. Data and Detection
2.1. UNIONS
UMa3/U1 was discovered during an ongoing search for faint Local Group systems in the deep wide-field UNIONS. UNIONS is a consortium of Hawaii-based surveys working in conjunction to image a vast swath of the northern skies in the ugriz photometric bands. Four distinct surveys are contributing independent imaging: the Canada–France Imaging Survey (CFIS) at the Canada–France–Hawaii Telescope (CFHT) is targeting deep u and r photometry, Pan-STARRS is obtaining deep i and moderately deep z observations, the Wide Imaging with Subaru HSC of the Euclid Sky (WISHES) program is acquiring deep z at the Subaru Telescope, and the Waterloo–Hawaii IfA g-band Survey (WHIGS) is responsible for deep g imaging, also with Subaru. Together, these surveys are covering 5000 deg2 at decl. of δ > 30° and Galactic latitudes of ∣b∣ > 30°. UNIONS was in part brought together to support the Euclid space mission, providing robust ground-based ugriz photometry necessary for photometric redshifts that would be the main pillar of Euclid's science operations. However, UNIONS is a separate survey whose aim is to maximize the science returns of this powerful, deep, wide-field photometric data set. UNIONS aims to deliver 5σ point-source depths of 24.3, 25.2, 24.9, 24.3, and 24.1 mag in ugriz, which are roughly equivalent to the first year of observations expected from the Legacy Survey of Space and Time (LSST) at the Vera C. Rubin Observatory, making UNIONS the benchmark photometric survey in the northern skies for the coming decade.
This work only utilizes the CFIS r-band and Pan-STARRS i-band catalogs. The median 5σ point-source depth in a 2'' aperture is 24.9 mag in r and 24.0 mag in i, although the Pan-STARRS i depth will increase over time owing to the scanning-type observing strategy employed. Currently, the area common to the two data sets spans more than 3500 deg2 across both the north Galactic cap and south Galactic cap. These catalogs were cross-matched with a matching tolerance of 0 5, though sources typically matched to better than 013.
The median image quality of the CFIS r observations is an outstanding 069, allowing us to perform star–galaxy separation morphologically. We correct for galactic extinction using the E(B − V) values from Schlegel et al. (1998) assuming the conversion factors given by Schlafly & Finkbeiner (2011) for a reddening parameter of RV
= 3.1. The CFHT r-band filter is not present in the Schlafly & Finkbeiner (2011) list, so we adopt the conversion factor for the Dark Energy Camera (DECam) r-band filter (Flaugher et al. 2015) given that their full widths at half-maximum (FWHMs) are identical, and that the DECam r centroid is shifted redward from CFHT r by only 2 nm. For the remainder of the article, r will refer to CFIS r and i will refer to Pan-STARRS i unless otherwise specified.
2.2. Detection Method
UMa3/U1 was discovered as a spatially resolved overdensity of stars using a matched-filter approach. Variations on this general methodology have proven to be efficient and productive in discovering faint dwarf galaxies and faint star clusters in wide-field surveys (e.g., Koposov et al. 2007, 2015; Walsh et al. 2009; Bechtol et al. 2015; Drlica-Wagner et al. 2015; Homma et al. 2018).
Our particular implementation of the algorithm will be described here in brief, though we refer the reader to Smith et al. (2023) for a more detailed view of the search method. A matched filter seeks to isolate stars that belong to a particular stellar population, in order to create contrast in stellar density between the member stars of a putative satellite and the Milky Way stellar background. We start by selecting all stars in the UNIONS footprint that are consistent with a 12 Gyr, [Fe/H] = −2 PARSEC isochrone (Bressan et al. 2012), constructed from the CFHT r and Pan-STARRS i bands, with the isochrone shifted to a test distance. Stars are then tangent-plane-projected, binned into 0 5 × 05 pixels, and smoothed with Gaussian kernels with FWHMs of 12, 24, and 48. The broad-scale mean and variance are then subtracted and divided out from the smoothed maps, respectively, to find the significance of each pixel with respect to the Milky Way background. All peaks in the significance map are then recorded for future examination, and this process is repeated for a series of heliocentric distances spaced roughly logarithmically from 10 kpc to 1 Mpc.
Our matched-filter algorithm has been successful in detecting previously known dwarf galaxies. It should be noted that dwarf galaxy detections are the main focus of this search, but extragalactic star clusters are also typically old and metal-poor, so the matched filter ought to pick them up as well. We have used the known dwarf galaxy population to do a first-pass assessment of the algorithm's efficiency. Within 1 Mpc, we have recovered, with high statistical significance, all known Local Group dwarf galaxies (including M31 dwarfs) that were found in shallower surveys with matched-filter methods. We have also detected other galaxies in the local Universe out to 2 Mpc, and several Milky Way globular clusters.
UMa3/U1 is one of the most prominent candidates without a previous association produced from our search, on par with the detection significance of some known UFDs in the UNIONS sky. UMa3/U1 is most prominently detected in the significance map produced by the 12-smoothed, 10 kpc iteration at a statistical significance of 3.7σ above the background. For reference, Draco II is an ultrafaint satellite of the Milky Way whose true nature is unknown, but it has been estimated to be ∼20 kpc distant, and is detected at 2.8σ above the background in our own search. Figure 1 shows a color–magnitude diagram (CMD) using r, i photometry demonstrating the detection of stars about UMa3/U1 that meet the matched-filter selection criteria. We also show the equivalent CMD of a reference field, which is an equal-area elliptical annulus, to indicate the expected level of source contamination in the detection.
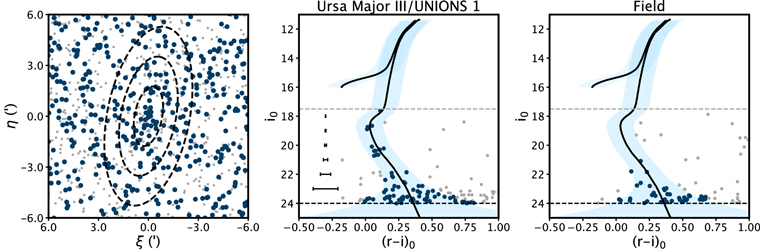
Figure 1. Detection plot for UMa3/U1. Left: tangent-plane-projected sky positions of all stars within a 12' ×12' region around the overdensity. Isochrone-selected points are colored blue while unselected stars are gray. The dashed black ellipses have semimajor axes of 2×, 4×, and 6× the half-light radius (rh), where rh is determined by the Markov Chain Monte Carlo structural-parameter estimation routine described in Section 3.2. Center: CMD of extinction-corrected r, i photometry for all stars within the 4 × rh ellipse. An old (12 Gyr), metal-poor ([Fe/H] = −2.2) isochrone shifted to a distance of 10 kpc is overlaid (black), along with the matched-filter selection region (light blue). Sources are colored as in the left-hand panel. The median photometric uncertainties as a function of i magnitude are shown in black on the left side of the CMD. The median 5σ point-source depth of i (24 mag) is shown as a black dashed line while the approximate saturation limit (17.5 mag) is shown as a gray dashed line. Right: same as central panel, but for all stars in an outer annulus with an area equal to the area enclosed by the 4rh ellipse. Nominally, these sources should be comprised of Milky Way halo stars and incorrectly classified faint background galaxies, which demonstrates the level of contamination on the UMa3/U1 CMD.
Download figure:
Standard image High-resolution image2.3. Keck/DEIMOS Spectroscopy
We obtained spectroscopic data for 59 stars toward UMa3/U1 using the DEIMOS spectrograph (Faber et al. 2003) on the Keck II 10 m telescope. The data were taken on 2023 April 23 using a single mutlislit mask in excellent observing conditions. Ten targets were initially selected from membership analysis based on full astrometric data from Gaia (this selection is further explained in Section 3.3). The remaining 49 targets were selected from stars that were consistent with the observed stellar population of UMa3/U1 in r, i photometry that filled the slit mask around UMa3/U1.
We used the 1200 G grating, which covers a wavelength range of 6400−9100 Å, with the OG550 blocking filter with the aim of measuring the Ca ii infrared triplet (CaT) absorption feature. Observations consisted of 3 × 20 minute exposures, or 3600 s of total exposure time. Data were reduced to 1D wavelength-calibrated spectra using the open-source Python-based data reduction code PypeIt (Prochaska et al. 2020). PypeIt reduces the eight individual DEIMOS detectors as four mosaic images, where each red/blue pair of detectors is reduced independently. When reducing data for this paper, PypeIt's default heliocentric and flexure corrections were turned off and a linear flexure term was determined as part of the 1D data reductions below.
Stellar radial velocities and calcium triplet equivalent widths (EWs) were measured using a preliminary version of the DMOST package (M. Geha et al. 2023, in preparation). In brief, DMOST forward-modeled the 1D stellar spectrum for each star from a given exposure with both a stellar template from the PHOENIX library and a telluric absorption spectrum from TelFit (Gullikson et al. 2014). The velocity was determined for each science exposure through a Markov Chain Monte Carlo (MCMC) procedure constraining both the radial velocity of the target star and the wavelength shift of the telluric spectrum needed to correct for slit miscentering (see, e.g., Sohn et al. 2007). The final radial velocity for each star was derived through an inverse-variance weighted average of the velocity measurements from each exposure. The systematic error reported by the pipeline, derived from the reproducibility of velocity measurements across masks and validated against spectroscopic surveys, is ∼ 1 km s−1 (see M. Geha et al. 2023, in preparation). Lastly, DMOST measured the EW from the CaT by fitting a Gaussian-plus-Lorentzian model to the coadded spectrum (for stars at signal-to-noise ratios, S/Ns, > 15) or a Gaussian model (for stars at S/N < 15). We assumed a 0.2 Å systematic error on the total EW determined from independent repeat measurements. Thanks to excellent observing conditions, we measured velocities and combined CaT EWs for 31 of the 59 targets and achieved spectra with a median S/N per pixel ranging from 15 to 74 for the 10 suspected members.
3. Results
3.1. Distance and Stellar Population
The matched-filter detection algorithm only searches for stellar populations with an age of 12 Gyr and a metallicity of [Fe/H] = −2, and results of the search provide an initial estimate of the distance to UMa3/U1. We further refine these properties through visual inspection in an iterative process, where we make small systematic tweaks to the distance, metallicity, and age of the stellar population until a satisfactory model is settled on. We also point out that UMa3/U1 has an extraordinarily low stellar mass (which will be explored further in Section 3.6) so this by-eye analysis is based on only a handful of stars spanning ∼6.5 mag on a CMD.
We initially set the distance to 10 kpc and explore a grid of PARSEC isochrones spanning 5–13 Gyr in age (τ) in steps of 1 Gyr and −2.2 to −1.0 in metallicity ([Fe/H]) in steps of 0.1 dex by eye. [Fe/H] = −2.2 appears to be a good fit to the data. An age τ ≥ 11 Gyr is a good fit to the few stars at the main-sequence turnoff (MSTO). Changing the age by ∼1 Gyr results in minor changes in the shape of the isochrone, while changes in metallicity are negligible, so we adopt τ = 12 Gyr and [Fe/H] = −2.2 for all calculations and derivations going forward. We note, however, that [Fe/H] = −2.2 is the most metal-poor isochrone available in our set, so this isochrone may only be an upper limit on the true systemic metallicity.
For the distance estimate, we prioritize fitting the MSTO to the four brightest stars due to their small photometric uncertainties, though the fainter stars appear to be slightly bluer on average than our best-fit isochrone, the most metal-poor in the set. While this could be explained by the large photometric uncertainties at this magnitude, we have overlaid slightly more metal-poor MIST isochrones (Choi et al. 2016). We do not find a significantly better fit, and note that variance between isochrones from different databases is large enough that attempting to constrain the distance with greater accuracy may not be appropriate. We therefore adopt a 10% uncertainty on the distance estimate, giving 10 ± 1 kpc. Adjustments of 1 kpc are incrementally made to the distance of the isochrone, and this appears to be appropriate. Figure 2 shows CMDs with all matched-filter-selected stars brighter than i0 ∼ 23 mag, where the PARSEC isochrones are overplotted with small variations in distance and age.
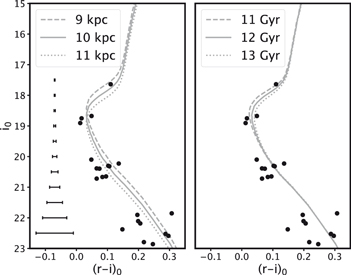
Figure 2. Left: CMD of all matched-filtered stars within 4 × rh with a set of 12 Gyr, [Fe/H] = −2.2 isochrones overplotted, shifted to distances of 9, 10, and 11 kpc to show the 10% uncertainty assigned to the distance estimate. The median photometric uncertainties as a function of i magnitude are shown in black on the left side of the CMD. Right: CMD of the same stars on the left, with the set of [Fe/H] = −2.2 isochrones shifted to a distance of 10 kpc, where the age of the stellar population is varied between 11, 12, and 13 Gyr, showing that all such isochrones approximate the data reasonably well.
Download figure:
Standard image High-resolution imageUnfortunately, we are unable to use either tip of the red giant branch (TRGB) or horizontal branch (HB) stars to further constrain the distance to UMa3/U1 as this system is so sparsely populated that no stars currently exist in these more highly evolved, shorter-duration stages of the stellar lifecycle. Given the relative closeness of the system, along with the r saturation limits of r ∼ 17.5 mag, we also search through the Third Data Release (DR3) from Gaia (Gaia Collaboration et al. 2016, 2021), but a lack of bright stars in the direction of UMa3/U1 confirms that no TRGB or HB stars are present. Additionally, we search the PS1 RR Lyrae (Sesar et al. 2017) and Gaia variability (Gaia Collaboration 2022) catalogs, but cannot identify any RR Lyrae stars within a few arcminutes of UMa3/U1. We therefore cannot use the properties of these variable stars to further constrain the heliocentric distance.
3.2. Structural Parameters
We follow a procedure that is based on the methodology laid out in Martin et al. (2008, 2016a) to estimate the structural parameters of UMa3/U1 assuming the distribution of member stars is well described by an elliptical, exponential radial surface density profile and a constant field contamination. The profile, ρdwarf(r), is parameterized by the centroid of the profile (x0, y0), the ellipticity  (defined as = 1 − b/a, where b/a is the minor-to-major-axis ratio of the model), the position angle of the major axis θ (defined east of north), the half-light radius (which is the length of the semimajor axis rh), and the number of stars N* in the system. The model is written as

where r, the elliptical radius, is related to the projected sky coordinates (x, y) by
We assume that the background stellar density is uniform, which is reasonable on the scale of arcminutes up to a degree or so. The background, Σb, is calculated as follows:

where n is the total number of stars in the field of view and A is the total area, normalizing the background density with respect to the selected region. We combine the elliptical, exponential surface density model with the uniform background term to construct our posterior distribution function,

which we sample with the afine-invariant MCMC sampler emcee (Foreman-Mackey et al. 2013) to estimate the most likely structural parameters to describe UMa3/U1. We apply flat priors to all parameters, the bounds of which are given in Table 1.
Table 1. Flat Priors for Each Parameter in the MCMC Analysis
| Parameter | Prior |
|---|---|
| x0 | −6' ≤ Δx0 ≤ +6' |
| y0 | −6' ≤ Δy0 ≤ +6' |
| rh | 0' < rh < 9' |
|
| 0 ≤ < 1 |
| θ | −90° ≤ θ < +90° |
| N* | 0 ≤ N* ≤ 100 |
Download table as: ASCIITypeset image
Prior to invoking this method, we select only those stars that are selected by the matched filter, this time using the 12 Gyr, [Fe/H] = −2.2 isochrone that was determined in Section 3.1. We apply an additional magnitude cut, retaining stars with i ≤ 23.5 mag to ensure incompleteness effects do not skew the parameter estimation.
The emcee routines are initialized with 64 walkers, each running for 10,000 iterations with the first 2000 iterations thrown out to account for burn-in. The program shows good convergence and the median value for each parameter, along with the 16th and 84th percentiles taken as uncertainties, is provided in Table 2 along with all other measured and derived properties. UMa3/U1 is compact, with a physical half-light radius (rh, the semimajor axis of the elliptical distribution) derived to be  , or 3 ± 1 pc in physical units.
Table 2. Measured and Derived Properties for UMa3/U1
| Property | Description | Value |
|---|---|---|
| αJ2000 | R.A. | 11h38m49 8 8 |
| δJ2000 | Decl. | +31°4'42'' |
| rh,ang | Angular Half-light Radius |

|
| rh,phys | Physical Half-light Radius | 3 ± 1 pc |
|
| Ellipticity |

|
| θ | Position Angle |

|
| N* | Number of Stars (down to i = 23.5 mag) |

|
| D⊙ | Heliocentric Distance | 10 ± 1 kpc |
| (m − M)0 | Distance Modulus | 15.0 ± 0.2 mag |
| τ | Age (Isochrone) | 12 Gyr a |
| [Fe/H] | Metallicity (Isochrone) | −2.2 dex b |
| Mtot | Total Stellar Mass |
 M⊙
M⊙
|
| MV | Absolute V-band Magnitude | +2.2 mag mag |
| Ntot | Total Number of Stars |

|
| μeff | Effective Surface Brightness | 27 ± 1 mag arcsec−2 |
| μα cos δ | Proper Motion in R.A. | −0.75 ± 0.09 (stat) ± 0.033 (sys) mas yr−1 c |
| μδ | Proper Motion in Decl. | 1.15 ± 0.14 (stat) ± 0.033 (sys) mas yr−1 c |
| 〈v⊙〉 | Mean Heliocentric Velocity | 88.6 ± 1.3 km s−1 |
| σv | Intrinsic Velocity Dispersion |
 km s−1
d km s−1
d
|
| M/L1/2 | Dynamical Mass-to-light Ratio (<rh) |
 M⊙/L⊙
d
M⊙/L⊙
d
|
| rperi | Pericenter |
 kpc kpc |
| rapo | Apocenter |
 kpc kpc |

| Maximum Height above Milky Way Disk |
 kpc kpc |
|
orb
| Orbital Eccentricity |

|
| Δtperi | Time between Pericenters |
 Myr Myr |
| tsince | Time since Last Pericenter |
 Myr Myr |
Notes.
a All isochrones with τ > 11 Gyr fit the data well, but we adopt τ = 12 Gyr for computations. b [Fe/H] = −2.2 is the most metal-poor isochrone available in our set. c Systematic uncertainties were investigated by Lindegren et al. (2021). d The removal of a single star (#2 in Table 3) drops the velocity dispersion to km s−1, decreasing the inferred M/L1/2 to
  M⊙/L⊙.
Download table as: ASCIITypeset image
3.3. Proper Motion
Despite its extreme dearth of giant stars, UMa3/U1 lies close enough that several stars are brighter than the approximate limiting magnitude (G ∼ 21 mag) of Gaia DR3. Using stars with full astrometric data (Lindegren et al. 2021), we estimate the systemic proper motion of UMa3/U1 and assign likelihoods for individual stars to be members of this faint stellar system.
We follow the methodology of Jensen et al. (2024), which builds on McConnachie & Venn (2020a, 2020b), and we refer the reader to those papers for more details regarding the algorithm. Briefly, the method uses spatial, photometric, and astrometric information about each star, in conjunction with the structural parameters derived for some stellar system, to compute the likelihood that a given star is a member of a putative stellar system rather than a member of the Milky Way foreground stellar population. The Milky Way foreground prior distributions for each parameter are calculated empirically using a subset of stars detected by Gaia in a 2° circle about the location of the system, where the Gaia photometry was extinction-corrected following Gaia Collaboration et al.(2018).
In this application to UMa3/U1, we use the structural parameters derived from UNIONS data in Section 3.2 and the stellar population estimates of τ = 12 Gyr and [Fe/H] = −2.2. The systemic proper motion of UMa3/U1 is estimated by the membership algorithm to be (μα cos δ, μδ ) = (−0.75 ± 0.09 (stat) ± 0.033 (sys), 1.15 ± 0.14 (stat) ± 0.033 (sys)) mas yr−1. This process also identifies seven stars with Psat > 0.99 (where Psat is the membership likelihood) and an additional star with Psat = 0.75. Jensen et al. (2024) have investigated the workings of this code, finding that Psat ∼ 0.2 actually corresponds to a ∼50% probability of being a member (based on known members identified via radial velocities), so we find eight high-likelihood member stars in total based on Gaia measurements. Two additional stars with marginal membership likelihoods (0.01 < Psat < 0.10) near to the centroid of UMa3/U1 are also targeted in our spectroscopic follow-up for further investigation.
3.4. Membership
As discussed in Section 2.3, 31 of the 59 target spectra are successfully measured following M. Geha et al. (2023, in preparation), producing heliocentric radial velocities (v⊙) and combined CaT EWs (the sum of all three CaT absorption features, ΣEW). Traditionally, methods of inferring metallicity ([Fe/H]) from CaT EWs have been calibrated using red giant branch (RGB) stars (Starkenburg et al. 2010; Carrera et al. 2013). Due to its extraordinarily low stellar mass, U1 only has a single post-main-sequence star visible on its CMD, with this one star lying at the inflection point of the best-fitting isochrone where the subgiant branch transitions to the RGB. We estimate this star to have log(g) = 3.51 using the best-fit isochrone, so while it has evolved off the main sequence, it is outside the range of log(g) for which [Fe/H] estimators have been calibrated. The calibration from Starkenburg et al. (2010) considered model spectra computed for RGB stars with 0.5 ≤ log(g) ≤ 2.5 while Carrera et al. (2013) calibrated the [Fe/H]–CaT ΣEW relationship using RGB stars that lay in the range 0.7 ≤ log(g) ≤ 3.0, where log(g) was derived from high-resolution spectroscopy. However, we still are able to use the measured ΣEW to help with membership identification.
Using a combination of v⊙, ΣEW, and membership likelihoods assigned from the algorithm described in Section 3.3, we isolate member stars. In Figure 3, we plot all potential member stars on-sky and on a CMD of extinction-corrected r, i photometry. The four brightest members are all in good agreement with the best-fit isochrone. In the range 20 ≤ G0 ≤ 21 mag, there are several stars that are all roughly consistent with the isochrone, though there is some scatter. The eight sources marked with blue circles are those with high membership likelihoods (Psat ≥ 0.75) and the orange squares are three additional stars that are consistent with Gaia-identified members both spatially and in v⊙, but do not have full astrometric data, and could therefore not be identified by the membership algorithm. The red "X" represents one of the marginal members (Psat = 0.02) noted in Section 3.3 and its formal membership will be discussed below (Section 3.4.1). All eight member stars are seen to cluster in proper-motion space (bottom left panel of Figure 3), and we note that five of these members are tightly clustered at the systemic proper motion (see Table 2). The three other members have large uncertainties, as they are the faintest of the members with measured proper motions, but they are still consistent with the systemic proper motion (within 2σ–3σ). Additionally, the bottom right panel of Figure 3 shows the ΣEW–v⊙ plane of all stars observed with Keck/DEIMOS. The suspected members cluster at v⊙ ∼ 90 km s−1 and ΣEW ∼ 1.5 Å, neatly separated from all other measured stars. Photometric and dynamical properties are listed for all likely members and the two confirmed nonmembers in Table 3.
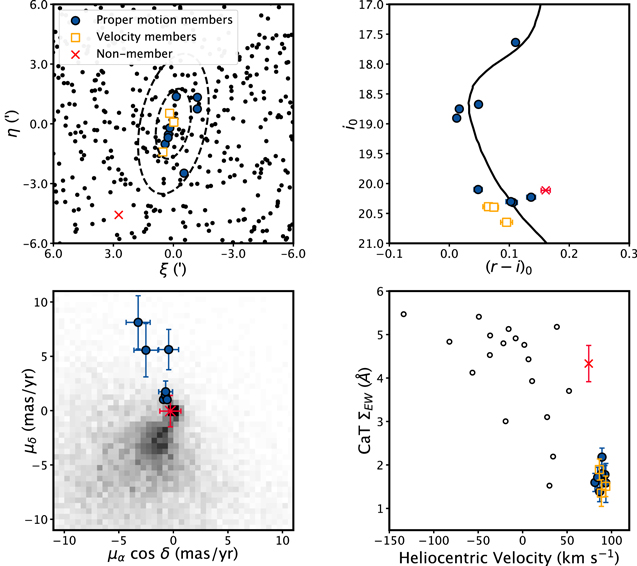
Figure 3. Top left: 12' × 12' region around UMa3/U1. Blue markers are high-likelihood members (Psat ≥ 0.75) as determined with membership analysis code using Gaia proper motions. Orange square markers do not have full astrometric measurements, but are members based on velocity and the CaT EW. The red "X" has marginal membership likelihood from Gaia and is likely not a member based on Keck/DEIMOS measurements. Black sources are all those selected by the matched filter in UNIONS (i.e., the same as the blue sources in Figure 1). Top right: suspected member stars observed with Keck/DEIMOS plotted on a UNIONS r, i extinction-corrected CMD, with a 12 Gyr, [Fe/H] = −2.2 isochrone overlaid, shifted to a distance of 10 kpc. Color uncertainties are shown, though they are only just visible for the sources at i0 ∼ 20.5 mag. Bottom left: proper-motion measurements from Gaia, where the color coding is the same as that on the CMD. The underlying gray density plot is the Milky Way foreground proper-motion distribution, measured empirically from stars within 2° of UMa3/U1. Note that five of the likely members are all tightly clustered around the systemic proper motion at (μα cos δ, μδ ) = (−0.75, 1.15) mas yr−1. Bottom right: heliocentric velocity plotted against CaT ΣEW, where the color coding is the same as that on the CMD, and the small black circles are other nonmember stars observed with Keck/DEIMOS. See Figure 4 for a closer look at the velocity distribution near the mean systemic velocity.
Download figure:
Standard image High-resolution imageTable 3. Candidate Member Stars Targeted by Keck/DEIMOS
| Object | Gaia Source ID | R.A. (J2000) | Decl. (J2000) | r0 | i0 | v⊙ | CaT ΣEW | S/N | Psat | Member? |
|---|---|---|---|---|---|---|---|---|---|---|
| (deg) | (deg) | (mag) | (mag) | (km s−1) | (Å) | (pixel−1) | ||||
| 1 | 4024083571202406912 | 174.69706 | 31.03707 | 17.75 | 17.64 | 89.3 ± 1.3 | 2.2 ± 0.2 | 74 | 0.99 | Y |
| 2 | 4024177442007708672 | 174.71544 | 31.06145 | 18.72 | 18.68 | 81.4 ± 1.5 | 1.6 ± 0.2 | 43 | 1.0 | Y |
| 3 | 4024177648166139904 | 174.71228 | 31.06923 | 18.77 | 18.75 | 89.9 ± 1.5 | 1.8 ± 0.2 | 41 | 1.0 | Y |
| 4 | 4024178472800038016 | 174.68413 | 31.09085 | 18.92 | 18.91 | 92.6 ± 1.6 | 1.8 ± 0.2 | 37 | 0.99 | Y |
| 5 | 4024179297433597056 | 174.70462 | 31.15346 | 19.73 | 19.83 | n/a a | n/a a | 20 | 0.10 | N |
| 6 | 4024177648166141184 | 174.71091 | 31.07493 | 20.15 | 20.10 | 88.9 ± 2.0 | 1.8 ± 0.3 | 19 | 0.99 | Y |
| 7 | 4024178472800038144 | 174.68406 | 31.10051 | 20.36 | 20.23 | 86.7 ± 2.5 | 1.4 ± 0.2 | 16 | 0.99 | Y |
| 8 | 4024036262137953536 | 174.76056 | 31.00214 | 20.27 | 20.11 | 74.4 ± 1.9 | 4.3 ± 0.4 | 16 | 0.02 | N |
| 9 | 4024177442007709440 | 174.71257 | 31.06684 | 20.40 | 20.30 | 93.7 ± 2.5 | 1.6 ± 0.4 | 16 | 0.75 | Y |
| 10 | 4024177751245359744 | 174.70460 | 31.10120 | 20.42 | 20.32 | 84.4 ± 2.6 | 1.7 ± 0.2 | 15 | 0.99 | Y |
| 11 | 4024177682525881344 | 174.71106 | 31.08719 | 20.45 | 20.39 | 93.6 ± 2.5 | 1.5 ± 0.2 | 15 | n/a b | Y |
| 12 | 4024177442007706752 | 174.71763 | 31.05481 | 20.47 | 20.40 | 86.3 ± 2.8 | 1.9 ± 0.2 | 15 | n/a b | Y |
| 13 | 4024177648166141312 | 174.70698 | 31.07972 | 20.74 | 20.65 | 88.6 ± 3.3 | 1.4 ± 0.3 | 13 | n/a b | Y |
Notes.
a On further inspection of the extracted 1D spectra, this source may be a distant quasar, as there are no CaT absorption features and there is a broad-emission-like bump at ∼7200 Å. The best-fit model spectrum is not informative, and therefore the measured velocity is excluded. b These three stars do not have full astrometric measurements in Gaia DR3 and therefore Psat could not be computed, but they are nonetheless suspected to be members based on their velocities and CaT EWs.Download table as: ASCIITypeset image
3.4.1. Marginal Members
Here, we offer evidence to suggest that the two marginal members identified in Section 3.3 (0.01 < Psat < 0.10) are in truth not members of UMa3/U1. First, star #5 in Table 3 has very unusual measurements in both velocity and ΣEW, so we examine its spectrum and find it to lack any CaT absorption features while featuring a broad-emission-like bump around 7200 Å. Paired with a proper motion close to zero, we suspect that this source may be a background quasar and consequently exclude it from our analysis.
Star #8 in Table 3 is featured in both Figures 3 and 4 as a red "X," where measurements show evidence that it is not a member. While this star does lie close to the systemic proper motion of UMa3/U1, it also has a proper motion near zero. In Figure 3, the gray contours show the empirical distribution of all stars measured by Gaia within 2° of UMa3/U1 and there is an overdensity near the origin, giving this star a high likelihood of being part of the proper-motion background. Additionally, this star is more than 7 × rh from the centroid of the stellar overdensity. Figure 4 shows that this star is offset from the mean velocity by 3.8σ, where the dispersion of the distribution is calculated in Section 3.5. The final piece of evidence comes from the ΣEW relative to other likely member stars. Despite not being able to calculate [Fe/H], we can see on the Gaia CMD in Figure 3 that there are seven suspected members, as well as the marginal member being discussed here, in the range 20 ≤ G0 ≤ 21 mag. Therefore, if all these stars are true members, they are all similar types of dwarf stars and thus should have similar values of log(g), Teff, and [Fe/H]. Additionally, the isochrone fitting implies that this is a metal-poor population ([Fe/H] ∼ −2.2). The seven suspected members are all clustered around ∼1.5 Å while star #8 has ΣEW = 4.42 ± 0.44 Å. If this star in question really is a main-sequence dwarf star in UMa3/U1 (and is therefore at the same distance of 10 kpc), it must be far more metal-rich than than the other suspected member stars, which would be extremely anomalous. All told, we feel this accumulation of evidence implies that star #8 is very unlikely to be a member of UMa3/U1, so we exclude it from the member list for the following analysis of the velocity distribution.

Figure 4. Velocity distribution of candidate member stars (dark blue) and a star with marginal membership probability (dashed red, Psat = 0.02). The black dashed line is the velocity probability distribution function with a dispersion of 3.7 km s−1 as derived in Section 3.5.
Download figure:
Standard image High-resolution image3.5. Velocity Distribution
We follow Walker et al. (2006) to measure the mean and intrinsic dispersion in heliocentric velocity. We construct the following log-likelihood function:
where vi
and σi
are the measured velocity and uncertainty for each individual star, 〈v⊙〉 is the mean heliocentric radial velocity of UMa3/U1, and σv
is the intrinsic velocity dispersion, which are the model parameters and quantities of physical interest. The log-likelihood function is maximized with respect to 〈v⊙〉 and σv
using emcee. The final estimates are 〈v⊙〉 = 88.6 ± 1.3 km s−1 and  km s−1, where the uncertainties are the 16th and 84th percentiles of the distributions produced by the MCMC. This result is shown in the leftmost panels of Figure 5.

Figure 5. Left: 2D and marginalized posterior probability distributions for the mean heliocentric radial velocity and its intrinsic dispersion measured from 11 likely member stars. The median values of the heliocentric radial velocity and intrinsic dispersion are shown with uncertainties indicating the 16th and 84th percentiles. Center: same as the left panel, except we have excluded star #2 (in Table 3) and note that the intrinsic velocity dispersion drops to  km s−1. Right: same as the left panel, except we have excluded stars #2 and #4 (in Table 3). In this case, we no longer resolve an intrinsic velocity dispersion. Upon testing the systematic removal of all combinations of stars, the exclusion of stars #2 and #4 is the most impactful on the velocity dispersion. We report 68th and 95th percentile upper limits on the velocity dispersion of 2.3 and 4.4 km s−1, respectively.
Download figure:
Standard image High-resolution imageWe investigate the robustness of this result to understand how the selection of UMa3/U1 member stars might change the measured intrinsic velocity dispersion. We systematically exclude individual stars from the velocity dispersion estimation, one by one, and find that star #2 (denoted in Table 3), the largest velocity outlier, causes the largest change by reducing the velocity dispersion to  km s−1. Continuing in this direction, we keep star #2 out of the member list and systematically exclude individual stars to find the next most impactful source. Removing star #4, a high-S/N measurement at the high-velocity end of the distribution, produces an unresolved velocity dispersion. This systematic analysis of the velocity distribution is relevant because the presence of binary stars in dwarf galaxies can inflate the measured dispersion by several kilometers per second relative to the true intrinsic dispersion (McConnachie & Côté 2010; Minor et al. 2010), and binary fractions in "classical" dwarf spheroidals have been found to vary broadly, ranging from 14% to 78% (Minor 2013; Spencer et al. 2017, 2018; Arroyo-Polonio et al. 2023).
Our spectroscopic measurements indicate that the intrinsic velocity dispersion of UMa3/U1 is resolved, but we note that repeat observations are critical for this to be confirmed. Results from the MCMC calculations for the systematic removal of stars #2 and #4 are shown in the central and rightmost panels of Figure 5 and identify which sources require particularly careful spectroscopic follow-up observations.
3.6. Stellar Mass and Luminosity
We now aim to derive the total stellar mass by creating a sample of mock stellar populations that emulate the characteristics of UMa3/U1. We follow a similar methodology to that of Martin et al. (2016a) in creating the mock populations.
We assume the underlying stellar population of UMa3/U1 is described by a canonical two-part Kroupa initial mass function (IMF; Kroupa 2001) and a stellar population of τ = 12 Gyr, [Fe/H] = −2.2. We create a single mock stellar population by first drawing a distance from a normal distribution with a mean of 10 kpc and a standard deviation of 1 kpc, and shifting the theoretical isochrone to that distance. We then similarly draw a number of stars (N*) from a normal distribution with a mean of 21 and a standard deviation of 5.5 (average of 16th and 84th percentiles reported in Table 2), which will act as the target number of stars above the adopted completeness limit, i = 23.5 mag. Randomly sampling D⊙ and N* propagates previously derived uncertainties through to the final stellar mass estimation. We then sample individual stellar masses from the IMF, converting each to the i band and checking if istar ≥ 23.5 mag. We sample the IMF until N* stars above the completeness limit have been accrued, at which point we sum the stellar masses of all stars (including those below the completeness limit). We repeat this process to create 100,000 mock stellar populations of UMa3/U1 and find the median total stellar mass to be  M⊙, where the uncertainty spans the 16th and 84th percentiles of the total stellar mass distribution. This can be recast in terms of the frequentist p-value; we reject that the total stellar mass is greater than 38 M⊙ at the 99.9% confidence level. The distribution of total stellar masses for all mock stellar populations is shown in Figure 6.
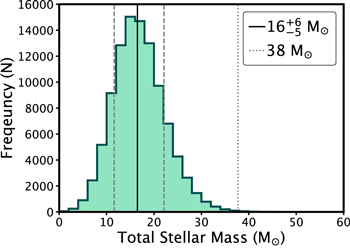
Figure 6. Distribution of total stellar mass calculated by creating mock stellar populations of UMa3/U1. The solid black line indicates the median value (∼16 M⊙), the dashed gray lines on either side of the solid line show the 16th and 84th percentiles, and the dotted gray line indicates the 99.9% confidence level for the upper bound on the stellar mass (∼38 M⊙).
Download figure:
Standard image High-resolution imageAdditionally, we convert this mass to luminosity and absolute V-band magnitude (MV
). We calculate the empirical baryonic M/L to be ∼1.4 for a 12 Gyr, [Fe/H] = −2.2 stellar population, so a stellar mass of  M⊙ implies a total luminosity of 11.4 ± 3.6 L⊙, which is equivalent to a total absolute V-band magnitude of +2.2
 mag. We also compute the effective surface brightness by dividing half the total flux by the area enclosed by one elliptical half-light radius and converting to mag arcsec−2. This comes to 27 ± 1 mag arcsec−2. All properties derived here can be found in Table 2.
Several assumptions are used in this methodology, so we perform several modified analyses to assess the robustness of this result with respect to these choices. Given a 5σ point-source depth of 24.0 mag in i, we choose a magnitude cut of i = 23.5 mag to mitigate issues with stellar completeness when deriving stellar parameters, notably the total number of stars in the system. We do not perform a detailed stellar completeness investigation, but we do repeat the same stellar mass analysis using more restrictive magnitude cuts of 23.2 mag (10σ depth) and 22.4 mag (20σ depth). These produce total stellar mass estimates of  M⊙ and
  M⊙, respectively, which are consistent with the initial estimate within uncertainties. We also repeat the analysis using a Chabrier IMF (Chabrier 2003), which produces a nearly identical result of
  M⊙. Finally, we investigate the impact of varying age and metallicity as these parameters are constrained by eye alone. We run the same analysis for isochrones of ages 11 and 13 Gyr (holding [Fe/H] fixed at −2.2), which gives total stellar masses of 17 and 16 M⊙ and absolute V-band magnitudes of +2.0 and +2.2 mag, respectively. Similarly, we use isochrones of metallicities −2.1 and −2.0 (holding age fixed at 12 Gyr), producing total stellar masses of 17 and 18 M⊙ and absolute V-band magnitudes of +2.2 and +2.1 mag, respectively. For all isochrone changes, we recalculate the empirical baryonic M/L. This analysis appears to be very robust to small variations in age and metallicity.
We note that a common approach to calculating absolute magnitude is to add up the luminosity contribution of every star and obtain an absolute magnitude for each individual mock stellar population (e.g., Martin et al. 2016a; Collins et al. 2022, 2023; Martínez-Delgado et al. 2022; McQuinn et al. 2023a, 2023b). This is in contrast to simply counting up the luminosity contribution of each individually observed star on the CMD, which gives the present-day luminosity of the system. Direct counting can be challenging due to difficulties in effectively accounting for background/foreground contamination in the member star sample. UMa3/U1 has a median of 57 total stars (down to 0.1 M⊙, over the 100,000 mock populations) meaning that small number statistics play a huge role. Based on the isochrones used to model UMa3/U1, the most massive star is 0.8 M⊙ while the MSTO is at ∼0.77 M⊙. Late-stage stars (RGB, HB) have a massive contribution to the total luminosity of such a tiny system, so mock populations that happen to sample a single star in the mass range 0.77–0.8 M⊙ have a dramatically boosted total absolute magnitude, skewing the distribution. For this reason, we consider the total stellar mass to be a more stable tracer of the stellar content of UMa3/U1, thus providing an estimate of absolute magnitude whose variance is less heavily affected by the occasional sampling of a single late-stage star.
In Smith et al. (2023), we developed a similar method to estimate the absolute magnitude of the Boötes V UFD. This methodology was found to produce an excess in the number of bright, late-stage stars (RGB, HB), which resulted in an overestimation of the total absolute magnitude. We rederive the total stellar mass and absolute magnitude of Boötes V following the methodology described in this section by producing 1000 realizations using the stellar population and structural parameters found in Smith et al. (2023). We measure the stellar mass of Boötes V to be  M⊙, which, when converted to absolute V-band magnitude, gives
  mag. This is consistent with the V-band magnitude found by Cerny et al. (2023a) using deeper, targeted follow-up observations from GMOS on Gemini North, measured to be
  mag.
mag.
3.7. Orbital Estimation
With estimates for all six phase space parameters available, we now use a simple dynamical model to investigate the orbit of UMa3/U1 and its interaction history with the Milky Way. We approximate UMa3/U1 as a point mass in a Milky Way potential, implemented with the Python-wrapped package gala (Price-Whelan 2017). The Milky Way potential used for this analysis is comprised of three components: (1) a Miyamoto & Nagai (1975) disk, (2) a Hernquist (1990) bulge, and (3) a spherical Navarro–Frenk–White (NFW) dark matter halo (Navarro et al. 1996). The parameters used for the bulge and disk are taken from the listed citations whereas the NFW dark matter halo parameters ( , R200) are adopted from estimates in Cautun et al. (2020), where a concentration parameter of 12 was chosen. This potential produces a circular velocity at the radius of the Sun similar to a recent estimate (vcirc(R⊙) = 229 km s−1; Eilers et al. 2019). We use a right-handed Galactocentric coordinate system such that the Sun is located at (X, Y, Z) = (8.122, 0.0, 0.0) kpc, with local-standard-of-rest velocities of [U, V, W] = [10.79, 11.06, 7.66] km s−1 (Robin et al. 2022).
To characterize the orbit, we perform a Monte Carlo (MC) randomization, where we generate 1000 samples of the initial orbital conditions (i.e., input parameters {αJ2000, δJ2000, D⊙, μα
cos δ, μδ
, vr
}), which are previously measured in this analysis. Each parameter, aside from the sky positions (αJ2000, δJ2000) as their uncertainties are negligible, is modeled by a Gaussian distribution with the standard deviation given by the errors indicated in Table 2. The orbit of each point mass is integrated 0.5 Gyr both forward and backward in time in steps of 10−3 Gyr. Figure 7 displays the orbits of all 1000 realizations, with the blue tracks tracing backward in time and the red tracks tracing forward in time. The coordinate system is arranged such that Milky Way rotation proceeds clockwise on the XY-plane depicted in the left panel of Figure 7, meaning that the orbit of UMa3/U1 is prograde. The mean orbit is shown in black and the distribution of all 1000 realizations shows that the orbit is quite stable to uncertainties on the input parameters. Several key parameters, namely the pericenter (rperi, the closest approach to the Milky Way), apocenter (rapo, the furthest point from the Milky Way),  (the maximum height above the disk), time between pericenters (orbital time), time since the last pericenter, and orbital eccentricity, are calculated for each orbit, and the median along with the 16th and 84th percentiles for each parameter is presented in Table 2.
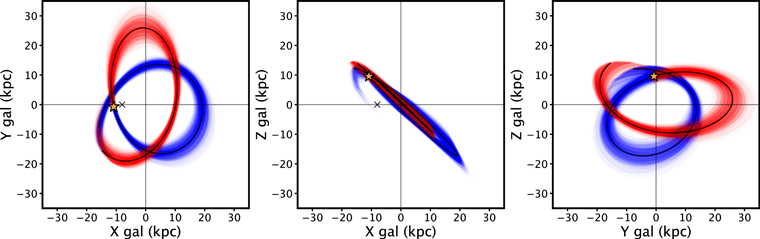
Figure 7. Mean and distribution of orbits resulting from the MC analysis in Section 3.7, plotted in the Galactic XY-, XZ-, and ZY-plane (from left to right), where the rotation of the Milky Way proceeds clockwise in the XY-plane. UMa3/U1 is indicated as a yellow star while the position of the Sun on this coordinate system is shown as a black cross. The orbit is integrated both backward (blue tracks) and forward (red tracks) in time by 0.5 Gyr in steps of 10−3 Gyr from the starting point of each orbit. The mean orbit goes through the yellow star, but each individual orbit has its own starting point, as the position and heliocentric distance are randomized in the MC procedure.
Download figure:
Standard image High-resolution imageThe potential that we use does not include the Large Magellanic Cloud (LMC). We note that Pace et al. (2022) computed the change in orbital parameters of all known UFDs (at the time) given the inclusion and exclusion of the LMC. With rperi and rapo of 12.9 and 26 kpc, respectively, UMa3/U1 has a smaller apocenter than all the UFDs considered by Pace et al. (2022), and a smaller pericenter than all but one UFD in the Pace et al. (2022) list when integrated in a Milky Way–only potential. To find the best sample to compare to UMa3/U1, we select all UFDs in Pace et al. (2022) with rperi < 30 kpc and rapo < 50 kpc. This group comprises Tucana III, SEGUE 1, SEGUE 2, and Willman 1. Of these, Tucana III is on a nearly radial orbit and is thought to be tidally disrupting. SEGUE 1, SEGUE 2, and Willman 1 are all relatively unaffected by the inclusion of the LMC in the gravitational potential in Pace et al. (2022). Given that UMa3/U1 orbits more closely to the Milky Way than any of these UFDs, we conclude that its orbit is unlikely to be strongly affected by the LMC.
4. Discussion
We have presented the discovery of UMa3/U1, an old (τ > 11 Gyr), metal-poor ([Fe/H] ∼ −2.2), tiny (3 ± 1 pc) Milky Way satellite with an orbit that remains within ∼25 kpc of the Galactic center. Most notably, UMa3/U1 is comprised of astonishingly few stars. We have estimated that the total stellar mass is  M⊙, which, when converted to magnitudes using M/L ∼1.4, gives a total absolute V-band magnitude of +2.2
 mag, making UMa3/U1 the least luminous Milky Way satellite, and by some margin. Of the faint, ambiguous Milky Way satellites, the faintest are Kim 3 (MV
= +0.7 mag; Kim et al. 2016) and DELVE 5 (MV
= +0.4 mag; Cerny et al. 2023a). Recasting these magnitudes into total stellar mass (again assuming M/L ∼ 1.4), Kim 3 has Mtot ∼ 63 M⊙ while DELVE 5 has Mtot ∼ 83 M⊙. Virgo I (Homma et al. 2018)—the least luminous presumed dwarf galaxy, which is classified based on its physical half-light radius of 47 pc—has an absolute V-band magnitude of −0.7 mag, representing a total stellar mass of ∼230 M⊙. All told, UMa3/U1 is a quarter of the mass of the previous least luminous Milky Way satellite and about 15× less massive (in terms of stellar mass) than the faintest suspected dwarf galaxy. We now offer some interpretations regarding the nature of UMa3/U1 as well as regarding the origins of this faint satellite system.
mag, making UMa3/U1 the least luminous Milky Way satellite, and by some margin. Of the faint, ambiguous Milky Way satellites, the faintest are Kim 3 (MV
= +0.7 mag; Kim et al. 2016) and DELVE 5 (MV
= +0.4 mag; Cerny et al. 2023a). Recasting these magnitudes into total stellar mass (again assuming M/L ∼ 1.4), Kim 3 has Mtot ∼ 63 M⊙ while DELVE 5 has Mtot ∼ 83 M⊙. Virgo I (Homma et al. 2018)—the least luminous presumed dwarf galaxy, which is classified based on its physical half-light radius of 47 pc—has an absolute V-band magnitude of −0.7 mag, representing a total stellar mass of ∼230 M⊙. All told, UMa3/U1 is a quarter of the mass of the previous least luminous Milky Way satellite and about 15× less massive (in terms of stellar mass) than the faintest suspected dwarf galaxy. We now offer some interpretations regarding the nature of UMa3/U1 as well as regarding the origins of this faint satellite system.
4.1. On the Origin of UMa3/U1
Broadly speaking, there are two possible origins for UMa3/U1: either it formed in situ or it was accreted into the Milky Way. Based on the orbit derived in Section 3.7 UMa3/U1 does not appear to be a on a disklike or bulgelike orbit. Massari et al. (2019) describe bulge globular clusters as having rapo < 3.5 kpc and disk globular clusters as having  . UMa3/U1 does not satisfy the criterion for either category, with an apocenter of 25.2 kpc and
  . The findings of Leaman et al. (2013) show that in situ, disklike globular clusters rarely have a mean metallicity less than −2 and while Di Matteo et al. (2019) argue that a significant portion of the inner Milky Way halo may be comprised of metal-poor ([Fe /H] < −1), heated thick-disk stars, they likely extend only to a metallicity of −2. The metallicity of UMa3/U1 is not strongly constrained, as the PARSEC isochrone database does not extend lower than a metallicity of [Fe/H] = −2.2, but it appears metal-poor nonetheless. UMa3/U1 is on a prograde orbit with a clear, but not too drastic, inclination with respect to the Milky Way plane and therefore could have formed in situ, though it would be fairly anomalous in its orbit, and somewhat anomalous in its metallicity with respect to the known properties of disk globular clusters.
The alternative is that UMa3/U1 could have been accreted onto the Milky Way halo. With an orbital period of  Myr, UMa3/U1 has likely had time to complete many pericentric passages of the Milky Way, which may have led to tidal stripping. There is no stellar stream in the galstreams (Mateu 2023) catalog that matches the position or kinematics of UMa3/U1, but it could be fruitful to search for a faint stream along the orbital path given that this satellite has likely been interacting with the outer disk for many orbits.
UMa3/U1 may have been accreted on its own or as a companion to some larger system, so we compute the orbital properties of all Milky Way satellites with measured velocities and proper motions. At the total orbital energy of UMa3/U1, the orbits of globular clusters M68 and Ruprecht 106 are found to have the most similar X, Y, and Z angular momenta, with M68 being a particularly close match in apocenter and the maximum height above/below the disk when examining other orbital parameters. M68 is previously thought to have been accreted onto the Milky Way from a satellite galaxy (Yoon & Lee 2002), so this orbital similarity could indicate that UMa3/U1 and M68 were accreted as part of the same system. If UMa3/U1 is the tidally stripped remains of a dwarf galaxy then it could have hosted M68 prior to accretion, whereas if UMa3/U1 is a star cluster, perhaps it and M68 formed in the same environment. We present the orbital parameters of all Milky Way satellites in Figure 8, where the Milky Way dwarf galaxies are all dwarfs within 420 kpc (roughly the distance to Leo T) from McConnachie (2012), 14 the classical globular cluster measurements are taken from Harris (1996, 2010 edition), and the most similar systems, globular clusters M68 and Ruprecht 106, are highlighted.
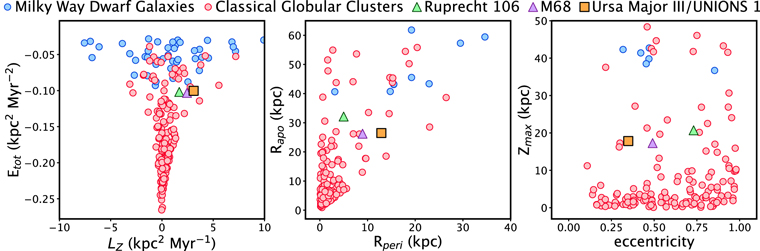
Figure 8. Left: total energy plotted against the Z-component of the angular momentum for Milky Way globular clusters (red circles), dwarf galaxies (blue circles), and UMa3/U1 (yellow square). The systems with similar orbits to UMa3/U1 are M68 (purple triangle) and Ruprecht 106 (green triangle). Center: apocenter distance (in kiloparsecs) plotted against pericenter distance (in kiloparsecs) with the same color coding as in the left panel. Right: maximum height above/below the Milky Way disk (in kiloparsecs) plotted against orbital eccentricity with the same color coding as in the left panel.
Download figure:
Standard image High-resolution imageAlthough the low metallicity of UMa3/U1 does not exclude it from an in situ formation in the heated thick disk, the orbital parameters are inconsistent with the criteria used to define disk and bulge globular cluster populations. We favor a scenario where UMa3/U1 was accreted onto the Milky Way halo.
4.2. On the Nature of UMa3/U1
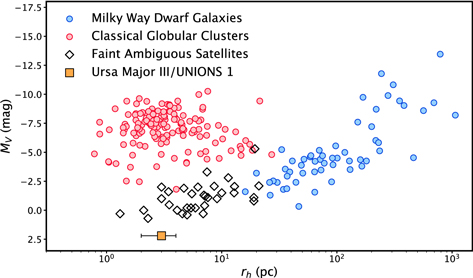
The MV –rh plane helps us visualize the traits typical of dwarf galaxies, globular clusters, and faint satellites whose nature remains ambiguous. We have reconstructed this space in Figure 9, where the classical globular clusters and Milky Way dwarf galaxies are taken from the same references as those for Figure 8, and the faint satellite measurements are compiled from literature. A full list of references can be found in the Appendix. UMa3/U1 is far fainter and smaller than any confirmed Milky Way dwarf galaxies, and lies in a size range occupied by faint, ambiguous satellites and globular clusters.
Figure 9. MV –rh plane with all known Milky Way satellites included. Dwarf galaxies are plotted in blue, classical globular clusters are plotted in red (where "classical" refers to those in the Harris catalog), and faint, ambiguous Milky Way satellites are plotted as open black diamonds. UMa3/U1 is shown as an orange square with rh measurement uncertainties. MV uncertainties are about the same size as the square marker.
Download figure:
Standard image High-resolution image
As suggested by Willman & Strader (2012), taken in the context of the ΛCDM framework, dwarf galaxies reside in their own dark matter halos while globular clusters do not. Dynamical mass estimators (e.g., Wolf et al. 2010; Errani et al. 2018) rely on the intrinsic stellar velocity dispersion within a system, which can then be compared with the total stellar luminosity to yield a dynamical M/L. The faintest dwarf galaxies have been measured to have M/L in excess of 103 M⊙/L⊙ (Simon 2019, and references therein) while globular clusters typically have M/L ∼2 (Baumgardt et al. 2020), consistent with strictly baryonic mass being present.
If UMa3/U1 is a star cluster, and is therefore composed solely of baryonic matter, then we can use the measured properties of total stellar mass and half-light radius to predict the line-of-sight velocity dispersion of its constituent stars using the mass estimator of Wolf et al. (2010):

where σv is given in kilometers per second, rh is given in parsecs, and M1/2 is the mass enclosed within rh. Solving for σv , we estimate σv ∼ 50 m s−1.
However, in Section 3.5, we measured the intrinsic velocity dispersion to be 3.7 km s−1 from 11 member stars. Now, given σv
, we compute the dynamical M/L of UMa3/U1 by dividing Equation (6) by the luminosity enclosed within rh, L1/2, which is found by converting Mtot to Ltot using a baryonic M/L ∼1.4 and taking half the result. We carry out the calculation using a 106-realization MC procedure to propagate measurement uncertainties, where each input quantity is modeled as a Gaussian distribution with a mean and standard deviation given by the values listed in Table 2. For quantities with uneven uncertainties, we adopt the larger of the two bounds. The dynamical M/L is measured to be  M⊙/L⊙, implying the presence of a massive dark matter halo, and that UMa3/U1 is a dwarf galaxy with astonishingly little stellar mass.
In Section 3.5, we already discussed how the presence of binary stars can inflate the measured dispersion, and we identified the member stars whose velocities and uncertainties appear to contribute most significantly to the estimated value of 3.7 km s−1. The removal of star #2 from the membership list led to  km s−1, which translates to a dynamical M/L of
  M⊙/L⊙. The volatility of the velocity dispersion with respect to the inclusion of certain candidate member stars makes it unclear as to whether it accurately represents the underlying gravitational potential of UMa3/U1.
Additionally, the use of the Wolf et al. (2010) mass estimator assumes that the system being assessed is in dynamical equilibrium. The orbit of UMa3/U1 has a pericenter of  kpc and passes through the disk around 16 kpc from the Galactic center, where the stellar mass density is ∼1/50 of that at the solar neighborhood (Lian et al. 2022). It may be the case that repeated interactions with the outer Milky Way disk have led to tidal stripping, which could mean that some of the stars identified as members are in the midst of being stripped and have become unbound. If some of the stars that are actively becoming unbound have been observed as part of our spectroscopic follow-ups, their velocities would not be indicative of the gravitational potential underlying UMa3/U1. This could lead to an inflation of the measured velocity dispersion and a subsequent overestimation of the dynamical M/L. We investigate the Keck/DEIMOS velocity data by searching for a velocity gradient along the major axis of UMa3/U1, but no clear gradient is visible. We also might expect that stars in the outskirts would be unbound if there is active stripping, which could give them higher velocities relative to the mean. We rerun the velocity dispersion MCMC estimation algorithm, where we remove the three member stars that are most distant from the centroid (stars #1, #4, and #7). However, this leads to a slight increase in the intrinsic velocity dispersion, giving
  km s−1, implying that outer stars are not wholly responsible for the well-resolved velocity dispersion. Using these probes of a velocity gradient and outer stars, we do not find clear signs of unbound stars.
While the measured velocity dispersion of  km s−1 may be tracing a massive dark matter halo, we emphasize that the presence of binary stars and unbound stars could impact the interpretation of σv
as a direct indicator of dark matter. Multi-epoch spectroscopic data taken over a sufficiently long time baseline will be particularly crucial for identifying binary stars and assessing the dark matter content of UMa3/U1.
km s−1 may be tracing a massive dark matter halo, we emphasize that the presence of binary stars and unbound stars could impact the interpretation of σv
as a direct indicator of dark matter. Multi-epoch spectroscopic data taken over a sufficiently long time baseline will be particularly crucial for identifying binary stars and assessing the dark matter content of UMa3/U1.
Focused dynamical modeling of the evolution of UMa3/U1 in the Milky Way halo may provide further clues as to whether this faint, tiny system is a dwarf galaxy or a star cluster. "Microgalaxies" and dwarf galaxies embedded in cuspy dark matter halos are predicted to be rather resilient to tidal disruption (Errani & Peñarrubia 2020; Errani et al. 2022) and the very existence of UMa3/U1 may place constraints on various dark matter models (Errani et al. 2023a). We refer the reader to work by Errani et al. (2023b) for a detailed analysis of UMa3/U1 and the implications of its survival in the Milky Way halo.
5. Summary
UMa3/U1 is the least luminous known satellite of the Milky Way. We identified this satellite as a resolved overdensity of stars consistent with an old, metal-poor isochrone in the deep, wide-field survey UNIONS. With radial velocities (from Keck/DEIMOS) and proper motions (from Gaia), we have confirmed that UMa3/U1 is a coherent system.
We have measured an intrinsic velocity dispersion of  km s−1, which could be interpreted as the signature of a massive dark matter halo. However, we have demonstrated that the measured line-of-sight velocity dispersion (on which the presence of dark matter is predicated) is highly sensitive to the inclusion of two stars within the sample of 11 candidate members. It is for this reason that we have referred to this system as UMa3/U1 throughout, with its nature as either a star cluster or a dwarf galaxy remaining ambiguous at this time.
With a half-light radius of 3 pc, UMa3/U1 occupies a scale-length regime that has typically been assumed to contain star clusters, satellites devoid of dark matter. There have only been four moderate-resolution spectroscopic studies of these faint, ambiguous systems prior to this one: SEGUE 3 (Fadely et al. 2011), Muñoz 1 (Muñoz et al. 2012), Draco 2 (Longeard et al. 2018), and Laevens 3 (Longeard et al. 2019). All of these programs found inconclusive evidence for the presence or lack of a surrounding dark matter halo, as even Fadely et al. (2011) were only able to put an upper bound on the M/L, which favored a baryon-only scenario but could not fully rule out the presence of dark matter within 1σ uncertainties. The study presented in this work highlights the need for further medium-to-high-resolution, multi-epoch spectroscopic follow-ups for the whole population of faint, ambiguous satellites. With such sparse stellar populations it remains a technical challenge to observe a sufficient number of stars with sufficient accuracy over a sufficient length of time to confidently measure velocity dispersions in these faint systems. Dedicated observing time to obtain stellar spectra within these satellites may show that some of these previously assumed star clusters are in fact tiny, faint dwarf galaxies hiding in plain sight.
Each newly found satellite of the Milky Way provides an additional target for investigation and implies that contemporary (e.g., DELVE, UNIONS, and the DESI Legacy Imaging Surveys) and future (e.g., LSST and the Euclid space telescope) wide-field, digital photometric surveys will continue to uncover substructure in the halo of the Milky Way. Population-wide studies of these old, faint, metal-poor systems may provide a unique opportunity to understand the processes of star formation, chemical enrichment, and dynamical interactions, as well as the structure of dark matter, extending previously known relationships to parsec length scales and tens of solar masses.
Acknowledgments
We would like to respectfully acknowledge the Lə ʷəŋən Peoples, on whose traditional territory the University of Victoria stands, and the Songhees, Esquimalt, and W̱ŚANEĆ peoples, whose relationships with the land continue to this day.
We would like to thank the anonymous referee, whose comments and feedback helped improve the depth and clarity of the manuscript.
As stated in the individual acknowledgments below, data collection for this work was conducted at several observing sites atop Maunakea. Therefore, the authors wish first to recognize and acknowledge the very significant cultural role and reverence that the summit of Maunakea has always had within the Native Hawaiian community. We are most fortunate to have the opportunity to conduct observations from this mountain.
This work is based on data obtained as part of CFIS, a CFHT large program of the National Research Council of Canada and the French Centre National de la Recherche Scientifique (CNRS). Based on observations obtained with MegaPrime/MegaCam, a joint project of CFHT and CEA Saclay, at CFHT, which is operated by the National Research Council of Canada, the Institut National des Sciences de l'Univers (INSU) of CNRS of France, and the University of Hawaii. This research used the facilities of the Canadian Astronomy Data Centre operated by the National Research Council of Canada with the support of the Canadian Space Agency. This research is based in part on data collected at the Subaru Telescope, which is operated by the National Astronomical Observatory of Japan. Pan-STARRS is a project of the Institute for Astronomy of the University of Hawaii, and is supported by the NASA SSO Near Earth Observation Program under grants 80NSSC18K0971, NNX14AM74G, NNX12AR65G, NNX13AQ47G, NNX08AR22G, and YORPD20_2-0014 and by the State of Hawaii.
Some of the data presented herein were obtained at Keck Observatory, which is a private 501(c)(3) nonprofit organization operated as a scientific partnership among the California Institute of Technology, the University of California, and the National Aeronautics and Space Administration. The Observatory was made possible by the generous financial support of the W. M. Keck Foundation.
This research has made use of the Keck Observatory Archive, which is operated by the W. M. Keck Observatory and the NASA Exoplanet Science Institute (NExScI), under contract with the National Aeronautics and Space Administration.
This work has made use of data from the European Space Agency (ESA) mission Gaia (https://www.cosmos.esa.int/gaia), processed by the Gaia Data Processing and Analysis Consortium (DPAC; https://www.cosmos.esa.int/web/gaia/dpac/consortium). Funding for the DPAC has been provided by national institutions, in particular the institutions participating in the Gaia Multilateral Agreement.
Facilities: CFHT - Canada-France-Hawaii Telescope, PS1 - Panoramic Survey Telescope and Rapid Response System Telescope #1 (Pan-STARRS), Gaia - , Keck:II - KECK II Telescope.
Software: astropy (Astropy Collaboration et al. 2013, 2018, 2022), emcee (Foreman-Mackey et al. 2013), numpy (Harris et al. 2020), scipy (Virtanen et al. 2020).
Appendix: References for Faint Satellites
Here, we list all references that we compiled while investigating the faint Milky Way satellites whose nature remains ambiguous. At present count, this list includes 32 known systems that exist in the halo of the Milky Way meaning that we exclude the large number of recently discovered globular clusters orbiting in the bulge and disk of the Milky Way, although the majority of these systems are brighter than MV ∼ −3 mag anyway. Please now find our list of faint satellite references: Koposov 1 (Koposov et al. 2007), Koposov 2 (Koposov et al. 2007), SEGUE 3 (Fadely et al. 2011), Muñoz 1 (Muñoz et al. 2012), Balbinot 1 (Balbinot et al. 2013), Kim 1 (Kim & Jerjen 2015), Kim 2 (Kim et al. 2015), Crater/Laevens 1 (Laevens et al. 2015b; Weisz et al. 2016), Laevens 3 (Laevens et al. 2015a; Longeard et al. 2019), Draco II (Laevens et al. 2015a; Longeard et al. 2018), Eridanus III (Bechtol et al. 2015; Koposov et al. 2015; Conn et al. 2018), Pictor I (Bechtol et al. 2015; Koposov et al. 2015; Jerjen et al. 2018), SMASH 1 (Martin et al. 2016b), Kim 3 (Kim et al. 2016), DES 1 (Luque et al. 2016; Conn et al. 2018), DES J0111-1341 (Luque et al. 2017), DES J0225 + 0304 (Luque et al. 2017), DES 3 (Luque et al. 2018), DES 4 (Torrealba et al. 2019a), DES 5 (Torrealba et al. 2019a), Gaia 3 (Torrealba et al. 2019a), PS1 1 (Torrealba et al. 2019a), To 1 (Torrealba et al. 2019a), BLISS 1 (Mau et al. 2019), HSC 1 (Homma et al. 2019), DELVE 1 (Mau et al. 2020), DELVE 2 (Cerny et al. 2021), YMCA-1 (Gatto et al. 2021, 2022), DELVE 3 (Cerny et al. 2023a), DELVE 4 (Cerny et al. 2023a), DELVE 5 (Cerny et al. 2023a), and DELVE 6 (Cerny et al. 2023c).
Footnotes
- 13
See Appendix for a full list of references.
- 14