


Abstract
Despite their shared origin, members of globular clusters display star-to-star variations in composition. The observed pattern of element abundances is unique to these stellar environments and cannot be fully explained by any proposed mechanism. It remains unclear whether stars form with chemical heterogeneity or inherit it from interactions with other members. These scenarios may be differentiated by the dependence of chemical spread on stellar mass; however, obtaining a sufficiently large mass baseline requires abundance measurements on the lower main sequence, which is too faint for spectroscopy even in the nearest globular clusters. We developed a stellar modeling method to obtain precise chemical abundances for stars near the end of the main sequence from multiband photometry, and we applied it to the globular cluster 47 Tucanae. The computational efficiency is attained by matching chemical elements to the model components that are most sensitive to their abundance. We determined [O/Fe] for ∼5000 members below the main-sequence knee at the level of accuracy, comparable to the spectroscopic measurements of evolved members in the literature. The inferred distribution disfavors stellar interactions as the origin of chemical spread; however, an accurate theory of accretion is required to draw a more definitive conclusion. We anticipate that future observations of 47 Tucanae with the James Webb Space Telescope will extend the mass baseline of our analysis into the substellar regime. Therefore, we present predicted color–magnitude diagrams and mass–magnitude relations for the brown dwarf members of 47 Tucanae.
Export citation and abstract BibTeX RIS

Original content from this work may be used under the terms of the Creative Commons Attribution 4.0 licence. Any further distribution of this work must maintain attribution to the author(s) and the title of the work, journal citation and DOI.
1. Introduction
Globular clusters are large gravitationally bound conglomerations of stars, commonly observed in the stellar halos of galaxies, including our own (Hubble 1932; Harris & Racine 1979; Harris 1991). Since the brightest examples (e.g., ω Centauri, 47 Tucanae) are prominent naked-eye targets, the study of globular clusters dates back multiple centuries (de Lacaille 1755; Messier 1781). A typical globular cluster hosts over 105 members (Hilker et al. 2020), far outnumbering the populations of most open clusters (∼20–104 members; Sampedro et al. 2017; Qin et al. 2023) that form in the present-day Milky Way. This points to the origin of globular clusters in the early phases of the hierarchical assembly of galaxies (Freeman & Bland-Hawthorn 2002), making them some of the oldest objects in the universe, often exceeding 12 Gyr in age (Carretta et al. 2000; VandenBerg et al. 2013). By consequence, the members of most globular clusters exhibit subsolar metallicities ([Fe/H] ≲ − 1 dex; Baum 1952; Harris 1996; Bailin 2019) and have a distinct color distribution (ten Bruggencate 1927; Greenstein 1939; Hachenberg 1939) that motivated the original definition of stellar populations (Oort 1926; Baade 1944).
Globular clusters are prime stellar astrophysics laboratories (Moehler 2001) and probes of galactic formation and evolution (Strader et al. 2004; Lee 2012; Recio-Blanco 2018; Arkelyan & Pilipenko 2022). The old ages of globular clusters provide a direct constraint on the age of the universe (Krauss & Chaboyer 2003; Valcin et al. 2020, 2021), while their kinematic properties trace the distribution of dark matter (Alabi et al. 2016, 2017; Doppel et al. 2021). Furthermore, tidally disrupted globular clusters are responsible for the production of stellar streams, alongside dwarf galaxies (Newberg 2016). Understanding the properties and evolution of these unique objects is therefore of uttermost importance to stellar astrophysics, galactic science, and cosmology.
Naively, the coeval nature of star clusters leads to the expectation of uniformity in element abundances among their members. Nonetheless, the presence of star-to-star chemical variations within globular clusters was evident since the early spectroscopic observations that found differing cyanogen (CN) absorption strength (Popper 1947) in stars of similar spectral types and luminosity classes (the "cyanogen discrepancy"; Keenan & Keller 1953), followed by the first discoveries of carbon star members (Harding 1962; Wing & Stock 1973). At first, these anomalies were largely attributed to evolutionary effects rather than a genuine primordial inhomogeneity (e.g., Zinn 1973; Norris & Bessell 1975; Dickens & Bell 1976; Sweigart & Mengel 1979; Norris 1981), in part because the comparable features of peculiar field stars were generally consistent with internal processing (Wallerstein & Greenstein 1964; Wallerstein 1969). This consensus was eventually challenged by the observed spread in CNO abundances at early evolutionary stages (Norris & Freeman 1979; Hesser & Bell 1980; Da Costa & Demarque 1982), evidence of variations in [Na/Fe] and [Al/Fe] (Cohen 1978; Peterson 1980; Cottrell & Da Costa 1981; Norris et al. 1981), and the discovery of heavy-element (atomic number greater than 13) variations in the globular cluster ω Centauri (Freeman & Rodgers 1975).
Closely related to chemical heterogeneity is the so-called second parameter problem, characterized by the diversity of horizontal branch morphologies among color–magnitude diagrams (CMDs) of globular clusters with comparable metallicities (Sandage & Wildey 1967; van den Bergh 1967). In some cases, the horizontal branch is distinctly bimodal (e.g., NGC 2808, Harris 1974), which led Rood & Crocker (1985; see also Crocker et al. 1988, as well as earlier speculation by Cottrell & Da Costa 1981; Norris et al. 1981) to suggest the presence of multiple populations (MP) of stars with distinct histories of chemical enrichment. In this scenario, a fraction of members (the primordial population, using the terminology of Bastian & Lardo 2018) form similarly to regular halo stars, while the rest (the enriched population) are influenced by the unique environment of the cluster. The connection between the horizontal branch morphology and chemical anomalies was first investigated by Norris (1981), Norris et al. (1981), and Smith & Norris (1982a, 1982b, 1983) on the basis of the observed bimodality in CN absorption among globular clusters with split horizontal branches. This hypothesis is now firmly established based on detailed spectroscopic abundance measurements of the horizontal branch members (Marino et al. 2011).
Over the past three decades, the existence of MPs in globular clusters has been confirmed by detailed spectroscopic analysis of giant (e.g., Dickens et al. 1991; Sneden et al. 1992; Yong et al. 2008; Marino et al. 2012; Cordero et al. 2014; Thygesen et al. 2014), subgiant, and upper main-sequence stars (e.g., Briley et al. 1996; Gratton et al. 2001; Marino et al. 2016); integrated spectroscopy (Rennó et al. 2020); and splitting of main-sequence (e.g., Anderson 1997; Bedin et al. 2004; Piotto et al. 2007; Milone et al. 2013) and post-main-sequence (e.g., Han et al. 2009; Piotto et al. 2012) CMDs. A more comprehensive summary of available evidence of MPs may be found in numerous reviews of the subject (Smith 1987; Gratton et al. 2004, 2015; Dotter 2013; Bastian & Lardo 2018; Gratton et al. 2019; Milone & Marino 2022, and references within).
The enriched population is characterized by distinct light-element abundances, most prominently the overabundance of nitrogen and sodium, and the depletion of carbon and oxygen, compared to the primordial population. On the other hand, the abundances of heavy elements generally do not display star-to-star variations (globular clusters are said to be monometallic, in the sense that ![$[\mathrm{Fe}/{\rm{H}}]\approx \mathrm{const}$](https://content.cld.iop.org/journals/0004-637X/961/1/139/revision2/apjad08bfieqn1.gif) ), with the exception of a few anomalous globular clusters (Marino 2013), of which ω Centauri is the most well-known (Gratton 1982; Johnson & Pilachowski 2010; Nitschai et al. 2023). By contrast, these characteristic abundance patterns are not observed in open clusters (de Silva et al. 2009; Martell & Smith 2009; MacLean et al. 2015) and are rare (∼3% of the [Fe/H] ≤ − 1 local sample; Martell et al. 2011) among field stars (Kraft 1994; Gratton et al. 2000; Carretta et al. 2010; Martell & Grebel 2010), motivating the common assumption that a handful of known examples were ejected from globular clusters in the past (Ramírez et al. 2012; Lind et al. 2015).
), with the exception of a few anomalous globular clusters (Marino 2013), of which ω Centauri is the most well-known (Gratton 1982; Johnson & Pilachowski 2010; Nitschai et al. 2023). By contrast, these characteristic abundance patterns are not observed in open clusters (de Silva et al. 2009; Martell & Smith 2009; MacLean et al. 2015) and are rare (∼3% of the [Fe/H] ≤ − 1 local sample; Martell et al. 2011) among field stars (Kraft 1994; Gratton et al. 2000; Carretta et al. 2010; Martell & Grebel 2010), motivating the common assumption that a handful of known examples were ejected from globular clusters in the past (Ramírez et al. 2012; Lind et al. 2015).
The physical origin of MPs remains largely unexplained (Bastian & Lardo 2018). The monometallic nature of nonanomalous globular clusters is usually attributed to the high velocity of supernova ejecta that expel a significant amount of pristine gas from the cluster, alongside most of the material enriched with heavy elements, within ∼10–35 Myr of the onset of star formation (D'Ercole et al. 2008, 2016). Many of the proposed MP theories fall under one of two broad categories. In multiple-generation models (e.g., Cottrell & Da Costa 1981; Decressin et al. 2007; Denissenkov & Hartwick 2014), star formation proceeds in two or more bursts with a sufficient time interval to allow the earlier generations of stars to build up a reservoir of enriched gas, from which later generations are assembled. Alternatively, concurrent formation models (e.g., Bastian et al. 2013; Gieles et al. 2018; Winter & Clarke 2023) invoke a single generation of coeval stars, in which a fraction of the members are polluted by stellar ejecta to attain the chemical abundances of the enriched population. Both approaches suffer from major shortcomings. Since nuclear processing primarily occurs in massive stars, and since these stars make a subdominant contribution to the overall mass budget for commonly assumed initial mass functions (e.g., Kroupa 2001), it is unclear how a sufficient amount of processed material can be produced in multiple-generation models to assemble the enriched population of stars (enriched stars make up the majority of members in most globular clusters; Bastian & Lardo 2015). This mass budget problem is easier to resolve in concurrent formation models, where the enriched population is envisioned to form from pristine gas prior to the onset of supernovae; however, considerable fine-tuning is needed to match the required pollution timescales (Salaris & Cassisi 2014) and to reproduce the discreetness of populations that arises naturally when multiple generations are involved.
A potential observational signature of concurrent formation models is the possible dependence of element abundances on the initial stellar mass (Milone 2023; Ziliotto et al. 2023), related to the fact that the magnitude of chemical enrichment is determined not only by the composition of the polluted material produced by the primordial generation but also by the ability of the enriched generation of stars to accrete it. If the polluted material is primarily accreted onto circumstellar disks, the accretion efficiency is expected to be proportional to the surface area of the disk and its longevity, which, in turn, depends on the mass and evolution of the parent star (Carpenter et al. 2006; Ribas et al. 2015). If, instead, the material is accreted onto the surface of the star, the accretion rate is expected to be proportional to the squared stellar mass (e.g., in the Bondi accretion formalism; Bondi 1952). The accreted material may then be diluted by convective mixing within the star, which also depends on the stellar mass (Chabrier & Baraffe 1997). Finally, the density of polluted material may not be uniform throughout the cluster. For example, in the concurrent formation model of Bastian et al. (2013), the polluted material is only available in the core of the cluster. In this case, the accretion efficiency will depend on the kinematic properties of the stars, which are also related to stellar mass (Anderson 2002; Anderson & van der Marel 2010).
Due to the large distances to globular clusters (≳5 kpc; Harris 1996), high signal-to-noise ratio spectra can only be obtained for the brightest members that fall within a narrow mass range. Studying the variation of chemical abundances over a wider mass range inevitably requires the inference of chemistry from multiband photometry. In general, the photometric colors of low-mass stars are highly sensitive to the variations in element abundances due to the dominant molecular chemistry and opacity in low-temperature atmospheres (Marley et al. 2002; Gerasimov et al. 2022b). Furthermore, low-mass stars are particularly valuable as chemical tracers, since molecular absorption is less affected by the nonequilibrium radiation field (Johnson 1994), while the interiors of low-mass stars are fully mixed and undergo minimal nuclear processing (Chabrier & Baraffe 1997; Gerasimov et al. 2022a). Sophisticated stellar models are required to take full advantage of this potential. Accurate simulation of the intricate physics and chemistry in low-temperature atmospheres remains extremely challenging.
Considerable progress in the photometric analysis of cool stars near the end of the main sequence (≳0.1 M⊙) in globular clusters has been made since the advent of space-based observations with the Hubble Space Telescope (HST) and the James Webb Space Telescope (JWST). Recent results include measurement of the [O/Fe] spread in the globular clusters NGC 6752 (Dotter et al. 2015), M92 (Ziliotto et al. 2023), and 47 Tucanae (Milone 2023); photometric characterization of individual populations in NGC 6752 (Milone et al. 2019; Gerasimov et al. 2022b); and measurement of α-enhancement in ω Centauri (Gerasimov et al. 2022a).
The CMDs of globular clusters are expected to extend far beyond the end of the main sequence into the brown dwarf regime. Unlike stars, brown dwarfs do not establish energy equilibrium and, instead, undergo long-term cooling, thereby creating a stellar/substellar gap in the CMD between the faintest main-sequence star and the brightest brown dwarf (Burgasser 2004; Caiazzo et al. 2017, 2019). Photometric observations of the substellar sequence in globular clusters would then not only extend the mass baseline of MP studies but also provide an independent constraint on the cluster age from the width of the gap. The faint magnitudes of globular cluster brown dwarfs pose a major challenge to their detection. The results of dedicated searches for brown dwarf candidates in the globular cluster M4 (Dieball et al. 2016, 2019) with HST remain inconclusive. In our previous work (Gerasimov et al. 2022a), we estimated the colors and magnitudes of the brown dwarfs in the globular cluster ω Centauri and concluded that the substellar sequences of nearby globular clusters fall within the sensitivity limit of JWST. Since then, Nardiello et al. (2023) have reported the first tentative discovery of a brown dwarf in the globular cluster 47 Tucanae, designated BD10. While the substellar nature of this object remains to be confirmed, we anticipate that many similar discoveries will follow in the near future from the ongoing Cycle 1 JWST campaigns (Bedin et al. 2021; Caiazzo et al. 2021) and subsequent cycles.
In this work, we describe a new method to determine the chemical abundances and other fundamental parameters of globular clusters based on their CMDs from the subgiant branch to the substellar regime. Our approach involves the computation of new evolutionary models and model atmospheres with fully self-consistent chemical abundances. Model isochrones are calculated and fitted to the observed distribution of photometric colors in an iterative manner. The computational efficiency of the process is attained by identifying the components of the stellar models that are most sensitive to particular elements and recalculating them only when the abundances of those elements are updated. We apply our method to the brightest monometallic (nonanomalous) globular cluster 47 Tucanae.
This paper is organized as follows. In Section 2 we describe our compilation of spectroscopic 47 Tucanae abundances in the literature. The archival HST photometry that was used in this study is briefly described in Section 3. Section 4 details the process of calculating a theoretical isochrone for a given set of chemical abundances and includes a thorough analysis of associated systematic errors. Our method of isochrone fitting to the observed CMD is presented and applied to 47 Tucanae in Section 5. In Section 6, we derive the mass function of the cluster and predict the anticipated properties of its substellar members. Our results are discussed and the conclusions are drawn in Section 7.
2. Nominal Chemistry
In this study, we adopt spectroscopically inferred chemical abundances of 47 Tucanae as a baseline for comparison against their photometric counterparts, as well as an initial guess in CMD fitting (Section 5). We refer to this set of abundances as the nominal composition of the cluster. The nominal abundances are compiled from three sources: Thygesen et al. (2014), Cordero et al. (2014), and Marino et al. (2016). The set is similar to that used in Zhou et al. (2022). Here we provide a more complete description of its derivation.
Thygesen et al. (2014) list metallicity ([Fe/H]) and the abundances of 26 other elements, measured for 13 stars at the tip of the red giant branch (3900 K ≲ Teff ≲ 4300 K,  ) in 47 Tucanae. For [Fe/H], [Ti/Fe], and [Sc/Fe], separate measurements are made for the lines of neutral and ionized species. Both estimates of [Fe/H] are consistent and treated as independent in our analysis. Since titanium and scandium have much lower ionization potentials than iron (Lide 2004), the neutral lines of these elements may be affected by unaccounted ultraviolet overionization, particularly prominent at low effective temperatures and metallicities (Zhang et al. 2008; Mashonkina 2010; Bergemann 2011). As such, we discard the neutral line measurements of [Ti/Fe] and [Sc/Fe] in Thygesen et al. (2014). We further discard all measurements without uncertainties.
Cordero et al. (2014) obtained 181 composition measurements for 164 unique red giant and asymptotic giant members of 47 Tucanae ( ). The data set includes [Fe/H] and nine other elements. Of 164 observed stars, 5 have also been analyzed in Thygesen et al. (2014). Abundance measurements reported in both references are generally consistent within the published error bars, with the exception of [Al/Fe], for which the value in Cordero et al. (2014) exceeds that of Thygesen et al. (2014) by ∼2σ and ∼2.5σ for the stars 2618 and 3622, respectively (catalog numbers from Lee 1977). The difference may be partially caused by the more detailed modeling of Al lines in Thygesen et al. (2014), following Andrievsky et al.(2008).
The measurements in Marino et al. (2016) extend our sample to the fainter red giant and subgiant members with  . The data set lists metallicities and abundances of seven individual elements for 74 stars. For sodium, we adopt the values with non–local thermodynamic equilibrium corrections based on the curves of growth from Lind et al. (2011). Following the authors' recommendation, we use uncertainties of 0.1, 0.1, and 0.15 dex in [Mg/Fe], [Al/Fe], and [Si/Fe], respectively, instead of the quoted measurement errors, due to the effect of CN molecular features on the analyzed lines of these elements around 0.8 μm.
The final sample includes measurements from multiple sources for [Fe/H], [Al/Fe], [Ca/Fe], [Eu/Fe], [La/Fe], [Mg/Fe], [Na/Fe], [Ni/Fe], [O/Fe], [Si/Fe], and [Ti/Fe]. We carried out a Kolmogorov–Smirnov statistical test for each of these elements to determine whether the measurements from different sources in the literature are consistent with a shared parent population. The null hypothesis (measurements are consistent) was rejected with 99% confidence for [Al/Fe], [Eu/Fe], [Mg/Fe], [Na/Fe], [Ni/Fe], and [Si/Fe]. Since the spectroscopic measurements used in this study span a vast range of post-main-sequence evolutionary stages, the discrepancy may reflect a genuine alteration of surface abundances by the first dredge-up (Salaris et al. 2020), meridional circulation (Sweigart & Mengel 1979), thermohaline mixing (Angelou et al. 2011), or other mechanisms. However, the effect is normally most pronounced in the products of the CNO cycle (Messenger & Lattanzio 2002), all of which have passed the consistency test in our compilation. Therefore, the observed discrepancies between different literature sources are likely systematic in nature, exemplified by the aforementioned mismatch in aluminum measurements between Thygesen et al. (2014) and Cordero et al. (2014).
All spectroscopic composition measurements from the three literature sources were combined into a single set of chemical abundances, available in Table 3 of the Appendix. We assumed that each abundance measurement ( for the ith measurement of element X out of N(X) measurements in total) is drawn from a normal distribution with the standard deviation composed of two components added in quadrature: the physical variation in chemistry among cluster members (s(X), identical for all measurements of X), and the measurement error (
 ). The physical variation of each element may then be estimated as
Since we are ultimately interested in the standard deviation of the physical spread, we evaluated the unbiased sample variances assuming N(X)−1.5 degrees of freedom (Brugger 1969). In cases where the average measurement error exceeds the observed scatter in the data, s(X) cannot be estimated, and the data may be considered consistent with a lack of star-to-star variations in X. The mean abundance of each element and its uncertainty were calculated using the square reciprocal measurement errors as statistical weights with s(X) added to the measurement error in quadrature if available. Finally, we note that the estimates of s(X) for the six elements that did not pass the Kolmogorov–Smirnov test are likely biased by systematic errors that may have been unaccounted for in the quoted measurement uncertainties.
Since the helium abundance cannot be measured spectroscopically at low effective temperatures, the nominal helium mass fraction of 47 Tucanae was adopted as Y = 0.25, following the isochrone fit of eclipsing binary members in Thompson et al. (2020).
3. Archival Photometry
Throughout this paper, all mentions of the optical bands F606W and F814W will implicitly refer to the wide-field channel of the Advanced Camera for Surveys (ACS) on HST. Likewise, all mentions of the near-infrared bands F110W and F160W will refer to the near-infrared channel of the Wide Field Camera 3 (WFC3) on HST. Finally, the infrared bands F150W2 and F322W2 will refer to the Near Infrared Camera (NIRCam) on JWST.
Our analysis is based on archival HST photometry (GO-11677; PI: H. Richer) of 47 Tucanae presented in Kalirai et al. (2012). The primary field was imaged in the F606W and F814W bands. The field spans  and is located at
  (2.1 half-light radii; Harris 1996) from the center of the cluster. Parallel fields were imaged in the F110W and F160W bands, as well as additional bands of the ultraviolet and visible light channel that are not used in this study. The parallel fields span a 250° arc, centered at the primary field with a radius of
  and facing away from the center of the cluster (see Figure 2 of Kalirai et al. 2012). This work is based on the observations of the primary field and one of the parallel fields with the largest cumulative exposure time (field 13, referred to as the "stare").
The archival photometry is contaminated by the members of the Small Magellanic Cloud (SMC), centered ∼2° southeast of 47 Tucanae. Since the SMC is more distant than 47 Tucanae by over an order of magnitude, the main sequences of the two objects are well separated in the optical CMD and have a small overlap in the near-infrared CMD (see Figure 6). The overlap region is excluded from our analysis as detailed in Section 6. A more thorough reduction of the archival data with proper-motion cleaning is deferred to a future study.
All magnitudes quoted in this paper are VEGAMAG.
4. Model Isochrones
We derive the properties of 47 Tucanae by comparing theoretical model isochrones to the observed CMD of the cluster. Due to the presence of MPs, an accurate model of the CMD requires multiple theoretical isochrones that capture the observed spread in photometric colors. We therefore aim to find three isochrones with distinct chemical compositions that approximately trace out the blue tail, the red tail, and the ridgeline of the CMD. We adopt the convention of identifying the blue and red tails of the distribution based on the F110W − F160W near-infrared color of the lower main sequence (the optical colors are, in fact, inverted compared to their near-infrared counterparts).
We search for the desired isochrones through iterative perturbations of the nominal chemical composition. Both the final isochrones and the intermediate isochrones at each iteration are calculated using an improved version of the method, originally developed for our previous study of the globular cluster ω Centauri (Gerasimov et al. 2022a). In this section, we describe the general process of calculating a theoretical isochrone for a given chemical composition. Our approach to isochrone fitting and the treatment of MPs in the cluster are presented in Section 5.
4.1. Evolutionary Models
Stellar evolution is simulated using the Modules for Experiments in Stellar Astrophysics (MESA) code (Paxton et al. 2011, 2013, 2015, 2018, 2019), version 15140. The evolution begins at the pre-main-sequence (PMS) phase and is allowed to proceed either until the age of 13.5 Gyr or until the tip of the subgiant branch, whichever occurs sooner. For our purposes, we define the tip of the subgiant branch as the point at which the innermost shell that satisfies εnuc > 103 erg g−1 s−1 begins to fall outside the central 10% of the stellar mass (εnuc is the specific nuclear energy release rate). This criterion was empirically determined to be a reliable indicator of the hydrogen shell ignition that characterizes the onset of the red giant branch (Gamow & Keller 1945). Evolving the model further into the red giant branch incurs a larger computational cost, due to the rapid variation of surface parameters with age, and is beyond the scope of this study; however, see Salaris et al. (2020).
The initial stellar masses are sampled on an adaptive grid that guarantees the difference in luminosities and effective temperatures between adjacent grid masses of  and
and  , respectively, at the checkpoint ages between 10 and 13.5 Gyr in steps of 0.5 Gyr (the typical average differences at 13.5 Gyr are
  and
and  ). The lowest mass in the grid (∼0.04–0.05 M⊙) is chosen to attain an evolved Teff of ≲700 K at 13.5 Gyr, while the highest mass (∼0.9 M⊙) is set by requiring that the star take at least 10 Gyr to reach the tip of the subgiant branch.
PMS stars at zero age are initialized with uniform chemical abundances and a central temperature of Tc = 5e5 K. This choice follows Choi et al. (2016) and Gerasimov et al. (2022a) and ensures that the stars of all considered initial masses are found within the boundary condition tables (Section 4.2) at the completion of the main PMS relaxation routine in MESA. The additional PMS relaxation for >0.3 M⊙ stars until the formation of the radiative core (pre_ms_relax_to_start_radiative_core) was disabled in all of our evolutionary models to provide a consistent definition of zero age for all calculated evolutionary tracks. This feature was introduced in recent versions of the code to improve the robustness of massive star calculations, 8 and it does not significantly affect the final evolutionary states of the objects considered in this study.
The interior convective mixing length (in the formalism of mixing-length theory (MLT); Böhm-Vitense 1958) in all models was set to the solar-calibrated value of αMLT = 1.82 scale heights (Salaris & Cassisi 2015; Choi et al. 2016). The effect of other choices for this parameter is discussed in Section 5. The input and output files for the evolutionary models produced in this study are made available on our website 9 and Zenodo doi:10.5281/zenodo.10016008.
4.2. Boundary Conditions
At each evolutionary step, energy conservation requires the pressure–temperature profile to be consistent with the luminosity output of the star. Evaluating this condition near the surface of low-mass stars is challenging owing to the complex relationship between the pressure–temperature profile and the outgoing energy flux, caused by low-temperature phenomena such as nongray molecular opacity, cloud formation, and convective instabilities. This issue is particularly prominent at Teff ≲ 4500 K, as the structure of the stellar atmosphere begins to significantly deviate from the Eddington approximation (Mihalas 1978; Burrows et al. 1989; Dorman et al. 1989; Zhou et al. 2022). More accurate atmospheric pressure–temperature profiles may be extracted from model atmospheres, precomputed for the entire range of surface parameters that may be encountered by the star during its evolution.
Following Chabrier & Baraffe (1997), Choi et al. (2016), Phillips et al. (2020), and our earlier study (Gerasimov et al. 2022a), we calculated a grid of model atmospheres (Section 4.3) for each theoretical isochrone, spanning  for 2500 K ≤ Teff ≤ 7500 K and
  for 500 K ≤ Teff ≤ 2400 K, with steps of 100 K in Teff and 0.5 in
  . Models with
  were not required, since such low gravities are only encountered during the early evolution (<5 Myr) and the subgiant phase, both of which are characterized by higher effective temperatures (Teff > 2500 K). For some of the calculated isochrones, a small number of model atmospheres could not be computed owing to convergence issues (Section 4.4). The corresponding empty grid points were then filled in using linear Delaunay triangulation (Barber et al. 2013). The temperatures and gravities of the atmosphere models calculated for the final ridgeline isochrone are plotted in Figure 1 alongside the Teff–
 tracks of selected evolutionary models.

Figure 1. Effective temperatures and surface gravities (Kiel diagram) of the model atmospheres, calculated in this study for the final ridgeline isochrone of 47 Tucanae. The PHOENIX models are color-coded by their convergence patterns, as detailed in Section 4.4. The evolutionary tracks of selected MESA models in the Teff– space are shown for comparison, as well as the final isochrone at 11.5 Gyr. The tracks are labeled by their initial stellar masses in M⊙.
Download figure:
Standard image High-resolution imageThe model atmospheres were converted to tables of gas pressure and temperature at a prescribed depth and provided to MESA as the outer boundary conditions at each evolutionary step and for each iteration in the solution of the stellar structure equations. In general, specifying the boundary conditions at larger Rosseland optical depths (τ) is preferred, as it minimizes the discontinuity in opacity between the atmosphere and interior and ensures adiabatic behavior at the boundary (Chabrier & Baraffe 1997, 2000; Spada et al. 2017). However, the reduced atmospheric opacity in more massive stars shifts the boundary to larger physical depths, where the nonideal gas behavior may be significant (Burke et al. 2004), and is not accounted for in our high-Teff model atmospheres. We therefore employed two distinct atmosphere–interior coupling regimes with boundary conditions at τ = 100 for M < 0.5 M⊙, and at T(τ) = Teff (photosphere) for M > 0.6 M⊙, where T(τ) is the temperature profile of the star and M is the initial stellar mass. At intermediate stellar masses, 0.5 M⊙ ≤ M ≤ 0.6 M⊙, a linear ramp between the two regimes was applied. The range of transition was chosen to approximately coincide with the maximum value of dT(τ = 100)/dM for main-sequence stars. The implications of this choice for the synthetic photometry are discussed in Section 4.6.
When the range of pretabulated boundary conditions is exceeded, MESA implements a fail-safe and falls back on the Eddington approximation. Near the edges of the table, a smooth blending between the on-table and off-table boundary conditions is carried out, which may result in numerical instabilities at low Teff due to the extreme inaccuracy of the Eddington formula. Since our models, by design, do not leave the table range during regular evolution, we modified the source code of MESA to disable the off-table blending once the PMS phase has been completed. We also updated the code to interpolate the tables linearly rather than bicubically to address unphysical temperatures and pressures resulting from spline overshoots (Fried & Zietz 1973) in the vicinity of poorly converged model atmospheres (Section 4.4). The calculated boundary condition tables and the patch file for the MESA codebase are made available on our website 10 and Zenodo. 11
4.3. Model Atmospheres
Model atmospheres were calculated using the PHOENIX code (Hauschildt et al. 1997), version 15.05.05D (Allard et al. 2011, 2012; Gerasimov et al. 2020), at Teff ≤ 5000 K and the ATLAS code (Kurucz 1970), version 9 (Kurucz 2005, 2014), at Teff > 5000 K. The use of ATLAS for "warm" atmospheres is advantageous owing to its superior computational efficiency (see Section 4.5), attained by virtue of opacity sampling from pretabulated opacity distribution functions (ODFs; Kurucz et al. 1974; Carbon 1984), simplified chemical equilibrium (only gaseous species are considered; molecule–molecule interactions are ignored), and the ideal equation of state. The ODFs for the chemical composition of each isochrone were computed for 9 nm ≲ λ ≲ 160 μm at 57 temperatures between ≈2e3 K and ≈2e5 K using the satellite package DFSYNHTE (Castelli & Kurucz 2003; Castelli 2005). ATLAS atmospheres are stratified into 72 plane-parallel layers, spanning ∼10−7 < τ < 10100 with logarithmic spacing. The synthetic spectra for each model atmosphere were calculated using the SYNTHE code (Kurucz & Avrett 1981) within 0.1 μm < λ < 5 μm, at the constant resolution 12 of λ/Δλ ∼ 6 × 10⁵. All three codes are packaged in the open-source Python dispatcher BasicATLAS 13 (Larkin et al. 2023), alongside a suite of internal consistency checks and a synthetic photometry calculator.
PHOENIX allows for a more accurate treatment of low-Teff atmospheres through direct sampling of opacity at the wavelengths of interest, a more complete chemical reaction network (including condensation; see Allard et al. 2001, for a review), a comprehensive molecular line database (most importantly, H2O lines from Barber et al. 2006 and CH4 lines from Brown 2005 and Wenger & Champion 1998; Homeier et al. 2003; other included lines are listed in Table 3 of Gerasimov et al. 2022a), and a nonideal equation of state (Saumon et al. 1995), among other features. The inclusion of condensate species (clouds) in the chemical equilibrium and the opacity model is necessary to reproduce the observed reddening of photometric colors at Teff ≲ 3000 K compared to gas-only models (Lunine et al. 1986; Allard et al. 2001). Our setup of PHOENIX also includes the Allard & Homeier treatment of gravitational settling for condensate species (Helling et al. 2008; Allard et al. 2012) that gradually removes clouds from the spectrum-forming region of the atmosphere at Teff ≪ 2000 K (Tsuji & Nakajima 2003). For computational efficiency, we only consider gravitational settling at Teff < 2500 K and, otherwise, assume that the condensate species remain at chemical equilibrium.
Our PHOENIX models are stratified into 250 layers when gravitational settling is used and 128 layers otherwise. Unlike ATLAS, the atmospheric layers in PHOENIX are spherical and defined by the optical depth at a fixed wavelength (τλ
, where λ = 1.275 μm) instead of the Rosseland mean.
14
The bottom of the atmosphere is set to τλ
= 103 for the models without gravitational settling but reduced to τλ
= 316 when settling is enabled to avoid the numerical issues associated with settling calculations at large depths. The top of the atmosphere is defined by the gas pressure, rather than optical depth, set to 10−3 dyn cm−2. The optical depth grid is approximately logarithmic. For all models considered in this study, the atmospheres at the final evolutionary state are negligibly thin compared to the stellar radius (the τ = 100 layer is always found within the outer 0.1% of the photospheric radius, calculated at T(τ) = Teff). Therefore, the effect of spherical geometry is expected to be subdominant, allowing the use of approximate atmospheric radii from the literature (Baraffe et al. 2015) instead of introducing additional dimensions to our model atmosphere grids. The wavelength sampling and spectral synthesis for all PHOENIX models are carried out within 1 Å < λ < 1 mm with a median resolution of λ/Δλ ∼ 18,250 between 0.5 and 3 μm. A few examples of the synthetic spectra for the chemical abundances of the ridgeline isochrone and  are provided in Figure 2. The atmosphere models calculated in this study are made available online.
15
are provided in Figure 2. The atmosphere models calculated in this study are made available online.
15
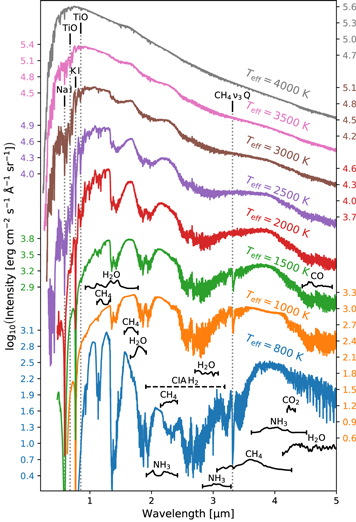
Figure 2. Synthetic spectra of selected model atmospheres at  , calculated in this study for the ridgeline isochrone of 47 Tucanae. The important absorption bands of CH4, CO, CO2, H2O, and NH3 are labeled with ragged black lines that represent the variation of absorption strength within the band for the Teff = 800 K model. The central wavelengths of prominent TiO bands, Na and K atomic lines, and the peak of the CH4
ν3 (asymmetric stretching vibration band) Q-branch are shown with vertical dotted lines. The approximate wavelength range of strong collision-induced H2 absorption (CIA) is shown with the horizontal dashed line. The spectra have been convolved with a 10 Å Gaussian kernel for clarity.
, calculated in this study for the ridgeline isochrone of 47 Tucanae. The important absorption bands of CH4, CO, CO2, H2O, and NH3 are labeled with ragged black lines that represent the variation of absorption strength within the band for the Teff = 800 K model. The central wavelengths of prominent TiO bands, Na and K atomic lines, and the peak of the CH4
ν3 (asymmetric stretching vibration band) Q-branch are shown with vertical dotted lines. The approximate wavelength range of strong collision-induced H2 absorption (CIA) is shown with the horizontal dashed line. The spectra have been convolved with a 10 Å Gaussian kernel for clarity.
Download figure:
Standard image High-resolution imageWe assume that the chemical composition of the atmosphere is unaffected by stellar evolution and is identical to the initial composition of the PMS star, with the exception of [Li/Fe], which is reduced by 3 dex in all PHOENIX models compared to the PMS abundance. This assumption is justified by the fact that low-mass stars (≲0.6 M⊙) undergo minimal nuclear processing (with the exception of lithium burning), while their higher-mass counterparts establish radiative zones at young ages, thereby preventing the nuclear burning products from reaching the atmosphere. The behavior of [Li/Fe] in the interior and the atmosphere of the star as a function of mass is explored in detail in Gerasimov et al. (2022a).
4.4. Model Convergence
In both model atmospheres and the time steps of evolutionary models, the equations of input physics are solved using iterative methods. At the high effective temperatures of ATLAS atmospheres, the parameter space maintains approximate local linearity (Gustafsson et al. 2008), allowing for fast and reliable convergence onto a self-consistent solution. We carry out ATLAS iterations in batches of 15 until the maximum flux error and the maximum flux derivative error across all layers drop below 1% and 10%, respectively (following Sbordone & Bonifacio 2005; Mészáros et al. 2012; see the Appendix in Larkin et al. 2023, for details), or until no further progress can be made. These convergence standards have been met by nearly all ATLAS atmospheres computed in this study, with the exception of a few Teff > 6500 K models that generally fall outside the region of parameter space, explored by the calculated evolutionary tracks (Figure 1).
The evolution of convergence parameters across iterations in low-Teff PHOENIX atmospheres is more involved. In models with subdominant cloud settling (Teff ≳ 2000 K), the flux errors generally decrease with every iteration until the model arrives at a stable solution with the typical maximum and average flux errors across all radiative layers of ∼3% and 0.5%, respectively. In this work, we refer to this convergence pattern as stable, and the models that exhibit this pattern are shown in green in Figure 1 for the ridgeline isochrone. A small number of models with stable convergence may occasionally encounter iterations with ill-conditioned temperature corrections that break the trend in convergence and increase the flux errors by over an order of magnitude, effectively restarting the computation. In those cases, the iteration with the minimum average error, from which we derive the final synthetic spectrum, is still expected to produce a reliable result; however, the gain in accuracy from an increased number of iterations may be limited.
At lower Teff, the effects of condensate settling become more prominent, resulting in a far more complex relationship between the model parameters that restricts the effectiveness of the temperature correction scheme. In this regime, the flux errors typically oscillate between high and low values across iterations. While the flux errors of the best iteration are usually comparable to those of the atmospheres with stable convergence, the final solutions to the structure equations may lack uniqueness (i.e., for some Teff and  there may be multiple atmosphere structures with similar flux errors but vastly different emergent spectra). Furthermore, the pronounced sensitivity of the model to temperature corrections casts doubt on the usefulness of the radiative flux errors as a diagnostic of self-consistency. We refer to the convergence pattern in this temperature regime as irregular. Some of the PHOENIX atmospheres with irregular convergence had to be excluded from the grid owing to the rapid growth of the oscillation amplitude in the temperature structure between iterations. For the rest of the models with this convergence pattern, the solution with the lowest average radiative flux error was added to the grid at the points identified in Figure 1 with black markers for the ridgeline isochrone.
A small number of models displayed a convergence pattern, intermediate between that of stable convergence and irregular convergence, which we refer to as limited convergence. In those cases, the model may exhibit stable convergence for the first few iterations but then transition into the irregular convergence pattern before a solution with satisfactory flux errors can be reached. In some cases, the transition between the two convergence patterns may occur multiple times over the course of ∼100 iterations. The models with limited convergence are shown in Figure 1 with red markers for the ridgeline isochrone. At very low temperatures (Teff ≲ 1200 K) and high gravities ( ), the condensate species are almost completely removed from the spectrum-forming region of the atmosphere, restoring the stable convergence pattern (see Figure 1).
For most PHOENIX models computed in this study, we used the nearest atmosphere structure from the NEXTGEN model grid (Hauschildt et al. 1999; Allard et al. 2014) as the initial guess in the solver, with the exception of models with particularly poor convergence that were recalculated, using the nearest well-converged atmospheres from our grid as the initial models instead. In principle, the accuracy of our low-temperature atmospheres may be improved by calculating the models in small batches with progressively decreasing Teff and  and using the atmospheres from the preceding batch as initial guesses. In fact, we adopted this approach for the ATLAS models. However, the high computational demand of PHOENIX (Section 4.5) makes the unparallelized computation extremely time-consuming. Furthermore, it is unclear how the potential gain in numerical precision would compare to the systematic errors in the input physics and grid interpolation errors. We therefore chose to focus on identifying the outlier models based on their synthetic photometry and excluding them from the isochrone calculation instead, as described in Section 4.7.
Nearly all evolutionary MESA models in our grids have converged at every time step within the "gold tolerances" (Paxton et al. 2019), with the exception of a few lowest-mass models (≲0.05 M⊙), where the tolerances were relaxed to their standard values to allow evolution over the discontinuities in  , caused by the sparse gravity sampling in the boundary condition tables.
4.5. Computational Demand of Model Atmospheres
All model atmospheres used in this work were calculated on the Bridges2 supercomputer (Brown et al. 2021), operated by the Pittsburgh Supercomputing Center. Our PHOENIX models were calculated to ∼100 iterations, requiring between ∼0.15 processor hours per iteration at the highest temperatures to ∼1.5 processor hours at the lowest. The high memory demand of PHOENIX (≳4 GB per model) necessitated requesting at least two (and occasionally three) service units for each processor hour.
The computational demand of ATLAS models is dominated by the spectral synthesis, carried out by the SYNTHE package. The calculation of the emergent spectra for most ATLAS models required between 1.5 and 3.5 processor hours per spectrum (and the same number of service units). For comparison, the structure calculations only took ≈0.005 processor hours per model for all iterations.
The computational demand of a complete atmosphere grid for each chemical composition is approximately 5 × 10⁴ service units, with nearly 98% taken by PHOENIX calculations. This estimate does not include recalculation of failed models, ODF calculations, calculations of partial pressure tables for each chemical composition used in PHOENIX, and evolutionary calculations with MESA. This estimate only applies to the final isochrones (ridgeline, blue tail, and red tail) presented in Section 5; to calculate the intermediate isochrones used during the fitting process, we took advantage of various optimizations described in Section 5.
4.6. Isochrone Stitching
The process of calculating theoretical isochrones described earlier in this section required a choice of three "stitching points," where distinct modeling setups were blended together: the effective temperature where ATLAS models are replaced with PHOENIX models (5000 K), the effective temperature where the gravitational settling in PHOENIX models was disabled (2500 K), and the initial stellar mass, where the τ = 100 boundary condition tables were replaced with T(τ) = Teff (smooth ramp between 0.5 and 0.6 M⊙). Here we briefly review the implications of those choices for synthetic photometry.
Our choice of the ATLAS/PHOENIX transition temperature (5000 K) is higher than that used in our previous work (4000 K; Gerasimov et al. 2022a). For comparison, the published grid of ATLAS models with the updated molecular opacities (Castelli & Kurucz 2003) reaches 3500 K, although the low-temperature extension has known issues (Plez 2011). We calculated an additional test set of ATLAS models for the parameters of the ridgeline isochrone at 4000 K ≤ Teff ≤ 5000 K, as well as an additional grid of evolutionary models with the updated boundary conditions. We found the synthetic photometry at 11.5 Gyr of the regular ridgeline isochrone and its altered version to be indistinguishable at Teff = 5000 K but rapidly diverging at lower temperatures to attain the difference of ≈0.025 mag in F606W − F814W and F150W2 − F322W2 at Teff = 4000 K. The difference originates almost entirely from the synthetic spectra, with only a minor contribution from the boundary conditions.
Our choice of the minimum Teff without gravitational settling (2500 K) is, on the other hand, lower than that employed in our previous study of ω Centauri (3000 K; Gerasimov et al. 2022a), which allowed us to significantly reduce the computational demand. We calculated a test grid of PHOENIX atmospheres for the ridgeline isochrone with 2500 K ≤ Teff ≤ 3000 K and enabled settling of condensates, as well as a test set of corresponding evolutionary models. We found that at Teff = 2500 K and at the age of 11.5 Gyr the effect of gravitational settling on the same colors as before is ≈0.01 mag. In the optical regime, both the boundary conditions and the synthetic spectra make comparable contributions to the observed difference, while the latter dominate in the infrared. At Teff > 2500 K, the effect of gravitational settling decreases rapidly in the infrared but remains approximately constant in the optical up to the warm end of the test grid at 3000 K, primarily due to the effect of the updated boundary conditions on stellar evolution.
Lastly, we examine the effect of the transition between the atmosphere–interior coupling schemes by disabling the linear ramp at 0.5 M⊙ ≤ M ≤ 0.6 M⊙. The effect on synthetic photometry at 11.5 Gyr is most prominent in F606W − F814W when the range of T(τ) = Teff boundary condition tables is extended down to 0.5 M⊙, resulting in the discontinuity of ≲0.01 mag between the two regimes. The discontinuity is less prominent when the τ = 100 tables are extended to 0.6 M⊙ or when other photometric colors are considered.
In summary, our choice of "stitching points" in the isochrone is not expected to introduce errors larger than 0.01 mag in any of the photometric colors considered in this study; however, it appears that the optimal choice of the transition between the two atmosphere–interior coupling schemes falls at somewhat larger masses, and a small gain in accuracy may be attained by allowing gravitational settling of condensates at Teff > 2500 K.
4.7. Synthetic Photometry and Hammering
The preliminary synthetic photometry for the calculated isochrones was obtained by applying the reddening law to the synthetic spectra, evaluating the bolometric corrections for each model atmosphere in the bandpasses of interest, and interpolating the result to Teff and  , predicted by the evolutionary model at the required initial mass and age. The resulting magnitudes were corrected by the distance modulus of 13.2418 ± 0.0625 mag (Chen et al. 2018). To calculate the bolometric corrections, we used the synphot() routine of the BasicATLAS package (Larkin et al. 2023). The process uses the reddening law from Fitzpatrick & Massa (2007), parameterized only by the optical reddening, E(B − V), and assuming the total-to-selective extinction ratio of RV
= 3.1.
, predicted by the evolutionary model at the required initial mass and age. The resulting magnitudes were corrected by the distance modulus of 13.2418 ± 0.0625 mag (Chen et al. 2018). To calculate the bolometric corrections, we used the synphot() routine of the BasicATLAS package (Larkin et al. 2023). The process uses the reddening law from Fitzpatrick & Massa (2007), parameterized only by the optical reddening, E(B − V), and assuming the total-to-selective extinction ratio of RV
= 3.1.
The strong dependency of low-Teff spectra on surface parameters and the highly nonlinear behavior of cool atmospheres pose a challenge to the interpolation of bolometric corrections. Linear interpolation of a sparsely sampled grid leads to large unphysical discontinuities in the derivatives and is known to introduce noticeable errors even at relatively high temperatures (Gustafsson et al. 2008; Mészáros & Allende Prieto 2013). On the other hand, higher-order interpolation methods are less robust against outliers (Fried & Zietz 1973), such as those introduced by the models with poor convergence. Specialized interpolation methods for atmosphere grids with nonconvergent models (e.g., Nendwich et al. 2004) generally require a means to reliably identify the outliers, which is not straightforward in the case of irregular convergence, as discussed in Section 4.4.
To address these issues, we decided to avoid interpolating the grid at low temperatures altogether and instead to calculate additional PHOENIX atmospheres at 600 K ≤ Teff < 2400 K in 50 K steps, with  set to the values predicted by the isochrone for each effective temperature at the target age. We refer to this process as atmosphere hammering. In addition to removing the need to interpolate bolometric corrections at low temperatures, hammering serves two other purposes. First, it reduces the effective number of dimensions in the atmosphere grid from 2 to 1 (since the hammering models obey a known Teff–
 relationship), allowing the outlier models to be easily identified, e.g., by their placement in the color–magnitude space. Second, it allows us to derive the synthetic photometry at Teff < 2500 K from higher-gravity model atmospheres that have better convergence (e.g., from Figure 1, to calculate the bolometric corrections at the Teff = 2000 K point on the 11.5 Gyr isochrone, one would require both
  and
and  model atmospheres for the interpolation method, but only one
  model for the hammering method). The major drawbacks of the hammering method are the added computational cost and the resulting commitment to a particular target age, since the hammering models fix the Teff–
 relationship.
The linear interpolation and hammering methods of calculating synthetic photometry at Teff ≤ 2350 K are compared in Figure 3. The figure demonstrates that at Teff ≲ 1000 K (the brown dwarf regime) linear interpolation may be off by as much as 2 mag in the optical regime and ≳0.5 mag in the near-infrared. It is also apparent that the two methods converge at Teff ≳ 2000 K, suggesting that linear interpolation of bolometric corrections is valid across the main sequence. In this study, we use linear interpolation for all models with Teff > 2350 K.

Figure 3. Comparison of synthetic photometry at 11.5 Gyr and Teff ≤ 2350 K for the blue tail isochrone, calculated using the two methods described in Section 4.7: atmosphere hammering (black) and linear interpolation of the bolometric corrections (red). The outlier models were identified by visual inspection in each isochrone and excluded from the "masked" result.
Download figure:
Standard image High-resolution imageWe note that while the synthetic photometry inferred from atmosphere hammering does not rely on interpolated bolometric corrections, it is still based on the surface parameters predicted by the evolutionary track, which, in turn, was calculated using interpolated boundary conditions. The effect of boundary conditions on synthetic photometry is subdominant compared to that of bolometric corrections; however, some interpolation errors may remain at low Teff. To avoid interpolation of model atmospheres entirely, one must calculate new atmospheres for every iteration of the evolutionary code at every time step, which would increase the total computational demand by over an order of magnitude.
5. Isochrone Fitting
5.1. Main-sequence Turnoff and Subgiant Branch
The high effective temperatures of the main-sequence turnoff and the subgiant branch in 47 Tucanae (Teff ≳ 5000 K) suppress molecular formation in the atmosphere and minimize the impact of chemical abundances on the observed photometry. The notable exceptions are the overall metallicity, [Fe/H], and the helium mass fraction, Y, as they have a significant effect on the mean molecular weight and opacity of the interior that, in turn, guide the evolutionary track of the star (Salaris & Cassisi 2005, chap. 5.5). These high-mass stars are also sensitive to the adopted energy transport parameters (in particular, the mixing length, αMLT) owing to the emergence of an outer convective zone (Joyce & Chaboyer 2018). To reduce the degree of degeneracy in the determination of chemical abundances, it is advantageous to constrain as many parameters as possible from the main-sequence turnoff and the subgiant branch before analyzing the lower main sequence. We used this part of the CMD to assess our choice of αMLT = 1.82; to fix the cluster age and the optical reddening, E(B − V); and to evaluate the accuracy of the helium mass fraction and metallicity in the nominal chemical composition (Section 2, Y = 0.25, [Fe/H] = − 0.75).
The top panels of Figure 4 show the turnoff point and the subgiant branch of the ridgeline isochrone, evaluated at four distinct ages and overplotted on the CMD of the archival photometry (Section 3) in the optical (left) and near-infrared (right). The isochrones were calculated using the nominal metallicity and helium mass fraction, as well as E(B − V) = 0.04 mag, in agreement with Percival et al. (2002). In the figure, the 11.5 Gyr isochrone is the only one that matches both the color of the turnoff point and the luminosity of the subgiant branch within one standard deviation. Furthermore, the presented fit firmly fixes the reddening at 0.04 mag, as lower values would result in the isochrone being "too blue" at the turnoff point, while higher values would make the isochrone "too faint" at the tip of the subgiant branch. This age estimate broadly agrees with the literature (e.g., VandenBerg 2000; see also Rennó et al. 2020, for a compilation of recent age measurements).
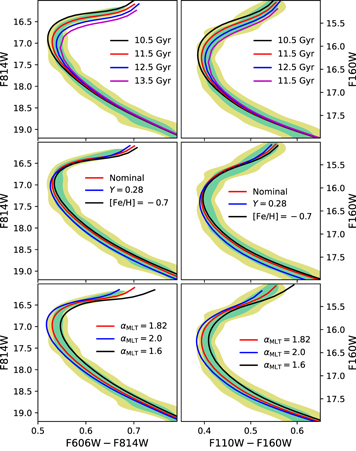
Figure 4. Top: ridgeline isochrones of 47 Tucanae at different ages, overplotted on the distribution of observed colors in optical (left) and near-infrared (right). Middle: comparison of the ridgeline isochrone at 11.5 Gyr with the nominal [Fe/H] and Y (red) to the helium-rich (blue) and metal-rich (black) isochrones at the same age. Bottom: effect of the mixing-length parameter on the ridgeline isochrone at the age of 11.5 Gyr. The cyan and yellow regions of the CMD subtend the 1σ and 2σ contours in the data distribution, respectively. E(B − V) = 0.04 mag for all shown isochrones.
Download figure:
Standard image High-resolution imageTo explore the effect of the helium mass fraction and the overall metallicity, we calculated two additional isochrones with Y = 0.28 and [Fe/H] = − 0.7, with all other parameters matching those of the ridgeline isochrone. The results are plotted in the middle panels of Figure 4. While the enhanced metallicity offers a marginal improvement of the fit at the turnoff point, the corresponding decrease in luminosity of the subgiant branch reduces the overall goodness of fit. On the other hand, the higher helium mass fraction improves the fit at the subgiant branch, at the expense of mismatching the color of the turnoff point by nearly two standard deviations in near-infrared. Based on these results, we chose to use the nominal metallicity and helium mass fraction for all isochrone calculations henceforth.
The bottom panels of the figure demonstrate how our choice of the mixing length compares to two alternative values: αMLT = 1.6 and αMLT = 2.0. The isochrones are shown at 11.5 Gyr. Around the turnoff point, the effect is practically indistinguishable from that of the cluster age, emphasizing the limitations of using the color of the turnoff point as an age diagnostic for globular clusters. Our earlier claim that the 11.5 Gyr isochrone is the only one that fits the observed scatter within one standard deviation is invalid if the mixing length is allowed to vary as a free parameter. We found that a comparable goodness of fit is obtained at 12.5 Gyr for αMLT = 2.0, or 10.5 Gyr for αMLT = 1.6. Figure 4 appears to indicate that the effect of the mixing length is most significant at the tip of the subgiant branch. If the trend continues into the red giant branch, it is possible that a better estimate of the cluster age may be obtained from higher-mass stars. Since the degeneracy cannot be broken within the mass range considered in this study, we chose to adopt the solar-calibrated αMLT = 1.82 for all isochrones and the corresponding best-fit age of 11.5 Gyr.
5.2. Lower Main Sequence
Below the main-sequence inflection point (∼0.5 M⊙; Calamida et al. 2015), the abundances of individual chemical elements may noticeably impact the shape of the CMD. In this study, we consider the variations in 11 element abundances: [C/Fe], [N/Fe], [O/Fe], [Na/Fe], [Mg/Fe], [Al/Fe], [Si/Fe], [S/Fe], [Ca/Fe], [Ti/Fe], and [V/Fe].
The effect of atomic abundances is twofold. First, variations in abundances displace the chemical equilibrium of the atmosphere and change the corresponding opacity distribution, resulting in altered photometric colors. Second, the new atmospheric structure affects the boundary conditions of the atmosphere–interior coupling (Section 4.2), thereby offsetting the endpoint of the evolutionary track to different Teff and  . The importance of the latter effect approximately correlates with
 ![$\delta \kappa =\left|d\kappa /d[{\rm{X}}/\mathrm{Fe}]\right|$](https://content.cld.iop.org/journals/0004-637X/961/1/139/revision2/apjad08bfieqn34.gif) at T(τ) = Teff, where [X/Fe] is the abundance of the element of interest and κ is the Rosseland mean opacity. For the range 0.1 M⊙ < M < 0.5 M⊙, this diagnostic is by far the largest for [O/Fe] and [Ti/Fe] (∼ 10−7 cm−1 dex−1 at 0.2 M⊙) owing to the prominent TiO and H2O absorption bands (see Figure 2). For comparison, the next two most important elements, [C/Fe] and [Al/Fe], have δκ ∼ 2 × 10⁻⁸ cm−1dex−1 and ∼10−8 cm−1 dex−1, respectively, at the same initial stellar mass.
at T(τ) = Teff, where [X/Fe] is the abundance of the element of interest and κ is the Rosseland mean opacity. For the range 0.1 M⊙ < M < 0.5 M⊙, this diagnostic is by far the largest for [O/Fe] and [Ti/Fe] (∼ 10−7 cm−1 dex−1 at 0.2 M⊙) owing to the prominent TiO and H2O absorption bands (see Figure 2). For comparison, the next two most important elements, [C/Fe] and [Al/Fe], have δκ ∼ 2 × 10⁻⁸ cm−1dex−1 and ∼10−8 cm−1 dex−1, respectively, at the same initial stellar mass.
The relative importance of the two effects depends on the chosen photometric bands. For instance, the optical main-sequence spectra for fixed Teff and  are only weakly sensitive to the oxygen abundance, since H2O bands are mostly confined to infrared wavelengths, while the rate of TiO production in the atmosphere is primarily determined by [Ti/Fe]. As such, the atmosphere–interior coupling alone is responsible for over 50% of the correlation between the optical colors (F606W − F814W) and [O/Fe] for main-sequence stars. This example emphasizes that accounting for the enhancements of individual elements in the atmosphere–interior coupling scheme is essential for the accurate photometric determination of the chemical composition. Since 47 Tucanae is known to have a significant spread in [O/Fe] based on spectroscopic measurements, the corresponding distribution of photometric colors cannot be captured with atmosphere–interior boundary conditions based on solar or even solar-scaled abundances. Furthermore, since both [Ti/Fe] and [O/Fe] have comparable δ
κ, and since both are considered to be α-elements, even solar-scaled boundary conditions with adjustable α-enhancement would not be adequate.
are only weakly sensitive to the oxygen abundance, since H2O bands are mostly confined to infrared wavelengths, while the rate of TiO production in the atmosphere is primarily determined by [Ti/Fe]. As such, the atmosphere–interior coupling alone is responsible for over 50% of the correlation between the optical colors (F606W − F814W) and [O/Fe] for main-sequence stars. This example emphasizes that accounting for the enhancements of individual elements in the atmosphere–interior coupling scheme is essential for the accurate photometric determination of the chemical composition. Since 47 Tucanae is known to have a significant spread in [O/Fe] based on spectroscopic measurements, the corresponding distribution of photometric colors cannot be captured with atmosphere–interior boundary conditions based on solar or even solar-scaled abundances. Furthermore, since both [Ti/Fe] and [O/Fe] have comparable δ
κ, and since both are considered to be α-elements, even solar-scaled boundary conditions with adjustable α-enhancement would not be adequate.
5.3. Abundance Variation Grids
We determine the final red tail, blue tail, and ridgeline isochrones for 47 Tucanae by iteratively correcting the nominal element abundances, derived in Section 2. Each iteration begins by calculating the theoretical isochrone with fully self-consistent chemistry as detailed in Section 4. However, since the available data sets only extend to the end of the main sequence (Section 3), we terminate all intermediate isochrones at Teff = 3000 K to avoid unnecessary calculations of model atmospheres.
To determine the corrections in the element abundances for the next iteration, we first compute an abundance variation grid of model atmospheres for the current isochrone. The grid spans five initial stellar masses between 0.13 and 0.7 M⊙ that sample the main sequence of the cluster with approximately even intervals in the CMD. At this stage, we assume that the effect of chemistry on the atmosphere–interior coupling is negligible and compute new model atmospheres (Section 4.3) for the Teff and  of the chosen masses, based on the parameter relationships of the current isochrone. For each stellar mass, we calculate 22 new model atmospheres with each of the 11 elements considered in this study perturbed by +0.5 and −0.5 dex, one element at a time. A photometric sensitivity plot (Figure 5) is then produced that shows the effect of each element on the relevant photometric colors. Since the abundance variation grids are based on the assumption of constant atmosphere–interior coupling, we also calculate δ
κ for each element to estimate our confidence in the derived correlation between colors and abundances.
of the chosen masses, based on the parameter relationships of the current isochrone. For each stellar mass, we calculate 22 new model atmospheres with each of the 11 elements considered in this study perturbed by +0.5 and −0.5 dex, one element at a time. A photometric sensitivity plot (Figure 5) is then produced that shows the effect of each element on the relevant photometric colors. Since the abundance variation grids are based on the assumption of constant atmosphere–interior coupling, we also calculate δ
κ for each element to estimate our confidence in the derived correlation between colors and abundances.

Figure 5. Photometric sensitivity plot for the initial iteration with nominal chemistry at M > 0.1 M⊙ and for the final ridgeline isochrone at M < 0.1 M⊙. The plot shows the effect of changes in the abundances of individual elements on the photometric colors as a function of stellar mass (or, equivalently, Teff) assuming that the atmosphere–interior coupling remains constant, i.e., for fixed Teff and  . Note that the horizontal axis is categorical, i.e., the labels are evenly spaced regardless of their values. The data shown in this figure are available as a machine-readable table in the digital version of this publication.(The data used to create this figure are available.)
Download figure:
Standard image High-resolution imageThe abundance corrections are then determined manually based on the current discrepancies between the isochrones and the data, the photometric sensitivity plot and estimated adjustments to the photometric sensitivity based on the δ κ values, and our experience with earlier iterations. At each iteration, we follow the reductionist approach of adopting the smallest possible number of corrections in the chemical composition to reproduce the data. In principle, the derivation of abundance corrections may be automated by introducing a quantitative goodness-of-fit criterion, similar to the one derived in our previous work for fitting a single isochrone to the CMD (Gerasimov et al. 2022a). However, since there is no straightforward way to extend that criterion to simultaneous fitting of multiple isochrones, and since the automated routine must be "trained" to take advantage of the abundance variation grids based on experience, we chose to use human input at every iteration instead.
A satisfactory fit was obtained after 10 iterations. The final isochrones were extended to Teff ≳ 700 K to reach the substellar regime, as required for our further analysis. For the final ridgeline isochrone, an additional abundance variation grid was computed for seven initial masses below the end of the main sequence at 0.05 M⊙ ≤ M ≤ 0.08 M⊙. The derived photometric sensitivity is shown in Figure 5. We determined that corrections in [Ti/Fe] and [O/Fe] are sufficient to reproduce the photometric spread in both optical and infrared colors, while variations in other abundances compared to their spectroscopic means do not offer a noticeable improvement to the fit. While the value of [Ti/Fe] needed to be offset from its nominal value to fit the data, we found that the observations are most consistent with a constant value of [Ti/Fe] across all three final isochrones.
The final isochrones are plotted in Figure 6, and their best-fit properties are summarized in Table 1. In near-infrared bands, the photometric spread noticeably overflows the red tail isochrone around the main-sequence knee (F160W ∼19 mag). A similar red excess in the optical CMD is also seen at the corresponding evolutionary phase (F814W ∼20.5 mag), despite the inverted [O/Fe]–color relationship. This prominent discrepancy between the data and the model isochrones cannot be accounted for by varying any of the considered elements.
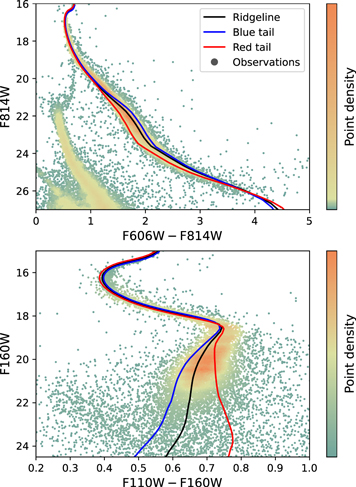
Figure 6. The final best-fit, blue tail, and red tail isochrones, overplotted on the observed photometric spread in the optical (top) and near-infrared (bottom) bands. The parameters of the isochrones are given in Table 1. The isochrones shown in this figure are available as machine-readable tables in the digital version of this publication.(The data used to create this figure are available.)
Download figure:
Standard image High-resolution imageTable 1. Best-fit Parameters of the Final Isochrones
| Parameter | Blue Tail | Ridgeline | Red Tail |
|---|---|---|---|
| E(B − V) (mag) | 0.04 | 0.04 | 0.04 |
| αMLT | 1.82 | 1.82 | 1.82 |
| Age (Gyr) | 11.5 | 11.5 | 11.5 |
| [Fe/H] (dex) | −0.75 | −0.75 | −0.75 |
| Y | 0.25 | 0.25 | 0.25 |
| [Ti/Fe] (dex) | 0.64 | 0.64 | 0.64 |
| [O/Fe] (dex) | 0.48 | 0.33 | 0.03 |
Note. The abundances of individual elements unlisted in the table are set to their nominal values, derived in Section 2 and summarized in the Appendix.
Download table as: ASCIITypeset image
6. Analysis
6.1. Oxygen Abundance
Figure 6 demonstrates that the near-infrared photometry of the lower main sequence is particularly sensitive to the oxygen abundance of 47 Tucanae. Here we calculate the lower main-sequence distribution of [O/Fe] in the cluster. Each of the three isochrones shown in the figure defines the relationship between the initial mass of the star and its position in the CMD space for a given oxygen abundance ([O/Fe] = 0.48 dex for the blue tail isochrone, [O/Fe] = 0.33 dex for ridgeline, and [O/Fe] = 0.03 dex for red tail; see Table 1). Equivalent relationships for other values of [O/Fe] may be approximated by interpolating or extrapolating the calculated isochrones. It is therefore possible to define a curvilinear transformation from the CMD space in Figure 6 to the M–[O/Fe] space.
To obtain the desired transformation, we first generated a 1000 × 300 regular grid of synthetic stars at 1000 evenly spaced initial masses from the minimum (≈0.045 M⊙) to the maximum (≈0.875 M⊙) value within the range of all three isochrones and 300 evenly spaced values of [O/Fe] from −0.57 to 0.78 dex. The chosen range of oxygen abundances corresponds to tripled differences between the ridgeline oxygen abundance and the other two isochrones. Each synthetic star was projected onto the near-infrared color–magnitude plane by, first, linearly interpolating the CMD of each of the three isochrones to the mass of the synthetic star and, second, linearly interpolating and extrapolating the resulting three points to the oxygen abundance of the synthetic star. The curvilinear transformation of the observed CMD of the cluster was carried out by identifying the closest synthetic star to each real observation in the color–magnitude space and assigning the mass and [O/Fe] values of the closest synthetic star to the real star. This method is unreliable above the main-sequence knee, where all three isochrones merge and the curvilinear transformation becomes nonunique. We carry out this analysis below the knee (0.1 M⊙ ≤ M ≤ 0.5 M⊙), where the isochrones are well separated, and the transformation is accurate to 10−3 M⊙ in mass and 10−2 dex in oxygen abundance, as estimated by applying the transformation to 104 additional synthetic stars with randomly chosen masses and oxygen abundances. We further restrict our analysis to stars that satisfy −0.27 dex < [O/Fe] < 0.63 dex (doubled differences between the calculated isochrones) to avoid excessive extrapolation and to discard the occasional outlying measurements that fell beyond the region of the CMD covered with synthetic stars.
The result of the transformation is shown in the top right panel of Figure 7. The distribution of [O/Fe] in selected mass bins is shown in the top left panel of the figure. We note that the highest mass bin (0.4 M⊙ < M < 0.5 M⊙) is an unreliable indicator of the oxygen distribution owing to the proximity of the main-sequence knee, where the isochrone fit is noticeably poorer. The lower half of the lowest mass bin (0.1 M⊙ < M < 0.15 M⊙) is visibly affected by the contamination of the CMD by SMC members. The oxygen abundances within the remaining mass range (0.15 M⊙ < M < 0.4 M⊙) were combined into a single oxygen abundance distribution in the bottom panel of Figure 7. A histogram of the spectroscopic measurements of higher-mass stars (M ≳ 0.9 M⊙) is plotted in the same panel for reference.

Figure 7. Top left: distribution histograms of [O/Fe] in 47 Tucanae in different initial mass bins. The flattening of the highest-mass distribution is likely an artifact of the poor isochrone fit in the vicinity of the main-sequence knee (see Section 5.3). The lowest-mass distribution is contaminated by SMC members. The horizontal dashed lines indicate the range of masses where the analysis of the oxygen distribution was carried out. Top right: the near-infrared CMD of 47 Tucanae, transformed into the initial mass–oxygen abundance space using the calculated isochrones. The transformed red tail, ridgeline, and blue tail isochrones are indicated with the red, black, and blue vertical lines, respectively. Bottom: combined [O/Fe] distribution at 0.15 M⊙ < M < 0.4 M⊙, overplotted on the distribution of spectroscopic measurements in the literature (Section 2). The measurements of mass and oxygen abundance shown in this figure are available as a machine-readable table in the digital version of this publication.(The data used to create this figure are available.)
Download figure:
Standard image High-resolution imageTo compare the spectroscopic and photometric abundances quantitatively, we began with a null hypothesis that (1) the photometric distribution is free of systematic errors and represents the true chemistry in the lower main sequence and (2) photometric and spectroscopic abundances are identical, i.e., there is no dependence of [O/Fe] on stellar mass. The spectroscopic distribution of oxygen, as described in Section 2, consists of 117 individual measurements with published uncertainties. We generated 105 synthetic equivalents of the spectroscopic data set by drawing 117 random measurements from the photometric distribution for each trial and applying simulated Gaussian noise according to the published spectroscopic uncertainties. For each synthetic set, we estimated the mean, standard deviation, and 5th, 25th, 75th, and 95th percentiles. The averages and spreads in those statistics across all 105 Monte Carlo trials are summarized in Table 2, alongside the equivalent values calculated for the real spectroscopic data set. We note that the 25th and 75th percentiles fall within the range of [O/Fe] covered by the model isochrones and are, therefore, immune to extrapolation errors. All other statistics listed in the table are sensitive to the systematic offsets introduced by extrapolation.
Table 2. Comparison of Synthetic and Real Distributions of Spectroscopically Inferred [O/Fe]
| Statistic | Synthetic | Real | |
|---|---|---|---|
| Mean | 0.232 | ±0.024 | 0.174 |
| Standard deviation | 0.253 | ±0.015 | 0.214 |
| 5th percentile | −0.198 | ±0.047 | −0.170 |
| 25th percentile | 0.058 | ±0.036 | 0.030 |
| 75th percentile | 0.414 | ±0.029 | 0.320 |
| 95th percentile | 0.616 | ±0.038 | 0.476 |
Note. All values are quoted in dex. The indicated uncertainty of the synthetic values was calculated as the standard deviation across 105 Monte Carlo trials.
Download table as: ASCIITypeset image
The null hypothesis was rejected, since some of the statistical parameters of the real spectroscopic distribution fall outside the corresponding synthetic ranges by over ∼3 standard deviations, most notably including the extrapolation-immune 75th percentile. If the systematic errors in the photometrically inferred abundances are the dominant contributor to the estimated discrepancy, their magnitude appears to vary from ≈0.03 dex at the oxygen-poor tail of the distribution (inferred from the 5th percentile) to ≈0.15 dex at the oxygen-rich tail (inferred from the 95th percentile). We note that the latter value is comparable to the average spectroscopic uncertainty of 0.147 dex across the 117 measurements.
Alternatively, a genuine variation in chemistry with stellar mass may be responsible for the discrepancy between spectroscopic and photometric values. Under the standard assumption that the enriched population of 47 Tucanae is oxygen-deficient (Dickens et al. 1991), the values of the higher percentiles are expected to be primarily determined by the oxygen content of the primordial population, while the values of the lower percentiles would be mostly set by [O/Fe] of the enriched population. As discussed in Section 1, the chemistry of the enriched population may depend on stellar mass in concurrent formation models. We, however, disfavor this explanation, since the spectroscopic/photometric discrepancy in Table 2 appears largest at the oxygen-rich (primordial) tail of the [O/Fe] distribution, rather than the anticipated oxygen-poor (enriched) tail.
Both photometric and spectroscopic distributions in the bottom panel of Figure 7 exhibit a clear negative skewness (i.e., the oxygen-poor tail is longer than the oxygen-rich one). To assess the statistical significance of this feature, we calculated the Fisher–Pearson coefficient of skewness for both distributions, obtaining −0.21 ± 0.03 and −0.43 ± 0.19 for the photometric and spectroscopic cases, respectively. Hence, spectroscopic and photometric skewness estimates are consistent with each other and indicate that the distribution of [O/Fe] in 47 Tucanae is indeed negatively skewed. While both skewness estimates have high confidence, the photometric value is vastly more statistically significant than its spectroscopic counterpart (8.4 vs. ∼2.2 standard deviations, respectively), due to the number of photometric measurements (4862) exceeding the number of spectroscopic measurements (117) by over an order of magnitude.
6.2. Mass Function
The mass functions of globular clusters retain a footprint of their dynamical evolution (Baumgardt & Sollima 2017; Sollima & Baumgardt 2017) and may vary between populations if they have distinct kinematic properties. Furthermore, an estimate of the mass function is required to predict the luminosity function and the CMD of the substellar sequence. In this subsection, we seek a mass function that can reproduce the observed F160W magnitude distribution of 47 Tucanae, assuming that the isochrones calculated earlier and the oxygen abundance distribution derived above accurately capture the properties of the cluster. The choice of the photometric band is motivated by the fact that the oxygen abundances were inferred from the near-infrared CMD and the fact that lower main-sequence members are brighter in F160W than in F110W (Figure 6). We also assumed that the mass function (ξ) is of the form of a broken power law (Kroupa 2001)

Here β and γ are the power-law indices in the high- and low-mass regimes, respectively, separated by the break-point stellar mass Mbp. We keep all three parameters as free variables. The magnitude function, ϕ(m), where m is the apparent magnitude of the star (in our case, F160W), is related to the mass function as

In Equation (3), we treat the stellar mass, M, as a function of magnitude, m, as given by the mass–magnitude relationship provided by the isochrone. In practice, the mass–magnitude relationship is sampled at a set of masses, Mi , and magnitudes, mi , corresponding to the initial masses of the calculated evolutionary models. We therefore rewrite Equation (3) in the form of finite differences:

Here the magnitude function is evaluated at the midpoints between the adjacent evolutionary models on the mass grid. We calculated three distinct magnitude functions for each of the three final isochrones (red tail, blue tail, and ridgeline). The magnitude function for an arbitrary [O/Fe] can be obtained by linearly interpolating/extrapolating between the three calculated magnitude functions to the desired oxygen abundance. The combined magnitude function for the entire cluster was computed as the average of individual magnitude functions, evaluated for the oxygen abundance of every star that satisfies 0.15 M⊙ < M < 0.4 M⊙ and −0.27 dex < [O/Fe] < 0.63 dex (the same restrictions as in the bottom panel of Figure 7). Finally, the magnitude function was binned into 20 uniform bins in the range 17 < m < 24 using trapezoid integration. The four faintest bins with bin centers at F160W > 22.5 were excluded from our analysis owing to contamination by SMC members and potential incompleteness of the photometric sample.
To determine the parameters of the mass function, β, γ, and Mbp, we applied the same binning to the observed magnitude function in F160W and fitted the theoretical magnitude function to the result, using least-squares regression, weighted by the Poisson errors in each bin. The observed magnitude function and the theoretical best fit are shown in Figure 8. The best-fit parameters of the mass function are β = 1.75 ± 0.15, γ = 0.08 ± 0.04, and Mbp = 0.47 ± 0.02 M⊙. In addition to the combined magnitude function, three more theoretical magnitude functions were calculated for the same parameters as the best fit, but using only one of the three isochrones instead of a weighted average of all three. As seen in Figure 8, the scatter among the theoretical magnitude functions is consistent with the Poisson counting errors in the corresponding magnitude bins, suggesting that for main-sequence members the distribution of oxygen abundance cannot be inferred from the observed luminosity function of the cluster.

Figure 8. The observed magnitude function of 47 Tucanae in F160W with the best-fit theoretical magnitude function in magenta. Additional magnitude functions that use only one of the theoretical isochrones instead of the abundance-weighted average are shown for comparison. The displayed error bars are Poisson counting errors. The observed counts in the four faintest bins are excluded from this analysis owing to contamination by SMC members.
Download figure:
Standard image High-resolution image6.3. Brown Dwarfs in 47 Tucanae
In this subsection, we predict the colors, magnitudes, and number densities of the brown dwarfs in 47 Tucanae, as they may be observed with JWST NIRCam. The JWST color–magnitude space considered in this study is F322W2 versus F150W2 − F322W2, since brown dwarfs are most likely to be detected in wide bands at long wavelengths owing to their faint magnitudes and red colors. Our predictions are based on the assumption that the mass function (Equation (2) with the best-fit parameters in Figure 8), the calculated isochrones (Figure 6), and the inferred distribution of chemical abundances (Figure 7) remain unchanged in the substellar regime.
We recalculated the synthetic magnitude function of 47 Tucanae in 30 evenly spaced magnitude bins within the range of all three theoretical isochrones, using the best-fit mass function parameters. The calculations were carried out for a variety of ages between 0.1 and 13.5 Gyr, including 11.5 Gyr (best-fit age). The requirement to vary the age of the cluster for this part of the analysis necessitated the use of interpolated bolometric corrections for synthetic photometry instead of atmosphere hammering. The resulting magnitude functions for three of the considered ages are shown in the static preview of Figure 9. At those ages, the magnitude function exhibits a clear stellar/substellar gap at m ∼ 26, where the brown dwarf density per magnitude is reduced by nearly an order of magnitude (compared to the maximum density within the modeled range that is predicted to occur around m = 27.5). While the lower main sequence is virtually unaffected by the cluster age, both the turnoff point and the substellar sequence undergo noticeable evolution. The equivalent magnitude functions for all other ages are available as an animated figure in the digital version of this paper.
Figure 9. Predicted magnitude distribution of stars and brown dwarfs in 47 Tucanae at three different ages. The bright and faint peaks represent the main sequence and the brown dwarfs of the cluster, respectively, with a clear stellar/substellar gap in between. The distribution is normalized to the number of stars in the data set (Section 3). An animated version of this figure is available in the digital version of the publication. The animation lasts 6 s and includes 30 frames. The animation shows the evolution of the magnitude function from 0.1 to 13.5 Gyr. Initially, the magnitude function only has one peak around m ∼ 20 corresponding to the main sequence of the cluster. The stellar/substellar gap forms at m ∼ 23.5 around 0.5 Gyr. Over time, it gradually deepens, widens, and shifts to fainter magnitudes.
(An animation of this figure is available.)
Download figure:
Video Standard image High-resolution imageA synthetic CMD based on the inferred oxygen abundance in Figure 7, the isochrones in Figure 6, and the predicted mass function at 11.5 Gyr is shown in Figure 10. Lines of constant mass (isomass lines) for selected masses and −0.27 dex < [O/Fe] < 0.63 dex are also shown for reference. Since the isochrones of the substellar sequence in 47 Tucanae appear almost exactly parallel to the isomass lines, the effect of evolution on the brown dwarf colors is highly degenerate with [O/Fe]. This presents a potential challenge to the use of brown dwarfs as chemical tracers, since the masses of individual brown dwarfs (and, hence, their evolutionary phases) are not a priori known. The degeneracy also reduces the observed photometric scatter, making the substellar sequence far narrower than the main sequence in the CMD space.
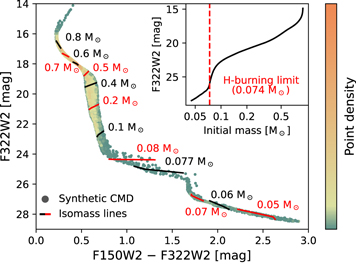
Figure 10. Predicted CMD of 47 Tucanae from the subgiant branch to the substellar sequence. Isomass lines are shown for selected masses. The color scatter in the figure is derived from the inferred distribution of [O/Fe] near the end of the main sequence. The inset in the upper right corner shows the mass–magnitude relationship for the ridgeline isochrone with the HBL highlighted. The isochrones used to construct the CMD in this figure are available as machine-readable tables in the digital version of this publication (see Figure 6).
Download figure:
Standard image High-resolution image
The predicted mass–magnitude relationship for the ridgeline isochrone is shown in an inset in Figure 10 with the hydrogen-burning limit (HBL) highlighted. We define the HBL as the mass at which the energy output from nuclear reactions contributes 50% of the stellar luminosity at 11.5 Gyr. In this case, the HBL was computed as 0.074 M⊙.
7. Discussion and Conclusion
We developed a general method for determining the chemical compositions, ages, and mass functions of globular clusters from the observed CMDs in optical and near-infrared bands. Our method relies on state-of-the-art model atmospheres and evolutionary models that are fully self-consistent and incorporate the full set of nonsolar abundances in every component, including the interior structure and evolution, nuclear processing, atmosphere–interior coupling, atmospheric structures, and spectral synthesis. Our modeling framework was applied to the brightest monometallic globular cluster 47 Tucanae. We reproduce for the first time the observed scatter in the photometric colors of main-sequence stars without any a priori assumptions of its magnitude. We also provide the first measurements of chemical compositions for individual stars of the lower main sequence in a globular cluster (Figure 7). An extension of our models to the substellar regime predicts the expected colors and magnitudes of brown dwarfs in the cluster, reproducing the anticipated stellar/substellar gap. The predicted brown dwarf CMD for the first time incorporates the inferred distribution of chemical abundances. The best-fit parameters of 47 Tucanae determined in this study are listed in Table 1. The key findings are as follows:
- 1.The photometric scatter of 47 Tucanae in both optical and near-infrared bands can be reproduced with unaltered average spectroscopic abundances for all elements (Appendix) with the exception of [O/Fe] and [Ti/Fe]. Constraining the abundances of elements other than oxygen and titanium from the CMDs considered in this study is challenging owing to the subdominant effect of those elements on stellar atmospheres, as illustrated in Figure 5.
- 2.The observed photometric scatter is predominantly driven by [O/Fe]. Our best-fit model CMD is consistent with the absence of star-to-star variations in [Ti/Fe], in agreement with the spectroscopic measurements and the monometallic nature of 47 Tucanae.
- 3.The photometric distribution of the oxygen abundance estimated in this study (Figure 7) at M < 0.4 M⊙ is statistically consistent with the spectroscopic distribution, inferred from evolved stars, under the assumption of systematic errors in the photometric estimates of order 0.15 dex. These errors are comparable to the experimental uncertainties in available spectroscopic measurements, demonstrating that lower main-sequence CMDs of globular clusters may be used in chemical analyses.
- 4.The discrepancy between the spectroscopic and photometric [O/Fe] values appears largest at the oxygen-rich (primordial) tail of the distribution. If a genuine mass dependence of chemistry makes a significant contribution to the observed discrepancy in addition to the suspected systematic offset, the variation of [O/Fe] with stellar mass would be most prominent in the enriched population of the cluster instead of the primordial population. Since this conclusion contradicts the theoretical expectation, we disfavor this explanation and suggest that the mass dependence of chemistry makes a subdominant contribution compared to the systematic offset, if any. We therefore expect the difference in [O/Fe] between the lower main-sequence and evolved stars to be less than the estimated systematic offset of 0.15 dex.
- 5.Corroborating our previous study of ω Centauri, we confirm that the JWST CMD of 47 Tucanae is expected to have a stellar/substellar gap below the end of the main sequence, followed by a large number of brown dwarfs (Figure 9). The gap occurs around F322W2 ∼26 mag, and the maximum density of brown dwarfs within the modeling range is attained at F322W2 ∼ 27.5 mag. Our evolutionary models suggest that stellar/substellar gaps form around the age of 0.5 Gyr in globular clusters similar to 47 Tucanae and get deeper and wider over time.
- 6.While our models indicate that the colors of brown dwarfs are highly sensitive to chemical abundances (Figure 5), the apparent degeneracy between their isomass lines and isochrones (Figure 10) will make the inference of oxygen abundance challenging in the considered color–magnitude space (F322W2 vs. F150W2 − F322W2). On the other hand, the brown dwarf magnitude function will be sensitive to chemistry, introducing additional systematic biases to age estimates inferred from the stellar/substellar gap.
The constraints on the mass dependence of the oxygen abundance inferred in this study restrict the allowed parameter space of concurrent formation MP models, in agreement with previous studies of the photometric spread near the end of the main sequence (Milone 2023; Ziliotto et al. 2023). However, a detailed model of pollution as a function of stellar mass is required to carry out a thorough evaluation of proposed concurrent formation models, which may be challenging to derive owing to the uncertain properties and evolution of circumstellar disks.
Future observations of the substellar sequences in nearby globular clusters, including 47 Tucanae, will extend the mass baseline of photometric analysis by nearly an order of magnitude and explore the abundances of other elements such as carbon and nitrogen that are far more important in the atmospheres of brown dwarfs than main-sequence stars (Figure 5). The aforementioned isomass–isochrone degeneracy suggests that the luminosity function of brown dwarfs in globular clusters needs to be considered in conjunction with the CMD when deriving photometric chemical abundances. We further emphasize that JWST and HST bands other than the ones considered here may be more sensitive to chemical variations in substellar atmospheres, necessitating a follow-up study that explores all possible color combinations rather than a small subset of filters used in this paper.
We note that the predicted substellar CMD of 47 Tucanae in Figure 10 was calculated under the assumption that the variation in [O/Fe] alone is sufficient to reproduce the photometric scatter. While this assumption was shown to be accurate for the main-sequence stars, it likely has limited validity in the substellar regime, and a more accurate theoretical CMD may be obtained by calculating additional isochrones that incorporate the spectroscopically inferred scatter in other elements.
If the spectroscopic/photometric discrepancy discussed here and in Section 6.1 is primarily caused by systematic offsets, their nature must be investigated in a future study. In particular, the accuracy of interpolation and extrapolation of best-fit theoretical isochrones can be verified by a denser sampling of [O/Fe] with calculated stellar models. The accuracy of the models themselves can be assessed by comparing synthetic spectra to spectroscopic observations of nearby metal-poor stars and brown dwarfs.
Acknowledgments
We acknowledge the funding support from Hubble Space Telescope (HST) Program GO-15096, provided by NASA through a grant from the Space Telescope Science Institute, which is operated by the Association of Universities for Research in Astronomy, Incorporated, under NASA contract NAS5-26555. The computational demand of this study was met by the Extreme Science and Engineering Discovery Environment (XSEDE), supported by NSF grant ACI-1548562. Some of the software used in this study was produced with assistance from ChatGPT 3.5. ChatGPT is a large language model developed and maintained by OpenAI. This work was conducted at University of California, San Diego, which was built on the unceded territory of the Kumeyaay Nation. Today, the Kumeyaay people continue to maintain their political sovereignty and cultural traditions as vital members of the San Diego community. We acknowledge their tremendous contributions to our region and thank them for their stewardship.
Appendix: Nominal Composition
Table 3 lists the nominal composition of 47 Tucanae adopted in this work, based on spectroscopic observations of giant and subgiant members of the cluster in the literature. The derivation of the abundances listed in the table is described in Section 2. The physical member-to-member spread provided in the table (s(X)) was calculated using Equation (1).
Table 3. Average Chemical Composition of 47 Tucanae Inferred from Spectroscopic Measurements in the Literature
| Abundance | Best Estimate | Uncertainty | Physical Spread | No. of Measurements | Reference(s) |
|---|---|---|---|---|---|
| [Fe/H] | −0.75 | 0.01 | ⋯ | 281 | (1)(2)(3) |
| [Al/Fe] | 0.35 | 0.01 | 0.06 | 195 | (1)(2)(3) |
| [Ba/Fe] | 0.25 | 0.07 | ⋯ | 13 | (1) |
| [C /Fe] | −0.25 | 0.01 | 0.10 | 70 | (3) |
| [Ca/Fe] | 0.26 | 0.01 | ⋯ | 162 | (1)(2) |
| [Ce/Fe] | −0.04 | 0.10 | ⋯ | 11 | (1) |
| [Co/Fe] | −0.00 | 0.02 | ⋯ | 13 | (1) |
| [Cr/Fe] | −0.04 | 0.03 | ⋯ | 13 | (1) |
| [Cu/Fe] | −0.14 | 0.10 | ⋯ | 13 | (1) |
| [Dy/Fe] | 0.70 | 0.07 | ⋯ | 13 | (1) |
| [Eu/Fe] | 0.44 | 0.01 | ⋯ | 150 | (1)(2) |
| [La/Fe] | 0.20 | 0.01 | ⋯ | 144 | (1)(2) |
| [Mg/Fe] | 0.35 | 0.01 | ⋯ | 87 | (1)(3) |
| [Mn/Fe] | −0.19 | 0.04 | ⋯ | 13 | (1) |
| [Mo/Fe] | 0.55 | 0.04 | ⋯ | 13 | (1) |
| [N /Fe] | 0.85 | 0.05 | 0.33 | 54 | (3) |
| [Na/Fe] | 0.27 | 0.01 | 0.15 | 236 | (1)(2)(3) |
| [Nd/Fe] | 0.04 | 0.07 | ⋯ | 13 | (1) |
| [Ni/Fe] | −0.06 | 0.01 | ⋯ | 174 | (1)(2)(3) |
| [O /Fe] | 0.18 | 0.02 | 0.16 | 117 | (1)(2) |
| [Pr/Fe] | −0.03 | 0.06 | ⋯ | 13 | (1) |
| [Ru/Fe] | 0.50 | 0.04 | ⋯ | 13 | (1) |
| [Sc/Fe] | 0.21 | 0.05 | ⋯ | 13 | (1) |
| [Si/Fe] | 0.32 | 0.01 | ⋯ | 222 | (1)(2)(3) |
| [Ti/Fe] | 0.34 | 0.01 | ⋯ | 163 | (1)(2) |
| [V /Fe] | 0.17 | 0.04 | ⋯ | 13 | (1) |
| [Y /Fe] | 0.07 | 0.05 | ⋯ | 13 | (1) |
| [Zn/Fe] | 0.26 | 0.04 | ⋯ | 13 | (1) |
| [Zr/Fe] | 0.41 | 0.06 | 0.10 | 13 | (1) |
Note. All values are quoted in dex with respect to solar abundances.
References. (1) Thygesen et al. (2014); (2) Cordero et al. (2014); (3) Marino et al. (2016).
Footnotes
- 8
- 9
- 10
- 11
- 12
- 13
- 14
Gerasimov et al. (2022a) have overlooked this distinction in definitions, and therefore the boundary condition tables used in that study may be less accurate, especially at very low Teff, where the opacity at λ = 1.275 μm is no longer representative of the average across all wavelengths.
- 15