


Abstract
We present the lifetime star formation histories (SFHs) for six ultrafaint dwarf (UFD; MV > − 7.0,  ) satellite galaxies of M31 based on deep color–magnitude diagrams constructed from Hubble Space Telescope imaging. These are the first SFHs obtained from the oldest main-sequence turnoff of UFDs outside the halo of the Milky Way (MW). We find that five UFDs formed at least 50% of their stellar mass by z = 5 (12.6 Gyr ago), similar to known UFDs around the MW, but that 10%–40% of their stellar mass formed at later times. We uncover one remarkable UFD, And xiii, which formed only 10% of its stellar mass by z = 5, and 75% in a rapid burst at z ∼ 2–3, a result that is robust to choices of underlying stellar model and is consistent with its predominantly red horizontal branch. This "young" UFD is the first of its kind and indicates that not all UFDs are necessarily quenched by reionization, which is consistent with predictions from several cosmological simulations of faint dwarf galaxies. SFHs of the combined MW and M31 samples suggest reionization did not homogeneously quench UFDs. We find that the least-massive MW UFDs (M*(z = 5) ≲ 5 × 10⁴M⊙) are likely quenched by reionization, whereas more-massive M31 UFDs (M*(z = 5) ≳ 105M⊙) may only have their star formation suppressed by reionization and quench at a later time. We discuss these findings in the context of the evolution and quenching of UFDs.
Export citation and abstract BibTeX RIS

Original content from this work may be used under the terms of the Creative Commons Attribution 4.0 licence. Any further distribution of this work must maintain attribution to the author(s) and the title of the work, journal citation and DOI.
1. Introduction
Ultrafaint dwarf (UFD) galaxies around the Milky Way (MW) represent our strongest observational link between cosmic reionization and low-mass galaxy formation. Long-standing theoretical models posit that the ultraviolet (UV) background in the early Universe should prevent or suppress star formation in the lowest-mass dark matter halos (e.g., Efstathiou 1992; Bullock et al. 2000; Benson et al. 2002, 2003; Somerville 2002; Bovill & Ricotti 2009; Muñoz et al. 2009; Salvadori & Ferrara 2009; Busha et al. 2010; Tumlinson 2010; Simpson et al. 2013; Wheeler et al. 2015; Jeon et al. 2017). Stellar populations of these "fossil" galaxies were predicted to be largely ancient (z > 6), but color–magnitude diagram (CMD) analysis of classical Local Group dwarfs found virtually all of them to have substantial star formation at younger ages (e.g., Tolstoy et al. 1998; Gallart et al. 1999; Grebel & Gallagher 2004; Monelli et al. 2010b, 2010a; de Boer et al. 2012, 2014; Weisz et al. 2014a; Skillman et al. 2017; Savino et al. 2019). The discovery of UFDs in the early 2000s (e.g., Willman et al. 2005a, 2005b; Zucker et al. 2006a, 2006b; Belokurov et al. 2006, 2007; Sakamoto & Hasegawa 2006; Irwin et al. 2007; Walsh et al. 2007) and the precise determination of their star formation histories (SFHs) in the 2010s now provide the strongest evidence that reionization can stunt the formation of low-mass galaxies. Virtually all MW UFDs with SFHs measured from the oldest main-sequence turnoff (oMSTO) are consistent with a rapid quenching of their star formation at 6 ≲ z ≲ 8 (Brown et al. 2012, 2014; Okamoto et al. 2012; Weisz et al. 2014a, 2023; Gallart et al. 2021; Sacchi et al. 2021; Simon et al. 2021), in agreement with many predictions and observational constraints on the timing and duration of reionization (e.g., Fan et al. 2006; Ouchi et al. 2010; Pentericci et al. 2011; Ono et al. 2012; Robertson et al. 2015; Planck Collaboration et al. 2016).
Despite the uniformity of these SFHs, there remain lingering concerns about selection bias, as all of these UFDs share a common accretion history associated with the dark matter halo of the MW. While theoretical and observational efforts have been dedicated to quantifying environmental effects in the evolution of the MW's UFDs (e.g., Wetzel et al. 2015; Rodriguez Wimberly et al. 2019; Sacchi et al. 2021; Santistevan et al. 2023), the degree of synchronicity in formation and quenching among the dozens of known UFDs and the potential influence of local environment are poorly understood.
The cleanest way to alleviate these concerns is to measure the SFHs of UFDs outside the MW's halo. Ideally, the best test would use UFDs that are unambiguously isolated, mitigating any possible effects of environment. However, the first isolated UFD was discovered serendipitously and only within the past year (Sand et al. 2022). Instead, the only known UFDs that reside outside the MW halo, and that we can image down to the oMSTO, are satellites of M31 (e.g., Martin et al. 2016; Collins et al. 2022a; Martínez-Delgado et al. 2022; McQuinn et al. 2023). Measuring precise SFHs of these faint, distant systems (D ∼ 750 kpc) requires the excellent angular resolution and sensitivity of the Hubble Space Telescope (HST) and was a main science driver behind the 244 orbit HST Survey of M31 Satellites program awarded in Cycle 27 (HST-GO-15902, PI: Weisz).
In this paper, we present the SFHs of six UFDs that are in the satellite system of M31. These are the first SFHs of bona fide UFDs (i.e., MV > − 7.5; Simon 2019) outside the MW's halo that have been measured from their oMSTOs. We summarize our data in Section 2, describe our methodology in Section 3, and discuss results in Section 4. Throughout the paper we assume a Λ cold dark matter (CDM) cosmological model based on Planck Collaboration et al. (2020).
2. Data
We use photometric catalogs obtained as part of the HST Treasury Survey of the M31 Satellite System (Savino et al. 2022; D. Weisz et al. 2023, in preparation). This program obtained new F606W and F814W Advanced Camera for Surveys (ACS) and UVIS imaging of 23 satellites of M31 without previous deep HST imaging and was combined with archival HST data to provide oMSTO-depth imaging for 34 known M31 satellites.
The photometry for the UFDs considered in this paper is based on a combination of new F606W and F814W HST/ACS imaging from the HST Treasury program and shallower archival imaging in the same filters taken as part of program GO-13699 (PI:Martin; Martin et al. 2017). We select every galaxy targeted by the survey that has an absolute magnitude MV
> − 7.0, which leaves no ambiguity about their status as UFDs. We use absolute magnitudes from Savino et al. (2022), which are based on the PandAS structural parameters of Martin et al. (2016) and are recalibrated on the basis of updated RR Lyrae distances. This selection yields six targets: And xi (MV
= − 6.4 ± 0.4, 11 orbits of imaging), And xii (MV
= − 6.6 ± 0.5, 11 orbits), And xiii (MV
= − 6.8 ± 0.4, 9 orbits), And xx (MV
= − 6.4 ± 0.4, 11 orbits), And xxii (MV
= − 6.4 ± 0.4, 18 orbits), and And xxvi ( , 16 orbits).
Details of the photometric reduction and catalog construction are broadly described in Savino et al. (2022) and will be presented at length in the upcoming program survey paper (D. Weisz et al. 2023, in preparation). Here, we provide a brief summary. We reduced the ACS imaging using DOLPHOT (Dolphin 2000, 2016), a well-tested point-spread function photometry package that is commonly used in the analysis of HST imaging of nearby galaxies (e.g., Holtzman et al. 2006; Dalcanton et al. 2009, 2012; Monelli et al. 2010b; McQuinn et al. 2010; Radburn-Smith et al. 2011; Weisz et al. 2014b; Williams et al. 2014, 2021). We reduce the data using the same DOLPHOT setup recommended in PHAT (Williams et al. 2014), with the exception of the PSFPhotIT parameter, which we set to 2. This choice adds a second iteration to the photometric reduction, which refines the noise estimates and results in higher completeness at low signal-to-noise ratio (S/N).
From the resulting DOLPHOT catalogs, we select stars that are likely galaxy members using several criteria. First, we cull our photometric catalogs using DOLPHOT quality metrics. Namely, we select sources with:
- 1.S/N ≥ 4
- 2.Sharp2 ≤ 0.2
- 3.Crowd ≤ 0.75
- 4.Round ≤ 3
in both F606W and F814W filters. This step eliminates spurious sources, including artifacts and extended background galaxies. These selection criteria are slightly different from the PHAT recommendations (Williams et al. 2014). This is because the lower stellar density in our satellite galaxies, compared to the disk of M31, allows us to apply more stringent thresholds to the values of Crowd (the amount of contamination from neighboring sources) and Round (the ellipticity of the source's light profile). We can therefore exclude contaminants more efficiently while retaining most stellar sources.
Second, we remove residual artifacts originating from the diffraction spikes of bright foreground stars. We do this by masking the region around all known Gaia stars with G < 18 that are located in or near our ACS fields. The masks are designed on a star-by-star basis to encompass the central saturated core and the visible extent of the diffraction spikes. Finally, we use the structural parameters of Martin et al. (2016) to select only sources that fall within the ellipse corresponding to 2 half-light radii (rh ) from the photometric center of the galaxy. Our HST fields are close to the photometric center in each of our targets. In most cases, however, the ACS field of view is not sufficiently large to capture the full 2rh ellipse. This means that the spatial selection function varies slightly among our targets. We do, however, fully account for this variable spatial footprint whenever relevant, e.g., to calculate stellar masses (see Section 3).
Figure 1 shows the CMDs for our six UFDs. The CMDs are deep, with F606W detection limits (S/N = 4) between 29.4 and 29.8. The S/N at oMSTO (MF606W ∼ + 4.0) is ∼10. The stellar populations of these systems can be visually appreciated by the diversity of horizontal branch (HB) morphologies. We find that some of our galaxies have predominantly red HBs, confirming what was already reported from shallower HST photometry (Da Costa et al. 1996, 2000, 2002; Martin et al. 2017). This is particularly the case for And xiii and And xxii, which almost entirely lack a blue HB. And xx and And xxvi also have a high fraction of red HB stars. The red HB is typically associated with younger ages and/or higher metallicities (e.g., Gratton et al. 2010; Salaris et al. 2013; Savino et al. 2019). We do not include the HB in our SFH fits, and instead use the HBs as a secondary check on the results, which we discuss in Section 4.3.

Figure 1. HST/ACS F606W vs. (F606W-F814W) CMDs for the six UFDs analyzed in this paper. CMDs are for the central 2 half-light radii. The red dashed line marks the 50% completeness level as determined from artificial star tests. Select BaSTI isochrones of different ages and metallicities are overplotted for reference. Note the diversity of horizontal branch morphologies, which suggest a diversity of stellar populations, as previously found by Martin et al. (2017). We do not include the HBs in our SFH determinations and instead use them as a sanity check on our results.
Download figure:
Standard image High-resolution image3. CMD Modeling Setup
We model each UFD CMD using MATCH (Dolphin 2002), a commonly used software routine that recovers the system SFH by forward modeling the CMD with a combination of simple stellar population models. Details on the CMD-fitting methodology are provided in the original papers and in many other nearby galaxy studies (e.g., Weisz et al. 2014a; McQuinn et al. 2015). Here, we provide specific details used for modeling our sample.
We use a Kroupa initial mass function (Kroupa 2001), normalized between 0.08 M⊙ and 120 M⊙, and an unresolved binary fraction of 0.35, with secondary masses drawn from a uniform mass ratio distribution. The binary fraction in UFD galaxies is poorly known. However, because our CMDs do not extend significantly below the oMSTO, this parameter has very little impact. To verify this, we have repeated our analysis assuming binary fractions of 0.5 and 0.7, and obtained virtually indistinguishable results (more details are available in Appendix
Table 1. Adopted Distance and Reddening Values for Our CMD Modeling, Literature Absolute Magnitudes, and Stellar Masses and Star Formation Timescales Inferred from Our Analysis of the Six UFDs
| ID | (m − M)0 | E(B − V) | MV | M*(z = 0) | M*(z = 5) | τ50 | τ80 | τ90 | τ20–80 | τ20–90 |
|---|---|---|---|---|---|---|---|---|---|---|
| (105 M⊙) | (105 M⊙) | (Gyr) | (Gyr) | (Gyr) | (Gyr) | (Gyr) | ||||
| And xi | 24.38 ± 0.07 | 0.09 ± 0.03 | −6.4 ± 0.4 |

|

|

|

|

|

|

|
| And xii | 24.28 ± 0.08 | 0.17 ± 0.03 | −6.6 ± 0.5 |

|

|

|

|

|

|

|
| And xiii | 24.57 ± 0.07 | 0.14 ± 0.03 | −6.8 ± 0.4 |

|

|

|

|

|

|

|
| And xx | 24.35 ± 0.08 | 0.08 ± 0.03 | −6.4 ± 0.4 |

|

|

|

|

|

|

|
| And xxii | 24.39 ± 0.07 | 0.10 ± 0.03 | −6.4 ± 0.4 |

|

|

|

|

|

|

|
| And xxvi | 24.48 ± 0.07 | 0.09 ± 0.03 |

|

|

|

|

|

|

|

|
Download table as: ASCIITypeset image
We adopt the BaSTI scaled-solar stellar models (Hidalgo et al. 2018). While many galaxies in this mass range exhibit various degrees of α-enhancement (e.g., Simon 2019), this generally has a minor impact on the broadband filters, and scaled-solar models are used in many SFH studies (e.g., Monelli et al. 2010b; Skillman et al. 2017). The main difference is a zero-point offset in the recovered [Fe/H] values (Salaris et al. 1993; Cassisi et al. 2004). We show the effects of α-enhanced versus scaled-solar mixtures in Appendix B and find negligible differences in the recovered SFHs. The adequacy of BaSTI scaled-solar models is further illustrated in Appendix D, in which we show that the CMD of the metal-poor MW globular cluster M92 is well matched by the scaled-solar isochrone of the appropriate age and metallicity.
We use a grid of simple stellar populations over an age range of  with a 0.05 dex resolution and metallicities that span −3.0 < [Fe/H] < 0, with a 0.1 dex resolution. We adopt a physically motivated prior on the age–metallicity relationship consistent with several past studies (e.g., Weisz et al. 2014a; Skillman et al. 2017). Specifically, we require the metallicity to increase monotonically with time, with a modest dispersion allowed at each age (0.15 dex). This helps mitigate the age–metallicity degeneracy at the oMSTO, which is affected by the modest S/N of the data, the limited temperature sensitivity of F606W-F814W, and the paucity of stars on the CMDs of these faint galaxies. This prior only requires metallicity to increase with time but puts no constraints on the metallicity values themselves. Additional details about the metallicity of our targets are provided in Section 4.3, and further tests on the effect of this assumption are detailed in Appendix
We model observational effects (photometric errors and incompleteness) for each galaxy using ∼5 × 10⁵ artificial star tests (ASTs). The ASTs are distributed uniformly in color and magnitude over the CMD and spatially distributed following a 2D exponential density profile that is taken from Martin et al. (2016). The ASTs are injected into the images and recovered with the same reduction setup described in Section 2.
We model the CMD from ∼2 mag above the brightest observed red giant branch stars down to the observed magnitude that corresponds to a 50% completeness level (28.3–28.6 in F606W and 27.6–27.9 in F814W). We use a CMD bin size of 0.05 × 0.1 mag in color and magnitude, respectively. We exclude the HB region from the fit due to uncertainties in the models of HB stars and to the availability of more reliable age and metallicity sensitive MSTO stars in our photometry (e.g., Gallart et al. 2005). In our models, we include MW foreground stars using the models from de Jong et al. (2010).
MATCH maximizes a Poisson likelihood function to find the most likely SFH that describes the observed CMD. We then calculate random uncertainties in the solution using the methodology described in Dolphin (2013), which is based on Hamiltonian Monte Carlo sampling of the solution parameter space. We also estimate the size of systematic uncertainties due to the stellar models, using the methodology of Dolphin (2012). This technique introduces perturbations in the luminosity and temperature of the reference stellar models, to simulate uncertainties in the stellar evolution parameters. We also explore the effects of stellar evolution models on our fits in Appendix B, and find they are consistent with our computed systematic uncertainties.
As an example for our modeling procedure, Figure 2 shows the observed CMD Hess diagram, the best-fit CMD model and the fit residuals for one of our targets (And xx). Aside from a minor discrepancy at the level of the HB (which was excluded from the fit; red box), there is good agreement between the observed and model CMD; no notable structure is visible in the residuals. The fits for the other five galaxies are of similar quality.

Figure 2. An example of the CMD fits for And xx. Shown are density maps for the observed (left panel), best-fit (center), and residual CMDs (right). The latter is expressed in units of Poisson standard deviations. For ease of comparison, the best-fit CMD is shown as a random sampling of the underlying smooth density field. The red outline marks the HB region, which has been excluded from the fit. The fit quality is good, with no obvious systematic structures. The other galaxies all display similar fit qualities.
Download figure:
Standard image High-resolution imageWe use the present-day and early Universe stellar masses as measured from CMD modeling as part of our analysis. To get the total stellar mass, we first integrate the SFH, which yields the birth mass of the stellar population in our HST field. The present-day stellar mass in our HST field is then derived by subtracting the amount of mass lost due to stellar evolution. We calculate this factor using the stellar population framework of Conroy et al. (2009), assuming a 13 Gyr stellar population with [Fe/H] = − 2.0 (see Section 4). The resulting mass loss is 42.5% of the stellar population birth mass. For old stellar populations, this value has very little dependence on the SFH. For stellar populations with 8 < t < 14 Gyr, and −3.0 < [Fe/H] < − 1.0, this factor changes by less than 2%. Then, we must account for the limited spatial coverage of the CMDs (due to the ACS field of view and the catalog spatial cuts). Under the assumption that the stellar mass-to-light ratio does not vary significantly across the galaxy, we use the morphological parameters from Martin et al. (2016) to estimate what fraction of the stellar mass falls outside our footprint. This fraction varies from 15% (And xx) to 55% (And xii). We then obtain the total present-day stellar mass for our UFDs.
The stellar mass uncertainties are calculated using a Monte Carlo approach. We obtain 5000 random realization of the stellar mass by sampling from the SFH uncertainties and the reported uncertainties in the Martin et al. (2016) structural parameters. We then use the 16th and 84th percentile of the stellar mass distribution to estimate our confidence interval.
We also estimate the stellar mass of the galaxies at z = 5 using a similar procedure. In this case, we use the total star formation in our oldest age bin to calculate the birth stellar mass. Because we have no constraints on when star formation occurred within our oldest time bin, stellar evolution mass loss is more uncertain. We include this effect in our Monte Carlo samples by drawing a stellar population birth time from a uniform  probability distribution and calculating the corresponding mass loss at z = 5. The median mass loss we obtain with this method is 34%. The resulting stellar masses of the galaxies at z = 0 and z = 5 are listed in Table 1. Because star formation causes stellar mass to increase over time and stellar evolution mass loss causes a decrease in stellar mass, the inferred stellar mass at z = 5 can be higher or lower than what is measured at z = 0, depending on the interplay between these two factors.
4. Results and Discussion
4.1. Lifetime SFHs
Figure 3 shows the lifetime cumulative SFHs for our six UFDs. We focus on the cumulative SFHs because they provide a robust statistical treatment of the uncertainties, which includes the covariance among different star formation bins. However, for completeness, we also provide the instantaneous star formation rates in Appendix A. Five of the UFDs in our sample (And xi, And xii, And xx, And xxii, and And xxvi) have a prominent episode of star formation in the earliest time bin (t > 12.6 Gyr), which drastically decreased in intensity by z ∼ 5. Taken at face value, the best-fit SFHs indicate that all five galaxies formed ≳50% of their stellar mass in the oldest time bin. This initial strong episode of star formation is followed by varying degrees of star formation at later times ranging from ∼15% (And xi) to ∼35% (And xxii) of the total stellar mass. The significance of this SFH tail, and its fidelity to the true evolution of our targets, will be further discussed in Section 4.3.

Figure 3. The lifetime cumulative SFHs of the six UFDs analyzed in this paper. The black line shows the best-fit SFH, the yellow shading reflects random uncertainties, and the gray shading indicates the inclusion of systematic uncertainties from stellar models. The red shaded region marks the approximate period of cosmic reionization (6 ≲ z ≲ 9; Robertson 2022). Though the majority of these galaxies have predominantly ancient stellar populations, some formed 10%–40% of their stellar mass post-reionization. And xiii is a "young" UFD, the first known of its kind.
Download figure:
Standard image High-resolution imageAnd xiii exhibits a very different SFH. From the best-fit SFH, we see that only 10% of its stellar mass formed in the oldest time bin, followed by a ∼1 Gyr quiescent period. The galaxy then experienced a strong burst of star formation beginning 11 Gyr ago, in which it formed 75% of its total stellar mass in the span of 1 Gyr.
As we discuss below, the SFH of And xiii is unlike any other known UFD. Its unusual nature, and the observational challenges linked to this target (being the most distant system in our sample, one of the most extincted, and with relatively shallow photometry) motivated a number of tests for robustness (e.g., sensitivity to adopted stellar model, distance/extinction variations), all of which confirm this "young" UFD scenario. These tests are illustrated in the Appendices B, C, D, and E of this paper and reveal that, under virtually any assumption, no more than 40% of the total stellar mass of And xiii could have formed in the oldest time bin.
Figure 4 illustrates the features in And xiii's CMD that are linked to a younger age. We have taken the Hess diagram of And xiii's CMD, removed the effect of distance and reddening, and normalized its integral to 1, effectively deriving a probability density distribution of its stars on the CMD. We did the same for the Hess diagram of And xii, which has 80% of its star formation in the oldest time bin. We show the difference between the two density maps (left panel). Because the two photometric catalogs have very similar depth and completeness, differences in the density distribution are intrinsic to the stellar population properties.
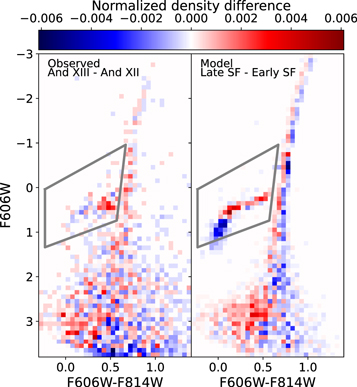
Figure 4. Left: difference between the normalized density distribution of stars in the CMD of And xiii and that in the CMD of And xii. Red pixels denote an excess of stars in the CMD of And xiii, while blue pixels denote a deficiency. The gray box shows the HB region, which was excluded from the CMD fit. Right: difference between the normalized density distribution of stars in a "late" star-forming population model (average stellar age of ∼10.6 Gyr) and an "early" star-forming population model (average stellar age of ∼13.5 Gyr). Compared to And xii, And xiii has a markedly redder HB and a higher fraction of bright MSTO stars. As supported by the models, this is a sign of a comparatively younger stellar population.
Download figure:
Standard image High-resolution imageFor comparison, we have also constructed a similar map (right panel) showing the difference between two stellar population models. The first one is an "early" star-forming model, that only has star formation in the oldest time bin ( , with an average age of 13.5 Gyr), while the second is a "late" star-forming model, in which the star formation happens in our third time bin (
 , with an average age of 10.6 Gyr). The metallicities of the early and late models have been set to match the best fit for And xii ([M/H] ∼ − 1.75) and And xiii ([M/H] ∼ − 2.0), respectively.
As shown in Figure 4, the MSTO of And xiii is significantly brighter and bluer than that of And xii. This guides our fit to substantially younger ages. Although not included in the CMD fit, Figure 4 also highlights the much redder color of And xiii's HB compared to And xii, which is compatible with the younger SFH solution. In fact, both features (brighter MSTO and redder HB) are visible in the late-versus-early model comparison, although the models predict bluer HBs compared to observations, due to long-standing limitations in stellar mass-loss models (e.g., Gratton et al. 2010).
In principle, a higher fraction of ancient stars could exist in And xiii outside of our HST field of view. Stellar population gradients are known to be widespread in nearby classical dwarfs (e.g., Tolstoy et al. 2004; Battaglia et al. 2008; Vargas et al. 2014; Savino et al. 2019), with young metal-rich stars being more centrally concentrated than older, more metal-poor, stars. It is currently unclear whether these gradients exist in UFDs but, if they did, they would affect the fraction of young stars in our central HST field. However, the small size of And xiii ( ; Martin et al. 2016) means that our HST field contains ∼80% of And xiii's total light. Under the extreme assumption that every star outside our field of view was ancient, our SFH solution would still allow for no more than 30% of the total stellar mass to have formed before 12.6 Gyr ago.
4.2. Comparison with MW UFDs
To place our findings into a broader context, Figure 5 shows our best-fit SFHs, alongside similar measurements for the 13 MW UFD satellites that have published SFHs (Brown et al. 2014; Sacchi et al. 2021). The SFHs are color-coded according to the galaxy luminosity.

Figure 5. Lifetime cumulative SFHs for our six M31 UFDs (solid lines), compared to those of MW UFD satellites (dashed lines) from the Brown et al. (2014) sample (left panel) and the Sacchi et al. (2021) sample (right panel), which contains galaxies typically 2–3 mag less luminous. The SFHs are color-coded by present-day luminosity. The shaded gray region delineates the epoch of reionization. The dotted lines and circular symbols illustrate the definition of τX for one of our galaxies (And xiii).
Download figure:
Standard image High-resolution imageFigure 5 shows two clear trends. First, 16 of the 19 galaxies in the combined sample formed ∼80% of their stellar mass by z ≥ 5. Two of the exceptions are Ursa Major I from Brown et al. (2014) and And xxii from this study, which formed 60% and 65% of their stellar mass by z = 5. The other exception is And xiii. Second, in general, the lowest-luminosity galaxies (MV ≲ − 6) quench earlier than more-massive UFDs. This trend is clearly evident in the comparison with the Sacchi et al. (2021) sample, which is composed of particularly faint galaxies, but is also appreciable in the more-massive sample of Brown et al. (2014). Importantly, because the lowest-luminosity systems are typically MW UFDs and the higher-luminosity systems are M31 satellites, it is possible that this is not exclusively a stellar mass trend, but could be related to differences in the early environment of the two samples. We revisit this point later in the discussion.
Figure 6 shows the same comparison of Figure 5, color-coding the SFHs by stellar mass at z = 5. Because of the mostly ancient SFHs, the present-day luminosity roughly traces the high-redshift stellar mass, preserving the trend observed in Figure 5. However, And xiii stands out in this comparison. In fact, while having the highest present-day luminosity of our combined sample, And xiii has a stellar mass at z = 5 that is comparable to some of the MW UFDs. Nonetheless, while the latter quenched rapidly, And xiii halted star formation at a much later time (t ≲ 10 Gyr). We discuss the SFH of this galaxy in greater detail in Section 4.5.
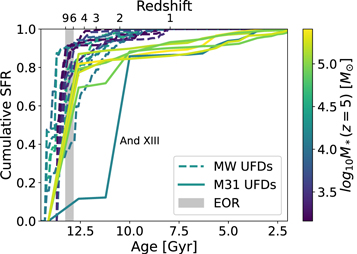
Figure 6. Lifetime cumulative SFHs for our six M31 UFDs (solid lines), compared to those of MW UFD satellites (dashed lines), color-coded by total stellar mass at z = 5. The shaded gray region delineates the epoch of reionization. The SFH of And xiii is highlighted in the figure.
Download figure:
Standard image High-resolution imageThe trends of Figure 5 can be quantified more clearly through a comparison of characteristic star formation timescales. This is a common practice in the field (e.g., Weisz et al. 2014a, 2019; Skillman et al. 2017; Sacchi et al. 2021), which makes use of the quantity τX ; this is defined as the lookback time at which the galaxy reached X% of the total star stellar mass formed. For clarity, an illustration of these metrics is shown in Figure 5. Measurements of select τX for our sample are provided in Table 1.
Figure 7 compares values of τX for the same MW and M31 galaxies shown in Figure 5. It is again clear that, with the notable exception of And xiii, all MW and M31 UFDs formed at least 50% of their stellar mass by the end of cosmic reionization. Following previous studies (e.g., Skillman et al. 2017; Weisz et al. 2019; Sacchi et al. 2021) we can use τ90 as a tracer of the quenching epoch (Figures 5(a), (b)). This metric reveals a clear difference between MW and M31 UFDs. MW UFDs quenched rapidly after reionization, whereas M31 UFDs sustained star formation until as late as z ∼ 1. These extended SFHs can be appreciated in Figure 5(b), which shows τ20−90, defined as the time elapsed between 20% and 90% of the total star formation. While the MW UFDs have τ20−90 of the order of 2 Gyr, M31's satellites tend to have significantly larger values ranging from 4–8 Gyr.
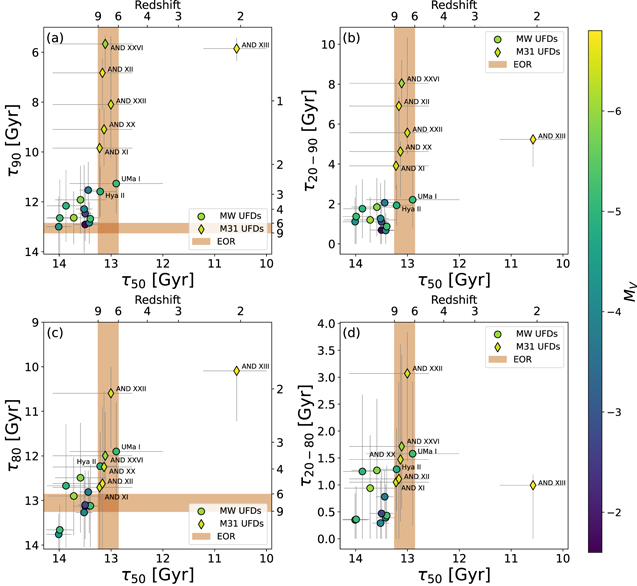
Figure 7. Comparison of star formation timescales (defined in Section 4.2) for a sample of MW (circles) and M31 (diamonds) UFD satellites. Symbols are color-coded by the galaxy present-day luminosity. The red shaded region marks the approximate period of cosmic reionization (Robertson 2022). (a): time at 50% of total star formation (τ50) vs. time at 90% of total star formation (τ90); (b): τ50 vs. time elapsed between 20% and 90% of total star formation (τ20–τ90); (c): τ50 vs. time at 80% of total star formation (τ80); (d): τ50 vs. time elapsed between 20% and 80% of total star formation (τ20–τ80).
Download figure:
Standard image High-resolution imageIn stark contrast to all other UFDs is And xiii. It has a younger stellar population with τ50 = 10.6 ± 0.6 Gyr. Like other M31 UFDs in our sample, And xiii shows signs of having some residual star formation ongoing for several gigayears, after the major event of star formation (which happened between 10 and 11 Gyr ago).
4.3. Do M31's UFD Satellites Have Extended SFHs?
The paradigm established from the SFHs of MW UFDs is that they are ubiquitously ancient. Given that our M31 UFDs all show some degree of star formation post-reionization, in contrast to known MW UFDs, it is important that we assess the robustness of our findings. We do this in three ways. First, we have re-run our fits using different stellar population model assumptions (Appendix B), perturbations in distance and extinction (Appendix C), assessing SFH recovery as a function of photometric depth using other real data (Appendix D), and employing a different CMD-fitting software (Appendix E). In short, the results of all of these tests do not change the quantitative conclusions presented in this paper, with the exception of And xi, which may be compatible with purely ancient star formation when different stellar models are used.
Second, we consider the metric, τX , by which we identify trends in the SFHs. For quenching, τ90 has been historically used in the literature as it gets close to τ100, but mitigates known issues with low levels of late star formation that can spuriously be introduced in the SFH by a variety of CMD contaminants, including photometric artifacts, foreground/background point sources, and blue straggler stars.
However, τ90 was introduced in the context of more-massive galaxies with well-populated CMDs. In the case of sparsely populated UFDs, even τ90 may be subject to spurious sources mimicking low-level star formation at late times. Thus, in Figures 5(c) and (d) we adopt τ80 as a more conservative tracer of galaxy quenching. As expected, this choice results in significantly less extended SFHs compared to τ90. Nonetheless, indications of post-reionization star formation activity remain. This is most clearly the case for And xiii. It is also clear for And xxii, which has an SFH that is inconsistent with quenching at z = 6, at a ∼2σ level. The remaining M31 UFDs are more consistent with the properties of the MW UFDs, although a moderate (≳1σ) indication of post-reionization star formation is also present in And xx and And xxvi. Even with this conservative metric, we see similar hints of extended star formation in two MW UFDs (Ursa Major I and Hydra II), which, taken at face value, suggest that even the MW UFDs may not all be fully quenched by reionization.
Overall, the results of Figure 7 indicate that, while the significance and duration of prolonged star formation depend somewhat on how we choose to define the signature of quenching, at least some of the M31 UFDs have sustained some level of true star formation at z ≲ 5. This conclusion is corroborated by additional studies of the M31 satellites. Generally extended SFHs, in excess of what is observed around the MW, have previously been obtained for other, more luminous M31 satellites from deep HST imaging (Weisz et al. 2014c; Monelli et al. 2016; Skillman et al. 2017). Similar tentative conclusions were previously reached for a larger M31 satellite sample (including some of the UFDs) based on SFHs from much shallower photometry (Weisz et al. 2014a, 2019; McQuinn et al. 2023). These SFHs necessarily have larger uncertainties in their SFHs, prohibiting the type of concrete conclusions we are able to draw in this paper.
Third, we examine our results in light of the HB morphologies. Recall that the HBs were excluded from the CMD fitting, meaning that they can provide an ancillary check on the reasonability of the MSTO-based SFHs. The HBs of M31 satellites are known to be redder on average than their MW counterparts (e.g., Da Costa et al. 1996, 2000, 2002; Martin et al. 2017). This is also the case for our UFD sample. As noted in Section 2, And xiii and And xxii, which show the strongest indication of post-reionization star formation, also have predominantly red HB stars. Less extreme, but still significant, populations of red HB stars are also present in And xx and And xxvi, in accordance with their tentatively prolonged SFHs. The morphology of the HB has been previously shown to be a good tracer of the underlying SFH (e.g., Salaris et al. 2013; Savino et al. 2018, 2019) and, while lingering uncertainties remain on the absolute age calibration of HB stars, it is generally accepted that red HB morphologies are a sign of younger ages and/or higher metallicities compared to blue HBs.
Though the quality of spectroscopic metallicities available for M31 satellites greatly varies (e.g., Collins et al. 2013; Ho et al. 2015; Kirby et al. 2020), what we do know so far is that they tend to follow the mass–metallicity relation known to exist for the MW satellites, and for thousands more galaxies in a large stellar mass range (e.g., Tremonti et al. 2004; Kirby et al. 2013). For the six UFDs in our sample, metallicity measurements have been obtained by Collins et al. (2013), although for a very limited number of spectroscopic members, and they suggest 〈[Fe/H]〉 values between −2.3 and −1.9, in good agreement with expectations from their stellar mass. In accordance with spectroscopy, our CMD fits report 〈[Fe/H]〉 values between −2.3 and −1.6, once the effect of α-enhancement is taken into account. In an effort to obtain more secure measurements, members of our team have acquired deep Keck/DEIMOS spectroscopy of a larger red giant branch sample in the M31 UFDs, and preliminary analysis indicates they have low metallicities consistent previous measurements and with the mass–metallicity relation, which suggests the red HBs are more likely the result of younger ages and not higher metallicities (N. Sandford et al. 2023, in preparation).
4.4. The Quenching of Local Group UFDs in the Context of Reionization
Our analysis of M31's UFDs has interesting implications for our understanding of star formation and quenching in low-mass satellites. Studies consistently show that, below a certain halo mass threshold, the post-reionization UV background is able to prevent the accretion of new gas into the cold interstellar medium (ISM) reservoir (e.g., Wheeler et al. 2015; Dayal & Ferrara 2018; Hutter et al. 2021). It has also been proposed that the cold gas already present in the halo might be photoevaporated, thus halting star formation, although the effectiveness of this mechanism is debated (e.g., Barkana & Loeb 1999; Haiman et al. 2001; Hoeft et al. 2006; Busha et al. 2010; Sawala et al. 2010; Simpson et al. 2013; Gutcke et al. 2022). The cosmic UV feedback has been therefore suggested to be the primary quenching mechanism for galaxies with stellar masses as high as 106 M⊙ (e.g., Bovill & Ricotti 2009; Salvadori & Ferrara 2009).
Observationally, differences in SFHs between the long-known classical dwarfs (e.g., Tolstoy et al. 1998; Gallart et al. 1999; Grebel & Gallagher 2004; Monelli et al. 2010b, 2010a; de Boer et al. 2014) and the more recently discovered MW UFDs (Okamoto et al. 2012; Brown et al. 2014; Sacchi et al. 2021; Simon et al. 2021; Weisz et al. 2023), supported the suggestion of such evolutionary pathway for low-mass dwarfs and led to the conclusion that galaxies in the UFD class are uniformly ancient. The SFHs derived in this paper, for M31 UFDs, also show a general prevalence of ancient (t < 12.6 Gyr) stars, and a subsequent lull of star formation activity. The timescale of this initial star formation burst, and its ubiquitous depression, are therefore compatible with the effect of cosmic reionization.
However, the properties of our sample, combined with literature measurements on the MW satellites, also suggest that the effect of reionization on UFDs is not homogeneous. Variations appear to exist in how efficient the UV feedback is at permanently halting star formation. The prime example of this heterogeneity is And xiii (which we discuss in detail in Section 4.5). However, evidence of inefficient quenching is also present in other galaxies of our sample. As discussed in Section 4.3, the precise amount of post-reionization star formation and the ultimate quenching epoch of our five "ancient" UFDs (And xi, And xii, And xx, And xxii, and And xxvi) is challenging to quantify (e.g., adopting τ90 versus τ80). Nonetheless, there are multiple lines of evidence that some of these galaxies have experienced subsequent episodes of star formation, building as much as 40% of their total stellar mass over the course of a few gigayears after reionization.
Importantly, this finding has been expected by several theoretical studies. Multiple high-resolution simulations have indeed shown that the interplay among reionization, halo assembly history, and ISM properties, can result in a substantial fraction of star formation to happen at later times (e.g., Hoeft et al. 2006; Oñorbe et al. 2015; Fitts et al. 2017; Jeon et al. 2017; Munshi et al. 2019; Rey et al. 2020; Gutcke et al. 2022). In such a scenario, however, it still remains unclear what mechanism ultimately quenched our M31 UFDs, at a later redshift. Various suggestions include supernovae feedback (e.g., Salvadori et al. 2008; Sawala et al. 2010; Gelli et al. 2020; Gallart et al. 2021) or environmental processes, such as ram pressure stripping, as the galaxies were accreted into the halo of M31 (e.g., Mayer et al. 2006; Romano et al. 2015; Putman et al. 2021). Distinguishing between internal and environmental quenching mechanisms will likely require measuring the orbital history of our sample and pinning down their quenching redshift with greater accuracy.
It also remains to be determined what drives the systematic differences between the early SFH of the M31 and MW samples, as there are hard-to-quantify selection and physical effects at play. For instance, UFDs associated with different hosts might have spent their early life in different regions around the "proto–Local Group." As reionization around the MW and M31 has been argued to be significantly patchy (e.g., Ocvirk et al. 2014, 2016; Aubert et al. 2018; Sorce et al. 2022), current satellites of M31 might have experienced different reionization conditions (e.g., timing, UV background strength) compared to their MW counterparts. This scenario might be even more relevant in light of the extensive evidence that M31 has experienced more recent accretion events compared to the MW (e.g., Belokurov et al. 2018; Helmi et al. 2018; McConnachie et al. 2018; Helmi 2020). These include massive galaxies (e.g., M33 and the progenitor of the Giant Stellar Stream), which are expected to have brought their own UFD satellites (e.g., Chapman et al. 2013; Patel et al. 2018). Satellites accreted at a later time might have spent their early life farther away from the strong ionizing sources around the proto-M31/MW. However, it is not clear if this difference in accretion history extends to the low-mass satellite population. In fact, it has been argued that, contrary to the lack of recent massive accretions, the MW has accreted UFDs at a relatively steady rate, up to recent times (e.g., Wetzel et al. 2015; Fillingham et al. 2019; Rodriguez Wimberly et al. 2019; Santistevan et al. 2023), suggesting there may be little difference in the ancient environments of UFDs.
On the other hand, our M31 sample also differs from the MW UFDs in terms of stellar mass. Due to detection biases (Doliva-Dolinsky et al. 2022), M31's known UFDs are all relatively luminous, with present-day stellar masses of ∼105 M⊙. At the time of reionization, these galaxies were already more massive than the MW sample (see Figure 5) and might have resided in more-massive and/or more concentrated dark matter halos. 32 This would have increased their efficiency to cool the gas that was ionized by the UV background (e.g., Jeon et al. 2017; Benitez-Llambay & Frenk 2020) and resume star formation at a later redshift. These galaxies might also have had a denser ISM, increasing the efficiency of self-shielding and allowing the retention of a cold gas reservoir (e.g., Sawala et al. 2010; Rahmati et al. 2013; Rey et al. 2020; Gutcke et al. 2022).
Galaxies in the 105 M⊙ stellar mass range are not common around the MW, which could explain the lack of extended SFHs. In fact, the study of galaxies at the massive end of the UFD spectrum was one of the main goals behind our M31 satellite survey. While providing an elegant explanation for the differences between MW and M31's UFDs, this scenario also has counterexamples. While not common, a few luminous UFDs exist around the MW (e.g., Bootes I or Hercules dSph). If galaxy mass was the dominant factor behind the efficiency of UFD quenching, we would expect these galaxies also to have extended SFHs, but their measured ages are ancient (Brown et al. 2014). Conversely, the SFH of And xiii implies that this galaxy was at most 4 · 104 M⊙ at the time of reionization, and had about similar stellar mass to some MW UFD satellites, such as Coma Berenices or Canes Venatici II. Yet, while the latter have quenched rapidly after z = 6, And xiii has kept forming stars. However, the SFH of And xiii is sufficiently anomalous that it deserves a separate discussion, as it might point to a completely different evolutionary pathway.
4.5. The Case of And xiii: The First Observed Episode of Reignition in an Ultrafaint Dwarf
Unlike the five other galaxies in our sample, And xiii experienced little star formation prior to z ∼ 3. At this time, it experienced a strong star formation episode and formed most of its stellar mass. This type of SFH is the first of its kind observed in such a low-mass system. Galaxies such as Leo T, And xvi, and And xix have SFHs that exhibit similar pauses (e.g., Irwin et al. 2007; de Jong et al. 2008; Clementini et al. 2012; Weisz et al. 2014c; Monelli et al. 2016; Skillman et al. 2017; Collins et al. 2022b), but they are more luminous systems (MV ≤ − 7.5). This general type of behavior (i.e., "reignition" or late ignition) has been seen in several cosmological simulations of dwarf galaxy populations by different groups (e.g., Fitts et al. 2017; Macciò et al. 2017; Digby et al. 2019; Garrison-Kimmel et al. 2019; Jeon et al. 2019; Wright et al. 2019; Applebaum et al. 2021; Benitez-Llambay & Fumagalli 2021), but typically in systems that are more massive (M* ≳ 5 × 10⁵ M⊙) than And xiii.
Within the assumption that the ability to fuel a cold gas reservoir in low-mass halos is regulated by the competition of radiative cooling and photoheating from the cosmic UV background, one possible scenario to explain the peculiar SFH of And xiii relies on an unusual mass assembly history. The expectation from ΛCDM is that, at a given redshift, efficient gas cooling can only proceed in halos above a critical mass Mcr (z) (e.g., Gnedin 2000; Okamoto et al. 2008; Fitts et al. 2017; Benitez-Llambay & Frenk 2020; Pereira-Wilson et al. 2023). In the pre-reionization era, the value of Mcr is dictated by the atomic hydrogen cooling limit, while the post-reionization threshold is set by the properties of the intergalactic medium and the strength of the UV background. If the halo that would eventually host And xiii had an unusually slow accretion rate at early times, so that Mh (z) ≤ Mcr (z), it might have reached the reionization epoch having formed only a modest amount of stellar mass. At this stage, the properties of And xiii could have been similar to those of some of the quenched UFDs around the MW. After reionization, the mass of And xiii's halo would have remained below Mcr until z ≃ 3, after which it experienced a substantial increase in mass growth rate. The deeper gravitational potential would have then allowed And xiii to reconstitute a reservoir of cold ISM and eventually ignite prominent star formation. Adopting the classification scheme of Gallart et al. (2015), And xiii would be therefore a very-low-mass example of a "slow" dwarf (whereas the remaining five UFDs of our sample would be "fast" dwarfs).
An alternative scenario is that proposed by Wright et al. (2019), in which star formation is triggered by the interaction with a dense gas pocket (either in a filament or in the circumgalactic medium of a more massive galaxy). Such interaction would have compressed the hot gas around And xiii, allowing for cooling and enabling star formation reignition, without the need of strong dark matter accretion.
A third hypothesis is that And xiii underwent a major merger with another UFD of comparable mass. This scenario combines both mechanisms discussed above. A merger would rapidly increase the dark matter halo mass, resulting in a deeper potential, and also result in compression of any residual gas present in the two system. This event could therefore be followed by a vigorous reprise of star formation. The occurrence rate and the products of major mergers in UFDs have not been explored extensively. Simulations of more-massive classical dwarfs suggest that major mergers can occur and have the ability to reignite star formation (e.g., Benítez-Llambay et al. 2016). Furthermore, while dwarf–dwarf mergers are expected to be rare in the present Universe, their occurrence rate has been shown to increase at higher redshift (e.g., Deason et al. 2014), potentially being a viable channel for the reignition of star formation in And xiii.
Finally, we note that the unusual SFH of And xiii is compatible with the expected properties of tidal debris arising from major galaxy interactions. However, both the observations of suspected tidal dwarfs and simulations of these objects (e.g., Duc et al. 2014; Ploeckinger et al. 2015, 2018; Gray et al. 2023) suggest that tidal dwarfs manifest as high-metallicity, gas-rich systems. The low-metallicity, gas-poor nature of And xiii, therefore, appears to rule out a tidal origin.
Irrespective of the mechanism responsible for the late star formation ignition, it is interesting to compare And xiii's SFH with expectations from galaxy formation models. As mentioned already, instances of late-forming low-mass (105−6 M⊙) dwarf galaxies appear in different cosmological simulations (e.g., Macciò et al. 2017; Garrison-Kimmel et al. 2019; Applebaum et al. 2021; Benitez-Llambay & Fumagalli 2021). The properties of And xiii, therefore, are not necessarily in tension with ΛCDM predictions. Is it worth noting, however, that such galaxies are a relatively uncommon occurrence in those models, with most simulated objects characterized by predominantly ancient SFHs. The expected frequency of late star formation in low-mass dwarfs has not been characterized in detail and is likely to vary among different simulations. For instance, Benitez-Llambay & Fumagalli (2021) reported that ∼8% of their simulated dwarfs with 109.5 ≲ M200/M⊙ ≲ 1010 begin formation after z ∼ 3, while Wright et al. (2019) reported that ∼20% of their dwarfs, in a comparable mass interval, experience reignition at low redshift.
Likewise, the discovery of And xiii's late SFH, and of other more-massive dwarfs with similar behavior (e.g., And xvi), is not yet sufficient for a statistically robust estimate of the abundance of such objects. Nevertheless, as we discover more low-mass dwarfs in the Local Group and its vicinity, we will have a clearer picture of how common low-mass late-forming dwarfs are in the local Universe and how this compares to the abundance expected from galaxy formation models.
4.6. Future Prospects
The SFHs derived in this paper expand our observational picture of galaxy formation in low-mass halos, by studying the evolution of UFDs in a different satellite system and beginning to explore the "transition" regime between low-mass reionization fossils and more-massive classical dwarfs (e.g., Ricotti & Gnedin 2005). Further work, however, is required to address open questions, such as delineating the relationship between stellar and halo mass growth for UFDs in the early Universe, bracketing the critical mass range at which the UV background is not as effective as quenching faint galaxies, and identifying the drivers of star formation suppression in the UFDs that resume star formation after reionization.
We anticipate that important observational advancements will be enabled by the synergy of large-area deep surveys (e.g., those of the Vera C. Rubin Observatory and Nancy Grace Roman Space Telescope; Spergel et al. 2015; Ivezić et al. 2019), which will increase the census of known UFDs over a range of stellar masses (e.g., Mutlu-Pakdil et al. 2021), with high angular resolution follow-ups, through HST and JWST and Roman, which will allow for in-depth studies of these objects (i.e., SFHs and orbital histories).
It remains unclear how much of the SFH diversity revealed by Figures 5 and 7 is due to differences in stellar mass and how much is caused by the different environmental histories of M31 and MW satellites. A first development on this front will be the discovery and characterization of the faint (M* ≲ 105 M⊙) UFD population around M31. This will enable a direct comparison between MW and M31 UFD satellites of similar mass and unveil whether systematic differences exist in the SFHs of the two UFD systems.
Second, since our Treasury program has established the first-epoch imaging of the six UFDs of our paper, future observations will be able to obtain precise proper motions for these systems, as is already starting to be demonstrated by Warfield et al. (2023). In turn, this will enable the reconstruction of orbital histories and the estimation of infall times, as has been done for the MW satellites (e.g., Fritz et al. 2018; Gaia Collaboration et al. 2018; Kallivayalil et al. 2018; Fillingham et al. 2019; Patel et al. 2020; Battaglia et al. 2022). This will shed light on the role that M31's low-mass satellite accretion history had in shaping the evolution of its UFDs. Orbital histories will also enable the identification of UFDs associated with some of the most massive M31 satellites, as demonstrated for the MW and the Large Magellanic Cloud (e.g., Kallivayalil et al. 2018; Erkal & Belokurov 2020; Pardy et al. 2020; Patel et al. 2020). In this light, we note that And xxii, which has a strong indication of an extended SFH, has been tentatively proposed as a satellite of M33 (e.g., Martin et al. 2009; Tollerud et al. 2012; Chapman et al. 2013). Proper motions will allow us to confirm or refute this association, and assess whether it has experienced a significantly different environmental history compared to the remaining UFDs.
Third, future surveys will discover UFDs with 105 M⊙ ≲ M* ≲ 106 M⊙ in isolated environments outside the Local Group (e.g., Mutlu-Pakdil et al. 2021; Sand et al. 2022; Qu et al. 2023). The SFHs of these systems will prove critical to establish whether the star formation timescales and quenching (or lack thereof) in these systems are fundamentally different from those of the satellite systems of massive hosts. This will help us disentangle the role of environmental effects from other more universal drivers of star formation suppression, especially in regard to their post-reionization evolution.
Finally, the discovery of a peculiar UFD such as And xiii, and differences between M31 UFDs and the most massive MW UFDs, suggest that a surprising diversity of SFHs might be present in UFDs in this "transition" mass range ( ). A better depiction of how galaxy formation proceeds in this mass range will require a larger sample of massive UFDs. Thanks to future large-area surveys, we expect that such objects will probably be discovered in the outer halo of M31, in the periphery of the Local Group and in its immediate vicinity.
5. Conclusions
Using deep HST imaging that reaches the oMSTO, we derived lifetime SFHs for a sample of six UFD galaxies associated with the satellite system of M31. These are the first oMSTO-based SFHs for UFD galaxies outside of the MW halo. The main takeaways of our analysis are as follows:
- (i)Five of the UFDs in our sample formed at least 50% of their stellar mass by z = 5 (12.6 Gyr ago), after which star formation activity drastically reduced in intensity. This is similar to other known UFDs and is compatible with the predicted effect of cosmic reionization. However, we find that star formation is not entirely quenched in our galaxies, and 10%–40% of their stellar mass formed at later times.
- (ii)One UFD in our sample (And xiii) has a remarkable SFH, having formed only ∼10% of its stellar mass by z = 5 and having experienced a delayed period of strong star formation at 2 < z < 3. This UFD is the first of its kind and suggests that star formation reignition, previously observed in other more-massive galaxies, can also occur at lower stellar masses.
- (iii)Combining SFHs for MW and M31 UFDs, we conclude that the effect of reionization is not homogeneous among UFDs, with more-massive galaxies being able to sustain low levels of prolonged star formation compared to low-mass UFDs, which are quenched more rapidly. However, due to selection biases, the environmental dependence of this trend cannot be ruled out.
- (iv)Future observational efforts, including large-area surveys, and dedicated follow-ups with HST and JWST, will provide an extended observational baseline to address some of the remaining open questions in UFD evolution. These include a better understanding of the role of cosmic environment, establishing the degree of SFH diversity in galaxies at the massive end of the UFD spectrum, and bracketing the stellar/halo mass range where the transition between ancient reionization fossils and classical dwarf galaxies occurs.
Acknowledgments
The authors thank the anonymous referee for providing a constructive report. A.S. thanks E. Sacchi for graciously sharing the star formation histories of seven Milky Way satellites. Support for this work was provided by NASA through grants GO-13768, GO-15476, GO-15902, AR-16159, and GO-16273 from the Space Telescope Science Institute, which is operated by AURA, Inc., under NASA contract NAS5-26555. A.W. acknowledges support from: NSF via CAREER award AST-2045928 and grant AST-2107772; NASA ATP grant 80NSSC20K0513; HST grants AR-15809, GO-15902, GO-16273 from STScI. M.C.C. acknowledges support though NSF grant AST-1815475. M.B.K. acknowledges support from NSF CAREER award AST-1752913, NSF grants AST-1910346 and AST-2108962, NASA grant NNX17AG29G, and HST-AR-15006, HST-AR-15809, HST-GO-15658, HST-GO-15901, HST-GO-15902, HST-AR-16159, and HST-GO-16226 from STScI. E.N.K. acknowledges support from NSF CAREER grant AST-2233781. This research has made use of NASA's Astrophysics Data System Bibliographic Services.
Facility: HST - Hubble Space Telescope satellite (ACS). All of the data presented in this paper were obtained from the Mikulski Archive for Space Telescopes (MAST) at the Space Telescope Science Institute. The specific observations analyzed can be accessed via doi:10.17909/ftep-8k64.
Software: This research made use of routines and modules from the following software packages: Astropy (Astropy Collaboration et al. 2013), DOLPHOT (Dolphin 2016), IPython (Perez & Granger 2007), MATCH (Dolphin 2002), Matplotlib (Hunter 2007), NumPy (van der Walt et al. 2011), Pandas (McKinney 2010), and SciPy (Virtanen et al. 2020).
Appendix A: Instantaneous Star Formation Rates
Here we provide the instantaneous star formation rates, also referred to as differential SFHs, derived from our fiducial solutions. These are illustrated in Figure 8, alongside the corresponding cumulative SFHs. Differential SFHs offer an intuitive way to visualize the star formation activity of the galaxy at any point in time. However, it is important to exercise caution when interpreting the uncertainties associated with these measurements. The uncertainties in the histograms, in fact, come from the variance of the star formation rate within each time bin. On the other hand, due to the details of the CMD-fitting method (see, e.g., Dolphin 2002), significant covariance exists among adjacent star formation bins. This constrains the range of plausible solutions that accurately fit the CMD.

Figure 8. Same as Figure 3, but including both cumulative (top) and differential star formation histories.
Download figure:
Standard image High-resolution imageFor instance, in Figure 8, most of the late star formation bins have error bars compatible with zero star formation (see, e.g., And xx). However, the star formation rate cannot be zero simultaneously in all bins, as that would significantly impact the star counts within the CMD. To address this limitation, cumulative SFHs are conventionally preferred, because they are constructed to incorporate the covariance between star formation rates. In the case of And xx, the statistical uncertainties on the cumulative SFH (yellow shading), unequivocally reject a complete absence of star formation after the oldest time bin.
Appendix B: The Effect of Stellar Population Models
One of the primary sources of systematic uncertainties in the CMD modeling of external galaxies lies in the choice of stellar evolution models (e.g., Gallart et al. 2005). In the main text, we have estimated the magnitude of these effects by using the methodology of Dolphin (2012), which generates a large set of mock stellar models by applying systematic shifts in luminosity and effective temperature to the adopted stellar evolutionary tracks. Here, we provide a different estimation of the stellar evolution systematics, by rerunning our analysis with a range of different stellar evolution models. In addition to our fiducial stellar model grid (BaSTI; Hidalgo et al. 2018), we have modeled the CMDs of our targets using the PARSEC (Bressan et al. 2012; Chen et al. 2014), MIST (Choi et al. 2016; Dotter 2016), and Victoria–Regina (VandenBerg et al. 2014) stellar models. Furthermore, while our fiducial analysis has been done using a scaled-solar abundance mixture, here we assess the effect of the assumed α-enhancement by including the [α/Fe] = 0.4 models of the BaSTI (Pietrinferni et al. 2021) and Victoria–Regina grids.
The resulting SFHs are shown in Figure 9. First, we note that the adopted α-enhancement has little effect on the shape of the SFH. The scaled-solar and α-enhanced solutions are virtually indistinguishable in most cases. In this regard, the major difference that the α-enhancement makes is to introduce a zero-point shift in the [Fe/H] scale of our solutions. This is a well-known effect from stellar evolution theory (e.g., Salaris et al. 1993). Second, the range spanned by the different SFH solutions is well-captured by the systematic confidence interval from the Dolphin (2012). The latter uncertainty interval tends to be slightly larger compared with the test presented here. But, as discussed in Dolphin (2012), the systematics are designed to be conservative given that there are only a limited set of stellar libraries available for use; they are unlikely to include the full range of reasonable stellar evolution uncertainties. Finally, the qualitative conclusions drawn from our SFHs are broadly unaffected by the choice of stellar models. With the exception of And xiii, all of our galaxies have a predominantly ancient population, regardless of stellar model choice. However, all stellar libraries suggests that these galaxies experienced significant star formation (10%–40% of total stellar mass) after reionization, with the only exception of And xi, which appears purely ancient.

Figure 9. Alternative SFH solutions for our sample, obtained with the PARSEC (blue), MIST (green), and Victoria–Regina (magenta) stellar libraries, along with our fiducial solution that uses BaSTI (black). Solid lines indicate scaled-solar models while dashed lines indicate α-enhanced models. The shaded gray region outlines the systematic uncertainties estimated through the method of Dolphin (2012). The red shaded region marks the epoch or reionization. In most cases, these are only modest differences in the SFHs as a function of stellar model, confirming the robustness of our results.
Download figure:
Standard image High-resolution imageFor And xiii, three out of the four stellar libraries used here confirm that the galaxy had little to no star formation at ancient times. The BaSTI and PARSEC models date the start of significant star formation at around z ≃ 3, while the Victoria–Regina models put it around z ≃ 4. Only the MIST stellar library allows for the presence of ancient stars in this galaxy and, even then, at least 30% of the stellar mass must have formed at a later time. It must be noted that, while the MIST library estimates an older age for And xiii, compared to the other models, the same happens for the other five UFDs. For these galaxies, in the absence of our cosmological limit of 14 Gyr on the grid edge, the best-fit SFH from MIST would peak at ages much older than the age of the Universe. This means that, even with the MIST models, And xiii remains a younger galaxy compared to the rest of the UFD sample.
The values of τ50, τ80, and τ90 measured from the different solutions of Figure 9 are listed in Table 2. The measured values of τ50 are in very good agreement, with an average standard deviation of ∼200 Myr across the different stellar evolution libraries. The values of τ80 and τ90 have higher standard deviations of ∼700 Myr and ∼1.6 Gyr, respectively. These characteristic spreads among the models are comparable to the uncertainties listed in Table 1. Overall, the result of these tests is that, while the choice of stellar models can affect the details of the measured SFHs by a modest degree, the key SFH features identified in the paper are robust, regardless of stellar library adopted.
Table 2. Values of τ50, τ80, and τ90 Obtained, for the Six Galaxies of Our Sample, by Using Different Stellar Evolution Libraries
| Library | And xi | And xii | And xiii | And xx | And xxii | And xxvi |
|---|---|---|---|---|---|---|
| τ50 | ||||||
| Gyr | Gyr | Gyr | Gyr | Gyr | Gyr | |
| Basti SS | 13.2 | 13.2 | 10.6 | 13.1 | 13.0 | 13.1 |
| Basti AE | 13.3 | 13.2 | 10.6 | 13.2 | 13.1 | 13.1 |
| PARSEC | 13.3 | 13.0 | 10.3 | 13.0 | 12.9 | 13.0 |
| MIST | 13.3 | 13.3 | 13.0 | 13.1 | 13.1 | 13.0 |
| Victoria SS | 13.3 | 13.0 | 10.9 | 13.0 | 13.2 | 13.2 |
| Victoria AE | 13.3 | 13.0 | 11.1 | 13.0 | 13.2 | 13.2 |
| τ80 | ||||||
| Gyr | Gyr | Gyr | Gyr | Gyr | Gyr | |
| Basti SS | 12.7 | 12.6 | 10.1 | 12.3 | 10.6 | 12.0 |
| Basti AE | 12.8 | 12.7 | 10.2 | 12.7 | 10.9 | 11.1 |
| PARSEC | 12.8 | 10.5 | 9.4 | 10.5 | 10.2 | 10.6 |
| MIST | 12.8 | 12.8 | 9.5 | 12.6 | 10.8 | 9.5 |
| Victoria SS | 12.8 | 11.8 | 10.1 | 10.6 | 12.7 | 12.7 |
| Victoria AE | 12.8 | 11.7 | 10.2 | 10.6 | 12.7 | 12.7 |
| τ90 | ||||||
| Gyr | Gyr | Gyr | Gyr | Gyr | Gyr | |
| Basti SS | 9.8 | 6.8 | 5.9 | 9.1 | 8.1 | 5.7 |
| Basti AE | 12.6 | 6.8 | 10.0 | 8.5 | 10.1 | 5.4 |
| PARSEC | 12.6 | 10.0 | 8.9 | 10.0 | 9.2 | 6.0 |
| MIST | 12.7 | 12.6 | 9.1 | 10.5 | 9.5 | 9.1 |
| Victoria SS | 12.6 | 5.5 | 5.4 | 10.1 | 5.4 | 5.5 |
| Victoria AE | 12.6 | 5.5 | 5.4 | 10.1 | 5.4 | 5.5 |
Download table as: ASCIITypeset image
As noted in Section 3, we have also tested the effect of adopting different binary fractions, by rerunning our fits with a binary fraction of 0.5 and 0.7. These solutions are illustrated in Figure 10, along with our fiducial SFHs, which use a binary fraction of 0.35. The result of this test is that the choice of binary fraction has an almost negligible effect on the recovered star formation history, with only And xxii showing a modest difference in the amount of star formation in the oldest bin.

Figure 10. Alternative SFH solutions for our sample, obtained with an unresolved binary fraction of 0.5 (blue) and 0.7 (green), along with our fiducial solution that uses a binary fraction of 0.35 (black). The shaded gray region outlines the systematic uncertainties estimated through the method of Dolphin (2012). The red shaded region marks the epoch or reionization. The choice of binary fraction has a negligible effect on our solutions.
Download figure:
Standard image High-resolution imageAn additional test on the stellar population models regards the prior on the age–metallicity relation (AMR). Our fiducial SFHs are based on the assumption that the AMR monotonically increases with time. This is a common practice (e.g., Weisz et al. 2011, 2014a; McQuinn et al. 2015) that results in physically reasonable solutions even at low S/N on the oMSTO. However, given the results of this paper, especially on And xiii, a monotonically increasing AMR might not necessarily be an appropriate assumption. For instance, the late star formation we measure in some of our targets could have been triggered by the accretion of low-metallicity gas. We have therefore calculated a set of alternative SFH solutions, in which the AMR is left free to assume any form.
The results of this test are shown in Figure 11. Removing the constraints on the AMR has, for the most part, a modest effect. Most notably, And xiii remains a purely "young" galaxy, while And xi maintains its predominantly ancient SFH. The effect on the other targets is more pronounced, especially in And xii. However, changing our assumptions on the AMR does not impact the main conclusion of the paper, i.e., the presence of post-reionization star formation in some UFDs of our sample. On the contrary, the alternative SFHs of Figure 11 have a higher amount of late star formation, compared to our fiducial solutions. However, we advise strong caution in interpreting these results. By removing the requirement of a monotonic AMR, we have dramatically increased the degrees of freedom in our solutions, which can result in an unphysical metallicity evolution. In the case of Figure 11, the new solutions have strongly fluctuating AMRs, with values of [M/H] approaching solar values and varying by more than 1 dex between adjacent time bins. Nevertheless, a safe conclusion from this experiment is that our assumptions on the AMR do not impact the presence of late star formation in our sample, especially with respect to the case of And xiii.
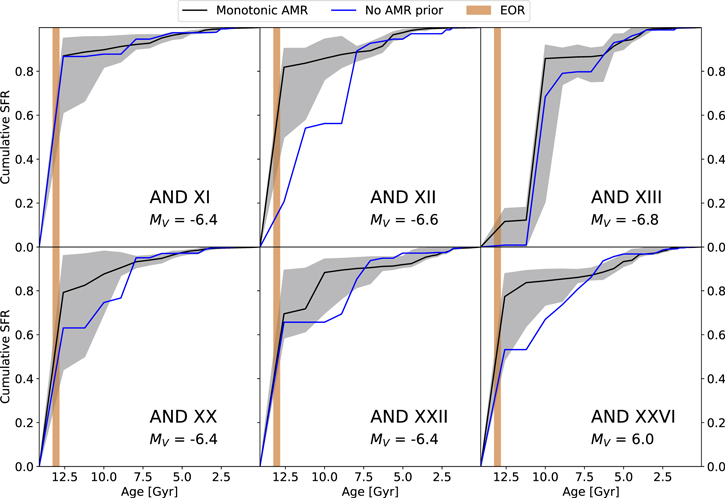
Figure 11. Alternative SFH solutions for our sample, obtained by removing our constraint on the AMR shape (blue), along with our fiducial solution that assumes a monotonically increasing AMR (black). The shaded gray region outlines the systematic uncertainties estimated through the method of Dolphin (2012). The red shaded region marks the epoch or reionization. Changing our assumptions on the shape of the AMR does not remove the presence of late star formation in our targets.
Download figure:
Standard image High-resolution imageAppendix C: The Effect of Distance and Reddening Uncertainties
Two assumptions made in SFH measurements are the distance of the observed galaxy and the amount of foreground dust extinction. These will affect the magnitude and color of the observed stars and, potentially the SFH inferred by CMD fitting. To assess the effect of these parameters on our SFH measurements, we have repeated the analysis varying the assumed distance and reddening values, in accordance with the reported uncertainties in the literature. We have adopted distance uncertainties from Savino et al. (2022). For the six dwarf galaxies of our sample, these are of the order of 0.07–0.08 mag. Reddening uncertainties were taken from the dust maps of Green et al. (2019) and amount to 0.03 mag in E(B − V). We have then calculated a set of alternative SFHs, in a 3 × 3 grid, by applying [−1σ, 0, +1σ] shifts in distance and [−1σ, 0, +1σ] shifts in reddening to our CMD models (the central point of this grid is the trivial case where no shifts are applied and corresponds to our fiducial SFH solution.).
The results of these tests are illustrated in Figure 12 as blue lines and compared with the fiducial SFH used in the paper (black). The effect of distance and reddening uncertainties is comparable in size with other sources of systematic uncertainties included in our error budget (gray region in Figure 12). They modestly change the details of the SFHs but overall preserve the results presented in the paper. Most of the solutions for And xi, And xii, And xx, And xxii, and And xxvi have a main burst of star formation at the oldest ages, followed by more recent star formation accounting for 10%–40% of the total stellar mass. Conversely, And xiii maintains a significantly delayed star formation compared to the other dwarfs.
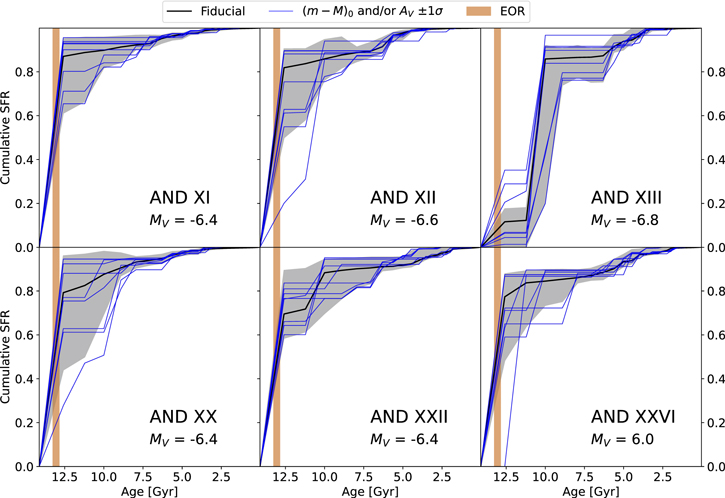
Figure 12. Cumulative SFHs for our sample of UFD obtained by systematically varying distance and foreground extinction by ±1σ (blue lines). The black line shows the fiducial solution obtained in Section 3. The shaded gray region outlines the systematic uncertainties estimated through the method of Dolphin (2012). The red shaded region marks the epoch of reionization.
Download figure:
Standard image High-resolution imageWe note from Figure 12 that certain combinations of distance and reddening can result in substantial changes in the inferred SFH. For the cases of And xii, And xx, and And xxvi this manifests as a significantly younger solution compared to the other setups. These solutions correspond to the extreme points of our parameter space, where both distance and reddening are shifted by 1σ. Under the assumption of Gaussian uncertainties, the chance of this happening for a single galaxy is ∼10% and much lower for the entire set of galaxies.
Appendix D: The Effect of Photometric Depth
A clear difference between our observations of M31 satellites and the data used to derive the SFH of MW UFDs is the photometric depth. Due to the distance of M31, our CMDs are shallower and of lower S/N at the MSTO than the exquisite CMDs that have been obtained within the halo of the MW. To test how this difference may affect SFH recovery, we have taken two well-studied nearby stellar systems and created mock observations as if they were at the distance of M31.
The results of this test are shown in Figure 13. We begin with deep HST observations of the globular cluster M92 (GO-9453, PI: Brown; GO-10775, PI: Sarajedini) and of the UFD Eridanus II (GO-14234, PI: Simon). These data have S/N values at the oMSTO of ∼600 (M92) and ∼40 (Eridanus II), which are both much larger than those of our M31 photometry (S/N ∼ 10). For this test, we first derived the CMD-based SFHs using the original photometry of M92 and Eridanus II. This is done using the same methodology outlined in the paper. We assume (m − M)0 = 14.59 and E(B − V) = 0.02 for M92 (Harris 2010), and (m − M)0 = 22.84 and E(B − V) = 0.01 for Eridanus II (Martínez-Vázquez et al. 2021). The resulting SFHs are the red lines in the right panel of Figure 13 and will be assumed as our ground truth. We also use the well-known properties of M92 to further validate our overall methodology. The SFH we recover for M92 essentially corresponds to a simple stellar population with age and metallicity in excellent agreement with literature values (e.g., Dotter et al. 2007; Harris 2010; VandenBerg et al. 2013; the difference between our best-fit [Fe/H] of −2.0 and the measured abundance of −2.35 is completely due to our use of scaled-solar models to fit an α-enhanced population). The corresponding best-fit isochrone is also shown, in Figure 13, on the M92 CMD to illustrate the fidelity of the BaSTI stellar models in the F606W/F814W photometric bands.

Figure 13. Left panel: original CMDs of M92 and Eridanus II (left subpanels), obtained from deep HST photometry, and noisier mocks (right subpanels) obtained by simulating the distance, reddening, completeness, and photometric uncertainties of our target galaxies. The red dashed line shows the approximate location of the oMSTO in the different CMDs. A BaSTI isochrone, of the best-fit age and metallicity values, is superimposed on M92 (orange line) to illustrate the fidelity of our stellar models and the accuracy of the fit. Right panel: comparison the between the SFHs obtained from the deep photometry (red lines) and those obtained from the noisy photometry (black lines). The shaded regions represent the random uncertainties of our solutions.
Download figure:
Standard image High-resolution imageWe then shifted the photometry of these two targets to simulate the same distance and reddening of one of our galaxies (And xiii), i.e., (m − M)0 = 24.45 and E(B − V) = 0.14. We then perturbed the measurements using the photometric uncertainties and the completeness estimated from the artificial star tests of And xiii. The resulting CMDs (left panel of Figure 13) simulate how the M92 and Eridanus II CMDs would appear if they were satellites of M31 observed by our Treasury program. We repeat the CMD modeling for these noisy CMDs and find that, other than the larger uncertainties, the resulting SFHs (black lines in the right panel of Figure 13) are virtually indistinguishable from the ones obtained from the deep CMDs. The main difference is the increase in uncertainty, most notably for Eridanus II, owing to the lower S/N at the MSTO. This test therefore rules out any appreciable systematic in the SFHs caused by the limited S/N of our data at the MSTO.
Appendix E: The Effect of CMD-fitting Code
We checked the potential impact of the choice of CMD-fitting software on our derived SFHs by comparing our solutions to those obtained with an independent methodology. We use the method described in Cole et al. (2007, 2014) to re-derive the SFHs of And xi and And xiii, which have the oldest and youngest stellar populations in our sample, respectively. We use identical photometric samples, stellar libraries, distance, and reddening as used in the main analysis to isolate the effect of the fitting methodology on the results. We summarize the setup of the "Cole" method below.
The BaSTI isochrones at each metallicity from Z = 0.0001–0.001 are binned into uniformly logarithmically spaced age groups from 9.70  10.13 before being weighted by the initial mass function. Stars in each age bin are allowed to have any metallicity in the library, but the oldest bins (
 ) are prevented from having Z > 0.0006. Each age bin is initially taken to be 0.10 dex wide, but may grow or shrink during the fitting depending on the noise level in the fit. We take the initial mass function from Chabrier (2003), which is log-normal within 0.08 ≤ M/M☉ ≤ 0.8. Only 35% of the stars are assumed to be true singles and the rest are binaries; distinguishing between wide and close binaries, three-quarters of the binaries have the secondary mass drawn from the Chabrier initial mass function with the remainder drawn from a flat (uniform) initial mass function. The weighted isochrones are shifted by the adopted distance and reddening, convolved with the color and magnitude shifts from the artificial star tests, and weighted by the incompleteness fraction. The CMD is divided into bins that are 0.05 by 0.10 mag in size, and the SFH and AMR are derived by maximizing the Poisson likelihood for star counts in each bin that contains at least one star (excluding the same region of the HB and red clump that was excluded in the MATCH fits).
Figure 14 shows the results of the CMD fit, compared to the fiducial solutions, for And xi and And xiii. The Cole solution for And xi confirms that the majority of stars in this galaxy are compatible with the oldest ages allowed by the model grid. The differences between the Cole and MATCH solutions are entirely attributable to the different extension of the grid to old ages. The star formation in And xiii is distributed on a slightly longer episode in the Cole solution, compared to the narrower burst obtained with MATCH. Overall, the difference between the two And xiii solutions is mostly contained within the systematic uncertainty envelope (shaded gray region) and confirms the broad consistency with MATCH in previous studies of isolated dwarf galaxies (e.g., Monelli et al. 2010b, 2010a; Skillman et al. 2014). In spite of these subtle differences, the comparison between And xi and And xiii is unchanged. The Cole SFH of And xi reveals a primarily ancient stellar population, while And xiii shows prominent star formation well beyond reionization, with only ∼15% of the total star formation happening at t < 12.3 Gyr (z < 4). This test supports the robustness of our results against the choice of CMD-fitting methodology.

Figure 14. Comparison between our fiducial SFH solution (black) and that obtained using the Cole methodology (blue), for And xi (top panel) and And xiii (bottom panel). The shaded gray region outlines the systematic uncertainties estimated through the method of Dolphin (2012). The red shaded region marks the epoch of reionization.
Download figure:
Standard image High-resolution image
Footnotes
- 32
We highlight that this argument relies on the idea that the stellar mass in these galaxies roughly traces the depth of the gravitational potential. Given the expected scatter in the M* − Mhalo relation at these low halo masses (e.g., Garrison-Kimmel et al. 2017), this assumption is far from perfect. Halo masses, however, are notoriously difficult to determine in UFDs (e.g., Simon 2019, and references therein). With only a handful of spectroscopic members being available in our M31 UFDs, dynamical masses within the half-light radius are only known within a factor of a few (Collins et al. 2013). Extrapolations of these measurements to obtain a total halo mass are even more uncertain, as the stars only trace the inner ∼200 pc of the dark matter density profile.