


Abstract
We present the results of a density-based clustering analysis of the 6D XYZ Galactic positions and UVW-space velocities of nearby (≤200 pc) Gaia Early Data Release 3 stars with radial velocities using HDBSCAN, in opposition to previous studies (Kounkel & Covey 2019; Meingast et al. 2021) that only included positions and tangential velocities. Among the 241 recovered clusters, we identify more than 50 known associations, 32 new candidate stellar streams aged 100 Myr to 3 Gyr, nine extensions of known Theia groups uncovered by Kounkel & Covey, and eight newly recognized coronae around nearby open clusters. Three confirmed exoplanet-hosting stars and three more TESS transiting exoplanet candidates are part of the new groups discovered here, including TOI–1807 and TOI–2076 from Hedges et al. (2021) that were suspected to belong to a yet unidentified moving group. The new groups presented here were not previously recognized because of their older ages, low spatial density, and projection effects that spread out the tangential velocities of their nearby comoving members. Several newly identified structures reach distances within 60 pc of the Sun, providing new grounds for the identification of isolated planetary-mass objects. The nearest member of the newly recognized corona of Volans–Carina is V419 Hya, a known young debris disk star at a distance of 22 pc. This study outlines the importance of further characterization of young associations in the immediate solar neighborhood, which will provide new laboratories for the precise age calibration of nearby stars, exoplanets, and substellar objects.
Export citation and abstract BibTeX RIS

Original content from this work may be used under the terms of the Creative Commons Attribution 4.0 licence. Any further distribution of this work must maintain attribution to the author(s) and the title of the work, journal citation and DOI.
1. Introduction
Stars tend to be formed within a clustered environment caused by the collapse of a molecular cloud, dense and extremely cold structures primarily made of hydrogen gas and dust. As a consequence, young stars are rarely found in an isolated environment, but rather in groups or stellar associations that dissipate over time (Lada & Lada 2003). The study of such young stellar associations provides unique laboratories where the ages of stars are precisely constrained, to an extent that can rarely be achieved with an isolated star. These young associations can generally be recognized from their coherent Galactic space velocities for several hundreds of millions of years and up to billions of years for denser open clusters (e.g., see Boutloukos & Lamers 2003). Over time, they become gradually tidally disrupted, which can cause elongated structures to detach from the core (Meingast & Alves 2019), up to the point where they cannot be distinguished from unrelated field stars. This process usually happens over a timescale of ≈100 Myr or more (Dinnbier & Kroupa 2020), but recent discoveries of diffuse structures around younger associations (e.g., Jerabkova et al. 2019; Gagné et al. 2021; Liu et al. 2021) indicate that star formation events may happen over regions spatially larger than previously thought, or that interactions or collisions between dense clusters may be common.
The Gaia Early Data Release 3 (Gaia EDR3; Fabricius et al. 2021; Gaia Collaboration et al. 2021) data products include measurements of sky positions, parallaxes, and proper motions for 1.468 billion stars, obtained by the Gaia mission (Gaia Collaboration et al. 2016) with an unprecedented accuracy that reaches 0.02–0.03 mas for the parallax component of bright (G < 15) stars (Gaia Collaboration et al. 2021). 4 A radial velocity spectrometer is also located on board of the spacecraft to complete the 3D radial velocities of the brightest stars (Cropper et al. 2018; Sartoretti et al. 2018; Soubiran et al. 2018). There are no new radial velocity measurements in the Gaia EDR3 data release; however, it includes those from Gaia DR2 (Gaia Collaboration et al. 2018) that were constrained to the ≈7.1 million brighter stars (4 < GRVS < 13) with approximate spectral types in the range F2–M2 (3550 < Teff < 6900), and reached typical radial velocity precisions of 1–3 km s−1 in the case of radial velocity-stable stars. Gaia DR2 radial velocities are based on a median of ≈2–20 distinct visits (Katz et al. 2019), which favors measuring the stable heliocentric radial velocity component associated with the UVW velocity of a star over the components due to binary orbits or other sources of variation. There are approximately 6.6 million sources in Gaia DR2 that benefit from a radial velocity measurement with a precision of 5 km s−1 or better.
These data make it possible to calculate the UVW-space velocities of bright stars in the solar neighborhood with a precision of 0.1–0.5 km s−1, comparable to or smaller than the intrinsic velocity dispersions in open clusters and loose stellar associations (e.g., Zuckerman & Song 2004). This provides an unprecedented opportunity to discover and probe the structural features and dynamical evolution of stellar associations, and open clusters and their more recently discovered "coronae" (Meingast & Alves 2019; Röser & Schilbach 2019; Tang et al. 2019; Meingast et al. 2021)—a term recently introduced to designate loose ensembles of stars that appear to be coeval and comoving with denser cores of open clusters. Such coronae probably correspond to tidal disruption tails (Meingast et al.2021).
Recent studies demonstrated that the Hierarchical Density-Based Spatial Clustering of Applications with Noise (HDBSCAN) is efficient at recovering known and new stellar associations (e.g., see Kounkel & Covey 2019; Kerr et al. 2021; Meingast et al. 2021). HDBSCAN has robust to non-typical cluster shapes or uneven cluster densities, and provides a computationally efficient method for detecting overdensities in N-dimensional space (Campello et al. 2013; McInnes & Healy 2017). However, the lack of heliocentric radial velocities for most Gaia stars encouraged past studies (e.g., Kounkel & Covey 2019; Meingast et al. 2021) to perform HDBSCAN clustering in 5D space (XYZ Galactic positions and 2D tangential velocities). As a consequence of the projection effects where nearby stars can show large variations in their tangential velocities even while having similar UVW-space velocities, such previous studies have not recovered most of the nearest known stellar associations, within ≈100 pc of the Sun.
Young associations of stars that are located close to the Sun are especially interesting for the detailed characterization of young exoplanets and substellar objects, because their proximity allows us to achieve much higher signal-to-noise ratios even on the lowest-mass members. In an effort to complete the census of such nearby young associations, we present a clustering analysis of nearby stars based on their full 6D XYZ Galactic positions and UVW-space velocities calculated from Gaia EDR3, and demonstrate that we can recover a significant number of known and new structures despite the restriction to stars with radial velocities reported in Gaia DR2. This study allowed us to uncover spatial extensions to several Theia groups from Kounkel & Covey (2019) toward the Sun, eight previously unrecognized coronae around nearby open clusters, and 32 new co-moving associations with small dispersions in Z and UVW and color–magnitude diagrams consistent with ages above ≈100 Myr.
In Section 2, we discuss the selection of our input sample that consists of nearby Gaia EDR3 entries with good-quality kinematics, and provide a brief description of the HDBSCAN algorithm and how we apply it to uncover 241 clusters. We discuss these clusters in Section 3 by comparing them with known associations in the literature, and identifying the clusters most likely to correspond to new coeval associations. We also discuss known exoplanets that are members of these newly discovered clusters, and we summarize our work in Section 4.
2. METHOD
2.1. Sample
We used a subset of all Gaia EDR3 entries within approximately 200 pc of the Sun with good-quality 6D kinematics to identify nearby streams of stars. To achieve this, we selected stars with a Gaia EDR3 parallax above 5 mas with Renormalised Unit Weight Errors unit weight errors (RUWE 5 ) > 3 to exclude astrometric solutions strongly affected by unresolved companions or other systematic problems such as cross-matching errors. We have found that combining such an RUWE < 3 criterion with additional quality criteria on parallax and proper motions was necessary to avoid an imprint of the distant Galactic plane into high-parallax (i.e., nearby) Gaia EDR3 samples, because the crowded Galactic plane is prone to cross-matching errors that can mimic large parallax values. However, we have found that additional proper motion or parallax quality cuts were not necessary when working with the sample of Gaia EDR3 stars with radial velocity measurements, because a simple RUWE < 3 quality cut applied on stars with parallaxes 5 mas or above resulted in high-quality parallax values with signal-to-noise values above 15, and similarly high-quality proper motion measurements with signal-to-noise values above 6. We note that the RUWE selection cut will bias our search against binary stars (most of which have RUWE > 1.4; e.g., see Stassun & Torres 2021), but will also greatly reduce sample contamination due to low-quality parallax or proper motion measurements.
We have calculated the individual XYZ Galactic positions and UVW-space velocities of our sample with a Monte Carlo simulation. This XYZUVW frame of reference is centered on the solar position and motion, where the positive X/U axes point toward the Galactic center, and the Y/V axes are in the direction of the rotational motion of the Galaxy, such that XYZ and UVW form right-handed coordinate systems. For each star in our sample, we have taken 100 artificial measurements of proper motion, radial velocities, and parallaxes centered on the Gaia EDR3 values with standard deviations equal to their respective measurement errors. We have then transformed each of these artificial measurements on the XYZUVW frame of reference, and taken the median value along each direction as the most likely XYZUVW values for each individual star. We have also calculated approximate measurement errors by taking the standard deviations of the resulting distributions along each dimension, and further rejected any star with resulting errors above 3 pc or 3 km s−1 in the individual XYZUVW dimensions. We elected to apply these rigid selection cuts to reduce systematic and measurement errors because the HDBSCAN algorithm, described in Section 2.2, does not account for measurement errors by construction.
We note that the Monte Carlo simulation used here would be equivalent to using the flat-prior distance estimations of Bailer-Jones et al. (2021) in the specific step where parallaxes are transformed to distances, but our method also similarly deals with nonlinear effects in the transformation of measurement densities from radial velocities and proper motions to the XYZUVW-space. While non-flat Bayesian priors may be useful to calculate the distance probability density for more distant stars, our sample is constituted of stars within 200 pc of the Sun with parallaxes at a high signal-to-noise ratio (above 15), meaning that the effects of a non-flat Bayesian prior would be negligible, especially after having rejected stars with a projected measurement density above 3 pc or 3 km s−1 in XYZUVW-space.
We have selected a volume of 200 pc around the Sun for this search because previous surveys have not efficiently recovered loose associations within 100 pc in a systematic way (see Section 3.6 for more details), and the 100–200 pc region will be useful to identify extensions of known large-scale structures such as those recovered by Kounkel & Covey (2019) based on their spatial overlap. We also note that considering a larger volume would require significant computer memory depending on the chosen clustering algorithm, with little benefits compared to previous clustering surveys.
The general properties of our input sample are displayed in Figure 1. The Galactic XYZ-positions of our sample stars have typical measurement errors of 0.1–0.5 pc, and the UVW-space velocities have typical measurement errors of 0.1–1.0 km s−1, with no significant differences in the distribution of measurement errors along the three spatial or kinematic axes. These typical measurement errors are in the range of typical velocity dispersions in star-forming regions and moving groups. Based on these combined selection criteria (parallax above 5 mas, RUWE < 3, XYZ and UVW errors below 3 pc or 3 km s−1), we obtained an input sample of 303,540 Gaia EDR3 entries.

Figure 1. Properties of the input sample considered here, constructed from Gaia EDR3 entries with full kinematics. The input sample is identified with red dots in the upper-left color–magnitude diagram figure, and with black dots in all other panels. Our sample is heavily affected by the selection criteria for radial velocity measurements in Gaia DR2 (4 < GRVS < 13, 3550 < Teff < 6900, corresponding to spectral types F2–M2) because Gaia EDR3 does not include additional radial velocity measurements. The distribution of colors versus distance reflects a combination of these selection cuts with the initial mass function that peaks at early M spectral types. The overdensities that are visible by eye in the XY and UV distributions were identified.
Download figure:
Standard image High-resolution image2.2. HDBSCAN Clustering
We used the Python scipy implementation of the accelerated version of HDBSCAN (McInnes & Healy 2017), which can take as an input a set of N-dimensional coordinates (with coherent spatial units) for M objects, and offers several metrics to compute the mutual distances between individual objects (Euclidean distances are used by default). However, HDBSCAN can also take as an input an N × M matrix of pairwise distances that were precomputed with any custom metric not offered in the library. Although it would be possible to precompute distances in XYZUVW-space that marginalize over the unknown heliocentric radial velocities of most Gaia EDR3 entries, we found that such an approach required an unmanageable amount of computer memory even with much more restricted sample volumes. The distance metrics offered in the HDBSCAN library all respect the triangle inequality, allowing HDBSCAN to avoid computing most of the pairwise distances between all M objects, and the resulting computational requirements scale approximately with  instead of
  . However, distance metrics that rely on marginalized heliocentric radial velocities do not respect the triangle inequality—because the best-matching radial velocity between a given pair of stars AB may be different from the best-matching radial velocity when testing a different pair of stars AC. As a consequence, they cannot be implemented with an
  scaling and require a precomputation of a large matrix of pairwise distances.
We have therefore elected to use HDBSCAN with the default Euclidean distance metric; however, we have taken an approach similar to Kerr et al. (2021) where the mutual distances in kinematic dimensions are given more importance than those in spatial dimensions because we expect coeval groups of stars to have formed with a narrow UVW distribution (typically 1–3 km s−1; Zuckerman & Song 2004), but with much larger spatial extents over time—up to ≈ 15 pc in Z, and hundreds of parsecs in XY, in some cases (e.g., see Kounkel & Covey 2019; Meingast et al. 2019 and Meingast et al. 2021). Furthermore, the XYZ spatial positions have a different physical dimension than UVW velocities, and therefore it becomes important to consider a transformation factor that bears physical units for consistency. We have thus constructed a 6 × M array of ![$\left[X,Y,Z,c\cdot U,c\cdot V,c\cdot W\right]$](https://content.cld.iop.org/journals/0004-637X/939/2/94/revision1/apjac8c25ieqn4.gif) coordinates where c = 12 pc km−1 s−1. This value is larger than the c = 6 pc km−1 s−1 used by Kerr et al. (2021) because we aim to consider potentially older groups similar to Kounkel & Covey (2019), whereas Kerr et al. (2021) specifically investigated a sample of < 50 Myr-old stars. In fact, the ≈200 young associations, open clusters, and tidal tails within 500 pc of the Sun with ages ≲1 Gyr (Gagné et al. 2018c; Tarricq et al. 2020; Cantat-Gaudin et al. 2021) have typical spatial-to-kinematic ratios of their characteristic axes (defined as the cube root of their 1σ spatial or kinematic volume) in the range 1–14, and 90% of them have a ratio below 12. Those with lower ratios are usually the denser cores of open clusters, and those with larger ratios are either loose moving groups or open cluster coronae. Choosing a value of c = 12 will therefore ensure that our clustering step is able to recover associations that are spatially as large as currently known moving groups and open cluster coronae.
coordinates where c = 12 pc km−1 s−1. This value is larger than the c = 6 pc km−1 s−1 used by Kerr et al. (2021) because we aim to consider potentially older groups similar to Kounkel & Covey (2019), whereas Kerr et al. (2021) specifically investigated a sample of < 50 Myr-old stars. In fact, the ≈200 young associations, open clusters, and tidal tails within 500 pc of the Sun with ages ≲1 Gyr (Gagné et al. 2018c; Tarricq et al. 2020; Cantat-Gaudin et al. 2021) have typical spatial-to-kinematic ratios of their characteristic axes (defined as the cube root of their 1σ spatial or kinematic volume) in the range 1–14, and 90% of them have a ratio below 12. Those with lower ratios are usually the denser cores of open clusters, and those with larger ratios are either loose moving groups or open cluster coronae. Choosing a value of c = 12 will therefore ensure that our clustering step is able to recover associations that are spatially as large as currently known moving groups and open cluster coronae.
HDBSCAN offers two clustering approaches: "Excess of Mass" (EOM), which directs how it separates subclusters within larger clusters of stars. In the EOM approach, clusters that are most stable under changes in detection threshold are preferred, whereas the leaf method will tend to split such clusters farther apart when subclusters are detected. We elected to use the leaf clustering method to obtain a sample of individual substructures, even though some of them may be related to each other. For example, one might expect that extended structures like the Sco-Cen OB association would be preserved as a final cluster under the EOM clustering method, whereas the leaf method would further identify its subpopulations (e.g., Upper Scorpius, Lower Centaurus Crux and Upper Centaurus Lupus; see Blaauw 1946; de Zeeuw et al. 1999 and Pecaut & Mamajek 2016 for more detail), which have similar but distinct ages. Our choice of using the "leaf" clustering method will provide us with a finer sampling of individual structures, but we may find upon further study that some of these structures are related to each other through a larger past star-forming complex, for example. We used the default values for the  and α parameters.
6
We have chosen a minimum cluster size of N = 10 with HDBSCAN to start investigating the most significant missing structures of the solar neighborhood in this work. We have avoided values of N < 10 to reduce the number of false clusters that may correspond to random collections of stars; choosing a much larger value, on the other hand, would prevent us from recovering some of the sparser young associations in the solar neighborhood, especially because we only consider stars in the temperature and G-band magnitude ranges that benefit from Gaia DR2 radial velocities. Currently known young associations within 100 pc of the Sun have between 2 and 200 members with Gaia DR2 radial velocity measurements, and 80% of these associations have at least 10 such members (some exceptions are discussed in Section 3.2).
and α parameters.
6
We have chosen a minimum cluster size of N = 10 with HDBSCAN to start investigating the most significant missing structures of the solar neighborhood in this work. We have avoided values of N < 10 to reduce the number of false clusters that may correspond to random collections of stars; choosing a much larger value, on the other hand, would prevent us from recovering some of the sparser young associations in the solar neighborhood, especially because we only consider stars in the temperature and G-band magnitude ranges that benefit from Gaia DR2 radial velocities. Currently known young associations within 100 pc of the Sun have between 2 and 200 members with Gaia DR2 radial velocity measurements, and 80% of these associations have at least 10 such members (some exceptions are discussed in Section 3.2).
The application of HDBSCAN with this particular configuration to our sample described in Section 2.1 yielded a total of 241 clusters, which are listed in Table 1 with their individual lists of Gaia EDR3 source identifications. The median XY Galactic positions of all Crius groups are shown in Figure 2, which shows how they fill the gap within ≈100 pc from the Sun where previous clustering studies were less efficient due to projection effects. Following the spirit of Kounkel & Covey (2019) in their nomenclature of Theia groups, we hereafter refer to our resulting 241 putative ensembles of co-moving stars as Crius 1 to Crius 241. 7
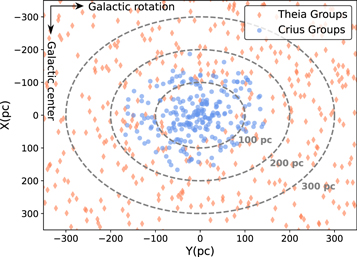
Figure 2. Median XY Galactic positions of all 241 Crius groups recovered here, compared with the distribution of Theia groups from Kounkel & Covey (2019). The clustering analysis presented here allowed us to recover groups much closer to the Sun, filling in the region within ≲100 pc from the Sun, because of its use of UVW-space velocities to prevent projection effects from artificially spreading out the members of nearby associations.
Download figure:
Standard image High-resolution imageTable 1. Individual Gaia EDR3 Entries Recovered as Clusters by HDBSCAN
| Crius | Gaia EDR3 | Right Ascension | Declination |

| μδ | Parallax | Radial Velocity |
|---|---|---|---|---|---|---|---|
| Group ID | Source ID | (hh:mm:ss.sss) | dd:mm:ss.ss | (mas yr−1) | (mas yr−1) | (mas) | (km s−1) |
| 1 | 2491729335519097600 | 01:58:24.266 | −05:09:53.51 | 246.99 ± 0.04 | 147.53 ± 0.04 | 14.09 ± 0.04 | 51.5 ± 0.4 |
| 1 | 83929987451343104 | 02:56:05.817 | 18:53:12.75 | 109.72 ± 0.02 | 19.47 ± 0.01 | 6.66 ± 0.02 | 88.9 ± 0.8 |
| 1 | 459661938487952000 | 02:56:35.793 | 55:26:06.82 | 727.63 ± 0.02 | −455.23 ± 0.02 | 49.32 ± 0.02 | 76.2 ± 0.3 |
| 1 | 57366301921437952 | 03:38:35.335 | 20:09:45.29 | 95.44 ± 0.02 | 16.35 ± 0.01 | 8.41 ± 0.02 | 102 ± 1 |
| 1 | 3441580727627952512 | 05:45:22.715 | 27:38:13.04 | −5.22 ± 0.02 | −31.27 ± 0.01 | 15.63 ± 0.02 | 108 ± 1 |
| 1 | 3813898626334257664 | 11:21:30.469 | 05:17:40.32 | −275.02 ± 0.02 | 60.96 ± 0.01 | 11.41 ± 0.01 | 12.8 ± 0.5 |
| 1 | 3813323276811078656 | 11:32:39.157 | 05:13:43.76 | −301.36 ± 0.02 | 72.59 ± 0.01 | 12.03 ± 0.02 | 15.6 ± 0.4 |
| 1 | 3930922058356114432 | 12:47:13.039 | 14:42:16.43 | −354.72 ± 0.02 | 149.31 ± 0.02 | 16.50 ± 0.02 | −24 ± 1 |
| 1 | 6197890597023337344 | 15:00:38.072 | −38:41:07.83 | −210.94 ± 0.02 | −92.50 ± 0.01 | 14.09 ± 0.02 | −86 ± 1 |
| 1 | 4595150639153952000 | 17:27:35.020 | 27:01:38.22 | −9.09 ± 0.01 | 370.94 ± 0.02 | 20.34 ± 0.01 | −72.1 ± 0.3 |
Note. Only a portion of the full table is shown here. The complete table is available as a machine-readable table.
Only a portion of this table is shown here to demonstrate its form and content. A machine-readable version of the full table is available.
Download table as: DataTypeset image
3. Discussion
A number of the 241 Crius groups identified in Section 2 may correspond to random overdensities of stars that are not coeval or did not form in a common birth region, much like some of the previously identified moving groups and streams of stars. Such unphysical groups tend to have larger UVW velocity spreads compared with coeval groups (e.g., see Mamajek 2016b); however, Kounkel & Covey (2019) also showed that older groups may display larger velocity spreads on average. Typically, coeval associations have intrinsic UVW spreads of 1 km s−1 or less (Zuckerman & Song 2004; Mamajek 2016b), but the observed spread of a coeval population can appear slightly larger (1–3 km s−1) when measurement errors contribute significantly to the UVW standard deviation. A number of studies have also now demonstrated that coeval and co-moving groups of stars tend to be distributed along a relatively thin sheet in the Z Galactic plane (e.g., see Kraus et al. 2014 and Meingast et al. 2021). For these reasons, we have applied selection cuts on the Crius groups to focus on those that are most likely to consist of coeval stellar populations. We chose to further investigate only the Crius groups with individual U, V, and W median absolute deviations below 3 km s−1, and Z median absolute deviations below 15 pc, which are in line with currently known young associations and allow for a modest contribution of radial velocity and parallax measurement errors. The distributions of Z and UVW median absolute deviations of all Crius groups are shown in Figure 3. We note that these rejected Crius groups may contain additional coeval structures, but they will likely also include a larger number of contaminated or unphysical clusters.

Figure 3. Corner plot of the median absolute deviations for the Z Galactic coordinate and the U-, V-, and W-space velocities of the 241 Crius groups identified here. Red dashed lines correspond to the selection criteria described in Section 3.
Download figure:
Standard image High-resolution imageThe distribution of UV velocities of Crius groups is compared with other known associations and nearby field stars in Figure 4, along with the velocity regions defined by Eggen (1958) and Eggen (1971), and further discussed by Gaia Collaboration et al. (2021). Groups in the three Hercules "branches" are known to cover a wide range of stellar ages and are still not well understood; they may correspond to resonances in the Galactic orbits of relatively old stars caused by the Galactic arms or bar or past accretion events (e.g., see Antoja et al. 2010). The Hercules streams are known to be substructured (Dehnen 1998), in line with our analysis having retrieved clusters in this region of the UV-plane. We have excluded the Crius groups in the Hercules branches for the current study, and similarly exclude the groups with unusually high velocities (V > 40 km s−1 or U < −60 km s−1) that likely correspond to substructure in the older halo stars, but we note that these groups may be interesting for the study of older stellar populations.
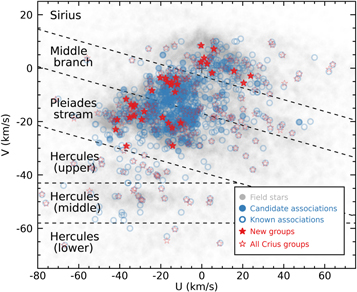
Figure 4. Median UV-space velocities of all Crius groups (open red stars), and new candidate associations presented here (filled red stars) compared with other known young associations in the literature (blue circles) and field stars within 100 pc of the Sun in Gaia EDR3 (gray circles). Open blue circles indicate "candidate" associations that have not yet been fully characterized, such as most of the Kounkel & Covey (2019) Theia groups, and we indicate the velocity regions introduced by Eggen (1958) and Eggen (1971). We have excluded Crius groups within the Hercules regions as well as the higher-velocity groups at V > 40 km s−1 or U < −60 km s−1 from this study (Gaia Collaboration et al. 2021).
Download figure:
Standard image High-resolution imageBecause we have restricted our input sample to stars with heliocentric radial velocities in Gaia DR2, the locus of our current Crius members have spectral types in the range FGK (see Figure 5), preventing an efficient determination of coevality with isochrone fitting in the range 100 Myr–3 Gyr. We have therefore not used color–magnitude diagrams in our quality cuts, and note that this will likely be feasible with the additional radial velocities in Gaia DR3.
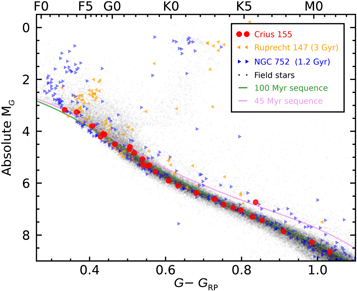
Figure 5. Gaia EDR3 color–magnitude diagram for Crius 155 members, compared with the empirical sequences of Gagné et al. (2021) and the older open clusters NGC 752 and Ruprecht 147. The low-mass members of Crius 155 are consistent with the 100 Myr old sequence, but also with both older open clusters. The absence of a main-sequence turn-off of the most massive members of Crius 155 suggests a maximum age intermediate between NGC 752 and Ruprecht 147 (1.2–3 Gyr; Cantat-Gaudin et al. 2020).
Download figure:
Standard image High-resolution imageThe selection cuts described above have yielded a subset of 84 Crius groups listed in Table 2, which we have investigated further to identify whether they correspond to known coeval associations. All Crius groups that did not pass these selection criteria are listed in Table 3.
Table 2. Median Properties of Individual Groups Recovered by HDBSCAN That Passed All Selection Criteria
| Crius | Number of | Number with | Median (pc, km s−1) | MAD a (pc, km s−1) | |||||||||
|---|---|---|---|---|---|---|---|---|---|---|---|---|---|
| ID | Members | RUWE > 1.4 | Distance | X | Y | Z | U | V | W | Z | U | V | W |
| 77 | 8 | 0 | 148.4 | 133.1 | 29.3 | −58.6 | −36.2 | −29.3 | −10.4 | 6.9 | 1.5 | 1.1 | 2.1 |
| 85 | 12 | 4 | 154.5 | 6.4 | −118.0 | 99.6 | −15.0 | −6.4 | −19.3 | 8.0 | 1.7 | 2.1 | 0.3 |
| 109 | 16 | 2 | 158.7 | −100.8 | 86.3 | −87.1 | 2.6 | 1.5 | −16.3 | 9.2 | 1.6 | 0.8 | 1.4 |
| 110 | 8 | 1 | 142.6 | 119.5 | −2.6 | −77.8 | 5.8 | 7.4 | −15.7 | 7.5 | 0.8 | 1.1 | 1.5 |
| 113 | 10 | 1 | 120.4 | 98.3 | −68.7 | 10.6 | −0.5 | 2.4 | −12.8 | 7.0 | 2.3 | 1.7 | 2.8 |
| 116 | 11 | 0 | 114.5 | 62.7 | 22.6 | −93.1 | −11.8 | −5.9 | 5.7 | 7.2 | 0.4 | 0.6 | 0.7 |
| 119 | 11 | 2 | 155.1 | 108.5 | −104.9 | 35.7 | −14.7 | −5.9 | −2.2 | 13.5 | 1.6 | 1.7 | 1.5 |
| 124 | 15 | 0 | 160.4 | −48.1 | −92.4 | −122.0 | −0.7 | 8.5 | −16.7 | 9.6 | 0.6 | 0.7 | 0.5 |
| 127 | 10 | 0 | 121.4 | −70.3 | 74.2 | −65.5 | 23.7 | −2.9 | −3.6 | 4.8 | 0.9 | 0.8 | 1.8 |
| 131 | 40 | 2 | 112.8 | 10.9 | −100.5 | −49.9 | −0.2 | 0.5 | −1.7 | 10.0 | 1.1 | 1.1 | 1.3 |
| 134 | 24 | 2 | 111.1 | −107.4 | 26.4 | 10.3 | 20.5 | −5.7 | −13.6 | 11.3 | 1.6 | 1.2 | 1.9 |
| 135 | 13 | 2 | 84.9 | −17.5 | −75.1 | −35.4 | 15.7 | −1.2 | −3.6 | 12.6 | 1.4 | 1.1 | 2.6 |
| 137 | 13 | 0 | 97.1 | −75.9 | 30.8 | −52.1 | 5.1 | −1.9 | −7.3 | 4.9 | 1.1 | 0.7 | 0.7 |
| 144 | 10 | 2 | 161.9 | −105.2 | 114.5 | −45.4 | −42.1 | −22.7 | −9.3 | 13.3 | 0.9 | 1.0 | 1.0 |
| 147 | 44 | 3 | 100.0 | −7.2 | 56.7 | 82.0 | −3.4 | −9.0 | −1.7 | 2.6 | 0.7 | 0.6 | 0.8 |
| 148 | 62 | 9 | 85.7 | −6.3 | −5.6 | 85.3 | −2.4 | −5.6 | −0.5 | 2.6 | 0.5 | 0.4 | 0.7 |
| 149 | 16 | 2 | 81.1 | 25.7 | 7.6 | 76.6 | −10.4 | −20.7 | 5.6 | 13.2 | 1.1 | 1.2 | 1.6 |
| 150 | 26 | 2 | 152.3 | 149.2 | 29.7 | −7.7 | −7.9 | −17.2 | −13.6 | 5.3 | 1.2 | 0.7 | 0.8 |
| 151 | 19 | 3 | 112.8 | 88.3 | 46.7 | 52.3 | −15.9 | −1.1 | −2.5 | 7.9 | 2.2 | 1.3 | 1.2 |
| 152 | 11 | 1 | 122.4 | −81.6 | −60.3 | 68.5 | −33.4 | −13.9 | −16.7 | 9.0 | 1.9 | 1.4 | 0.5 |
| 153 | 22 | 3 | 169.4 | −55.6 | 135.5 | −85.2 | −12.1 | −0.8 | −7.1 | 6.3 | 1.4 | 0.7 | 0.5 |
| 154 | 10 | 3 | 178.7 | 35.9 | −172.3 | −30.8 | −35.4 | −18.4 | −7.4 | 10.6 | 1.4 | 1.4 | 0.5 |
| 155 | 29 | 4 | 93.8 | 75.9 | 45.7 | 30.9 | −25.3 | −4.2 | −5.0 | 8.7 | 1.7 | 1.4 | 0.9 |
| 156 | 70 | 8 | 175.4 | −127.3 | 110.3 | 48.8 | −17.5 | −5.0 | −6.3 | 5.2 | 1.3 | 0.9 | 1.0 |
| 158 | 12 | 0 | 139.1 | 43.8 | 116.1 | 63.0 | −12.2 | −4.0 | −9.7 | 12.3 | 2.0 | 1.9 | 1.2 |
| 159 | 13 | 1 | 125.5 | 22.3 | 122.3 | 17.6 | −14.1 | −9.4 | −9.9 | 8.6 | 0.9 | 1.3 | 2.4 |
| 162 | 14 | 1 | 73.5 | 27.7 | −62.1 | 28.0 | −17.7 | −3.7 | −11.9 | 8.9 | 1.1 | 1.0 | 1.1 |
| 163 | 18 | 1 | 170.9 | −48.1 | −160.5 | −33.6 | −10.5 | −8.3 | −9.8 | 11.1 | 2.1 | 1.7 | 0.5 |
| 166 | 26 | 3 | 136.8 | 135.1 | −15.6 | 14.9 | −1.0 | −28.9 | −14.0 | 5.4 | 2.9 | 0.5 | 0.5 |
| 167 | 13 | 0 | 191.3 | −188.9 | −25.3 | 16.0 | −35.6 | −19.8 | 1.4 | 14.7 | 1.6 | 1.0 | 0.5 |
| 168 | 16 | 0 | 116.3 | −3.0 | 101.7 | −56.3 | −3.8 | −6.9 | −9.9 | 12.3 | 1.6 | 1.2 | 1.2 |
| 169 | 60 | 11 | 126.2 | −117.8 | 5.8 | −44.7 | −12.7 | −6.7 | −9.1 | 13.4 | 1.9 | 1.2 | 1.4 |
| 170 | 10 | 1 | 107.8 | 80.3 | −51.8 | −49.9 | −7.3 | −4.1 | −8.9 | 3.3 | 0.4 | 0.6 | 0.4 |
| 171 | 15 | 2 | 187.0 | 171.2 | −64.3 | −38.9 | −10.3 | −1.2 | −11.2 | 10.5 | 1.2 | 1.1 | 1.1 |
| 172 | 38 | 5 | 139.5 | −113.0 | −23.3 | −78.3 | −9.6 | −3.8 | −11.4 | 14.1 | 1.6 | 1.0 | 0.9 |
| 174 | 28 | 0 | 123.7 | −8.9 | 65.8 | −104.3 | −7.3 | −4.1 | −18.5 | 5.7 | 1.0 | 0.8 | 1.3 |
| 175 | 13 | 1 | 114.8 | −57.7 | 8.3 | −98.9 | −9.2 | −4.2 | −18.4 | 6.2 | 0.5 | 0.3 | 0.7 |
| 176 | 12 | 1 | 162.3 | −121.2 | −55.8 | −92.5 | −11.5 | −5.1 | −18.3 | 2.0 | 0.7 | 0.6 | 0.2 |
| 178 | 55 | 8 | 182.8 | −49.5 | −174.1 | −25.4 | −26.6 | −13.7 | −13.1 | 4.6 | 1.7 | 1.8 | 0.8 |
| 182 | 11 | 0 | 152.1 | −60.2 | 85.8 | 110.3 | −14.2 | −21.6 | −3.6 | 5.0 | 1.0 | 1.0 | 0.8 |
| 183 | 20 | 3 | 160.7 | 80.4 | −136.3 | 28.1 | −34.5 | −17.4 | −10.9 | 13.5 | 1.3 | 2.0 | 2.9 |
| 184 | 11 | 1 | 138.9 | −91.8 | −89.5 | 53.4 | −29.3 | −19.3 | 2.3 | 4.9 | 0.7 | 0.5 | 1.9 |
| 187 | 232 | 33 | 184.2 | −140.0 | −67.9 | 98.6 | −42.8 | −20.4 | −9.5 | 3.3 | 1.1 | 0.8 | 0.7 |
| 188 | 14 | 0 | 154.5 | −107.9 | −69.3 | −86.1 | −14.3 | −29.3 | −4.8 | 7.6 | 1.0 | 0.4 | 0.8 |
| 189 | 16 | 4 | 195.9 | −166.2 | 55.2 | 87.7 | −21.3 | −23.0 | −2.1 | 2.0 | 0.6 | 0.2 | 0.5 |
| 190 | 10 | 0 | 182.1 | 53.1 | −172.4 | −24.8 | −34.4 | −16.8 | −0.7 | 6.4 | 0.7 | 0.5 | 0.9 |
| 191 | 18 | 2 | 125.4 | 38.1 | −103.0 | 60.6 | −26.3 | −7.2 | −10.9 | 3.7 | 0.5 | 1.1 | 0.7 |
| 192 | 14 | 1 | 71.0 | 1.8 | −14.5 | 69.5 | −24.6 | −8.4 | −8.6 | 4.3 | 1.9 | 1.1 | 1.5 |
| 193 | 14 | 1 | 154.8 | 90.8 | −123.0 | −24.5 | −22.6 | −13.5 | −6.1 | 6.1 | 0.4 | 0.9 | 0.8 |
| 195 | 20 | 0 | 164.0 | −5.6 | −163.3 | 13.4 | −23.6 | −15.8 | −5.9 | 4.9 | 0.5 | 0.8 | 0.5 |
| 196 | 38 | 2 | 150.3 | 0.8 | −149.1 | −18.3 | −23.8 | −14.5 | −5.7 | 1.4 | 0.4 | 1.3 | 0.3 |
| 198 | 11 | 0 | 47.6 | −27.1 | 36.8 | 13.1 | −34.3 | −12.9 | −11.0 | 6.9 | 1.5 | 2.1 | 1.4 |
| 199 | 21 | 2 | 157.9 | 106.5 | −89.3 | −74.8 | −37.0 | −11.8 | −4.1 | 5.9 | 1.0 | 1.0 | 0.7 |
| 202 | 20 | 2 | 104.0 | 13.3 | −95.2 | −39.6 | −33.1 | −16.3 | 0.9 | 15.0 | 1.7 | 1.0 | 0.5 |
| 204 | 17 | 2 | 120.7 | 100.7 | 56.6 | −35.0 | −26.5 | −13.7 | 2.7 | 11.5 | 2.0 | 0.9 | 0.5 |
| 205 | 12 | 0 | 83.2 | 31.0 | 66.4 | 39.3 | −36.8 | −18.4 | −8.1 | 12.5 | 0.5 | 0.6 | 0.8 |
| 207 | 26 | 2 | 90.8 | 76.8 | 40.3 | 27.0 | −35.6 | −15.3 | −7.5 | 9.9 | 2.7 | 1.4 | 2.8 |
| 208 | 13 | 5 | 112.1 | 79.7 | 75.3 | 23.1 | −26.2 | −14.1 | 0.8 | 6.9 | 1.0 | 0.6 | 0.1 |
| 210 | 18 | 1 | 91.6 | 48.7 | −55.7 | 54.0 | −32.5 | −14.0 | 0.5 | 6.9 | 0.8 | 1.3 | 0.7 |
| 213 | 11 | 0 | 60.4 | −46.3 | 38.6 | 3.9 | −41.4 | −19.3 | −10.7 | 9.6 | 1.4 | 0.9 | 1.8 |
| 214 | 293 | 28 | 45.0 | −41.8 | 1.1 | −16.9 | −42.2 | −19.1 | −1.4 | 4.0 | 1.0 | 0.5 | 0.5 |
| 215 | 13 | 2 | 183.8 | −70.9 | −146.7 | 85.0 | −27.1 | −19.4 | −1.7 | 9.8 | 1.8 | 1.6 | 1.4 |
| 217 | 30 | 6 | 151.4 | −113.7 | −27.0 | 96.3 | −23.8 | −21.4 | −3.2 | 9.3 | 1.1 | 1.5 | 1.0 |
| 220 | 23 | 0 | 47.7 | 42.6 | 1.7 | −21.4 | −9.1 | −15.3 | −8.4 | 10.1 | 1.2 | 0.6 | 1.1 |
| 221 | 67 | 9 | 63.7 | 22.1 | −57.9 | −14.7 | −15.9 | −27.8 | −0.8 | 7.0 | 1.0 | 0.9 | 0.7 |
| 222 | 14 | 1 | 80.1 | −31.2 | 9.4 | 73.2 | −18.9 | −18.4 | −7.5 | 11.4 | 1.2 | 0.5 | 0.9 |
| 224 | 28 | 3 | 43.9 | 10.8 | 14.3 | 40.1 | −16.4 | −20.6 | −3.7 | 5.5 | 1.1 | 1.5 | 0.9 |
| 225 | 15 | 3 | 171.1 | −100.7 | −77.2 | −114.7 | −15.9 | −22.4 | −4.3 | 4.7 | 0.7 | 0.5 | 0.5 |
| 226 | 23 | 0 | 153.1 | 35.7 | 148.3 | 12.7 | −8.1 | −22.3 | −6.1 | 7.5 | 0.6 | 0.5 | 0.7 |
| 227 | 13 | 0 | 42.9 | 3.1 | 42.7 | −2.7 | −9.4 | −22.9 | −5.4 | 7.9 | 0.5 | 0.9 | 0.5 |
| 228 | 24 | 2 | 153.3 | −44.8 | −132.5 | −62.8 | −7.5 | −24.7 | −14.1 | 7.8 | 0.7 | 1.1 | 0.7 |
| 229 | 142 | 6 | 166.2 | −138.5 | 89.9 | −18.8 | −13.5 | −23.8 | −6.7 | 8.7 | 1.2 | 0.7 | 0.4 |
| 230 | 13 | 1 | 147.3 | −124.4 | 2.1 | −78.8 | −14.4 | −24.1 | −7.0 | 4.7 | 0.4 | 0.5 | 0.4 |
| 231 | 30 | 2 | 82.5 | −51.2 | −49.5 | −41.7 | −6.1 | −27.9 | −14.2 | 6.1 | 0.5 | 0.3 | 0.9 |
| 232 | 211 | 23 | 135.4 | −120.4 | 29.1 | −54.6 | −6.8 | −28.4 | −14.3 | 3.0 | 1.1 | 0.5 | 0.7 |
| 233 | 45 | 5 | 44.7 | 7.3 | −25.1 | −36.3 | −9.8 | −20.8 | −0.5 | 4.2 | 0.6 | 0.3 | 0.8 |
| 234 | 15 | 0 | 147.3 | 142.5 | −3.6 | −37.3 | −4.7 | −17.5 | −7.9 | 4.9 | 1.3 | 0.3 | 1.1 |
| 235 | 46 | 3 | 149.9 | 49.7 | −140.9 | −12.0 | −8.4 | −21.0 | −0.9 | 4.6 | 0.7 | 1.3 | 0.6 |
| 236 | 31 | 0 | 175.6 | 167.6 | −50.5 | 14.0 | −4.1 | −19.6 | −4.2 | 3.1 | 1.2 | 0.6 | 0.4 |
| 237 | 11 | 0 | 73.6 | −26.4 | −49.8 | −47.4 | −12.9 | −21.8 | −5.0 | 11.9 | 0.5 | 0.4 | 0.6 |
| 238 | 57 | 8 | 130.6 | 11.2 | −129.1 | −16.6 | −11.2 | −22.8 | −4.1 | 10.4 | 0.5 | 1.2 | 0.4 |
| 239 | 14 | 1 | 144.3 | 140.2 | −24.5 | 24.0 | −2.4 | −16.7 | −6.8 | 12.2 | 0.8 | 0.4 | 0.5 |
| 240 | 60 | 12 | 143.3 | 131.5 | −19.0 | 53.6 | −5.9 | −15.9 | −8.0 | 6.5 | 1.6 | 0.9 | 1.4 |
| 241 | 126 | 9 | 111.2 | 57.8 | −93.4 | 17.3 | −8.7 | −20.5 | −6.6 | 12.9 | 1.0 | 1.0 | 0.9 |
Note.
a Median absolute deviation.A machine-readable version of the table is available.
Table 3. Median Properties of Individual Groups Recovered by HDBSCAN That Failed at Least One Selection Criterion
| Crius | Number of | Median (pc, km s−1) | MAD a (pc, km s−1) | Selection | |||||||||
|---|---|---|---|---|---|---|---|---|---|---|---|---|---|
| ID | Members | Distance | X | Y | Z | U | V | W | Z | U | V | W | Criteria b |
| 1 | 10 | 17.7 | −13.7 | 4.4 | 10.3 | −111.9 | −14.7 | −10.8 | 82.6 | 2.9 | 9.5 | 6.1 | FFFF |
| 2 | 11 | 32.3 | 7.0 | 12.1 | 29.1 | −17.2 | −90.1 | −12.9 | 39.5 | 3.8 | 5.5 | 2.5 | FPFF |
| 3 | 10 | 86.4 | 25.8 | −23.3 | −79.1 | −67.1 | −66.3 | 1.1 | 33.7 | 2.8 | 2.7 | 1.0 | FPPF |
| 4 | 26 | 64.8 | −37.9 | −46.4 | 24.6 | 47.7 | −2.2 | −39.6 | 48.4 | 4.5 | 2.2 | 3.9 | PPFF |
| 5 | 15 | 90.8 | 4.1 | 90.1 | 10.0 | 8.6 | −65.7 | 3.7 | 38.8 | 4.3 | 3.3 | 3.9 | FPFF |
| 6 | 14 | 74.0 | 16.6 | −50.8 | 51.1 | −7.3 | 27.1 | 6.3 | 34.3 | 1.1 | 2.2 | 4.1 | PFFF |
| 7 | 7 | 140.5 | −33.8 | −120.3 | 64.1 | −55.9 | 3.8 | 2.6 | 25.9 | 3.3 | 1.1 | 1.0 | PPFF |
| 8 | 10 | 72.5 | 43.0 | 49.4 | 31.0 | −71.3 | −11.6 | −20.4 | 41.0 | 3.5 | 1.9 | 1.7 | PPFF |
| 9 | 11 | 91.9 | 23.1 | −40.2 | 79.4 | −89.1 | −49.4 | 3.0 | 32.8 | 2.0 | 1.9 | 2.9 | FPPF |
| 10 | 11 | 88.2 | −70.7 | 50.1 | −16.1 | 26.4 | −27.4 | −42.6 | 18.6 | 1.8 | 2.2 | 2.0 | PPPF |
Notes. Only a portion of the full table is shown here. The complete table is available as a machine-readable table.
a Median absolute deviation. b Pass (P) or fail (F) flags that indicate whether a given Crius group has passed the selection criteria for further study in this work. The respective character positions refer to the following criteria: (1) rejection based on the Hercules stream; (2) rejection based on other high-velocity groups in the UV-plane (U < −100 km s−1, U > 60 km s−1, or V > 20 km s−1); (3) rejection based on individual UVW MADs above 3 km s−1; (4) rejection based on Z MAD above 15 pc.Only a portion of this table is shown here to demonstrate its form and content. A machine-readable version of the full table is available.
Download table as: DataTypeset image
3.1. Known Associations
We determined whether each of the Crius groups identified in the previous section corresponds to a known association, moving group, or open cluster by comparing their list of Gaia EDR3 names with membership lists of known associations in the solar neighborhood. This set of memberships builds on those compiled by Malo et al. (2013), Riedel et al. (2017), and Gagné et al. (2018c) and gathers more than 450 publications that includes but is not limited to membership lists on the Strasbourg Astronomical Data Center (Ochsenbein et al. 2000). The full list, including those not discussed in this work, will be presented in the form of an online database in a future publication (J. Gagné et al. 2022, in preparation), and includes all known associations and open clusters discussed in the literature that we could identify with an average distance within 400 pc of the Sun, including those that were discovered under more than one name, or are currently thought to be an unphysical collection of stars. These include recent surveys such as Kerr et al. (2021), Liu et al. (2021), and Tarricq et al. (2021). Every instance where a number of Crius Gaia EDR3 entries matches members of a known association was investigated in both UVW-space velocities and XYZ Galactic positions using the 3D data visualization software Partiview (Levy 2003) to determine whether the overlap between the known association and the Crius group is significant.
Subsequently, all Crius groups for which no member matched a known association were also investigated in UVW-space velocities and XYZ Galactic positions using Partiview, considering all plausible matching groups in the literature for which bulk UVW-space velocities fell within a radius of ≈10 km s−1 of the median UVW-space velocity of Crius groups, and for which bulk XYZ Galactic positions fell within a radius of ≈50 pc in of the median XYZ Galactic position of Crius groups.
These two methods allowed us to identify several Crius groups that likely correspond to known associations, listed in Table 4 and discussed in Section 3.1. In most cases, the overlap was mostly complete, meaning that we have recovered the majority of the known members in the substructure, and the full spatial overlap of the Crius group is similar to that of the known young association.
Table 4. Known Associations Recovered in This Work
| Crius | Approx. | Age | Age | Association |
|---|---|---|---|---|
| ID | Distance (pc) | (Myr) | Reference | Name |
| 141 a | 25 | 414 | 1 | Ursa Major association |
| 220 | 50 | 26 | 2 | β Pic moving group b |
| 233 | 50 | 40 | 3 | Tucana-Horologium |
| 214 | 50 | 676 | 4 | Hyades + Meingast & Alves (2019) corona |
| 237 | 70 | 42 | 5 | Columba b |
| 155 | 80 | 400 | 6 | Theia 1005 |
| 148 | 90 | 560 | 7 | Coma Berenices + Tang et al. (2019) corona |
| 221 | 90 | 90 | 8 | Volans–Carina (Oh et al. 2017 Group 30) + corona (Theia 424) |
| 216 | 100 | 24 | 9 | Mamajek (2016a) 118 Tau, Bell et al. (2017) 32 Ori |
| 170 | 100 | 250 | 10 | Tofflemire et al. (2021) MELANGE–1, Theia 786 |
| 147 | 100 | 400 | 11 | Oh et al. (2017) Group 10 |
| 151 | 110 | 300 | 6 | Theia 677 b |
| 204 | 110 | 500 | 6 | Theia 595 b (low-Z part) |
| 205 | 110 | 300 | 6 | Theia 677 b |
| 207 | 110 | 300 | 6 | Theia 677 b |
| 208 | 110 | 500 | 6 | Theia 595 b (high-Z part) |
| 227 | 110 | 160 | 6 | Theia 209 |
| 169 | 120 | 30–38 | 12 | Kerr et al. (2021) Greater Taurus Subgroup 4 |
| 174 | 130 | 120 | 13 | Meingast et al. (2019) Pisces-Eridanus stream c |
| 175 | 130 | 120 | 13 | Meingast et al. (2019) Pisces-Eridanus stream c |
| 176 | 130 | 120 | 13 | Meingast et al. (2019) Pisces-Eridanus stream c |
| 238 | 130 | 60 | 14 | Platais 8 + Gagné et al. (2021) candidate corona (Theia 113, Theia 92 c ) |
| 241 | 130 | 8–23 | 12 | Kerr et al. (2021) Greater Scorpius-Centaurus Subgroup 27, Upper Centaurus Lupus b |
| 164 a | 140 | 35 | 15 | Octans b |
| 166 | 140 | 170 | 6 | Theia 368 |
| 232 | 140 | 112 | 16 | Pleiades |
| 239 | 140 | 19 | 12 | Kerr et al. (2021) Greater Scorpius-Centaurus Subgroups 16 b , 17 b |
| 240 | 140 | 11 | 12 | Kerr et al. (2021) Greater Scorpius-Centaurus Subgroup 17 |
| 170 | 150 | 280 | 6 | Theia 786 |
| 196 | 150 | 51 | 17 | IC 2391 + Meingast et al. (2021) corona |
| 230 | 150 | 60 | 18 | Gagné et al. (2020a) μ Tau |
| 234 | 150 | 5 | 19 | Corona Australis |
| 235 | 150 | 46 | 20 | IC 2602 + Meingast et al. (2021) corona (Theia 92 b ) |
| 226 | 160 | 160 | 6 | Oh et al. (2017) Group 59 + corona (Theia 209, Theia 133 b ) |
| 172 | 160 | 90 | 6 | Oh et al. (2017) Group 51 + corona (Theia 218) |
| 191 | 160 | 180 | 6 | Theia 430 |
| 225 | 160 | 50 | 21 | Blaauw (1956) Cas-Tau |
| 228 | 160 | 200 | 6 | Theia 301 b |
| 231 | 160 | 200 | 6 | Theia 301 b |
| 150 | 170 | 230 | 6 | Theia 431 |
| 229 | 170 | 90 | 22 | α Persei + Meingast et al. (2021) corona |
| 187 | 180 | 617 | 4 | Praesepe + Röser & Schilbach (2019) corona (Theia 1184) |
| 193 | 180 | 45 | 6 | Theia 115 b |
| 195 | 180 | 50 | 23 | Platais 9 + Meingast et al. (2021) corona (Theia 134, Theia 508) |
| 156 | 180 | 180 | 23 | Platais 3 + corona (Theia 787) |
| 236 | 180 | 19 | 12 | Kerr et al. (2021) Greater Scorpius-Centaurus Subgroup 15 |
| 131 | 190 | 210 | 6 | Theia 371 |
| 153 | 190 | 220 | 6 | Theia 372 |
| 163 | 200 | 320 | 6 | Theia 788 |
| 178 | 200 | 36 | 24 | NGC 2451A + Meingast et al. (2021) corona (Theia 118) |
| 189 | 200 | 126 | 25 | Core of Röser et al. (2016) RSG 2 open cluster (Oh et al. 2017 Group 16) |
| 217 | 200 | 126 | 25 | Corona of Röser et al. (2016) RSG 2 (Theia 214) |
| 171 | 210 | 280 | 24 | Alessi 9 + corona (Theia 598) |
| 167 | 210 | 340 | 6 | Theia 792 |
| 190 | 220 | 300 | 6 | Oh et al. (2017) Group 23 + corona (Theia 599) |
| 202 | 220 | 300 | 6 | Oh et al. (2017) Group 23 + corona (Theia 599) |
| 215 | 260 | 270 | 6 | Theia 600 |
| 168 | 270 | 190 | 6 | Theia 310 |
Notes. (1) Jones et al. (2015); (2) Malo et al. (2014); (3) Kraus et al. (2014); (4) Gossage et al. (2018); (5) Bell et al. (2015); (6) Kounkel & Covey (2019); (7) Silaj & Landstreet (2014); (8) Gagné et al. (2018a); (9) Bell et al. (2017); (10) Tofflemire et al. (2021); (11) Tang et al. (2019); (12) Kerr et al. (2021); (13) Curtis et al. (2019); (14) Platais et al. (1998); (15) Murphy & Lawson (2015); (16) Dahm (2015); (17) Jeffries & Oliveira (2005); (18) Gagné et al. (2020a); (19) Gennaro et al. (2012); (20) Dobbie et al. (2010); (21) de Zeeuw et al. (1999); (22) Stauffer et al. (1999); (23) Tarricq et al. (2021); (24) Cantat-Gaudin et al. (2020); (25) Röser et al. (2016).
a This Crius group was initially rejected from our list of interesting groups because of selection cuts in the median absolute deviations of ZUVW or further selection cuts in the UV-plane. b Only a subset of the members of these associations correspond to this Crius group. c The Pisces-Eridanus stream was previously noted to contain local overdensities (Meingast et al. 2019), and we have recovered them as distinct groups.Download table as: ASCIITypeset image
In a few cases, a Crius group was recovered that only spans a fraction of the full spatial distribution of a known young association; these cases are discussed further in Section 3.2. In other instances, we have recovered significant spatial extensions of known associations that share the same UVW-space velocities within 3 km s−1. A number of these extensions simply correspond to the forefront of known loose associations toward nearby distances or extensions in the tangential direction that prevented previous clustering algorithms from identifying them because they are based on 2D tangential velocities rather than 3D space velocities (as discussed in Section 3.4). However, a number of other Crius groups seem to correspond to the coronae of less-well-studied open clusters such as Group 23 of Oh et al. (2017, sometimes also named Oh 23) and Volans–Carina (Gagné et al. 2018a), in line with the recent discoveries of a large number of similar structures around known open clusters (see, e.g., Meingast et al. 2021). These new candidate coronae are listed in Table 5 and discussed further in Section 3.5. The remaining Crius groups that do not seem to correspond to known structures are listed in Table 6 and discussed further in Section 3.3.
Table 5. Newly Recognized Coronae
| Name | Age | Number of Stars in | Distances (pc) | Other | ||
|---|---|---|---|---|---|---|
| (Myr) | Core | Corona | Core | Corona | Names | |
| Volans–Carina |

| 48 | 93 | 87 | 26–124 | Oh 30 b , Theia 424, Crius 221 |
| Oh 59 b | ≈ 160 | 33 | 376 | 160 | 82–249 | Theia 209, Theia 133 a , Crius 226 |
| Oh 51 b | ≈ 90 | 11 | 170 | 161 | 93–431 | Theia 218, Crius 172 |
| Platais 3 | ≈ 180 | 85 | 241 | 179 | 108–518 | Theia 787, Crius 156 |
| RSG 2 | ≈ 125 | 60 | 276 | 198 | 123–329 | Oh 16 b , Theia 214, Crius 189, Crius 217 |
| Alessi 9 | ≈ 280 | 85 | 418 | 208 | 119–762 | Theia 598, Crius 171 |
| UPK 612 | ≈ 100 | 60 | 276 | 216 | 154–476 | Theia 216 |
| Oh 23 b | ≈ 300 | 17 | 347 | 218 | 96–493 | Theia 599, Crius 190, Crius 202 |
Notes. Ages are from Gagné et al. (2018a; Volans–Carina), Kounkel & Covey (2019; Oh 23, Oh 51, and Oh 59), Tarricq et al. (2012; Platais 3), Cantat-Gaudin et al. (2020; Alessi 9), and Röser et al. (2016; RSG 2).
a Only a small part of Theia 133 is likely associated with the Oh 59 corona; the rest is mainly associated with the corona of the α Per open cluster (e.g., see Meingast et al. 2021). Further studies based on Gaia DR3 will help to properly disentangle the coronae of α Per and Oh 59 given their similar kinematics. b Oh et al. (2017) groups.Download table as: ASCIITypeset image
Table 6. New Candidate Associations Discovered in This Work
| Crius | Distance a | CMD | Number | M.A.D. | M.A.D. | Xa | Ya | Za | Ua | Va | W a | Nearest | ΔUVW |
|---|---|---|---|---|---|---|---|---|---|---|---|---|---|
| ID | (pc) | Age (Gyr) | of Stars | UVW (km s−1) | Z (pc) | (pc) | (pc) | (pc) | (km s−1) | (km s−1) | (km s−1) | Asso. | (km s−1) |
| 85 | 152 | ≥ 0.1 | 12 | 2.7 | 8.0 | 7.9 | −116.6 | 97.9 | −15.1 | −6.4 | −19.5 | UPK535 | 5.8 |
| 109 | 157 | ≥ 0.1 | 17 | 2.3 | 7.1 | −102.0 | 83.0 | −86.3 | 2.6 | 1.6 | −16.2 | UBC8 | 8.0 |
| 110 | 144 | ≈0.7 | 10 | 2.1 | 10.5 | 117.8 | −2.8 | −83.7 | 5.9 | 7.2 | −15.4 | COINGA13 | 10.8 |
| 113 | 122 | 0.7–1.2 | 10 | 4.1 | 7.0 | 99.4 | −69.3 | 10.1 | −0.4 | 2.2 | −12.8 | UBC8 | 7.2 |
| 116 | 118 | 0.1–3 | 11 | 1.0 | 7.2 | 66.4 | 26.8 | −93.2 | −11.8 | −6.1 | 5.3 | COL350 | 5.2 |
| 119 | 154 | ≥ 0.1 | 11 | 2.7 | 13.5 | 112.8 | −98.8 | 36.8 | −14.6 | −5.3 | −2.0 | ASCC21 | 4.1 |
| 121 | 123 | ≥ 0.1 | 14 | 4.0 | 14.2 | −102.9 | −37.4 | −57.0 | 1.1 | 3.8 | −11.6 | TURN5 | 7.7 |
| 124 | 158 | 0.1–1 | 17 | 1.1 | 8.3 | −44.9 | −89.6 | −121.6 | −0.3 | 8.5 | −16.6 | RUP98 | 13.4 |
| 127 | 124 | 0.1–2 | 10 | 2.2 | 4.8 | −75.2 | 79.3 | −59.4 | 23.9 | −2.9 | −4.0 | NGC7092 | 9.9 |
| 134 | 104 | 0.1–2 | 26 | 2.9 | 13.4 | −101.3 | 24.4 | 5.4 | 20.4 | −5.6 | −13.6 | CNGC7092 | 6.7 |
| 135 | 83 | 0.1–0.7 | 13 | 3.2 | 12.6 | −13.5 | −75.1 | −32.7 | 15.8 | −1.0 | −3.6 | STOC10 | 3.0 |
| 137 | 91 | ≥ 1 | 13 | 1.5 | 4.9 | −71.7 | 25.5 | −50.6 | 5.0 | −1.8 | −7.4 | TURN5 | 6.4 |
| 144 | 158 | ≥ 0.1 | 10 | 1.7 | 13.3 | −107.3 | 105.9 | −47.2 | −41.9 | −23.0 | −9.4 | CPRA | 2.8 |
| 149 | 83 | ≥ 0.1 | 16 | 2.3 | 13.2 | 34.5 | 13.1 | 73.8 | −10.3 | −20.5 | 5.6 | UPK612 | 4.2 |
| 152 | 122 | ≥ 0.1 | 11 | 2.4 | 9.0 | −85.5 | −55.8 | 66.0 | −33.4 | −14.5 | −16.3 | STOC2 | 4.2 |
| 154 | 168 | ≥ 0.1 | 11 | 2.0 | 12.6 | 30.7 | −162.9 | −28.9 | −35.1 | −18.5 | −7.5 | LUPIII | 5.1 |
| 157 | 64 | ≥ 0.1 | 18 | 2.4 | 15.0 | 47.4 | −12.9 | −31.7 | −19.4 | −3.4 | −15.5 | COL135 | 5.6 |
| 158 | 126 | ≥ 1 | 12 | 3.0 | 12.3 | 23.4 | 107.7 | 61.7 | −12.7 | −3.6 | −9.5 | OCTN | 1.5 |
| 159 | 125 | 0.1–0.7 | 13 | 2.9 | 8.6 | 24.0 | 121.3 | 20.2 | −13.0 | −8.9 | −9.5 | STOC12 | 1.3 |
| 162 | 70 | 0.1–0.7 | 14 | 1.9 | 8.9 | 23.4 | −59.0 | 28.9 | −17.7 | −3.8 | −12.3 | SPL5 | 2.8 |
| 181 | 155 | ≥ 0.1 | 11 | 2.6 | 13.4 | −103.7 | −111.5 | 27.0 | −32.9 | −17.9 | −8.2 | UPK552 | 4.0 |
| 182 | 149 | 0.1–2 | 12 | 1.7 | 4.3 | −53.9 | 84.3 | 110.4 | −14.5 | −22.3 | −3.4 | TAUMGLIU21 | 1.5 |
| 184 | 137 | 0.7–1.2 | 11 | 2.1 | 4.9 | −95.5 | −82.6 | 52.5 | −29.4 | −19.2 | 2.2 | CARN | 5.9 |
| 188 | 155 | 0.1–2 | 14 | 1.3 | 7.6 | −111.5 | −62.3 | −87.8 | −14.1 | −29.1 | −4.8 | MOPH | 4.6 |
| 192 | 71 | ≥ 0.1 | 14 | 2.7 | 4.3 | −0.5 | −15.0 | 69.1 | −24.3 | −8.4 | −8.1 | COL69 | 3.5 |
| 198 | 47 | 0.1–0.7 | 11 | 2.9 | 6.9 | −27.3 | 36.9 | 10.3 | −34.5 | −13.6 | −10.7 | UPK552 | 3.7 |
| 199 | 151 | ≥ 0.1 | 21 | 1.6 | 5.9 | 100.4 | −84.2 | −75.0 | −36.9 | −11.5 | −3.8 | PL10 | 4.1 |
| 200 | 160 | ≥ 0.1 | 14 | 2.0 | 12.7 | 0.3 | −129.7 | 94.3 | −28.1 | −16.2 | −5.2 | BH23 | 2.0 |
| 210 | 89 | 1–3 | 18 | 1.7 | 6.9 | 45.8 | −55.3 | 52.6 | −32.5 | −13.7 | 0.5 | UBC12 | 6.3 |
| 213 | 59 | 0.1–0.7 | 11 | 2.4 | 9.6 | −41.0 | 41.8 | 6.5 | −41.2 | −19.3 | −10.5 | CPRA | 1.7 |
| 222 | 80 | 0.1–0.7 | 14 | 1.6 | 11.4 | −34.1 | 13.8 | 70.6 | −19.1 | −18.5 | −7.6 | NGC6633 | 2.2 |
| 224 b | 47 | 0.1–0.7 | 28 | 2.0 | 5.5 | 9.6 | 17.3 | 42.4 | −16.2 | −20.6 | −3.9 | UTAU | 1.0 |
Notes. The last two columns indicate the nearest known association in UVW-space with the bulk UVW separation in kilometers per second. The association names are shortened as described here: UPK 535 open cluster (UPK535); UBC 8 open cluster (UBC8); COIN-Gaia 13 open cluster (COINGA13); Collinder 350 open cluster (COL350); ASCC 21 open cluster (ASCC21); Turner 5 open cluster (TURN5); Ruprecht 98 open cluster (RUP98); NGC 7092 open cluster (NGC7092); NGC 7092 corona (CNGC7092); Stock 10 open cluster (STOC10); Turner 5 open cluster (TURN5); Praesepe corona (CPRA); UPK 612 open cluster (UPK612); Stock 2 open cluster (STOC2); Lupus III subgroup (LUPIII); Collinder 135 open cluster (COL135); Octans-Near association (OCTN); Stock 12 open cluster (STOC12); Platais 5 system (SPL5); UPK 552 open cluster (UPK552); Taurus Moving Group Jiaming Liu 21 (TAUMGLIU21); Carina-Near moving group (CARN); μ Oph association (MOPH); Collinder 69 open cluster (COL69); UPK 552 open cluster (UPK552); Platais 10 open cluster (PL10); BH 23 open cluster (BH23); UBC 12 open cluster (UBC12); Praesepe corona (CPRA); NGC 6633 open cluster (NGC6633); and u Tau association (UTAU).
a Median values are reported here. b We recovered two co-moving exoplanet-hosting stars (TOI–2076 and TOI–1807) in Crius 224, which were discussed by Hedges et al. (2021), who suggested that they may be part of a small ≈200 Myr old moving group.Download table as: ASCIITypeset image
3.2. Nearby Moving Groups Not Recovered
There are a few relatively well-studied nearby moving groups that were notably not recovered in our clustering analysis of the solar neighborhood. These groups are discussed further below.
3.2.1. TW Hya Association
The TW Hya association (Kastner et al. 1989; de la Reza et al. 1997) was likely not recovered because it lacks a significant number of members with F and G spectral types—in fact, no members of this association are currently known with spectral types in the range A2–K5 (Gagné et al. 2017). Given that the G-band magnitude limit of Gaia DR2 radial velocity measurements is G ≈ 13 and the distance distribution of known TWA members is 50–80 pc (Gagné et al. 2017), we can expect to have Gaia DR2 radial velocities for TWA members with absolute G-band magnitudes in the range 8.5–9.5, corresponding to spectral types M0–M2. 8 Only five known members of TWA have radial velocity measurements in Gaia DR2, the latest-type of which is CD–29 8887 (M1.5), consistent with the magnitude constraint for Gaia DR2 radial velocities. As a consequence of this fact, only four known members of the TW Hya association were included in our input sample because other members lack Gaia DR2 radial velocity measurements, and one member has a large RUWE value of 8.8.
3.2.2. Carina-Near Moving Group
Although the Carina-Near moving group (Zuckerman et al. 2006) did not appear to have been recovered in our analysis, Crius 209, which was not studied further because of its large median absolute deviations in Z (36.9 pc) and W (3.0 km s−1), seems at least partially related to Carina-Near. Four members of Crius 209 are also known members of Carina-Near, however, nine other members are in common with the "Greater Sco-Cen" region defined by Kerr et al. (2021). A more detailed follow-up of Crius 209 will be required to determine whether it was simply subject to contamination by Sco-Cen, which caused it to be rejected in our analysis.
3.2.3. Argus Association
The physical nature of the Argus association (Torres et al. 2008) was called into question based on an isochrone analysis by Bell et al. (2015), suggesting that it was subject to a high level of contamination or constituted a random collection of stars that happened to share similar UVW-space velocities. More recently, Zuckerman (2018) provided further evidence that Argus may be a coeval association by assembling a cleaner list of members that displayed a more consistent population in the color–magnitude diagram as well as several debris disk host stars, and provided an age estimate of 40–50 Myr. The Argus association has long been tentatively associated with the IC 2391 open cluster, and Gagné et al. (2021) hypothesized that Theia 114 and 115 of Kounkel & Covey (2019), along with the Argus association, may constitute extended tidal tails around IC 2391. Although Crius 193 and Crius 196 seem related to Theia 115 and IC 2391, respectively, we find no significant spatial overlap between them and the Zuckerman (2018) list of Argus members. This is likely not a consequence of the selection cuts we have imposed on our input sample, given that it contains 29 members of the Zuckerman (2018) Argus sample.
3.2.4. AB Dor Moving Group
The AB Dor moving group (ABDMG; Zuckerman et al. 2004) is a well-studied  Myr old (Bell et al. 2015; Gagné et al. 2018b) group whose members are distributed across all directions in a local bubble of ≈ 140 pc diameter around the Sun. Mamajek (2016b) noted that, while the nucleus of members at distances of 15–50 pc from the Sun defined by Zuckerman et al. (2004) is a convincing coeval and co-moving population, the status of other members is less clear due to their wider spread in Galactic positions and space velocities. Furthermore, Barenfeld et al. (2013) found that only half of a 10-star sample in the stream ABDMG members have a coherent chemical composition, indicating that the stream members are highly contaminated at best.
More recently, Kounkel & Covey (2019) identified Theia 301, a very large structure that appears co-moving and coeval with the ABDMG, which Gagné et al. (2021) hypothesized may correspond to the still missing corona around the Pleiades open cluster, along with the ABDMG. It is unclear why most core members of the ABDMG were not recovered in this analysis, given that 22/35 of the core members and 89 further members are included in our input sample. Crius 231 (30 members) is clearly related to the ABDMG, with which it shares 18 members, but those are preferentially located in the vicinity of Theia 301. This indicates that perhaps current membership lists of the ABDMG are either contaminated by a large number of random interlopers, or it may consist of more than one distinct population as hypothesized by Mamajek (2016b).
3.2.5. Octans Association
Although the relatively well-studied 30–40 Myr old Octans association (Murphy & Lawson 2015) was not recovered in this section, we found that Crius 164 (78 members), with a Z median absolute deviation slightly above our selection criterion (15.1 pc), shares common members and kinematics with the more distant half of the spatial distribution of Octans. It remains unclear why we have not recovered the other nearby half of Octans in this analysis.
3.2.6. Pisces Moving Group
Binks et al. (2015, 2018) have recently identified a new candidate moving group, which they named the "Pisces Moving Group" from a list of nearby young stars that are not members of other known young associations, and they determined an age of about 30–50 Myr for the group of 14 stars, based on a color–magnitude diagram of its low-mass members. Recently, Gaia EDR3 data provided full kinematics for all members of this putative group, and the wide resulting distributions in UVW-space velocities make its physical nature questionable as a single coeval association. The standard deviations in UVW are larger than typical coeval groups of such a young age (5.3, 6.2, and 4.2 km s−1, respectively) and the median absolute deviations are also large (2.6, 4.3, and 4.5 km s−1), indicating that the standard deviations are not driven by a small number of outliers.
There are, however, two possible slight overdensities in the UVW distribution of the original Pisces moving group members, with standard deviations typically near or below 1 km s−1. We will refer to these putative subgroups as "Subgroup 1" (with members HQ Psc, GP Psc, CH Ari, and CF Ari) grouped around UVW = (− 11.9, − 5.8, − 4.1) = (−;11.9, −5.8, −4.1) km s−1 with standard deviations of (1.3, 1.0, 1.9) km s−1; and "Subgroup 2" (with members TYC 5770–457–1, V395 Peg, TYC 584–343–1, and 2MASS J23494539+3126272), grouped around UVW = (− 10.0, − 0.4, = (−10.0, −0.4, − 8.3) km s−1 (hence, 7.7 km s−1 apart from Subgroup 1), with standard deviations of (0.8, 1.8, 0.7) km s−1. We note that these two subgroups are also clustered spatially, with all four stars of Subgroup 1 falling below the Z = 0 plane, and all stars of Subgroup 2 falling above it, further suggesting that they are likely distinct populations.
While a Gaia color–magnitude diagram of the three earlier-type (G8–K1) members of Subgroup 1 seems consistent with an age of ≈20 Myr, the K3-type star GP Psc falls significantly below the expected young sequence, closer to what could be expected for ≈110 Myr old Pleiades members. GP Psc is also the most outlying member of Subgroup 1 in UVW-space, at 3.3 km s−1 from the locus of the other three members. Taking GP Psc out from the list of Subgroup 1 members shifts their median positions to UVW = (− 11.9, − 5.8, − 5.1) = (−11.9, −5.8, −5.1) km s−1 with updated standard deviations of (0.4, 1.1, 0.6) km s−1.
The members of Subgroup 2 (G8–K2) are all consistent with color–magnitude sequences of known associations with ages in the range 45–110 Myr, and therefore appear slightly older than Subgroup 1. We note, however, that both of these subgroups are made of extremely small samples, and they are therefore not immediately convincing cases for new coeval associations. For the current purpose of comparing the Pisces moving group members to Crius groups, however, we found it necessary to first construct sets of stars within the Pisces moving group with consistent space velocities to avoid comparisons with spurious members.
After this revision of the Pisces moving group members, we have verified whether any members of a Crius group fell within 50 pc of each individual member of the Pisces Subgroups 1 and 2, and determined which of these individual stars fell closest to each Pisces star in UVW-space. In the case of Pisces Subgroup 1, we have found that two-thirds of its members fall within 3 km s−1 and 50 pc of a star in Crius 169. Indeed, the members of Subgroup 1 appear to be located on the edge of both the spatial and kinematic distributions of Crius 169 members, which we have associated with the 30–40 Myr old Greater Taurus Subgroup 4 of Kerr et al. (2021).
The case of the Pisces Subgroup 2 is a bit less straightforward; one of its members (TYC 5770–457–1) is located within the spatial-kinematic of the locus of Crius 173 members, but we have rejected this Crius group from our detailed analysis because of its high dispersion in the Z-direction (about 18 pc), but we note here that its color–magnitude diagram would indicate an age of at least 100 Myr if it were a coeval group. Two additional members of Subgroup 2 appear consistent with the spatial and kinematic distributions of Crius 153, which corresponds to the ≈220 Myr-old Theia 372 group of Kounkel & Covey (2019).
Following these considerations, we consider that while some members of the putative Pisces moving group seem related to Crius 173, Theia 372, and Greater Taurus Subgroup 4, the Pisces moving group itself is likely a spurious compilation of unrelated relatively young stars that fall in a similar vicinity of the XYZUVW volume.
3.2.7. Ursa Major Cluster
We have further investigated whether one of the Crius groups recovered here may correspond to a candidate extension of the Ursa Major cluster (e.g., King et al. 2003), potentially extending it toward the more distant candidate tidal tails identified by Gagné et al. (2020b) from an investigation of the Theia groups of Kounkel & Covey (2019). We found that Crius 141 (84 members) appears to match the UVW distribution of the core Ursa Major members and seems more widely distributed spatially, potentially toward the five Theia groups that may constitute the tidal tails of Ursa Major (see Figure 6). However, Crius 141 was not included in our detailed study of Crius groups because of its median absolute deviation of 16.5 pc in Z, which is slightly above our 15 pc selection criterion. In fact, Crius 141 shares four stars in common with the core list of King et al. (2003), four with their list of Ursa Major "stream" members, and two more with the candidate tidal tails of Gagné et al. (2020b). Further characterization of its members will be required to determine whether Crius 141 is related to the Ursa Major core.
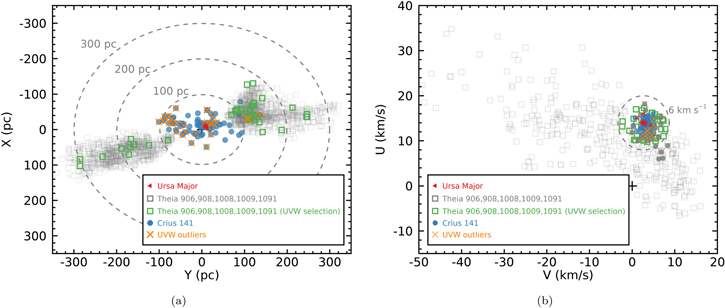
Figure 6. Galactic positions and space velocities of Crius 141 members compared with the Ursa Major core and the various Kounkel & Covey (2019) Theia groups tentatively identified as possible tidal tails around Ursa Major (Gagné et al. 2020b). Crius 141 may be associated with the missing part of the tidal tails not recovered by Kounkel & Covey (2019) due to projection effects, and is likely associated with the Ursa Major stream (or the "Sirius supercluster") of Eggen (1992). We identify stars with known 3D UVW-space velocities within 6 km s−1 of the Ursa Major core stars with a distinct color; we allow for a larger space velocity difference in this case because Crius 141 (and the other structures possibly associated with the Ursa Major core) display a large spread in UVW velocities.
Download figure:
Standard image High-resolution image3.3. Candidate New Associations
A total of 32 Crius groups passed our quality selection criteria and do not appear to correspond to a known coeval association of stars. These groups, which may correspond to new loose coeval associations, are listed in Table 6 and their median Galactic positions are shown in Figure 7. The typical number of stars in these new groups is in the range 10–28. When possible, we have assigned them with approximate age ranges based on their color–magnitude diagrams, the lower age range of which is based on the late-K or M stars compared with the empirical sequences of Gagné et al. (2021) constructed from members of nearby moving groups. The higher age range is based on a main-sequence turnoff of their OBA stars compared with the old clusters NGC 752 (1.2 Gyr; Cantat-Gaudin et al. 2020) and Ruprecht 147 (3 Gyr; Cantat-Gaudin et al. 2020). An example is displayed in Figure 5 for Crius 155. However, several of these putative new groups only have Gaia DR2 heliocentric radial velocities for their FGK members, which prevents a more accurate age-dating.

Figure 7. Median XY Galactic positions of the new candidate associations presented in this work (large, red stars), compared with other known associations in the literature (color-coded by age). Open symbols indicate "candidate" associations that have not yet been fully characterized, such as most of the Kounkel & Covey (2019) Theia groups. All new candidate associations are older than ≈ 100 Myr, and some of then are located well within 100 pc from the Sun.
Download figure:
Standard image High-resolution imageThe new candidate associations presented here still require detailed follow-up observations to determine their ages more precisely. The color–magnitude diagram positions of later-type members discovered either with a more detailed Bayesian analysis that does not require radial velocity measurements, radial velocity measurements or once Gaia DR3 is released with about 33 million heliocentric radial velocities will aid in that analysis. 9 Lithium measurements and rotation periods will also be important to constrain the ages of these putative new associations and further test whether their members are coeval. The identification of white dwarf members of these young associations will also be an interesting avenue to provide an independent age calibration; however, this will require an analysis that does not rely on heliocentric radial velocities given that they will not be available even in Gaia DR3.
3.4. Spatial Extensions of Known Associations
Several groups identified by Kounkel & Covey (2019) show an elongated spatial structure, and we might expect that some of these would extend to the immediate solar neighborhood (≲100 pc); however, most of the nearest Theia groups stop short of this region, likely because of projection effects that start to impact the efficiency of clustering algorithms in 2D tangential velocity space. Conversely, the Crius groups identified here will not extend to very far distances, in part due to our 200 pc selection cut on the input sample, but also because we only consider the brighter Gaia entries that benefit from heliocentric radial velocities in Gaia DR2. We might therefore expect that some of the Crius groups discovered here are in fact a spatial extension of previously discovered Theia groups, and we have identified 17 such cases where Crius groups share similar UVW velocities with Theia groups and form a spatial extension in the same plane in the Galactic Z-coordinate. These cases are listed in Table 7 and the individual distributions of Galactic positions and space velocities of these candidate extensions are shown in the Appendix. Nine of these newly discovered extensions do not match a known spatially localized core that would make it possible to categorize them as coronae; these cases therefore simply correspond to new spatial extensions of spatially loose groups of stars.
Table 7. Newly Discovered Extensions of Known Associations
| Crius | Known Association | ||
|---|---|---|---|
| ID | Distances (pc) | Name | Distances (pc) |
| Extensions within 60 pc | |||
| 155 | 50−121 | Theia 1005 | 65−92 |
| 168 | 51−161 | Theia 310 | 187−343 |
| 207 | 59−135 | Theia 677 a | 93−127 |
| 221 | 22−116 | Volans–Carina | 71−98 |
| 227 | 19−71 | Theia 209 | 82−124 |
| Other extensions | |||
| 131 | 80−191 | Theia 371 | 118−330 |
| 151 | 80−182 | Theia 677 b | 93−127 |
| 170 | 77−177 | Tofflemire et al. (2021) MELANGE–1, Theia 786 | 100−242 |
| 172 | 90−188 | Oh et al. (2017) Group 51, Theia 218 | 131−205 |
| 178 | 114−198 | NGC 2451A, Theia 118 | 122−797 |
| 190 | 171−191 | Oh et al. (2017) Group 23, Theia 599, Crius 202 | 123−497 |
| 202 | 75−174 | Oh et al. (2017) Group 23, Theia 599, Crius 190 | 123−496 |
| 215 | 170−199 | Theia 600 | 162−518 |
| 217 | 104−189 | RSG2, Oh et al. (2017) Group 16, Theia 214 | 167−327 |
| 226 | 93−191 | Oh et al. (2017) Group 59, Theia 209, Theia 133 b | 82−170 |
| Candidate extensions | |||
| 77 | 131−168 | Theia 1186 | 187−330 |
| 156 | 84−199 | Platais 3, Theia 787 | 102−518 |
Notes. We consider Crius 77 and Crius 156 candidate extensions of Theia 1186, Platais 3, and Theia 787 for now, given that their velocities are similar but slightly discrepant. Please see Section 3.4 for more details on extensions and candidate extensions listed here.
a Crius 151 only matches a subset of Theia 677, which seems to contain at least two distinct populations. Crius 207 matches the largest locus of Theia 677 members. b Crius 226 only matches a subset of Theia 133, which seems to contain at least two distinct populations.Download table as: ASCIITypeset image
The cases of Crius 168 and Crius 227 (displayed in the Appendix) are less straightforward because of a spatial gap between them and their corresponding Theia groups, but Gaia DR3 will likely determine without ambiguity whether they are physical extensions by bridging the gap with the radial velocities for fainter and more distant stars.
3.4.1. The MELANGE–1 Moving Group
Tofflemire et al. (2021) recently identified MELANGE–1, a new moving group at ≈100 pc from the Sun. This new association was identified following the serendipitous discovery that the young exoplanet host star HD 110082 was co-moving with a large number of other seemingly young stars. The kinematics of this group of stars, which include HD 110082, did not clearly match any previously known young association, suggesting that MELANGE–1 was likely a newly discovered moving group. Tofflemire et al. (2021) identified a total of 133 members of MELANGE–1 (including HD 110082) and combined available lithium measurements and rotation periods to determine an age of  Myr for the newly discovered MELANGE–1 ensemble. They further identified that this moving group would be a compelling extension to Theia 786, given its consistent color–magnitude diagram–based age (
 Myr), similar kinematics, and adjacent Galactic positions.
Although we have not recovered any known member of MELANGE–1 in our Crius groups, Crius 170 (10 members) shares similar space velocities and is adjacent to MELANGE–1 in Galactic positions, as shown in Figure 8. We have also independently identified Crius 170 as an extension of Theia 786 before identifying the similarity in UVW with MELANGE–1, and we also show Theia 94 in these figures because it has similar but slightly discrepant kinematics and it is located in the neighborhood of Theia 786 spatially. It is unclear at this point whether Theia 94 is related to Theia 786, Crius 170, and MELANGE–1, but it is likely to be a distinct subpopulation of a larger group at best. For now, we consider it likely that Crius 170, Theia 786, and MELANGE–1 are different spatial segments of the same coeval population of co-moving stars, and it will be interesting to investigate whether additional radial velocity measurements in Gaia DR3 will allow us to recover the full spatial extent of this population at once in a clustering analysis, and how Theia 94 fits in that picture.

Figure 8. Galactic positions and space velocities of Crius 170 that we have identified as a putative extension of Theia 786. Members of Theia 786 and MELANGE–1 with UVW velocities located within 3 km s−1 from the median bulk velocity of Crius 170 are marked with colored symbols, and the single Crius 170 member with outlier velocities is marked with an orange cross. Both Crius 170 and Theia 786 are also likely related with MELANGE–1, as noted by Tofflemire et al. (2021). Theia 94 seems unrelated but causes slight contamination due to its similar space velocities and Galactic positions. The position and velocity of the Sun are marked with a black crosshair, when inside the figure range.
Download figure:
Standard image High-resolution image3.4.2. Older Moving Groups Associated with the Taurus–Auriga Star-forming Region
Crius 216 (18 members) includes members of both the relatively poorly characterized 118 Tau association (Mamajek 2016a) and the  Myr old 32 Ori association first discovered by Mamajek (2007) and further characterized by Shvonski et al. (2010) and Bell et al. (2017). Currie et al. (2017) estimated that the age of the 118 Tau association seems older than the background Taurus–Auriga star-forming region based on its mid-M stars having Na I line strengths (Slesnick et al. 2006a, 2006b) comparable to members of the 10–16 Myr Scorpius-Centaurus complex (Pecaut & Mamajek 2016), and the lithium lines of its mid K-type stars being larger than those of typical 30–120 Myr old stars and comparable with those of members of the Cha association (3–8 Myr; Murphy et al. 2013; Dickson-Vandervelde et al. 2021). They have therefore assigned a plausible age range of 3–10 Myr for the 118 Tau association, slightly younger than the current estimates for the 32 Ori association. Kraus et al. (2017) noted that 118 Tau and 32 Ori have very similar kinematics with respect to each other, and are only separated from Taurus–Auriga members by 9 km s−1 in UVW-space, indicating that these three populations might correspond to individual but contiguous star formation events that originate from a single extended molecular cloud similar to Scorpius-Centaurus. Our independent recovery of members of the 118 Tau and 32 Ori associations within Crius 216, as well as a continuous set of stars that span their spatial and kinematic XYZUVW coordinates (shown in Figure 9), strongly favors the hypothesis of Kraus et al. (2017). This hypothesis can be further tested in the near future by characterizing the ages of stars in Crius 216 with lithium measurements, as well as an isochronal age determination of its missing M-type members that will be recovered with Gaia DR3.
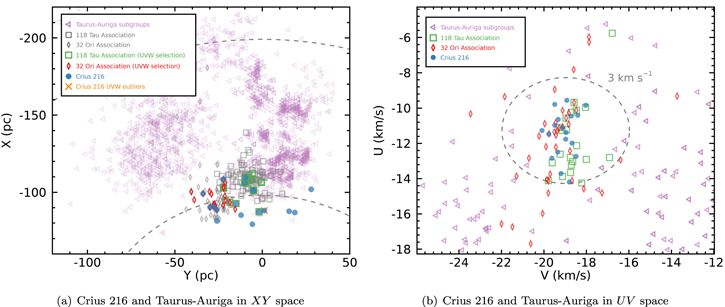
Figure 9. Galactic positions and space velocities of Crius 216 and various subgroups associated with the Taurus–Auriga star-forming region (Liu et al. 2021; Kerr et al. 2021). The subgroup corresponding to μ Tau (Greater Taurus Subgroup 1 of Kerr et al. 2021) is not shown, and the subgroups corresponding to the 118 Tau association (Greater Taurus Subgroup 6 of Kerr et al. 2021, and Group 11 of Liu et al. 2021) and the 32 Ori association (Greater Taurus Subgroup 7 of Kerr et al. 2021) are with separate symbols. Crius 216 includes members of both the 118 Tau and 32 Ori associations, and they have UVW velocities in the vicinity of other Taurus subgroups, consistent with the hypothesis that they represent contiguous star formation events related with the larger complex of Taurus–Auriga members.
Download figure:
Standard image High-resolution imageIt is interesting to note that HDBSCAN has not separated members of 118 Tau from 32 Ori even though we have used the "leaf" method that would encourage breaking such substructure into distinct groups. This could indicate that there are additional subpopulations of intermediate positions, ages, and space velocities distributed between the two associations, but a more detailed analysis based on Gaia DR3 that includes many more stars will be useful to assess this.
3.5. Coronae
Several of the extensions of known associations identified in Section 3.4 appear to be newly recognized coronae around known open clusters and other young associations. These are listed in Table 5, and maps of their XY Galactic positions and UV-space velocities are displayed individually in the Appendix. Figure 10 shows the spatial extent of these new coronae compared with those already known in the literature. It is perhaps not surprising that additional known associations also host extended coronae given that most well-studied, nearby, and dense open clusters have now been demonstrated to host similar structures (Meingast & Alves 2019; Meingast et al. 2019; Tang et al. 2019; Röser & Schilbach 2021), which likely correspond to tidal dissipation tails around the gradually degrading denser core of gravitationally bound stars. The main reason why these coronae were not previously recognized seems to be that they are related to less-well-studied, sparse open clusters (Platais 3, Alessi 9), or recently discovered associations (Volans–Carina, Groups 23, 51, and 59 of Oh et al. 2017 and RSG 2 of Röser et al. 2016). We also note that Crius 87 (24 members), which displays a large Z median absolute deviation (29.1 pc), initially appeared to form a candidate tidal tail around the UPK 612 open cluster of Cantat-Gaudin et al. (2020), but a closer inspection of its UVW-space velocities appears inconsistent with this hypothesis. However, Theia 216 of Kounkel & Covey (2019) appears to form a previously unrecognized corona around UPK 612, with mostly consistent kinematics (Figure 18, shown in the Appendix).
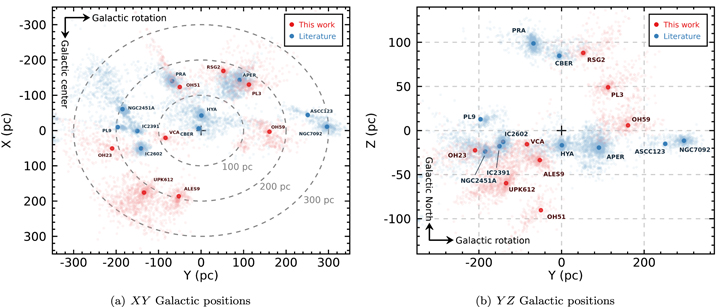
Figure 10. Galactic positions of the new coronae recognized in this work compared with those already known in the literature. With the exception of Oh 51, Platais 3, Oh 59, and Platais 9, most open clusters near the Sun lie in two distinct planes in Z, centered near Z ≈ −25 pc and Z ≈ 90 pc. The newly discovered corona around the 90 Myr old Volans–Carina association is the second closest known corona discovered so far, after that of the 680 Myr old Hyades association, and presents a unique opportunity for the search and characterization of its substellar members. Parts of the coronae shown here appear to be distributed along the line of sight, which is likely an artifact due to non-negligible parallax measurement errors. As shown by Meingast et al. (2021), a proper spatial deconvolution of these measurement errors shows coronae that are flat in the Z-direction and not preferentially aligned along the line of sight, but distributed along a spatial axis in the XY-plane that is unique to each open cluster. The contracted figure tags correspond to the following associations: PL9: Platais 9; ALES9: Alessi 9; PRA: Praesepe; VCA: Volans–Carina association; CBER: Coma Ber; HYA: Hyades; APER: α Persei; and PL3: Platais 3.
Download figure:
Standard image High-resolution imageThe case of Volans–Carina ( Myr; Gagné et al. 2018a) is particularly interesting (see Figure 11), because its candidate corona (Crius 221, 67 members) seems to reach within the immediate solar neighborhood, with a member at 22 pc from the Sun. This nearest member is the K1V-type, debris disk hosting star V419 Hya, the activity index
  (Isaacson & Fischer 2010) of which is consistent with an age of 80–120 Myr (Mamajek & Hillenbrand 2008), and displays Ca II and X-ray emission consistent with an age of ≈ 100 Myr (Song et al. 2004). It will be particularly interesting to study its substellar population in the near future. In addition to these newly recognized coronae, we note that Crius 178 (55 members) may form a slight extension of the NGC 2451A corona toward the Sun.
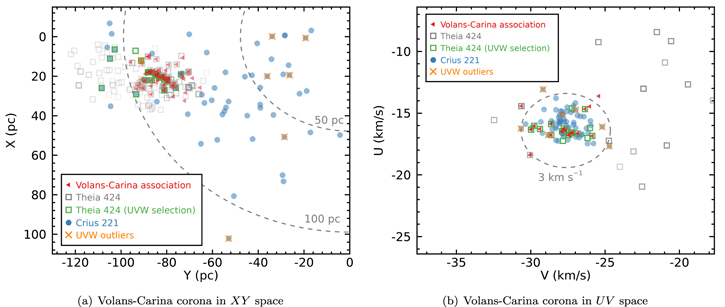
Figure 11. Galactic positions and space velocities of Crius 221, which likely corresponds to the front-facing tidal dissipation tail (or "corona") of the 90 Myr old Volans–Carina association. Stars with full 3D UVW kinematics consistent with the core members of Volans–Carina within 3 km s−1 are indicated with distinct symbols; other stars will need heliocentric radial velocity measurements for their membership to be fully confirmed. This young structure that reaches within 22 pc of the Sun will be a valuable laboratory to study young exoplanets such as TOI–1224 b as well as substellar objects.
Download figure:
Standard image High-resolution image3.6. Projection Effects and Their Impact on Previous Clustering Analyses
We show in Figure 12 the spreads in properties 10 for the Crius groups, compared with the Theia groups of Kounkel & Covey (2019) to better demonstrate the impact of projection effects on the ability to recover clusters of stars with coherent UVW velocities when relying on only the projected tangential velocities of their members. The Crius groups show on average tighter UVW distributions compared with Theia groups, even before our kinematic selection criteria are applied. This is probably due at least in part to the fact that Kounkel & Covey (2019) did not include Gaia DR2 heliocentric radial velocities in their analysis, and therefore any star with an available radial velocity that is in reality an interloper that just happens to share a similar 2D tangential velocity with a Theia group will significantly impact our calculation of the Theia group's UVW spread. Despite the Crius groups having small UVW dispersions, the fact that their members are spread on the sky causes them to display larger spreads in tangential velocities, on average. The distribution of the Z median absolute deviations of Crius groups are generally in line with those of Theia groups.

Figure 12. Spread in properties as a function of distance for the new Crius candidate coeval associations presented here (red, filled circles), the other Crius groups that we have rejected based on various quality cuts (gray, open circles), and the Theia groups of Kounkel & Covey (2019). We show the median absolute deviations (MAD) instead of standard deviations to avoid the exaggerated impact of outliers due to low-quality measurements. These distributions outline how the large spread of sky coordinates at nearby distances can drive a larger spread in tangential velocities. Crius groups show much smaller UVW spreads compared with average Theia groups, as described in Section 3.6. The spreads in the Z-coordinate of Crius groups are comparable to those of the Theia groups, as should be expected.
Download figure:
Standard image High-resolution image3.7. Known Exoplanet Systems
We cross-matched the members of Crius groups with the Gaia DR2 source identifiers of exoplanet host stars in the NASA exoplanet archive 11 and the NASA list of TESS exoplanet candidates (Stassun et al. 2019) to determine whether additional exoplanet systems had been recovered in our analysis and may potentially benefit from future age constraints based on their host associations. The results of this cross-match are listed in Table 8. We recovered 11 confirmed exoplanet systems in Crius groups that correspond to known associations or open clusters, and which memberships had previously been discussed in the literature, and five additional TESS candidate exoplanet systems in Crius groups that we have matched to known young associations, but for which memberships had not been discussed in the literature to our knowledge.
Table 8. Known Exoplanet Host Stars Recovered in Crius Groups
| NASA | Simbad | Crius | ||
|---|---|---|---|---|
| Exoplanet IDs | Host ID | Reference | ID | Notes |
| Confirmed exoplanets in new Crius groups | ||||
| HD 103949 b | HD 103949 | 1 | 162 | New 100–700 Myr Crius group |
| TOI–1807 b | BD+39 2643 | 2 | 224 | Previously suspected 180–200 Myr moving group |
| TOI–2076 b, c, d | BD+40 2790 | 2 | 224 | Previously suspected 180–200 Myr moving group |
| Exoplanet candidates in new Crius groups | ||||
| TOI–1598 b | BD+36 344 | 3 | 109 | New ≥ 100 Myr Crius group |
| TOI–2481 b | TYC 103–445–1 | 3 | 121 | New ≥ 100 Myr Crius group |
| TOI–2133 b | UCAC4 614–055633 | 3 | 205 | New 100–700 Myr Crius group |
| Exoplanet candidates with newly recognized host associations | ||||
| TOI–2048 b | TYC 3496–1082–1 | 3 | 147 | Oh et al. (2017) Group 10 |
| TOI–447 b | HD 33512 | 3 | 164 | Octans association |
| TOI–4364 b | PM J05202–0414 | 3 | 214 | Corona of the Hyades |
| TOI–1224 b | UCAC4 046–001384 | 3 | 221 | Corona of Volans–Carina |
| TOI–1990 b | TYC 8613–1781–1 | 3 | 235 | Corona of IC 2602 |
| Confirmed exoplanets for which membership is already known | ||||
| HD 63433 b, c | HD 63433 | 4 | 141 | Ursa Major "moving group" |
| K2–100 b | K2–100 | 5 | 187 | Praesepe open cluster |
| K2–102 b | K2–102 | 5 | 187 | Praesepe open cluster |
| Pr0201 b | BD+20 2184 | 6 | 187 | Praesepe open cluster |
| Pr0211 b, c | 2MASS J08421149+1916373 | 6,12 | 187 | Praesepe open cluster |
| K2–101 b | K2–101 | 5 | 187 | Praesepe open cluster |
| K2–136 b, c, d | K2–136 | 7 | 214 | Hyades association |
| HD 285507 b | HD 285507 | 8 | 214 | Hyades association |
| AU Mic b, c | AU Mic | 9,13 | 220 | β Pic moving group |
| DS Tuc A b | HD 222259A | 10 | 233 | Tuacana-Horologium association |
| TOI–837 b | CPD–63 1435 | 11 | 235 | IC 2602 |
References. (1) Feng et al. (2019); (2) Hedges et al. (2021); (3) Stassun et al. (2019); (4) Mann et al. (2020); (5) Mann et al. (2017); (6) Quinn et al. (2012); (7) Mann et al. (2018); (8) Quinn et al. (2014); (9) Plavchan et al. (2020); (10) Newton et al. (2019); (11) Bouma et al. (2020); (12) Malavolta et al. (2016); (13) Martioli et al.(2021).
Download table as: ASCIITypeset image
In addition to these, we have uncovered the two TESS exoplanet host stars TOI–1807 (204 ± 50 Myr) and TOI–2076 (180 ± 40 Myr) of Hedges et al. (2021) in Crius 224. These two exoplanet host stars were first noted by Hedges et al. (2021) as co-moving as well as being coeval despite their unusually large 12.5° separation on the sky. Oh et al. (2017) had also recovered these two stars as a likely binary pair based on their similar kinematics using Gaia DR1 data (in their Group 3914, with only two members). However, the large separation led Hedges et al. (2021) to hypothesize that they might be members of an ≈ 200 Myr old stream of co-moving stars , of which other members might have thus far escaped detection. This system also escaped further investigations of likely new coeval associations contained in the Oh et al. (2017) groups (e.g., see Faherty et al. 2018) because this particular group included only two stars. Nardiello et al. (2022) also investigated 24 possible stars co-moving with these two exoplanet hosts, and used lithium equivalent width measurements and TESS rotation periods to estimate an age of 300 ± 80 Myr for the group. We have recovered both stars as members of Crius 224 (28 members), and found that its members are consistent with an age of 100–700 Myr based on their color–magnitude position. This is yet another scenario similar to MELANGE–1 that is suggestive of the validity of the newly discovered groups presented here, which have likely escaped detection prior to Gaia because of their low spatial density and slightly older age, which prevented a discovery based on their X-ray or near-UV-bright members or more massive, early B-type stars.
Moreover, we have uncovered one additional confirmed radial velocity exoplanet (HD 103949b; Feng et al. 2019) in the newly discovered 100–700 Myr candidate association Crius 162 (14 members) and three additional TESS exoplanet candidates (TOI–1598b, TOI–2481b, and TOI–2133b; see Stassun et al. 2019) in three additional new candidate associations (Crius 109, ≥ 100 Myr with 16 members; Crius 121, ≥ 100 Myr with 13 members; and Crius 205, 100–700 Myr with 12 members, respectively). To our knowledge, no age constraints are currently available for HD 103949 b, TOI–1598 b, TOI–2481 b, and TOI–2133 b. It will be particularly interesting to fully characterize Crius 162, 109, 121, and 205, given that exoplanet systems with well-calibrated ages are rare and will provide valuable information about their early evolution.
3.8. Tracebacks of Oh 59 and α Persei
Among the likely extensions of known associations discussed in Section 3.4, Crius 226 (23 total members) seems related to the α Persei open cluster, Group 59 of Oh et al. (2017), Theia 133, and Theia 209. Figure 13 shows that the kinematics of Crius 226 are consistent with a number of stars in Theia 209 and a small subset of Theia 133 members, whereas they tentatively form a bridge between the two spatially distinct structures in the XY-plane. Furthermore, a large fraction of Theia 133 members have kinematics significantly discrepant with Crius 226, and are instead clearly related to the α Persei open cluster and its corona, as noted by Kounkel & Covey (2019). It seems likely that Theia 133 is therefore composed of two populations with distinct kinematics, only one of which may be directly related to Crius 226 and Theia 209, which together may span distances in the range ≈ 100–200 pc, partially overlapping with the corona of α Persei. Kounkel & Covey (2019) estimated an age of ≈160 Myr for Theia 209 (relatively well constrained by the two B8 stars 27 Vul and bet02 Cyg, as well as 7 ≥ M5 members), slightly older than the lithium depletion boundary age of α Persei (90 ± 10; Stauffer et al. 1999). The color–magnitude diagram of Crius 226 is indicative of an age of ≈ 100 Myr or older, consistent with the age of Theia 209.
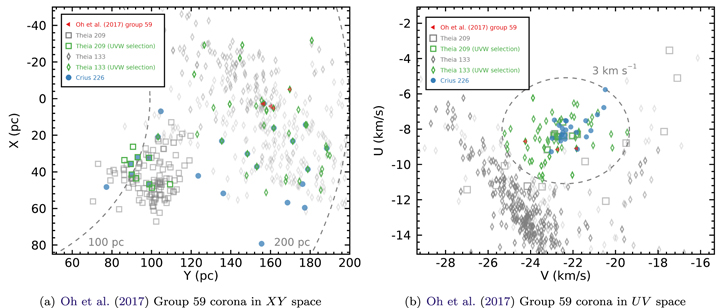
Figure 13. Galactic positions and space velocities of Crius 226, which likely correspond to a corona around Group 59 of Oh et al. (2017). Theia 209 of Kounkel & Covey (2019) seems associated with the near side of Crius 226, and a small fraction of Theia 133 seems associated with its far side; however, Theia 133 also includes a much larger population of stars associated with the α Persei open cluster and its corona, the kinematics of which are discrepant with Crius 226 and Group 59 of Oh et al. (2017).
Download figure:
Standard image High-resolution imageBecause of their similar kinematics and spatial overlap, we investigated whether α Persei and Group 59 of Gaia Collaboration et al. (2016) might have collided in the recent past, using the dynamical traceback approach of D. Couture et al. (2022, in preparation). 12 Independent backward Galactic orbits were integrated for every member of α Persei and Group 59 with the galpy Python package (Bovy 2015) using the Galactic potential model I from Irrgang et al. (2013) for 100 Myr into the past.
The resulting mutual median distances over time between α Persei and Group 59 are shown in Figure 14. Although the Galactic positions of individual stars become gradually more uncertain as they are projected further in the past, the median positions of the clusters are less affected because of their large number of members. This fact is also much less important in the Z-direction, because stars in our sample are gravitationally bound to the Galactic plane. We found that the two groups came at their closest approach ≈ 39 Myr ago, while they crossed the same plane in the Z-direction twice in the past 100 Myr, ≈ 38 and ≈ 77 Myr ago. However, their respective median positions have never been closer than ≈ 260 pc, which excludes an overlap of their spatial distributions even at three times the median absolute deviation of their current membership distributions, even when including the backward projected measurement errors at this epoch (see Figure 14). We find that it is therefore unlikely that these two associations are related to each other, unless significant systematics remain in the Galactic potential of Irrgang et al. (2013b; see also Bovy 2015), or other collision events that would significantly affect the relative positions of Oh 59 and α Persei in the recent past.
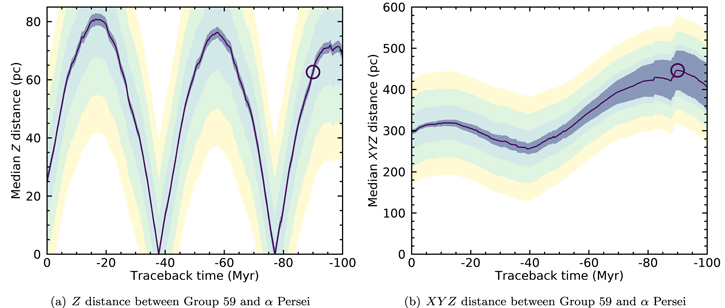
Figure 14. Distances between the median position of α Persei and Group 59 (Oh et al. 2017) members as a function of time in their past trajectories around the Galaxy. The left panel shows the distance along the Z-position only, and the right panel shows the 3D distance in XYZ Galactic position. The thick, dark purple line indicates the distances between the median positions, and the associated purple shaded regions around the thick lines indicate the measurement errors on the median distances, which increases over traceback time, especially in the XY-directions given that the locations of individual members become uncertain as the initial measurement uncertainties grow over time. The three additional shaded regions indicate areas of overlap at one, two, and three times the median absolute deviation of the distribution of the α Persei and Group 59 members at the current epoch. This indicates whether the two groups might overlap near the edges of their spatial extent, assuming that the shape of the associations do not change significantly over time. The purple circles indicate the epoch of formation of α Persei. Group 59 of Oh et al. (2017) is likely ≈ 160 Myr old based on the age of Theia 209, outside of the traceback range. Although the two associations crossed each other in the Z-dimension ≈ 38 and ≈ 77 Myr ago, their 3D distributions do not seem to significantly overlap at any point in the past 100 Myr.
Download figure:
Standard image High-resolution image4. Conclusions
We present a clustering analysis of the solar neighborhood using Gaia EDR3 entries in order to reconstruct their full 6D XYZ Galactic positions and UVW-space velocities. This allowed us to recover most of the known nearby associations as well as a number of new moving groups and co-moving structures within 200 pc of the Sun, which was previously hindered by projection effects at such nearby distances. A detailed study of these clustered stars allowed us to identify new groups of stars, including:
- 1.Thirty-two candidate new coeval associations whose color–magnitude diagrams are consistent with ages older than ≈ 100 Myr;
- 2.Eight newly found coronae of nearby open clusters, including a corona associated with the Volans–Carina associations that reaches within 22 pc from the Sun;
- 3.Nine spatial extensions of Theia groups (Kounkel & Covey 2019) that do not seem to form coronae around spatially denser open cluster cores;
- 4.A potential spatial extension (Crius 170) of the MELANGE–1 association of Tofflemire et al. (2021);
- 5.The discovery of a moving group (Crius 224), the existence of which was hypothesized by Hedges et al. (2021) following the discovery of two exoplanet host stars (TOI–1807 and TOI–2076) with similar velocities but large angular separations;
- 6.Additional evidence for the Kraus et al. (2017) hypothesis that the 118 Tau and 32 Ori associations may be part of contiguous star-forming events related with the greater Taurus–Auriga star-forming region;
- 7.Newly recognized host associations for three previously known confirmed exoplanets and eight TESS candidate exoplanets, making it possible to improve the age estimates of these systems.
This study hints that the vastly improved radial velocity coverage of Gaia DR3 will likely allow us to significantly further our understanding of kinematic structures in the solar neighborhood, and these new comoving populations will be especially useful to study young, age-calibrated exoplanets and substellar objects.
We thank the anonymous reviewer for the extremely useful feedback and thorough comments. This research has made use of the NASA Exoplanet Archive, which is operated by the California Institute of Technology, under contract with the National Aeronautics and Space Administration under the Exoplanet Exploration Program. This research made use of the SIMBAD database and VizieR catalog access tool, operated at the Centre de Données astronomiques de Strasbourg, France (Ochsenbein et al. 2000). This work presents results from the European Space Agency space mission Gaia. Gaia data are being processed by the Gaia Data Processing and Analysis Consortium (DPAC). Funding for the DPAC is provided by national institutions, in particular the institutions participating in the Gaia MultiLateral Agreement. The Gaia mission website is https://www.cosmos.esa.int/gaia. The Gaia archive website is https://archives.esac.esa.int/gaia. This research used the HDBSCAN Clustering Library. The documentation regarding the algorithm can be found at the following website :https://hdbscan.readthedocs.io/en/latest/index.html. J.F. acknowledges support from NASA TESS award 80NSSC21K0792 as well as support from the Heising Simons Foundation. J.G. acknowledges the support of the Natural Sciences and Engineering Research Council of Canada (NSERC), funding reference number RGPIN-2021-03121.
Facility: Exoplanet Archive - .
Appendix
Figure 15–17 show the candidate spatial extensions of distant groups recovered in this analysis, as discussed in Section 3.4. XY Galactic positions are shown to illustrate how the Crius groups are displayed such as to potentially form extensions around the known associations; we do not show the Z-direction because known groups and newly discovered candidate extensions are in the same Z-plane, as would be expected for coeval populations. The UV-space velocities are also shown and compared with a 3 km s−1 circular region around that of the known young association or the new Crius group if the known association displays a large kinematic scatter.

Figure 15. Galactic positions and space velocities of Crius groups that we have identified as putative extensions of generally more distant, known associations. Groups that are significantly extended on the sky will show large variations in observed tangential motions, causing clustering algorithms to recover them less efficiently unless they work in 3D UVW-space directly. Theia 1005 may be much more spatially extended than previously recognized in the XY-plane (top-row panels). Both Crius 151, Crius 205, and Crius 207 (bottom-row panels) were all associated with Theia 677 of Kounkel & Covey (2019), indicating that Theia 677 may be composed of distinct populations, the largest fraction of which likely corresponds to Crius 205 and Crius 207. These latter two appear as a potentially coeval population with a slightly bimodal density in XYZUVW-space, whereas Crius 151 shows significantly different kinematics and may therefore correspond to a distinct population that contaminated Theia 677 in part.
Download figure:
Standard image High-resolution image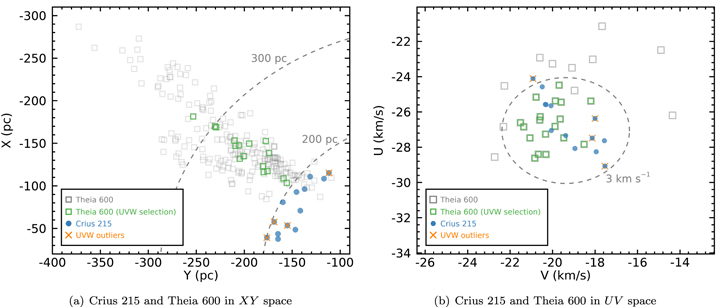
Figure 16. Galactic positions and space velocities of Crius groups that we have identified as putative extensions of generally more distant, known associations. Crius 215 is a possible slight extension of Theia 600, perhaps corresponding to the forefront of the bimodal structure seen at larger distances.
Download figure:
Standard image High-resolution image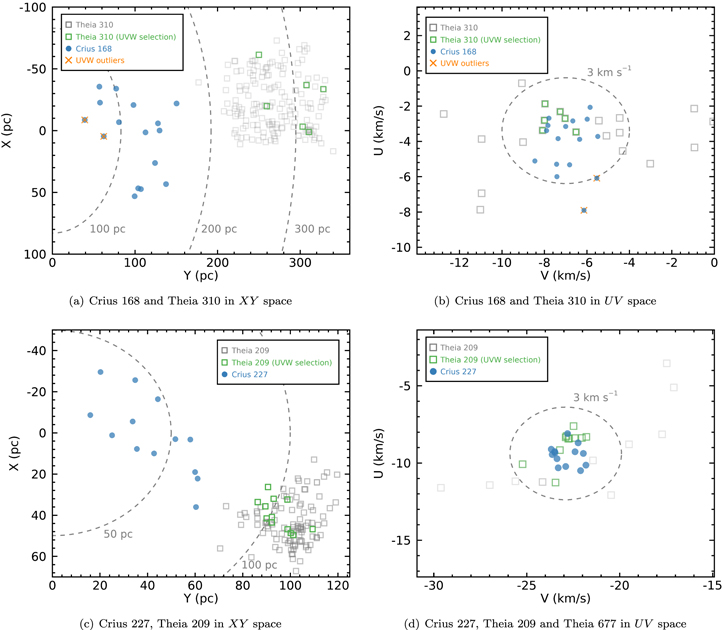
Figure 17. Galactic positions and space velocities of Crius groups that we have identified as putative extensions of generally more distant, known associations. Theia 310 of Kounkel & Covey (2019), in the top-row panels, may be spatially more extended than previously recognized along our line of sight, reaching within 100 pc of the Sun. The gap at 200 pc may be due to a low recovery rate by Kounkel & Covey (2019) caused by projection effects (the larger parallax correlates with larger tangential motions), and a low recovery rate in our study due to the lack of radial velocity measurements in Gaia DR2 at these farther distances. A similar structure is observed for Crius 227 and Theia 209, although the gap in members is located at closer distances (≈ 80 pc), and the putative spatial extension reaches well within the solar neighborhood down to 19 pc from the Sun, making this ensemble particularly interesting for the study of exoplanets and substellar objects.
Download figure:
Standard image High-resolution imageFigures 18–22 show the individual distributions of XY Galactic positions and UV-space velocities for the newly recognized coronae in this work. These structures also lie in a narrow sheet in the Z-direction and have UVW-space velocities consistent with their candidate host association.

Figure 18. In our investigations of known associations possibly related with Crius 87, we have identified a previously unrecognized, likely corona of the UPK 612 open cluster (Cantat-Gaudin et al. 2020) contained in Theia 216 of Kounkel & Covey (2019). Crius 87 appeared as a candidate extension of this corona toward the Sun at a first glance, given its consistent Z-coordinate, location in the XY-plane, and similar kinematics. However, its median kinematics are discrepant by 8.5 km s−1, enough to call into question whether Crius 87 is related to UPK 612 at all.
Download figure:
Standard image High-resolution image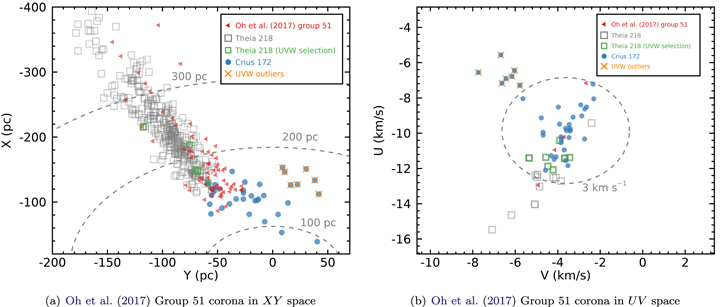
Figure 19. Galactic positions and space velocities of Crius 172, which we associate with a likely front-facing tidal tail to the poorly characterized Group 51 of Oh et al. (2017). Theia 218 may correspond to a farther tidal tail behind Group 51 given its consistent space velocities and spatial location.
Download figure:
Standard image High-resolution image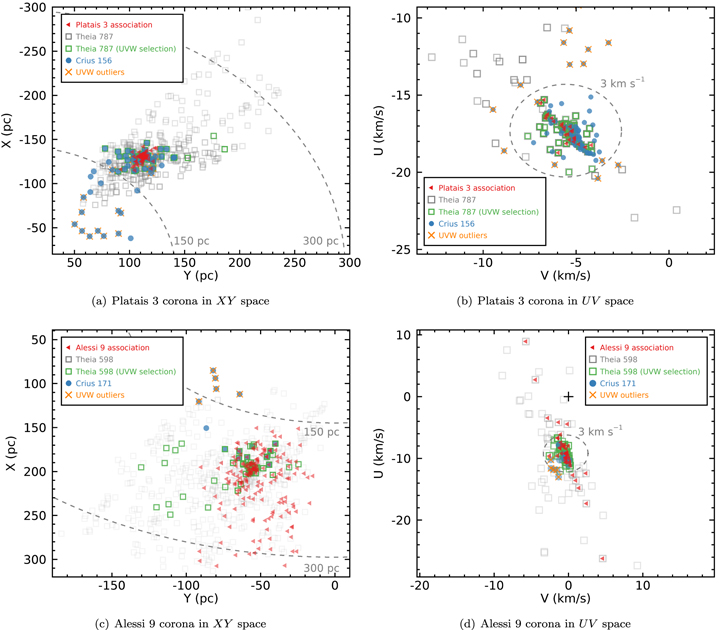
Figure 20. Galactic positions and space velocities of Crius 156 and Crius 171, which correspond to the Platais 3 and Alessi 9 associations, respectively. These associations have been, respectively, associated with Theia 787 and Theia 598 by Kounkel & Covey (2019). The tentative spatial extensions of both associations toward the Sun show systematically discrepant UVW velocities, which may indicate that they are simply caused by contamination. Both Crius 156/Theia 787 and Crius 171/Theia 598 are spatially much more extended than the core of their respective associations, and likely correspond to their extended coronae, which had not been previously discussed in the literature to the extent of our knowledge.
Download figure:
Standard image High-resolution image
Figure 21. Galactic positions and space velocities of Crius 217 and Theia 214 of Kounkel & Covey (2019), which likely correspond to an extensive corona around the newly discovered RSG 2 open cluster (Röser et al. 2016).
Download figure:
Standard image High-resolution image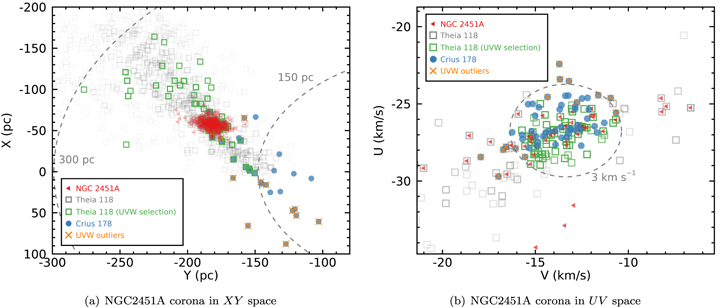
Figure 22. The NGC 2451A open cluster with its corona identified by Meingast et al. (2019). The spatial position and kinematics of Crius 178 are consistent with it extending the corona slightly toward nearby distances, which was probably not recovered by previous studies because of projection effects. The elongated distribution of NGC 2451A members in UV-space is due to larger parallax measurement errors compared with proper motion and heliocentric radial velocity measurement errors in Gaia EDR3, which is typical of young associations and open clusters beyond 100 pc.
Download figure:
Standard image High-resolution image
Footnotes
- 4
- 5
The RUWE is documented in the Gaia Data Release 2 Documentation at https://gea.esac.esa.int/archive/documentation/GDR2/Gaia_archive/chap_datamodel/sec_dm_main_tables/ssec_dm_ruwe.html.
- 6
Described in more detail at https://hdbscan.readthedocs.io/en/latest/basic_hdbscan.html and in McInnes & Healy (2017).
- 7
The groups identified by Kounkel & Covey (2019) were named after Theia, a child of Gaia in the Greek mythology. We elected to follow this tradition by naming the groups identified here after Crius, another child of Gaia.
- 8
- 9
- 10
In the case of 2D quantities, we show the quadrature sum of the median absolute deviation of their individual components.
- 11
- 12
See Miret-Roig et al. (2020) for a similar approach.