


Abstract
A new but rare sample of spatially extended emission line nebulae, nicknamed "Green Beans," was discovered at z ≈ 0.3 thanks to strong [O iii] emission, and subsequently shown to be local cousins of the Lyα nebulae found at high redshift. Here we use follow-up APO/DIS spectroscopy to better understand how these low-redshift Lyα nebulae compare to other populations of strong emission line sources. Our spectroscopic data show that low-z Lyα nebulae have active galactic nucleus (AGN)-like emission line ratios, relatively narrow line widths (FWHM ≲ 1000 km s−1), and emission line kinematics resembling those of Type 2 AGN at the same redshift, confirming that they are powered by Type 2 AGN with typical ionizing continua. While low-z Lyα nebulae are larger and less concentrated than compact, star-forming Green Pea galaxies, we find that they resemble typical Type 2 AGN in terms of r-band concentration and size. Based on this pilot study, low-z Lyα nebulae appear to be a subset of Type 2 AGN with bluer optical continua and high [O iii] equivalent widths but with comparable sizes and similar [O iii] kinematics. These characteristics may simply reflect the fact that low-z Lyα nebulae are drawn from the high-luminosity end of the Type 2 AGN distribution, with higher nuclear activity driving higher [O iii] equivalent widths and more central star formation leading to bluer optical continua. Deeper spectroscopic follow-up of the full sample will shed further light on these issues and on the relationship between these low-z Lyα nebulae and the Lyα nebula population at high redshift.
Export citation and abstract BibTeX RIS
1. Introduction
The circumgalactic medium lies at the interface between galaxies and the surrounding intergalactic medium. In cases where the circumgalactic medium is lit up as extended emission line nebulae, we gain spatially resolved information about both the gas reservoir available to fuel star formation and the effects of feedback from the central galaxy. Schirmer et al. (2013) discovered a new sample of extended emission line nebulae in the local universe using photometry from the Sloan Digital Sky Survey (SDSS; York et al. 2000). Due to the presence of strong [O iii] line emission in the r-band, these objects showed up as outliers in gri color space (and green in composite SDSS gri imaging), a region that is otherwise dominated by image artifacts. In contrast to the more well-known, compact "Green Pea" galaxies (Cardamone et al. 2009), these objects were selected to be spatially extended by at least 2''. Dubbed "Green Beans," therefore, due to their larger sizes, 17 of these objects were found at 0.19 ≲ z ≲ 0.35. Their high [O iii]/Hβ ratios combined with a lack of any detected broad emission lines suggested powering by Type 2 active galactic nuclei (AGN). Subsequent analysis of Galaxy Evolution Explorer (GALEX) data revealed that, in addition to showing spatially extended [O iii] emission, these Green Beans also emit strong ultraviolet emission consistent with being Lyα at these redshifts (Schirmer et al. 2016). Recent Hubble Space Telescope imaging and slitless spectroscopy has confirmed the presence of Lyα emission (Keel et al. 2019), providing strong support for the idea that Green Beans are in fact lower-redshift cousins of the extended Lyα nebulae seen at high redshift (z ∼ 2–6).
With a space density of ∼4.4 Gpc−3, these low-redshift Lyα nebulae are extremely rare, even more so than Lyα nebulae at high redshift (Schirmer et al. 2013). This fact raises several questions. In particular, what makes Lyα nebulae such a rare phenomenon at low redshifts, and how do they compare to the more well-studied Green Pea galaxies and to the larger population of Type 2 AGN at similar redshifts? Furthermore, what does the declining space density of these extended emission line regions from high to low redshift imply about the evolution of the circumgalactic medium or the physics of galaxy formation over cosmic time? To begin to address these questions, we are obtaining follow-up low-resolution (R ∼ 600–1500) and medium-resolution (R ∼ 2500–4500) spectroscopy of low-z Lyα nebulae with the Apache Point Observatory (APO) 3.5 m telescope and the Dual Imaging Spectrograph (DIS).
This paper presents results from our pilot program targeting a subset of the z ≈ 0.3 Lyα nebula sample. We describe the pilot sample in Section 2 and our observations and reductions in Section 3. Section 4 details our emission line fitting analysis, and in Section 5 we investigate the powering mechanism, colors, sizes, concentrations, and kinematics of these low-z Lyα nebulae. In Section 6 we discuss how low-z Lyα nebulae relate to other emission line populations at similar redshifts, in particular star-forming Green Pea galaxies and typical Type 2 AGN, as well as what we can learn from comparisons to extended Lyα nebulae at higher redshifts. We conclude in Section 7. Throughout, we assume the standard ΛCDM cosmology (ΩM = 0.3, ΩΛ = 0.7, h = 0.7); the angular scale at z ≈ 0.3 is 4.494 kpc arcsec−1. We adopt vacuum wavelengths for the analysis, following the SDSS approach, but we quote line names using standard air wavelength designations, e.g., [O iii]λ5007. All magnitudes are in the AB system (Oke 1974).
2. The Target Sample
Out of the 17 Lyα nebulae reported to be at z ≈ 0.3 in Schirmer et al. (2013), we were able to target nine (seven) at medium (low) spectral resolution during our initial pilot program. Standard IAU designations for the target objects are listed in Table 1; we use an abbreviated form (e.g., J0113+0106) throughout the rest of the paper. Based on follow-up observations by Schirmer et al. (2016), the objects in the pilot sample show a range of environments—some appear isolated while others reside within galaxy groups—and have [O iii] nebula diameters of 25–75 kpc. The X-ray fluxes of the observed low-z Lyα nebulae range from the most luminous X-ray source in the sample to one of the least luminous, and more than half show hints of outflow and/or merger activity based on ground-based optical imaging. Two of the objects in our pilot sample (J0113+0106, J1155−0147) plus one additional low-z Lyα nebula (J2240−0927) have been targeted with Gemini/GMOS (Davies et al. 2015; Kawamuro et al. 2017), showing further evidence for complex kinematics and outflows.
Table 1. Observing Log
| UT Date | SDSS Name | Position | Grating | Spectral | Spatial | Exposure | Seeing | Conditions |
|---|---|---|---|---|---|---|---|---|
| Angle | Wavelength | Resolutiona | Bin (pix) | Time (s) | (arcsec) | |||
| 2018 Jan 12 | SDSSJ011341.11+010608.5 | 129 00 00 |
4800 Å/6600 Å | 1.7 Å/1.8 Å | 1 | 5 × 600 | 1.0–1.6 | Clear |
| 8500 |
3 × 600 | |||||||
| SDSSJ015930.84+270302.2 | 15500 |
6 × 600 | ||||||
| 2850 |
4 × 600 | |||||||
| 2018 Jan 24 | SDSSJ115544.59−014739.9 | 2593 |
4800 Å/6600 Å | 1.7 Å/1.9 Å | 1 | 4 × 600 | 1.5–1.9 | Clear |
| 13256 |
4 × 600 | |||||||
| SDSSJ134709.12+545310.9 | 13899 |
4 × 600 | ||||||
| 6035 |
4 × 600 | |||||||
| SDSSJ150517.63+194444.8 | 8840 |
2 × 600 | ||||||
| 2018 Apr 15 | SDSSJ150517.63+194444.8 | 17354 |
4800 Å/6600 Å | 1.7 Å/1.5 Å | 2 | 2 × 600 | 1.0 | Clear |
| SDSSJ135155.48+081608.4 | 15227 |
4 × 600 | ||||||
| 4611 |
4 × 600 | |||||||
| SDSSJ145533.69+044643.2 | 10251 |
3 × 600 | ||||||
| 3056 |
3 × 600 | |||||||
| 2018 Apr 22 | SDSSJ144110.95+251700.1 | 279 |
4562 Å/6137 Å | 1.7 Å/1.5 Å | 1 | 3 × 600 | 1.3 | Cloudy |
| SDSSJ150420.68+343958.2 | 10846 |
6 × 300 | ||||||
| 2018 May 09 | SDSSJ115544.59−014739.9 | 17128 |
4400 Å/7500 Å | 5.9 Å/6.5 Å | 1 | 4 × 200 | 1.2–1.3 | Clear |
| SDSSJ134709.12+545310.9 | 13899 |
3 × 200 | ||||||
| SDSSJ135155.48+081608.4 | 15227 |
3 × 200 | ||||||
| SDSSJ144110.95+251700.1 | 279 |
3 × 300 | ||||||
| SDSSJ145533.69+044643.2 | 10251 |
3 × 200 | ||||||
| SDSSJ150420.68+343958.2 | 10846 |
4 × 300 | ||||||
| SDSSJ150517.63+194444.8 | 8840 |
3 × 200 | ||||||
Notes. All observations taken using a 1 5 slit.
Download table as: ASCIITypeset image
3. Data
3.1. Spectroscopic Observations
Spectroscopic observations of the target low-z Lyα nebula sample were obtained using the APO 3.5 m telescope and the DIS spectrograph on UT 2018 January 12 and 24, April 15 and 22, and May 9. Position angles were chosen to cover the largest extent of the nebula, based on existing deep optical imaging (Schirmer et al. 2016), and to include nearby sources on the slit. The DIS native pixel scale is 042/pixel and 040/pixel for the blue and red sides, respectively. During these observations, DIS was affected by a scattered light issue caused by condensation on the dewar window; we discuss this further in Section 3.2. Details on the observations are listed in Table 1.
For the first four nights (UT 2018 January 12 and 24, April 15 and 22), we used the medium resolution B1200 and R1200 gratings and a 15 slit, yielding a resolution element of ∼1.5–2.0 Å and a resolving power of R ∼ 2380–4650. The grating central wavelengths were set to 4800 Å and 6600 Å for the blue and red sides, respectively, on UT 2018 January 12, January 24, and April 15, while on UT 2018 April 22, the blue and red grating central wavelengths were shifted to 4562 Å and 6137 Å, respectively, in order to target two of the lower-redshift Lyα nebula systems. For each object, we obtained two to six exposures of 300–600 s each, with occasional dither offsets of ≈5'' in between individual exposures, and took data for two different position angles for each object, when possible. Conditions on UT 2018 January 12 and 24 were clear, with seeing of 10–16 and 15–19, respectively. On UT 2018 April 15 conditions were clear with seeing of 1'', but the data were inadvertently binned spatially by 2, leading to a pixel scale of 084/pixel and 080/pixel on the blue and red sides, respectively. Conditions were non-photometric on UT 2018 April 22, with seeing of 13 and intermittent clouds.
For the final night on UT 2018 May 9, we used the lower-resolution B400 and R300 gratings and a 15 slit, yielding a resolution element of ∼5.7–6.5 Å and a resolving power of R ∼ 630–1425. The blue and red grating central wavelengths were set to their nominal values of 4400 Å and 7500 Å, respectively, providing full coverage of the optical window. We observed only one position angle for each object, choosing the one covering the larger spatial dimension of the nebula, with three to four exposures of 200–300 s each. The conditions were clear with a native seeing of 12–13, but quickly falling temperatures led to unstable focus during the first part of the night.
3.2. Spectroscopic Data Reduction
We carried out the data reduction in the usual manner with IRAF (Tody 1986, 1993). We applied bias and flat-field calibrations, and then shifted and combined multiple exposures. Wavelength calibration was applied using HeNeAr calibration lamp exposures taken at the position of the target, and checked against sky lines, yielding a wavelength solution with an rms accuracy of 0.07 Å (0.7 Å) for the medium- (low-)resolution spectra.
We flux-calibrated the data using observations of the spectrophotometric standard stars G191B2B (UT 2018 January 12), Feige 34 (UT 2018 January 24), BD+3332642 (UT 2018 April 15), and HZ44 (UT 2018 May 9), along with the tabulated atmospheric extinction from APO.1 The observations from UT 2018 April 22 were reduced along with the rest of the data set, but could not be flux-calibrated directly due to non-photometric conditions. These data were used to derive measurements for which absolute flux calibration is not required (i.e., line FWHMs and equivalent widths, line ratios, and non-parametric [O iii] kinematic parameters).
Using the 2D reduced spectra, we extracted a 1D spectrum for each object using an aperture width of eight native, unbinned pixels (32), chosen to approximately match the SDSS-III Baryon Oscillation Spectroscopic Survey (BOSS) 3'' diameter fibers, and centered on the spatial centroid of the [O ii]λ3727 and [O iii]λ5007 lines for the blue and red sides, respectively. The medium-resolution spectra show lines of [Ne v]λλ3346,3426, [Ne iii]λλ3869,3968, He iλ3888, [O ii]λ3727 (blended doublet), Hδλ4102, Hβλ4861, [O iii]λλ4959,5007, and He iiλ4685. The lower-resolution data provide additional detections of Hγλ4340, [O iii]λ4363, [O i]λ6300, Hαλ6563, [N ii]λ6548,6583 and, in several of the targets, [S ii]λ6716,6731.
In this paper, we focus on using line ratios and emission line profile measurements that are less sensitive to slit losses or scattered light effects. We note that slit losses and the scattered light issue do not affect line ratios measured from the same side of the DIS instrument. However, since the scattered light effect was greater for the blue versus the red side data, it introduced a small offset in the ratios of lines observed on the blue versus the red sides of DIS. Relevant for this paper, we apply a correction to the low-resolution [Ne v]λ3426/[O iii]λ5007 line ratio measurements presented in Section 5.1, but note that this correction (0.015 dex) is less than the mean line ratio measurement error for the pilot Lyα nebula sample (0.090 dex).
To enable a consistent comparison between the observed properties of the samples of emission line objects considered in this work, we corrected all spectra for Galactic extinction using E(B − V) values from Schlafly & Finkbeiner (2011), the standard extinction curve from Fitzpatrick (1999), and RV = 3.1. The typical Galactic extinction is E(B − V) = 0.038 ± 0.022 for the full low-z Lyα nebula sample.
3.3. Supplementary Data
Existing photometric measurements—SDSS broadband model magnitudes (corrected for Galactic extinction), r-band Petrosian radii, and r-band concentration (r90/r50)—were taken from SDSS DR15 (Aguado et al. 2019) for the low-z Lyα nebula sample as well as for two comparison samples at similar redshifts: compact Green Pea galaxies (Cardamone et al. 2009) and Type 2 AGN (Yuan et al. 2016). The Green Pea galaxies were selected in a manner similar to the low-z Lyα nebula ("Green Bean") sample, i.e., to have green colors in the SDSS gri imaging due to strong [O iii] emission within the r-band, but with compact sizes (rpetrosian < 2''). Here, we use the Green Pea sample that was classified as star-forming in the discovery paper (Cardamone et al. 2009). The Type 2 AGN sample was selected from the SDSS-III/BOSS spectroscopic database by requiring [O iii] restframe equivalent widths of >100 Å and AGN-like line ratios in the standard [O iii]/Hβ versus [N ii]/Hα diagnostic diagram (Yuan et al. 2016). To allow for a consistent comparison, we restrict our analysis throughout the paper to sources at the same redshift range as the low-z Lyα nebula sample (0.19 < z ≤ 0.35).
To supplement the new spectroscopic data from APO/DIS, we also downloaded a low-resolution (R ∼ 1800) spectrum of one target, J0113+0106, available from the SDSS Legacy archive (York et al. 2000). We note that J0113+0106 was the only low-z Lyα nebula that was spectroscopically targeted by SDSS; despite similar properties, J0113+0106 was not included in the Type 2 AGN sample because the latter was drawn from BOSS rather than SDSS Legacy spectroscopy (Yuan et al. 2016). Finally, we downloaded the existing spectra from SDSS/BOSS for the star-forming Green Pea and Type 2 AGN samples.
Emission line flux measurements for the comparison samples were derived from the SDSS/BOSS pipeline (Bolton et al. 2012) for the Type 2 AGN sample and from the SDSS Portsmouth emission line catalog (Thomas et al. 2013) for the Green Peas. We applied a correction for Galactic extinction to the Type 2 AGN emission line measurements in the same manner as above, with a typical Galactic extinction of E(B − V) = 0.024 ± 0.018. Since the catalog Green Pea emission line measurements already include a correction for both internal extinction and Milky Way foreground, we recomputed the emission line fluxes including the correction for Galactic extinction only. The typical Galactic extinction was E(B − V) = 0.026 ± 0.017 for the Green Pea sample. Finally, we also collected emission line flux measurements, corrected for Galactic extinction, for J2240−0927 that were published previously (Schirmer et al. 2016).
4. Fitting the Emission Line Profiles
To derive flux estimates for all emission lines and allow for direct comparisons to the other emission line samples, we first employ a simple Gaussian fitting approach, as was done for the SDSS Portsmouth emission line catalog and the SDSS/BOSS spectroscopic pipelines. We use the lower-ionization [O ii]λ3727,3729 doublet, which is only marginally resolved (unresolved) in our medium- (low-)resolution spectra, to constrain the systemic velocity (Zakamska et al. 2003; Boroson 2005).
Lines that are well separated are each fit with a single Gaussian profile. In the low-resolution data, the [Ne iii]λ3869+He i, Hγ+[O iii]λ4363, Hα+[N ii]λλ6548,6584, and [S ii]λ6717,6731 line groups are each fit simultaneously, with the relative wavelength offsets constrained to match the laboratory values, corrected to the systemic redshift. We require each of the individual lines in the [N ii] and [S ii] doublets to have the same width, and we further constrain the [N ii]λλ6548,6584 doublet lines to the theoretical flux ratio of 3.0 (Storey & Zeippen 2000), consistent with the approach taken by the BOSS spectroscopic pipeline (Bolton et al. 2012).
To study the kinematics of the narrow-line region gas in more detail, we then use the standard approach of fitting the observed [O iii] doublet line profiles with multiple Gaussian components. Here, we follow the approach of Yuan et al. (2016), who selected the Type 2 AGN sample from BOSS spectroscopy and used the [O iii] line profiles to derive a suite of non-parametric measurements: velocity widths containing 50%, 80%, and 90% of the flux (w50 = v75 − v25, w80 = v90 − v10, and w90 = v95 − v05), a relative asymmetry parameter ( with a positive value indicating a redward skew, i.e., a larger red tail), and a dimensionless kurtosis parameter (r9050 = w90/w50). To allow for comparison between the low-z Lyα nebulae and the Type 2 AGN sample, we smoothed our medium-resolution data to match the spectral resolution of the BOSS spectra (R ∼ 1850) and adapted their published fitting code (Reyes et al. 2008; Zakamska & Greene 2014; Yuan et al. 2016) to fit the [O iii] emission lines using up to four Gaussians and derive the non-parametric kinematic measurements. In the fitting code, both [O iii] doublet lines are constrained to have the same fit, with a theoretical flux ratio of 2.967; an additional Gaussian component is only added if it leads to a decrease in the reduced χ2 of ≥10%.
5. Results
Using measurements from the literature as well as our new APO/DIS low- and medium-resolution spectroscopy, we investigate the power source, colors, sizes, concentrations, and kinematics of low-z Lyα nebulae as compared to star-forming Green Peas and Type 2 AGN at the same redshifts.
5.1. Powering by Type 2 AGN
Previous measurements showed that low-z Lyα nebulae have high [O iii]/Hβ ratios, consistent with being AGN powered (Schirmer et al. 2013). Using standard BPT diagrams (Baldwin et al. 1981), we can further investigate the powering mechanism for a subset of the observed low-z Lyα nebulae for which we have low-resolution spectra covering the entire optical region (Figure 1). As expected, the low-z Lyα nebulae lie in the upper right of the diagram, in the AGN region and above the maximal theoretical star-forming line (Kewley et al. 2001). For comparison, we include the line ratios for the Type 2 AGN and the Green Pea samples. While the [O iii]/Hβ ratios of low-z Lyα nebulae are indistinguishable from those of Type 2 AGN, the [N ii]/Hα ratios do appear to be slightly lower than for the Type 2 AGN sample. We also plot the alternative selection diagram from Shirazi & Brinchmann (2012), which includes He ii in place of [O iii], and the corresponding dividing line signifying a 10% contribution from an AGN to the He ii line; again, the low-z Lyα nebulae are located well inside the AGN portion of the diagram. On the other hand, it is clear that, despite similarities in terms of how the objects were originally selected (and therefore nicknamed), the powering mechanisms for Green Peas and low-z Lyα nebulae are quite different. The star-forming Green Peas show lower [O iii]/Hβ and [N ii]/Hα ratios, whereas low-z Lyα nebulae are AGN powered, with strong [O iii]/Hβ, [N ii]/Hα, [S ii]/Hα, and He ii/Hβ ratios (Figure 1).
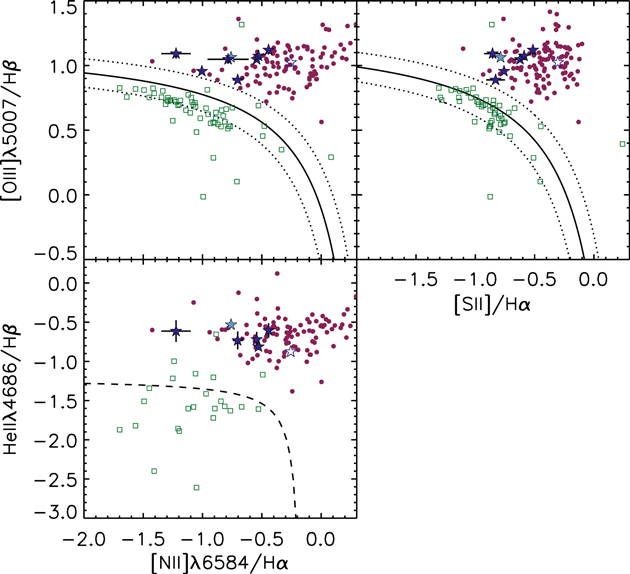
Figure 1. Emission line diagnostic diagrams for low-z Lyα nebulae (blue stars), Green Peas (green squares; taken from Thomas et al. 2013), and Type 2 AGN (magenta circles; taken from Bolton et al. 2012). Top: two of the classic BPT diagrams (Baldwin et al. 1981) with the theoretical maximum star formation line overplotted (Kewley et al. 2001). The low-z Lyα nebula sample shown includes targets observed in this work (filled dark blue stars) plus one object taken from the SDSS archive (J0113+0106; filled light blue star), and one object (J2240−0927; open dark blue star) observed by Schirmer et al. (2016). Not surprisingly, the low-z Lyα nebula sample lies in the AGN portion of the diagram, overlapping the Type 2 AGN sample. Bottom: an alternative AGN vs. star formation classification diagram (Shirazi & Brinchmann 2012); the AGN contribution to the He ii emission line increases from lower left to upper right, with the dashed line corresponding to a 10% AGN contribution. Again, the low-z Lyα nebula sample lies well into the AGN portion of the diagram, overlapping the Type 2 AGN sample. Green Peas (green squares) by contrast straddle the 10% AGN line.
Download figure:
Standard image High-resolution imagePrevious constraints derived from shallow spectroscopic follow-up of low-z Lyα nebulae could not rule out a broad emission line component to the permitted lines (Schirmer et al. 2013). Using our spectroscopic data, we can measure the typical line widths for the permitted Hβ line in low-z Lyα nebulae. Starting with the single Gaussian fit to the Hβ emission line in our medium-resolution data and correcting for the instrumental resolution, we find a FWHM distribution peaked at ∼400 km s−1 with a tail extending to ∼1000 km s−1 (Figure 2). We check for the presence of a faint broad component by refitting the Hβ line using two Gaussian components that are both fixed to the central wavelength derived using the single Gaussian fit. In all cases, the hypothetical secondary component has a FWHM < 2000 km s−1 (the vast majority are <1000 km s−1), and in no case does the double Gaussian fit provide a substantial (≥10%) improvement in the reduced χ2. Thus, in all targeted low-z Lyα nebulae, we spectrally resolve the Hβ line, do not detect any significant broad component, and measure widths well below the typical dividing line between Type 1 and 2 AGN (FWHM ≲ 1200 km s−1 for permitted lines such as Hα or Hβ; e.g., Zakamska et al. 2003; Hao 2004; Mullaney et al. 2013). This confirms previous suggestions that low-z Lyα nebulae are Type 2 objects.
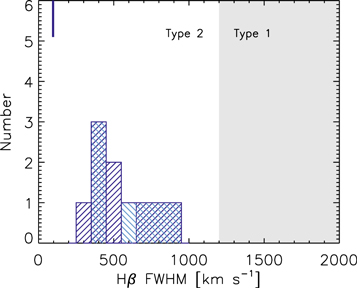
Figure 2. Histogram of the Hβ line widths (FWHMHβ) measured with a single Gaussian fit to the medium-resolution data and corrected for instrumental resolution. Where available, measurements from two different position angles are shown (light vs. dark blue hatching), but agree to within the instrumental resolution in all cases. The instrumental resolution of the data is indicated with a blue bar on the top axis. A typical dividing line between Type 1 and Type 2 is indicated with gray shading (FWHM ∼ 1200 km s−1; Hao 2004). The low-z Lyα nebula Hβ profiles are spectrally resolved in our data and are relatively narrow, confirming that low-z Lyα nebulae are Type 2 objects.
Download figure:
Standard image High-resolution imageSince low-z Lyα nebulae are powered by Type 2 AGN, we can then ask how the ionizing continuum of these objects compares to that of typical Type 2 AGN. Figure 3 shows the [Ne v]λ3426/[O iii]λ5007 ratio versus mid-infrared luminosities of low-z Lyα nebulae and Type 2 AGN at similar redshifts. While low-z Lyα nebulae appear to have relatively high mid-infrared luminosities, suggesting a powerful central engine, we find that their [Ne v]/[O iii] emission line ratios are quite typical when compared to the Type 2 AGN population. Since these emission lines both require high but different ionization energies (97.2 eV to ionize Ne+3 → Ne+4, 35.1 eV to ionize O+ → O+2; Kramida et al. 2019), this suggests that the ionizing spectral slopes of the host AGN are similar in both populations.
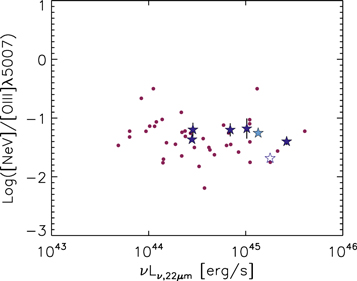
Figure 3. WISE 22 μm luminosity vs. [Ne v]λ3426/[O iii]λ5007 line ratios for low-z Lyα nebulae (low-resolution data) and Type 2 AGN at the same redshift. For objects detected in both emission lines, low-z Lyα nebulae appear to be drawn from the high infrared luminosity end of the distribution but show no significant difference in terms of the [Ne v]/[O iii] emission line ratio, suggesting that the ionizing continuum slopes of the host AGN are similar in both populations.
Download figure:
Standard image High-resolution image5.2. Colors and Stacked Spectra
The low-z Lyα nebulae were first selected, in part, due to their unusual location in color–color space. In Figure 4, we plot the measured g − r versus r − i colors of the low-z Lyα nebula sample along with the colors for Type 2 AGN at similar redshifts. Broadband colors are affected by strong emission lines, e.g., [O ii], [O iii], Hα, falling into different bands depending on the redshift. In particular, at z ≈ 0.3, the [O iii] doublet—the strongest optical emission lines for these sources—is contained within the r bandpass, leading to blue r − i and red g − r colors, and a greenish appearance in SDSS gri color composite images. The low-z Lyα nebulae were selected from this portion of the color–color diagram. Type 2 AGN at similar redshifts show less extreme colors, suggesting they may have lower [O iii] equivalent widths. Figure 5 confirms this, showing that the restframe [O iii] equivalent widths for the low-z Lyα nebula pilot sample are statistically higher than those of typical Type 2 AGN (Kolmogorov–Smirnov (KS) test p-value of 4 × 10⁻⁵), but comparable to those of Green Peas (KS test p-value of 0.12). The weaker Hα line also has an effect on the broadband colors, as it shifts from the i-band to the z-band at z ∼ 0.296, leading to somewhat bluer r − i and redder r − z colors for the higher-redshift end of the samples (Schirmer et al. 2016).
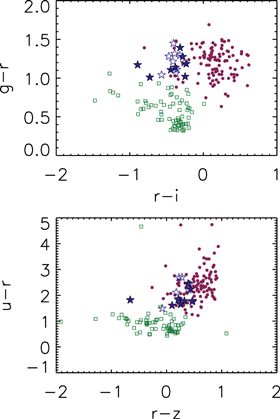
Figure 4. Comparison of the broadband colors of Green Pea galaxies (green squares), Type 2 AGN (magenta circles), and low-z Lyα nebulae (blue stars), all taken from the SDSS archive and corrected for Galactic extinction. Top: g − r vs. r − i color–color plot. Bottom: u − r vs. r − z color–color plot. All plotted sources are at 0.19 < z ≤ 0.35, a redshift range for which the [O iii] line is contained within the r bandpass. The low-z Lyα nebula sample targeted in this paper are indicated as filled blue stars.
Download figure:
Standard image High-resolution image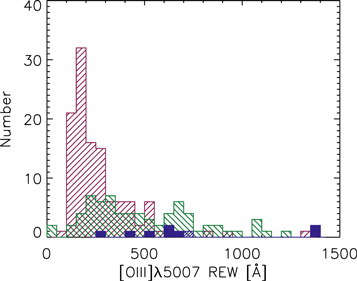
Figure 5. [O iii] restframe equivalent widths reported in the literature for Type 2 AGN (hatched magenta histogram; Yuan et al. 2016) and Green Peas (hatched green; Cardamone et al. 2009) at 0.19 < z ≤ 0.35, as compared to the low-z Lyα nebula pilot sample observed at a similar low spectral resolution (filled blue). The rest equivalent width of J2240−0927 is shown as a blue narrow-hatched histogram (taken from Schirmer et al. 2016). The restframe equivalent widths of low-z Lyα nebulae are significantly higher than those of Type 2 AGN, but comparable to those of Green Peas.
Download figure:
Standard image High-resolution imageHowever, it is not emission lines alone that cause low-z Lyα nebulae to have unusual colors; the optical continuum also plays a role. To explore this, we next stack the low-resolution spectra for the low-z Lyα nebula pilot sample (eight objects, including the SDSS spectrum of J0113+0106), and SDSS/BOSS spectra for the Green Pea (71 objects) and Type 2 AGN (117 objects) comparison samples. After redshifting to the restframe and normalizing the spectra at 5995–6005 Å, a region free of strong lines, we generate a stacked spectrum using a geometric mean, as this has been found to preserve the shape of the continuum better than a simple median (Vanden Berk et al. 2001). Using a geometric mean does require masking negative pixels during the stacking; however, this is a small effect, with fewer than 1%–2% of the pixels being masked in this procedure. In addition, we reach the same basic conclusions if we instead use a simple median stack. The results of the stacking are shown in Figure 6, where the low-z Lyα nebula stacked spectrum shows a much bluer restframe optical continuum than the stacked Type 2 AGN. This difference could in principle come from dust extinction, from scattered light from the central engine, or from the underlying stellar continuum of the host galaxy. As a check on the role of dust, in Figure 7 we plot the observed Hα/Hβ ratio (i.e., the Balmer decrement) for the low-z Lyα nebula pilot sample, the Type 2 AGN, and the Green Peas. All three populations show comparable Balmer decrements; although there is a hint that the low-z Lyα nebulae may show slightly lower Hα/Hβ ratios compared to Type 2 AGN—consistent with lower dust extinction—this result is not statistically significant given the current sample size (KS test p-value of 0.51). Excess blue continuum has been found previously in higher-luminosity Type 2 AGN samples (e.g., Zakamska et al. 2003), with the authors ruling out a strong contribution from scattered light based on the lack of broad components on the permitted line emission. In Section 5.1, we showed that the low-z Lyα nebula sample also lack broad permitted line emission, arguing against the AGN scattered light explanation. Furthermore, Schirmer et al. (2016) argue, based on spectral energy distribution fitting for one low-z Lyα nebula (J2240−0927) and on a color analysis of neighboring galaxies for three more systems, that the continuum in the ultraviolet, at even bluer wavelengths, is fully explained by a combination of stellar light and nebular continuum, leaving no room for a scattered AGN component. Thus, it appears likely that much of the observed color difference is due instead to differences in the underlying stellar continuum of the host galaxy between low-z Lyα nebulae and typical Type 2 AGN. This is corroborated by the much weaker Ca K stellar absorption feature in the low-z Lyα nebula stacked spectrum as compared to the Type 2 AGN stack (Figure 6).
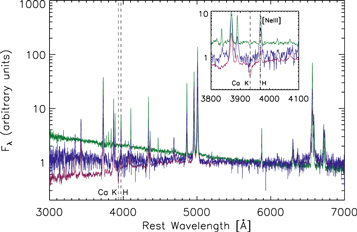
Figure 6. Stacked low-resolution spectrum of the low-z Lyα nebulae in our pilot sample (dark blue) vs. the stacked spectra of star-forming Green Peas (green) and Type 2 AGN (magenta), normalized to the region around 5995–6005 Å. The low-z Lyα nebula stack shows substantially bluer restframe optical continuum than that of the Type 2 AGN, although not as blue as that of the Green Peas. Inset: zoom-in on the region around 4000 Å. While the Ca H absorption line is affected by emission filling from the [Ne iii]λ3968 Å emission line at nearly the same wavelength, the Ca K line is clearly weaker in the low-z Lyα nebulae stack than in the Type 2 AGN stack, consistent with low-z Lyα nebulae hosting younger stellar populations on average.
Download figure:
Standard image High-resolution image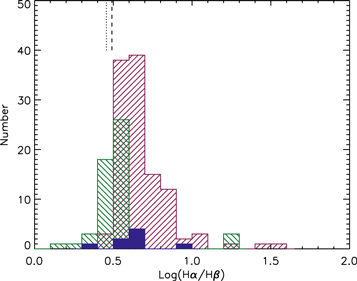
Figure 7. Balmer decrements measured using low-resolution spectra of the pilot low-z Lyα nebulae sample (dark blue filled histogram) as compared to Type 2 AGN (magenta hatched; taken from Bolton et al. 2012) and Green Peas (green hatched; taken from Thomas et al. 2013). The expected values for Case B conditions, assuming no dust extinction, of ∼3.1 (AGN; dashed line) and ∼2.86 (star formation; dotted line) are indicated (Dopita & Sutherland 2003). Low-z Lyα nebulae have Balmer decrements comparable to Type 2 AGN, suggesting that dust extinction is not the primary explanation for the observed difference in optical continuum color between the two populations.
Download figure:
Standard image High-resolution image5.3. Sizes and Concentrations
The low-z Lyα nebulae were selected not simply due to their unusual location in color–color space, but also due to larger sizes in SDSS r-band imaging. As broadband sizes naturally underestimate the true nebular size, deep spectroscopy or narrowband imaging is required to assess the full extent of the [O iii] emission. However, since at z ≈ 0.3 the high equivalent width [O iii] doublet is contained within the r-band filter (contributing ∼20%–60% of the r-band flux for the pilot low-z Lyα nebula sample), the r-band imaging can give us a sense of the relative sizes and concentrations of low-z Lyα nebulae versus other extreme emission line samples. As a proxy for the size, we therefore use the r-band Petrosian radius, and for concentration, we use the ratio of the r-band 90% and 50% Petrosian radii derived from the SDSS database. Figure 8 shows the distribution of measured r-band sizes and concentrations for low-z Lyα nebulae, Green Peas, and Type 2 AGN at similar redshifts. By construction, Green Peas are small and compact, particularly when compared to the low-z Lyα nebulae. Type 2 AGN, by comparison, are less compact and show a much wider range of sizes, overlapping both of the other two populations. Low-z Lyα nebulae are similar in concentration to Type 2 AGN, and are comparable to the larger size tail of the Type 2 AGN distribution. Thus, while low-z Lyα nebulae are indeed noticeably spatially extended in the r-band imaging (the data originally used to isolate the low-z Lyα nebula sample), they do not appear to be the largest such objects at these redshifts.
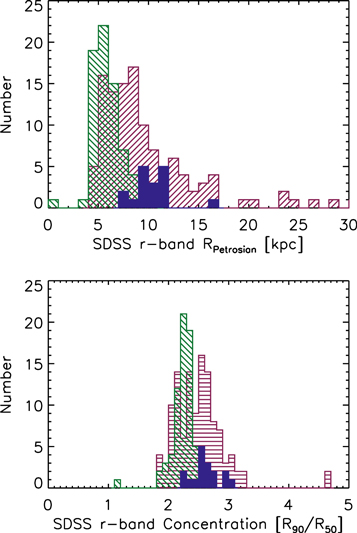
Figure 8. Histograms of sizes and concentrations for Green Peas (hatched green), Type 2 AGN (hatched magenta), and low-z Lyα nebulae (filled blue), as measured from SDSS r-band imaging. Top: SDSS r-band Petrosian radii. Bottom: concentration estimated using the ratio between the radii containing 90% and 50% of the SDSS r-band Petrosian flux (R90/R50). The SDSS r-band contains the bright [O iii] emission line at these redshifts, thus the r-band estimates are a good proxy for the relative nebular sizes and concentrations of these three populations. Low-z Lyα nebulae appear larger and less concentrated than Green Pea galaxies, as expected, but they are comparable in size and concentration to Type 2 AGN.
Download figure:
Standard image High-resolution imageThe presence of a tail of Type 2 AGN with large r-band sizes suggests that there may be an additional sample of low-z Lyα nebulae just outside the original "Green Bean" selection window. However, this large size tail could simply be due to lower-redshift sources for which more extended emission is visible. To check for biases in the redshift distribution of the different samples, in Figure 9 we plot the redshift versus r-band Petrosian radii for all sources. The low-z Lyα nebulae are indeed skewed toward higher redshifts, but the median size for both populations does not vary significantly with redshift, and the large size tail of the Type 2 AGN distribution is populated by objects from a range of redshifts.
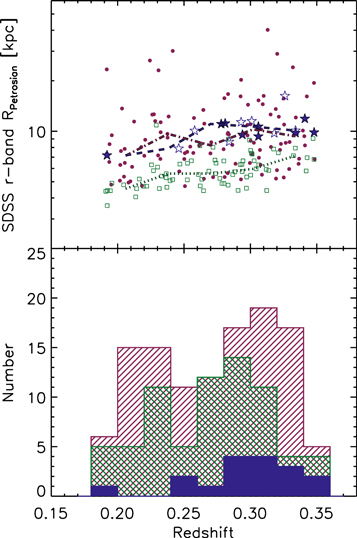
Figure 9. Top: redshift vs. physical r-band Petrosian radius for Green Peas (green squares), Type 2 AGN (magenta circles), and low-z Lyα nebulae (blue stars), as measured from SDSS r-band imaging. The low-z Lyα nebulae targeted in this paper are indicated as filled blue stars. The median radius as a function of redshift is shown with colored lines for the Type 2 AGN (magenta dotted–dashed), Green Peas (green dotted), and low-z Lyα nebula (blue dashed) samples. Bottom: redshift distribution for the Green Peas (hatched green histogram), Type 2 AGN (hatched magenta), and the low-z Lyα nebulae (filled blue). Although the low-z Lyα nebula sample is skewed toward higher redshifts than the Type 2 AGN sample, the median size does not vary significantly with redshift and the largest objects are drawn from a range of redshifts.
Download figure:
Standard image High-resolution imageIt is also possible that seeing effects could bias the size measurements. The low-redshift Lyα nebula sample was explicitly cleaned of poor seeing targets (Schirmer et al. 2016); to check for poor seeing in the other samples, we look at the observed r-band Petrosian radius (in arcseconds) scaled by the size of the seeing versus the physical r-band Petrosian radius (Figure 10). As expected, the Green Peas are comparable in size to the seeing, while the Type 2 AGN and low-z Lyα nebula samples extend to much larger physical sizes and to larger ratios of physical size to seeing. The seeing does not appear to be important for these larger sources, as there are no sources in the lower right quadrant of the plot, i.e., with large measured physical sizes but with low ratios of physical size to seeing.
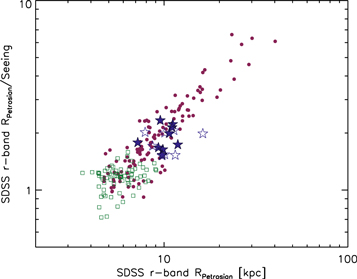
Figure 10. Ratio of the observed r-band Petrosian radius (in arcseconds) to the r-band seeing vs. the physical r-band Petrosian radius (in kiloparsecs) for Green Peas (green squares), Type 2 AGN (magenta circles), and low-z Lyα nebulae (blue stars), as measured from SDSS r-band imaging. The low-z Lyα nebulae targeted in this paper are indicated as filled blue stars. The tail to large sizes is populated by sources that are well beyond the size of the seeing.
Download figure:
Standard image High-resolution imageAnother potential bias is the fact that, as we showed in Section 5.2, the Type 2 AGN have slightly lower [O iii] equivalent widths on average than the low-z Lyα nebulae. Since [O iii] therefore contributes a smaller fraction of the r-band flux, the r-band size measurement will be less sensitive to extended line emission for these sources. However, this does not explain the large size tail of the Type 2 AGN sample as it would if anything tend to bias the r-band size measurement toward lower sizes.
In carrying out this analysis, we made use of SDSS Petrosian radii in order to minimize redshift biases (Petrosian 1976; Blanton et al. 2001; Yasuda et al. 2001). However, in cases with a particularly compact central core embedded within a more extended nebula—as may be the case in the Type 2 AGN sample—the Petrosian radius measurement will be dominated by the core profile. Again, however, this effect will tend to bias the r-band size measurements to smaller values. Thus, we conclude that the large measured sizes are likely to be physical and warrant further study. We will present an analysis of this population of extended Type 2 AGN sources in a subsequent paper.
5.4. Kinematics
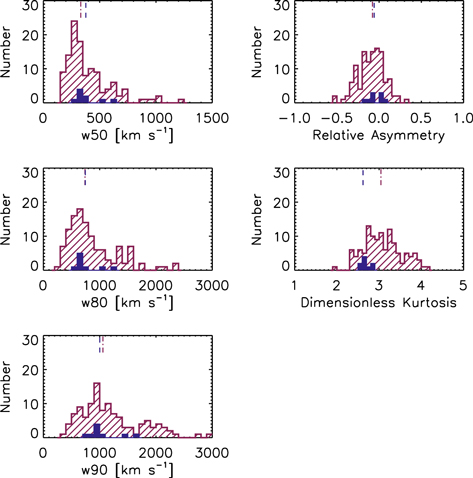
To compare the kinematics of our low-z Lyα nebula sample with that of typical Type 2 AGN, we use the non-parametric kinematic measurements from Section 4, derived using multiple Gaussian component fitting of the [O iii] doublet line profiles in the same manner as Yuan et al. (2016), after smoothing our medium-resolution data to the same spectral resolution as the Type 2 AGN sample data. Figure 11 shows histograms of all measured parameters for both the Type 2 AGN and the pilot low-z Lyα nebula sample. In terms of the measured velocity widths—w50, w80, and w90— a two-sided KS test reveals no difference between the two samples (p-values of 0.28, 0.57, and 0.28). The relative asymmetry (R) distribution for the low-z Lyα nebulae also shows no significant difference as compared to the typical Type 2 AGN sample (KS test p-value of 0.45). The dimensionless kurtosis (r9050) measurements do appear to diverge slightly from those of the Type 2 sample (KS test p-value of 0.01), in the sense that low-z Lyα nebulae show lower kurtosis (i.e., smaller tails) on average than typical Type 2 AGN. The effect is not strong, but to the extent that a high dimensionless kurtosis signals the presence of faster outflows (i.e., more prominent tails on the [O iii] line profile), this may suggest that, at the very least, low-z Lyα nebulae are not dominated by above-average outflow speeds compared to other Type 2 AGN.
Figure 11. Histogram of w50 (top), w80 (middle), and w90 (bottom) for the low-z Lyα nebulae (medium-resolution data; filled blue histogram), with the Yuan et al. (2016) Type 2 AGN comparison sample shown (hatched magenta). The short colored line along the top axis indicates the median value for the low-z Lyα nebula (blue dashed) and Type 2 (magenta dotted–dashed) samples, respectively. The low-z Lyα nebulae do not stand out relative to typical Type 2 AGN in terms of [O iii] kinematics.
Download figure:
Standard image High-resolution image
6. Discussion
Low-z Lyα nebulae appear to host and be powered by Type 2 AGN, with consistent narrow-line kinematics, emission line flux ratios, and ionizing spectral slopes. They show more extreme colors than either Green Peas or Type 2 AGN, partly due to strong [O iii] doublet emission within the r-band, but also due to differences in optical continuum colors. Low-z Lyα nebulae are larger and less compact than Green Peas (by construction), and they are comparable to the overall Type 2 AGN population in terms of r-band concentration and size, although skewed toward the larger size end of the Type 2 AGN size distribution. They show higher than average mid-infrared luminosity, high [O iii] rest equivalent widths, and bluer optical continua, but with outflow kinematics that are typical for Type 2 AGN.
These findings may imply that, rather than being a distinct population, these low-z Lyα nebulae are drawn from the high-luminosity end of the Type 2 AGN population. Previous studies have shown that the [O iii] restframe equivalent width is correlated with the overall [O iii] luminosity for Type 2 AGN (Zakamska et al. 2003). The presence of blue optical continua in Type 2 AGN (i.e., bluer than that of an old stellar population) has received a fair amount of attention in the literature (e.g., González-Delgado & Pérez 1993; Heckman et al. 1995; Fernandes et al. 2001; Kauffmann et al. 2003; Zakamska et al. 2003), and is thought to be the result of a natural correlation between nuclear activity and starburst activity in the host galaxy, such that more luminous Type 2 AGN are accompanied by an overall younger stellar population. In addition, there are indications that the optical continuum color gets bluer with increasing [O iii] luminosity (Zakamska et al. 2003). Since low-z Lyα nebulae appear to be drawn from the high-luminosity end of the Type 2 AGN population, we would expect them to exhibit bluer optical continuum and higher [O iii] equivalent widths. It is plausible therefore that the low-z Lyα nebulae phenomenon is related to high nuclear activity, which is correlated with high mid-infrared luminosity, more star formation, bluer optical continua, and higher [O iii] equivalent widths, all of which lead to an object being selected as a "Green Bean" in color–color space.
Despite being some of the more luminous Type 2 AGN at this redshift, the low-z Lyα nebulae are not dramatically larger than other Type 2 AGN, at least in terms of broadband sizes. If the broadband measurements are giving us a correct impression of the relative sizes, this is consistent with findings that the size of the AGN narrow-line region (NLR) scales with the power of the central engine only out to a characteristic radius, after which point the size–luminosity relation seems to flatten (e.g., Hainline et al. 2013, 2014; Liu et al. 2013; Sun et al. 2017). Early explanations for this flattening suggested that the maximum size of the NLR is set not by the available energy from the central engine, but rather by the extent of the gas that is at the right density and ionization state to produce [O iii] emission. Beyond this characteristic radius, the gas is too low density or too highly ionized to produce observable [O iii]: effectively a matter-bounded scenario. More recent modeling has suggested that this matter-bounded effect alone may not be sufficient to explain the turn-over in the size–luminosity relation, instead indicating that it may be due to the effect of optically thick clouds shielding gas beyond a certain distance from the ionizing impact of the AGN (Dempsey & Zakamska 2018). Putting low-z Lyα nebulae in context with this previous work on the size–luminosity relation will require measuring the nebular sizes of this sample using a consistently applied size definition (e.g., Liu et al. 2013). Nonetheless, the relative sizes derived from SDSS broadband imaging are consistent with the picture in which the luminosity is not the sole driver of the extent of the NLR, even for luminous Type 2 AGN like those powering low-z Lyα nebulae.
This work motivates further imaging and spectroscopic follow-up of both low-z Lyα nebulae and other luminous Type 2 AGN. Previous work has suggested that the central engine in low-z Lyα nebulae may be in the process of shutting down, leaving behind extended emission line ionization echoes (Schirmer et al. 2013, 2016; Kawamuro et al. 2017). If true, studying low-z Lyα nebulae and other Type 2 AGN at similar luminosities may provide insight into the mechanisms and conditions responsible for triggering such a ramp down in nuclear activity.
In being AGN powered, low-z Lyα nebulae are similar to high-redshift Lyα nebulae, which often show evidence of AGN activity (e.g., Overzier et al. 2013; Prescott et al. 2015b). Yet, there are also hints that low-z Lyα nebulae show some distinct differences. Schirmer et al. (2016) found that the environments of low-z Lyα nebulae were often average or even underdense, in contrast to the generic finding that high-redshift Lyα nebulae reside in overdense regions that are in the process of forming galaxy groups and clusters (e.g., Saito et al. 2006; Prescott et al. 2008; Yang et al. 2009, 2010). While high-redshift Lyα nebulae that have been studied at high spatial resolution appear to be messy, asymmetric, dynamically unrelaxed regions containing both high angular momentum gas and many disky, star-forming galaxies (e.g., Prescott et al. 2012, 2015a), low-z Lyα nebulae are for the most part centered on a single galaxy, often with signs of bipolar outflows (Davies et al. 2015; Schirmer et al. 2016; Kawamuro et al. 2017). More extensive follow-up of the emission line luminosities, kinematics, and environments of extended nebulae at both low and high redshift will be important for better understanding the relationship between the two populations and, potentially, for providing new constraints on the evolution of the circumgalactic medium and galaxy formation physics across cosmic time.
7. Conclusions
We present follow-up spectroscopy for a subset of the z ≈ 0.3 Lyα nebulae from Schirmer et al. (2013, 2016). Our spectroscopic results show that low-z Lyα nebulae are powered by Type 2 AGN, with high excitation line emission, relatively narrow line widths (FWHM ≲ 1000 km s−1), and typical ionizing continua. They do appear to have intrinsically bluer optical continua and higher [O iii] equivalent widths than Type 2 AGN at the same redshift, both of which are consistent with low-z Lyα nebulae being more luminous overall than the average Type 2 AGN at the same redshift. Low-z Lyα nebulae have larger r-band sizes and lower r concentrations than star-forming Green Pea galaxies, but are comparable in r-band size and concentration to the larger Type 2 AGN population. Using the [O iii] emission line profiles, we compared the kinematics of the NLR gas in these objects to Type 2 AGN, finding that low-z Lyα nebulae kinematically resemble the latter in terms of a variety of non-parametric measures. The only kinematic difference between the low-z Lyα nebula and Type 2 samples seems to be in the dimensionless kurtosis measurements, in the sense that the low-z Lyα nebula [O iii] emission line profiles have slightly weaker tails. Based on our pilot study, it appears that low-z Lyα nebulae represent a high-luminosity subset of normal Type 2 AGN. More extensive spectroscopic follow-up of the full low-z Lyα nebulae sample will be needed to further investigate these issues and to understand how they relate to Lyα nebulae at higher redshifts.
The authors would like to thank Kristian Finlator and Steve Finkelstein for helpful discussions, Christy Tremonti, Eric Wilcots, and the University of Wisconsin-Madison Astronomy Department for their kind hospitality while we were working on this project, and the anonymous referee for suggestions that improved the paper.
Funding for SDSS-III has been provided by the Alfred P. Sloan Foundation, the Participating Institutions, the National Science Foundation, and the U.S. Department of Energy Office of Science. The SDSS-III website is http://www.sdss3.org/. SDSS-III is managed by the Astrophysical Research Consortium for the Participating Institutions of the SDSS-III Collaboration including the University of Arizona, the Brazilian Participation Group, Brookhaven National Laboratory, Carnegie Mellon University, University of Florida, the French Participation Group, the German Participation Group, Harvard University, the Instituto de Astrofisica de Canarias, the Michigan State/Notre Dame/JINA Participation Group, Johns Hopkins University, Lawrence Berkeley National Laboratory, Max Planck Institute for Astrophysics, Max Planck Institute for Extraterrestrial Physics, New Mexico State University, New York University, Ohio State University, Pennsylvania State University, University of Portsmouth, Princeton University, the Spanish Participation Group, University of Tokyo, University of Utah, Vanderbilt University, University of Virginia, University of Washington, and Yale University.