


Abstract
We present a study of the incidence of active galactic nucleus (AGN) in a sample of major merging systems at 0.3 < z < 2.5. Galaxies in this merger sample have projected separations between 3 and 15 kpc and are selected from the CANDELS/3D-Hubble Space Telescope catalogs using a peak-finding algorithm. AGNs in mergers and non-mergers are identified on the basis of their X-ray emission, optical lines, mid-infrared colors, and radio emission. Among galaxies with adequate measurements to find potential AGNs, we find a similar fraction of AGNs in mergers (16.4 %) compared to the fraction found in non-merging galaxies (15.4% ± 0.6%). In mergers, this fraction is obtained by assuming that, in unresolved observations, only one of the merging galaxies is the AGN source (16 merging systems have at least one AGN galaxy). The similarity between the fractions is possibly due to the higher availability of cold gas at high redshifts, where the excess of nuclear activity as a result of merging is less important than at lower redshifts. Star-forming galaxies have a higher incidence of AGNs than quiescent galaxies. In particular, starbursts in mergers are the most common sites of AGN activity, since they present higher AGN fractions and black hole accretion rates. We find no clear correlation between the black hole accretion rate and the galaxy properties (i.e., star formation rate, stellar mass) in mergers and non-mergers. However, mergers seem to have a higher correlation with star formation than non-mergers, which possibly indicates that the merging process is starting to influence the star formation and AGN activity even at this pre-coalescence stage.
Export citation and abstract BibTeX RIS
1. Introduction
Almost every massive galaxy harbors a supermassive black hole (SMBH; 105 < MBH/M⊙ < 1010) in its center (Kormendy & Richstone 1995; Kormendy & Ho 2013). These SMBHs grow via heavy accretion events. When material falls into the accretion disk surrounding the SMBH, huge amounts of energy can be released as radiation over a wide range of wavelengths, causing the galaxy to shine as an active galactic nucleus (AGN).
In order to accrete onto an SMBH, matter in a galaxy needs to lose 99% of its angular momentum, such that it can move from kpc scales to the inner regions of the galaxy center and reach the vicinity of the accretion disk (Shlosman et al. 1990). One of the main mechanisms proposed to explain the ignition of nuclear activity is the merging of two or more galaxies with similar mass, also known as major mergers (Sanders et al. 1988; Silk & Rees 1998; Springel et al. 2005). Numerical simulations of mergers (e.g., Hernquist 1989; Barnes & Hernquist 1996) suggest that, during the interaction of two galaxies, the gaseous content in them feels a strong gravitational torque from tidally induced stellar bars. The gas loses angular momentum and flows inward, the nuclei of the galaxies activating rapid accretion onto their respective SMBHs. In the final fusion of the merging galaxies, a second phase of inflow occurs, as gas is driven further inward to the final nucleus of the resultant galaxy.
Although a number of merger simulations show that merging is a very efficient way to trigger black hole growth in a short timescale (e.g., Di Matteo et al. 2005; Hopkins et al. 2008), observationally, the link between mergers and the triggering of AGN activity is not clear. This connection has been favored by the findings of a high fraction of AGN hosts with morphologies suggesting recent merger activities (Koss et al. 2010, 2012; Bessiere et al. 2012; Cotini et al. 2013; Goulding et al. 2018; Ellison et al. 2019) and an excess on the AGN fraction in merging galaxies and galaxy pairs compared to control samples (Alonso et al. 2007; Woods & Geller 2007; Ellison et al. 2011, 2019; Silverman et al. 2011; Lackner et al. 2014; Satyapal et al. 2014; Weston et al. 2017), suggesting that mergers are capable of triggering nuclear activity. However, a significant number of works have also severely questioned this connection (Gabor et al. 2009; Cisternas et al. 2011; Kocevski et al. 2012; Villforth et al. 2014; Rosario et al. 2015; Sabater et al. 2015; Mechtley et al. 2016; Villforth et al. 2017; Marian et al. 2019). It is suggested that the majority of the AGNs, especially the low- to mid-luminosity AGNs, are triggered by processes other than mergers (such as secular processes), while major mergers trigger only the most luminous AGNs (Urrutia et al. 2008; Treister et al. 2012; Menci et al. 2014; Glikman et al. 2015; Fan et al. 2016; Weigel et al. 2018), although recent observations of Villforth et al. (2017) and Hewlett et al. (2017) question such a relation.
In addition to triggering AGN activity, major mergers are expected to enhance the star formation in the system (Kartaltepe et al. 2012; Yuan et al. 2012; Hung et al. 2013; Lanz et al. 2013; Patton et al. 2013). This picture is supported by observations of local starbursts, since the majority of them show disturbed morphologies as a result of recent merger activity; for further details, see Armus et al. (1987), Sanders & Mirabel (1996), Kartaltepe et al. (2010), Ellison et al. (2013), and Espada et al. (2018). However, as predicted by recent simulations (Perret et al. 2014; Scudder et al. 2015; Fensch et al. 2017), high-redshift galaxy mergers have been observed to be inefficient at enhancing the star formation activity in the system and producing starbursts (Xu et al. 2012; Kaviraj et al. 2013, 2015; Lofthouse et al. 2017; Silva et al. 2018; Pearson et al. 2019; Wilson et al. 2019), therefore it is also possible that high-z mergers are inefficient at triggering AGN activity. However, studies of the effects of mergers at high redshifts on igniting starburst and AGN activities are scarce due to the difficulty of finding samples of high-z mergers. Some of the methods to find them include the selection of galaxy pairs (at close projected separations and redshift), which potentially are mergers before coalescence (e.g., Robaina et al. 2010; Williams et al. 2011; Lackner et al. 2014; Tasca et al. 2014); the selection of galaxies with morphologies suggesting recent or post-merger activity (e.g., Bridge et al. 2010; Cisternas et al. 2011; Kartaltepe et al. 2015); and the use of deep learning techniques that perform visual-like classification of merging galaxies (e.g., Pearson et al. 2019).
Another important topic to explore observationally is the existence (or lack) of the correlation between the black hole accretion rate (BHAR) and the star formation rate (SFR) in mergers, to analyze the level of star formation and black hole accretion they can induce and compare with the level produced by non-merging galaxies. This topic arises from the observed correlation between the mass of the stellar bulge in a galaxy (and also the velocity dispersion) and the mass of its central supermassive black hole (Magorrian et al. 1998; Ferrarese & Merritt 2000; Gebhardt et al. 2000; Marconi et al. 2004) (with a local correlation value of MBH/Mbulge ∼ 1.5 × 10⁻³, per McLure & Dunlop 2002), suggesting a parallel evolution between the black hole and the stellar mass of the host galaxy. For this co-evolution to take place, the BHAR should be proportional to the SFR in the galaxy, especially the star formation rate that builds up the bulge. Both the black hole accretion and the star formation in a galaxy need a common fuel of cold gas supply to arise. However, the spatial scales at which these processes take place are vastly different (many kpc and sub-pc scales for star formation and black hole accretion, respectively). Since galaxy mergers have been proposed as the main mechanism responsible for triggering the loss of angular momentum of the cold gas from kpc to pc scales, it is expected that the resultant galaxies will have an SMBH and the stellar content growing in a parallel way. In contrast, galaxies growing through secular processes should have unrelated black hole and stellar growth. Observationally, the link between the star formation rate and the black hole accretion rate is debated, with some works indicating that, at low AGN luminosities (Lbol < 1045 erg s−1), these rates are uncorrelated (Lutz et al. 2010; Shao et al. 2010; Rosario et al. 2012; Rovilos et al. 2012), while in high-luminosity AGNs (which are possibly triggered by mergers), a significant correlation emerges (Lutz et al. 2008; Serjeant et al. 2010), although some works also find weak or inverted connections (Harrison et al. 2012; Page et al. 2012). The feedback model of Silk (2013), which couples star formation and black hole accretion via outflow-induced pressure-enhanced star formation, predicts an average BHAR/SFR ∼ 10−3. On the contrary, Volonteri et al. (2015a) use hydrodynamical simulations of galaxy mergers at different merger stages and find no strong correlation between the BHAR and the SFR.
In this paper, we investigate the role of mergers (major mergers with mass ratio >1:4) in triggering black hole growth at 0.3 < z < 2.5. We study AGN activity in the sample of major mergers obtained in Silva et al. (2018), which is the first paper of the series. In Silva et al. (2018), we investigated the influence of galaxy mergers on star formation by studying a sample of merging galaxies with nuclei projected separations between 3 and 15 kpc and in the redshift range of 0.3 < z < 2.5. We compared the star formation activity between mergers and non-mergers and found no significant difference between them, suggesting that high redshift mergers at this stage are possibly less efficient than their local counterparts at enhancing the star formation activity in galaxies. Here, we identify AGNs in this sample of mergers by analyzing their X-ray and radio luminosity, optical line emissions, and mid-infrared colors, and compare their AGN activity with non-merging galaxies. Section 2 presents the sample and the multiwavelength data used to identify AGNs, while Section 3 details the adopted AGN selection criteria. Section 4 presents the results, which are then discussed in Section 5. Finally, Section 6 summarizes the paper and its conclusions. Throughout this paper, we adopt a cosmology with H0 = 70 km s−1 Mpc−1, ΩΛ = 0.7, and Ωm = 0.3. Magnitudes are in the AB system.
2. Data
2.1. Merger Sample
Full details on the selection of galaxy mergers are described in Silva et al. (2018). Here, we only present the key aspects: Galaxy pairs were selected by applying the technique described in Lackner et al. (2014) to near-IR H160 postage stamps. These postage stamps were centered on 5717 galaxies with log(M⋆/M⊙) ≥ 10, mAB < 24.5, and 0.3 < z < 2.5, which were obtained from the 3D-Hubble Space Telescope (HST) catalogs (Skelton et al. 2014; Momcheva et al. 2016). We selected galaxy pairs with nuclei separations between 3 and 15 kpc and with mass and flux ratios ≥1:4, to later select potential major mergers. We found that 28% of the selected galaxy pairs were unresolved in the 3D-HST catalogs (thus the total number of sources in the sample increased to 5907 7 ). We extracted deblended photometry for these galaxies and derived photometric redshifts, colors, and stellar population properties.
We used the redshift values of the galaxies in pairs, provided by the 3D-HST catalogs and the deblended photometry (photometric, grism, and spectroscopic redshifts) to separate potential mergers of line-of-sight contaminants. We defined mergers as galaxies that are consistent with being at the same redshift within a 3σ uncertainty (when using either photometric or grism redshifts), or if the redshifts differ by less than 0.001 (if both have spectroscopic redshift). We found 130 major merging systems in which the merging galaxies have masses in the range  (primary sample). Since star-forming clumps in galaxies usually have stellar masses
  (Guo et al. 2012), we constructed a more restrictive sample of major mergers (high-mass sample) in which both merging galaxies have stellar masses log(M⋆/M⊙) ≥ 10.
8
This high-mass sample contains 64 merging systems (128 galaxies). The sample of non-merging galaxies (i.e., galaxies not selected as mergers) with masses log(M⋆/M⊙) ≥ 10 consists of 5718 galaxies. In this work, we focus the study on the incidence of AGNs in mergers using the high-mass sample.
(Guo et al. 2012), we constructed a more restrictive sample of major mergers (high-mass sample) in which both merging galaxies have stellar masses log(M⋆/M⊙) ≥ 10.
8
This high-mass sample contains 64 merging systems (128 galaxies). The sample of non-merging galaxies (i.e., galaxies not selected as mergers) with masses log(M⋆/M⊙) ≥ 10 consists of 5718 galaxies. In this work, we focus the study on the incidence of AGNs in mergers using the high-mass sample.
We used the rest-frame U − V and V − J colors (or UVJ colors) to separate merging galaxies into quiescent, unobscured star-forming, and dusty star-forming by using the criteria defined in Whitaker et al. (2015) and Martis et al. (2016). As found in Silva et al. (2018), for the 128 galaxies in the merger sample, 35.9% ± 5.3%, 21.9% ± 3.4%, and 42.2% ± 5.7% are quiescent, unobscured, and dusty star-forming galaxies, respectively. For non-mergers, the fractions are 30.5% ± 0.7%, 28.8% ± 0.7%, and 40.7% ± 0.8%, respectively.
We separated mergers into wet (both galaxies are star-forming, i.e., dusty or unobscured), mixed (one quiescent and one star-forming galaxy), and dry (both galaxies are quiescent) and found that 53.1% ± 6.4%, 21.9 , and 25.0
 of the major mergers correspond to wet, mixed, and dry mergers, respectively.
Star formation rates were obtained from a combination of rest-frame UV emission and mid-IR photometry obtained from Spitzer/MIPS imaging following Whitaker et al. (2012). When MIPS 24 μm data were not available or for detections with signal-to-noise ratio (S/N) < 3, the SFRs were obtained from the modeling of the spectral energy distributions (SEDs).
We found no difference in the star formation activity between merging and non-merging galaxies and only  of the star-forming galaxies in mergers (6.5% ± 0.4% in non-mergers) are a starburst galaxy, i.e., a galaxy that lies 0.5 dex above the main-sequence fit of Whitaker et al. (2014). All of these starbursts are in wet mergers and are dusty star-forming galaxies. Note that some of the starburst galaxies in the sample of non-mergers are possibly mergers in the coalescence phase.
2.2. X-Ray Data
We use publicly available X-ray catalogs to cross-match the merger sample and non-merging galaxies with X-ray sources. We use the AEGIS-X Survey (The Chandra Deep Survey of the Extended Groth Strip; Laird et al. 2009), the Chandra COSMOS legacy Survey (Civano et al. 2016; Marchesi et al. 2016), the CDF-N (2 Ms Chandra Deep Field-North Survey; Xue et al. 2016) the CDF-S survey (7 Ms Chandra Deep Field-South Survey; Luo et al. 2017), the Chandra counterparts of CANDELS GOODS-S sources (Cappelluti et al. 2016), the X-UDS survey (The Chandra Legacy Survey of the UKIDSS Ultra Deep Survey Field; Kocevski et al. 2018), the Chandra COSMOS Survey (Elvis et al. 2009), and the ZFOURGE catalog of AGN candidates (Cowley et al. 2016).
We cross-match merging and non-merging galaxies with the closest X-ray source found in the catalogs. These sources have fluxes above the flux limit of the respective catalog from where they were extracted. The separation used for matching is equal to the point-spread function (PSF) of the observations performed to obtain the catalogs (in the range 1 5–50). When the catalogs indicate that the X-ray sources have an optical counterpart, we use a matching separation of 1'' with respect to the optical position.
Of the 64 merging systems, 14 (21.9 %) are matched with an X-ray source. These mergers have galaxies with projected separations between 4.1 and 14.3 kpc (05–19), therefore we are not able to distinguish which of the merging galaxies is the source of X-ray emission. The X-ray matched sources have fluxes in the 0.5−7 keV band of fx
= 3.8 × 10⁻¹⁷–2.4 × 10⁻¹⁴ erg s−1 cm−2 and are at redshifts 0.68 < z < 2.13, corresponding to X-ray luminosities of Lx
= 4.2 × 1041–3.9 × 1044 erg s−1. In the case of non-merging galaxies, 555 (9.7% ± 0.4%) are identified with an X-ray source. The sources have fluxes in the range fx
= 1.2 × 10⁻¹⁷–1.3 × 10⁻¹³ erg s−1 cm−2 and redshifts 0.31 < z < 2.49, corresponding to X-ray luminosities Lx
= 1.4 × 1040–5.7 × 1044 erg s−1.
%) are matched with an X-ray source. These mergers have galaxies with projected separations between 4.1 and 14.3 kpc (05–19), therefore we are not able to distinguish which of the merging galaxies is the source of X-ray emission. The X-ray matched sources have fluxes in the 0.5−7 keV band of fx
= 3.8 × 10⁻¹⁷–2.4 × 10⁻¹⁴ erg s−1 cm−2 and are at redshifts 0.68 < z < 2.13, corresponding to X-ray luminosities of Lx
= 4.2 × 1041–3.9 × 1044 erg s−1. In the case of non-merging galaxies, 555 (9.7% ± 0.4%) are identified with an X-ray source. The sources have fluxes in the range fx
= 1.2 × 10⁻¹⁷–1.3 × 10⁻¹³ erg s−1 cm−2 and redshifts 0.31 < z < 2.49, corresponding to X-ray luminosities Lx
= 1.4 × 1040–5.7 × 1044 erg s−1.
2.3. Optical Line Data
The 3D-HST catalogs provide optical line measurements such as [O iii]λ5007 at 1.4 < z < 2.2 and Hβ at 1.5 < z < 2.3, which can be used to find potential AGNs. We select only galaxies in which the [O iii] and Hβ fluxes are available and have an S/N ≥ 3, as we will use the mass-excitation diagram of Juneau et al. (2014) to identify AGNs in Section 3.2. We find that six individual merging galaxies (in five systems) have both [O iii] and Hβ measurements. These galaxies are at 1.68 < z < 2.1 and have projected separations between 4.8 and 13.8 kpc. They have [O iii] fluxes in the range f[O iii] = 3.8 × 10⁻¹⁷–5.6 × 10⁻¹⁶ erg s−1 cm−2, which correspond to luminosities L[O iii] = 2.4 × 1042–5.5 × 1043 erg s−1, and Hβ fluxes fHβ = 2.5 × 10⁻¹⁷–9.0 × 10⁻¹⁷ erg s−1 cm−2 and luminosities LHβ = 1.7 × 1042–8.9 × 1042 erg s−1. For non-mergers, 228 galaxies have both [O iii] and Hβ measurements and are at 1.4 < z < 2.3. The galaxies have [O iii] fluxes in the range f[O iii] = 2.1 × 10⁻¹⁷–5.6 × 10⁻¹⁵ erg s−1 cm−2, which correspond to luminosities L[O iii] = 1.1 × 1042–3.7 × 1044 erg s−1, and have Hβ fluxes in the range fHβ = 1.1 × 10⁻¹⁷–3.0 × 10⁻¹⁵ erg s−1 cm−2 corresponding to a range in luminosities LHβ = 7.7 × 1041–2.4 × 1044 erg s−1.
2.4. Mid-infrared Data
Spitzer/IRAC 3.6, 4.5, 5.8, 8.0 μm fluxes for our sample of mergers and non-mergers are provided by the 3D-HST catalogs. The extraction of fluxes is described in detail in Skelton et al. (2014). Fluxes are obtained by measuring the mid-IR intensity using an aperture of 3'' on the Spitzer images. Contribution from neighboring blended sources in these images are obtained by using a high-resolution image. Fluxes are corrected to account for flux that falls outside the aperture due to the large PSF size of the Spitzer observations. Of the 128 galaxies in 64 merging systems, 102 galaxies have measured Spitzer/IRAC fluxes with S/N ≥ 3 in the four IRAC bands (44 systems have measurements in both merging galaxies). These mergers have galaxies with projected separations 3.7–14.3 kpc and are in the redshift range 0.5 < z < 2.4. In the case of non-mergers, 4493 galaxies have measured IRAC fluxes and are at 0.31 < z < 2.5.
2.5. Radio Data
We cross-match the merger sample and non-merging galaxies with radio sources in published radio catalogs. We use the AEGIS20 Survey (a radio survey of the Extended Groth Strip; Ivison et al. 2007), the Very Large Array (VLA)-COSMOS survey (Schinnerer et al. 2007), the VLA 1.4 GHz survey of the Extended Chandra Deep Field-South (Miller et al. 2008), VLA 1.4 GHz observations of GOODS-North field (Morrison et al. 2010), and the ZFOURGE catalog of AGN candidates (Cowley et al. 2016).
Since the resolution of the radio observations at 1.4 GHz ranges from 17 to 38, we match merging and non-merging galaxies with the closest radio source at a separation that depends on the beam size. Of the 64 merging systems, 5 (7.8 %) are matched with a radio source. These systems are at redshift 0.70 ≤ z ≤ 2.11 and have galaxies with projected separations 6.9−12.2 kpc (083–15), therefore we are not able to identify which of the merging galaxies is the source of radio emission. The matched radio sources have fluxes in the range f1.4 GHz = 0.03−0.26 mJy, which correspond to luminosities L1.4 GHz = 4.1 × 1039–8.4 × 1040 erg s−1, and the separation between the merging and the radio sources ranges 014−154. In the case of non-merging galaxies, 237 (4.1% ± 0.3%) are identified with a radio source. The radio sources have fluxes in the range f1.4 GHz = 0.02−16.9 mJy, redshifts 0.32 ≤ z ≤ 2.49, luminosities L1.4 GHz = 2.9 × 1038–2.8 × 1042 erg s−1, and separations between the galaxy and the radio source between 004 and 370.
3. AGN Identification
AGNs are unique sources that manifest their activity over a wide range of frequencies, due to the various processes that take place in them. Different methods are employed to identify AGNs at different wavelengths. In this section, we describe the selection of AGN candidates using techniques in the X-ray, optical, mid-IR, and radio wavelengths, and apply them to find potential AGNs in the samples of mergers and non-mergers.
3.1. X-Ray AGN Selection
To select X-ray AGNs, we use the technique described in Szokoly et al. (2004) and Cowley et al. (2016). This technique applies restrictions on the X-ray luminosity and the hardness ratio HR, which is defined as the normalized difference of counts in the soft and hard X-ray bands  . X-ray AGNs are selected using:


The X-ray luminosity is obtained from

where fx is the measured X-ray flux in erg s−1 cm−2, dl is the luminosity distance in cm, and Γ is the photon index of the X-ray spectrum. We use Γ = 1.4, a typical value of the photon index found in galaxies (Cowley et al. 2016). For the redshift z, we use the redshift values of the matched merging systems and non-merging galaxies. Based on this selection, we find that 10 of the 14 merging systems with matched X-ray sources are X-ray AGNs. All of these systems have HR measurements (in the range −0.34 < HR < 0.39), are at redshifts 0.68 < z < 2.13, and have fluxes fx = 7.9 × 10⁻¹⁷–2.4 × 10⁻¹⁴ erg s−1 cm−2 and luminosities Lx = 1.1 × 1042–3.9 × 1044 erg s−1. In the case of non-mergers, we find that 455 of the 555 X-ray matched sources are AGNs. These AGNs are in the redshift range 0.34 < z < 2.49, and have fluxes fx = 1.9 × 10⁻¹⁷–1.3 × 10⁻¹³ erg s−1 cm−2 and luminosities Lx = 1.0 × 1041–5.7 × 1044 erg s−1.
3.2. Optical Line AGN Selection
We use the method described in Juneau et al. (2014) to find AGNs using both the [O iii] and Hβ optical lines. For galaxies with masses log(M⋆/M⊙) ≥ 10, AGNs are selected as galaxies in which
where f[O iii]/fHβ is the ratio of the [O iii] and Hβ line fluxes and M⋆ is the stellar mass of the galaxies. This restriction selects galaxies containing AGNs with a probability between 60% and 85%. Based on this selection, we find that four of the six galaxies in mergers with optical lines are optically selected AGNs. These galaxies are at 1.68 < z < 2.1 and are in mergers with separations 4.9–13.8 kpc. Two AGNs are found in one system, i.e., it is a dual AGN system (two AGNs separated by a closed projected separation; e.g., Gross et al. 2019; Rubinur et al. 2019; Solanes et al. 2019). In the case of non-mergers, 180 of the 228 galaxies with [O iii] and Hβ measurements are AGNs and are in the redshift range 1.4 < z < 2.3.
3.3. Mid-infrared AGN Selection
We use the fluxes f3.6 μm, f4.5 μm, f5.8 μm, and f8.0 μm in the four IRAC bands to identify mid-IR selected AGNs using the description indicated in Donley et al. (2012). Mid-IR AGNs are those that follow these five conditions (valid for z < 2.7):
- 1.f4.5 μm > f3.6 μm, f5.8 μm > f4.5 μm, and f8.0 μm > f5.8 μm.
- 2.

- 3.
- 4.
- 5.


![${\mathrm{log}}_{10}\left(\tfrac{{f}_{8.0\mu {\rm{m}}}}{{f}_{4.5\mu {\rm{m}}}}\right)\geqslant \left[1.21\times {\mathrm{log}}_{10}\left(\tfrac{{f}_{5.8\mu {\rm{m}}}}{{f}_{3.6\mu {\rm{m}}}}\right)\right]-0.27$](https://content.cld.iop.org/journals/0004-637X/909/2/124/revision2/apjabdbb1ieqn13.gif)
![${\mathrm{log}}_{10}\left(\tfrac{{f}_{8.0\mu {\rm{m}}}}{{f}_{4.5\mu {\rm{m}}}}\right)\leqslant \left[1.21\times {\mathrm{log}}_{10}\left(\tfrac{{f}_{5.8\mu {\rm{m}}}}{{f}_{3.6\mu {\rm{m}}}}\right)\right]+0.27.$](https://content.cld.iop.org/journals/0004-637X/909/2/124/revision2/apjabdbb1ieqn14.gif)
Of the 102 galaxies with measured IRAC fluxes, we find that two galaxies are mid-IR selected AGNs. The galaxies have projected separations of 7.4 and 12.2 kpc and redshifts z = 1.9 and 2.11. For non-mergers, 81 of the 4493 galaxies with measured mid-IR fluxes are AGNs and are in the redshift range 0.44 < z < 2.49.
3.4. Radio AGN Selection
Radio AGNs are identified as those sources that have an excess of the star formation rate in the radio compared to the star formation rates obtained in the Infrared and UV wavelengths. When this Radio-AGN activity index is above 3 (SFRRadio/SFRUV+IR > 3), galaxies are classified as radio AGNs (Rees et al. 2016). The UV and IR star formation rates correspond to the unobscured and obscured star formation activity in the galaxies, respectively. The use of the SFRUV+IR and not only the SFRIR in the radio-AGN activity index avoids the misclassification as a radio-AGN of radio, low-dust, star-forming galaxies, which can produce an excess in the SFRRadio if they are compared only with the obscured star formation.
The ten galaxies in the five merging systems with matched radio sources have SFRs obtained from the combination of rest-frame UV emission and mid-IR photometry obtained from Spitzer/MIPS imaging. For the 237 non-merging galaxies with matched radio sources, 217 have SFRs from UV+IR and 20 from modeling their SEDs.
The SFRRadio is measured from the rest-frame radio luminosity LRadio using the description indicated in Cowley et al. (2016):

The rest-frame radio luminosity is given by

where dl is the luminosity distance in cm, fRadio is the measured radio flux in W m−2 Hz−1, and α is the radio spectral index. In this work, we use the standard α = − 0.7 value. 9 The redshift z is obtained from redshift values of the matched mergers and non-merging galaxies.
We measure the radio-AGN activity index in non-mergers by measuring the ratio of the SFRRadio of the matched radio source over the measured SFR value (SFRUV+IR or SFRSED). In the case of mergers, since we do not know which of the merging galaxies is the radio-AGN source, we assume that the galaxy with the highest SFRUV+IR is the radio source. Therefore, the radio-AGN activity index in mergers is a lower limit.
We find that four of the five radio-matched merging systems are radio-AGNs. These AGNs have radio luminosities L1.4 GHz = 4.1 × 1039–8.4 × 1040 erg s−1, are in systems in which the merging galaxies have projected separations 6.9–10.7 kpc (083–15), and are at redshifts 0.70 < z < 2.11. For non-mergers, 81 of the 237 matched galaxies are radio-AGNs. The AGNs have luminosities L1.4 GHz = 3.3 × 1038–2.8 × 1042 erg s−1 and are in the redshift range 0.32 < z < 2.48.
3.5. Combined Selection
We combined the results of the previous AGN selections to analyze how many merging systems and non-merging galaxies have single or multiple AGN types. Of the 64 merging systems, 58 systems (105 galaxies) have either a matched X-ray source, IRAC colors in the four bands, [O iii] and Hβ optical lines, and/or a matched radio source. We find that ten and four systems are identified with an X-ray and a radio AGN, respectively, and four and two individual merging galaxies (in three and two merging systems) are optical- and mid-IR-selected AGNs, respectively. There are 13 systems identified with only one AGN type, while three systems are identified with multiple AGN types. In the case of non-mergers, 4625 galaxies have measurements to find potential AGNs. We find that 703 galaxies are identified as AGNs with 455, 180, 81, and 81 identified as X-ray, optical, mid-IR, and radio AGN, respectively. Of these 703 AGNs, 626 galaxies are identified with one AGN type and 77 with multiple AGN types. Figure 1 presents Venn diagrams indicating the combination of the results of the matched sources and AGN galaxies selected in the different wavelength ranges. 10

Figure 1. Venn diagrams indicating the combinations in the selection of sources at different wavelengths. Overlapping regions between samples correspond to the relative number of sources selected in multiple wavelengths. Left and right panels present the values for mergers and non-mergers, respectively. For simplification, in mergers, we include the distribution of merging systems because we are not able to resolve which of the merging galaxies in X-ray- and radio-selected AGNs is the AGN source (Sections 3.1 and 3.4). For non-mergers, we use the values of the selected galaxies. Top panels correspond to the number of merging systems and non-merging galaxies with measurements to find potential AGNs, i.e., they have either a matched X-ray or a radio source, [O iii] and Hβ fluxes, or IRAC colors in the four bands (Section 2). Middle and bottom panels show the number of sources and the repartition in percentage of selected AGNs at the different wavelengths, respectively (Section 3).
Download figure:
Standard image High-resolution image4. Results
4.1. Total AGN Fraction
4.1.1. Non-mergers
The total AGN fraction for non-mergers can be obtained from fAGN = NAGN/NT, which is the ratio of the number of galaxies that are AGNs (NAGN = 703) and the number of galaxies with measurements to find potential AGNs (NT = 4625, Section 3.5). In this case, the total AGN fraction in non-mergers is fAGN = 15.2% ± 0.6%. Uncertainties are obtained from 10,000 Monte Carlo realizations, where for each matched source, we draw a flux from the measured fluxes (fx , f[O iii], fHβ , f3.6 μm, f4.5 μm, f5.8 μm, f8.0 μm, f1.4 GHz) and perturb them with the errors of the flux measurements. For each realization, we calculate how many galaxies meet the criteria to be classified as AGNs and calculate the AGN fraction. The uncertainty is calculated from the standard deviation of the resulting fractions and then added in quadratures with 1σ errors obtained from Poisson statistics (Gehrels 1986). Due to the varying sensitivity of the Chandra observations, the denominator in the fraction needs to be corrected to account for the effective number of galaxies for which an X-ray-selected AGN could have been detected, as in Silverman et al. (2011).
The corrected AGN fraction is obtained from:
The fraction fnonXR 11 corresponds to the ratio of the number of AGNs not selected in X-ray at all (NAGN-nonXR = 248) and the total number of galaxies with measurements to find potential AGNs (NT = 4625). The fraction fXR is the AGN fraction for X-ray-selected AGNs (even if they were identified as AGNs in other wavelengths). In this case, for each X-ray-selected AGN (with a total of NAGN-XR = 455 galaxies), we measure the number of effective galaxies in which we could have detected an X-ray AGN (Neff-i ) and then add the number of galaxies with measurements to find potential AGNs in optical, mid-IR, and radio only (NnonXR = 4070). To calculate Neff-i , we produce the luminosity sensitivity function (LSF; Birchall et al. 2020), which is the distribution of the fraction of galaxies where an AGN could have been detected above a given X-ray luminosity. To obtain this function, we use all the sources in our sample (mergers and non-mergers) that are spatially matched with an X-ray source (575 galaxies). For each of these matched galaxies, we assign a flux limit that corresponds to the flux limit of the survey where the galaxy was extracted. Using the redshifts of the matched galaxies in our sample, the flux limit is converted into a luminosity limit. The cumulative histogram as a function of the luminosity limits of these sources is normalized by the size of the sample of matched galaxies (Figure 2).
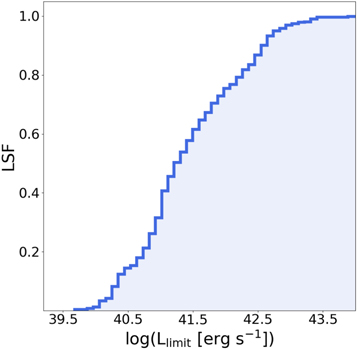
Figure 2. Luminosity sensitivity function (LSF) as a function of X-ray luminosity. This function indicates the fraction of galaxies where an AGN could have been detected above a given X-ray luminosity.
Download figure:
Standard image High-resolution imageFor each X-ray-selected AGN with a luminosity Lx−i
, we use the LSF to measure the effective number of galaxies where the Chandra observations were sufficiently sensitive to detect an AGN of this luminosity. This effective number is given by Neff−i
= LSFi
× NXR, where NXR is the number of non-merging galaxies with measurements to find potential X-ray-selected AGNs (NXR = 555) and LSFi
is the value of the luminosity sensitivity function at a luminosity Llim = Lx−i
. For instance, for an X-ray-selected AGN with ![$\mathrm{log}({L}_{x}[\mathrm{erg}\,{{\rm{s}}}^{-1}])\geqslant 43.5$](https://content.cld.iop.org/journals/0004-637X/909/2/124/revision2/apjabdbb1ieqn15.gif) , the effective number of galaxies is Neff−i
= 1.0 × 555 = 555, while for an AGN with luminosity
, the effective number of galaxies is Neff−i
= 1.0 × 555 = 555, while for an AGN with luminosity ![$\mathrm{log}({L}_{x}[\mathrm{erg}\,{{\rm{s}}}^{-1}])$](https://content.cld.iop.org/journals/0004-637X/909/2/124/revision2/apjabdbb1ieqn16.gif) = 41.5, the effective number is Neff−i
= 0.61 × 555 = 338.5. After measuring Neff−i
for all the X-ray-selected AGNs, we sum them up and find a total corrected AGN fraction of fAGN‐c = 15.4% ± 0.6% (black filled circle in Figure 3). This fraction is not significantly different from the non-corrected AGN fraction fAGN = 15.2% ± 0.6%.
= 41.5, the effective number is Neff−i
= 0.61 × 555 = 338.5. After measuring Neff−i
for all the X-ray-selected AGNs, we sum them up and find a total corrected AGN fraction of fAGN‐c = 15.4% ± 0.6% (black filled circle in Figure 3). This fraction is not significantly different from the non-corrected AGN fraction fAGN = 15.2% ± 0.6%.
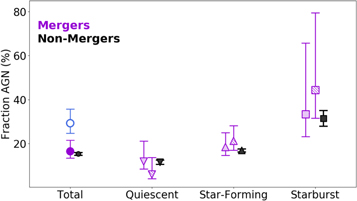
Figure 3. Fraction of AGNs in mergers (purple symbols) and in non-merging galaxies (black symbols). Circles show the total AGN fraction. Filled purple and open blue circles indicate the total fraction of AGNs in mergers assuming that, when the AGN galaxy is not resolved, one and two merging galaxies are AGNs, respectively. Upward- and downward-pointing triangles correspond to the AGN fraction for star-forming and quiescent galaxies, respectively. Dashed and dotted filling correspond to the assumption that, in mixed mergers, the emitter of an unresolved AGN is the star-forming and the quiescent galaxy, respectively. Squares correspond to the fraction of AGNs in galaxies that are starbursts (i.e., galaxies that lie 0.5 dex above the main-sequence fit presented in Whitaker et al. (2014)). Errors are obtained from Poisson statistics (Gehrels 1986).
Download figure:
Standard image High-resolution image4.1.2. Mergers
For the AGN fraction in mergers, in addition to correcting for the sensitivity variation of the X-ray observations, we need to take into account that, for X-ray and radio sources, we are not able to resolve which of the merging galaxies in a system is the emitter. All the merging galaxies used in this work have either resolved mid-IR colors or [O iii]+Hβ-detected lines, and thus the number of merging sources with measurements to find potential AGNs is NT = 105 (in 58 merging systems). The number of AGNs in mergers is measured in the following way. First, when mergers are identified solely with an X-ray or a radio AGN, we assume that one of the merging galaxies is the AGN source. If the X-ray/radio AGN is also an optical or mid-IR selected AGN, we assume that the resolved optical/mid-IR-selected AGN is also the X-ray/radio AGN. For mergers identified with an optical or mid-IR-selected AGN, the number of AGNs is just the number of individual galaxies identified with those AGNs. With this assumption, we find that 17 galaxies (in 16 merging systems) are active nuclei. We find NAGN-nonXR = 6, NnonXR = 77, NAGN-XR = 11, and NXR = 28 individual merging galaxies. We use the same LSF used for non-merging galaxies to measure the number of effective galaxies Neff−i
. The corrected AGN fraction for mergers is fAGN‐c = 16.4 % (purple filled circle in Figure 3). Without correction for the X-ray sensitivities, the AGN fraction would be fAGN = 16.2
 % which is not significantly different from the corrected fraction.
The second way to measure the AGN fraction in mergers is to assume that, when a system is identified with an X-ray or a radio AGN, the system is a dual AGN, even though one of the merging galaxies is also identified with an optical or mid-IR-selected AGN. Of the 16 merging systems with AGNs, one system contains two optically identified AGNs (also classified as an X-ray AGN), two systems contain only one AGN in each of them (in both cases, the AGNs are identified only in optical), and 13 systems are identified with an X-ray or radio AGN (some of them are AGNs identified also in other wavelengths). With this assumption, we find that 30 galaxies are active nuclei and the AGN fraction in mergers is fAGN‐c = 29.2 % (open blue circle in Figure 3). Therefore, the total fraction of AGNs in mergers ranges between this number and the fraction found assuming that one of the merging galaxies is the source of unresolved emission of the X-ray/radio AGNs. However, the general fraction of dual AGNs with respect to the total AGN population has been found to be low, i.e., 20%–30% at most (Rosario et al. 2011; Koss et al. 2012; Müller-Sánchez et al. 2015; Volonteri et al. 2016; Capelo et al. 2017; Rosas-Guevara et al. 2019; Solanes et al. 2019; Imanishi et al. 2020; Silverman et al. 2020). Therefore, the total AGN fraction should be closer to the lower value. We find that one of the 16 merging systems containing AGNs is a dual AGN (see Section 3.2), and it is possible that there are more of them in this mergers sample. Higher-resolution observations are needed to identify if the other 11 merging systems containing X-ray and/or radio AGNs are dual AGNs.
4.1.3. Comparison AGN Fraction between Mergers and Non-mergers
We find a similar AGN fraction in merging (16.4 %) and non-merging galaxies (15.4% ± 0.6%) when assuming that the source of the unresolved AGNs (X-ray or radio) is only one of the merging galaxies in a system. Since the [O iii] luminosity itself is an indicator of AGN activity at high luminosities, we compare the normalized distribution of the [O iii] luminosity between mergers and non-mergers (Figure 4). An excess in this distribution would suggest higher AGN activity. We select all merging and non-merging galaxies with [O iii] measurements and S/N ≥ 3, even if they do not have Hβ measurements as used in the data selection presented in Section 2.3. We find 13 and 730 merging and non-merging galaxies with [O iii] measurements, respectively. We perform a Kolmogorov–Smirnov (K-S) test between the distributions of the merging and non-merging samples, to quantify whether the two samples are consistent with coming from the same parent population. We find a P-value (probability of the plausibility of the null hypothesis) of P = 0.32, therefore the two populations are indistinguishable at more than 3σ (since P > 0.003
12
), in agreement with the lack of AGN excess in mergers found using the multiwavelength AGN selection.
%) and non-merging galaxies (15.4% ± 0.6%) when assuming that the source of the unresolved AGNs (X-ray or radio) is only one of the merging galaxies in a system. Since the [O iii] luminosity itself is an indicator of AGN activity at high luminosities, we compare the normalized distribution of the [O iii] luminosity between mergers and non-mergers (Figure 4). An excess in this distribution would suggest higher AGN activity. We select all merging and non-merging galaxies with [O iii] measurements and S/N ≥ 3, even if they do not have Hβ measurements as used in the data selection presented in Section 2.3. We find 13 and 730 merging and non-merging galaxies with [O iii] measurements, respectively. We perform a Kolmogorov–Smirnov (K-S) test between the distributions of the merging and non-merging samples, to quantify whether the two samples are consistent with coming from the same parent population. We find a P-value (probability of the plausibility of the null hypothesis) of P = 0.32, therefore the two populations are indistinguishable at more than 3σ (since P > 0.003
12
), in agreement with the lack of AGN excess in mergers found using the multiwavelength AGN selection.
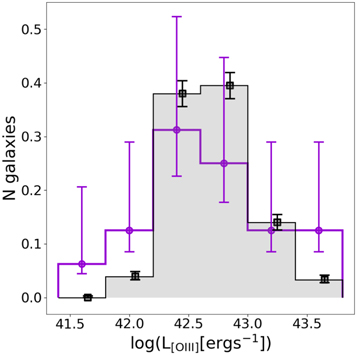
Figure 4. Normalized distribution of the [O iii] luminosity (sum of the values is 1) for merging (purple histogram) and non-merging galaxies (filled gray histogram). Error bars are obtained from Poisson statistic.
Download figure:
Standard image High-resolution imageIn the following results, we use the assumption that only one of the merging galaxies is the X-ray or the radio-selected AGN.
4.2. AGN Fraction for Different Merger/Galaxy Types
As indicated in Section 2.1, we separate galaxies into star-forming (dusty or unobscured) and quiescent using the rest-frame UVJ colors of the galaxies. Using this classification, we divide mergers into wet (two star-forming), mixed (one star-forming and one quiescent), and dry (two quiescent). The downward and upward triangles in Figure 3 present the AGN fraction for quiescent (fQ) and star-forming galaxies (fSF), respectively. For non-mergers, the fractions are obtained from the ratio of number of AGNs (NA) over the total number of galaxies (Nt) with measurements to find potential AGNs of their respectively galaxy type ( and
and  ). The AGN fractions in non-mergers are fQ = 11.4% ± 0.9% and fSF = 16.8% ± 0.7%.
13
For mergers, the AGN fraction for the different galaxy types is not straightforward. The complication arises in the case of a mixed merger identified with a non-resolved X-ray or radio AGN and with no other resolved AGN selected in optical or mid-IR. In wet and dry mergers, since both merging galaxies are of the same type, the emitter in an unresolved AGN will be either a star-forming or a quiescent galaxy, respectively. The AGN fraction for star-forming and quiescent merging galaxies will be measured in two ways: (1) the AGNs in mixed mergers arise from the star-forming galaxies (dashed purple triangles in Figure 3), which gives an AGN fractions of fQ = 5.9
). The AGN fractions in non-mergers are fQ = 11.4% ± 0.9% and fSF = 16.8% ± 0.7%.
13
For mergers, the AGN fraction for the different galaxy types is not straightforward. The complication arises in the case of a mixed merger identified with a non-resolved X-ray or radio AGN and with no other resolved AGN selected in optical or mid-IR. In wet and dry mergers, since both merging galaxies are of the same type, the emitter in an unresolved AGN will be either a star-forming or a quiescent galaxy, respectively. The AGN fraction for star-forming and quiescent merging galaxies will be measured in two ways: (1) the AGNs in mixed mergers arise from the star-forming galaxies (dashed purple triangles in Figure 3), which gives an AGN fractions of fQ = 5.9 % and fSF =
  %; (2) the AGNs arise from the quiescent galaxies (dotted purple triangles in Figure 3), resulting in AGN fractions of fQ = 11.8
 % and fSF = 18.3
 %. In summary, we find that, in non-mergers, the AGN fraction in star-forming galaxies is higher than in quiescent galaxies. The same trend is found in mergers, which is more significant when assuming that the unresolved AGN arises from the star-forming galaxy in a mix merger.
The square symbols in Figure 3 present the AGN fractions found for starbursts, i.e., galaxies that lie 0.5 dex above the main-sequence fit obtained by Whitaker et al. (2014). For non-mergers, the fraction is obtained from the ratio of the number of starbursts that are AGNs over the total number of starburst galaxies with measurements to find AGNs (fSB =  ). We find an AGN fraction in starbursting non-merging galaxies of fSB = 31.4% ± 3.6%. For mergers, we find an AGN fraction in starbursting merging galaxies of fSB = 44.4
 % (dashed purple square). However, this value is an upper limit, since we assume that, for non-resolved AGNs, the starburst is also the AGN galaxy.
14
If not, this value drops to fSB = 33.3
% (dashed purple square). However, this value is an upper limit, since we assume that, for non-resolved AGNs, the starburst is also the AGN galaxy.
14
If not, this value drops to fSB = 33.3 %
15
(dotted purple square). In any case, the AGN fraction in starbursts in mergers and non-mergers is higher than the total AGN fraction of the general population.
%
15
(dotted purple square). In any case, the AGN fraction in starbursts in mergers and non-mergers is higher than the total AGN fraction of the general population.
Figure 5 shows the fraction of AGNs in mergers depending of the merger type. We find AGN fractions of 4.3 , 20.0
 , and 19.3
 % for dry, mixed, and wet mergers, respectively. This results might suggest that the presence of a star-forming galaxy in a merging system increases the incidence of AGNs, although the excess in the fraction in wet and mixed mergers compared to dry mergers is not significant given the associated error bars.

Figure 5. Fraction of AGNs in merging systems, depending on their type. Blue square, green diamond, and red circle correspond to the AGN fraction in wet (two star-forming galaxies), mixed (one star-forming and one quiescent), and dry mergers (two quiescent galaxies), respectively. Errors are obtained from Poisson statistics.
Download figure:
Standard image High-resolution image4.3. Evolution AGN Fraction
Figure 6, left shows the fraction of AGNs in mergers (purple circles) and in non-mergers (black squares) as a function of redshift. The dotted line is the median of the three fraction values obtained for mergers. We find that the total AGN fraction in non-mergers increases with redshift, while for mergers it is almost constant at z ≲ 1.5 and increases at higher redshifts. We also include the evolution with redshift of the AGN fraction assuming that the unresolved AGNs are dual (blue circles in Figure 6).
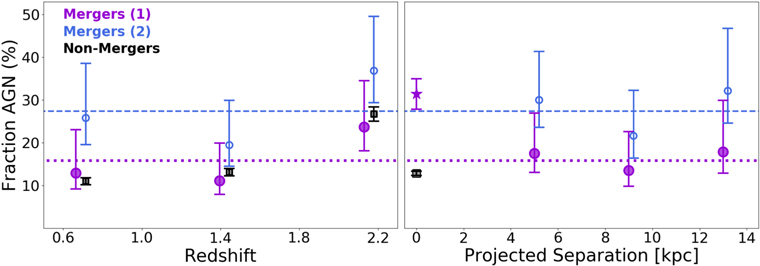
Figure 6. Fraction of AGNs in mergers and non-mergers as a function of redshift (left) and projected separation between the galaxy nuclei (right). Purple circles correspond to the AGN fraction in mergers assuming that one of the merging galaxies is the unresolved radio or X-ray AGN, while the small blue circles correspond to the AGN fraction assuming that both merging galaxies are the AGN source. Black squares on the left correspond to the AGN fraction as a function of redshift for non-merging galaxies, while the black squares on the right correspond to the total AGN fraction. Purple stars correspond to the fraction of AGNs assuming that all the starburst galaxies in our sample of non-mergers are mergers at the coalescence phase. Dashed and dotted lines indicate the mean of the fraction values obtained for mergers. Errors are obtained from Poisson statistics.
Download figure:
Standard image High-resolution imageFigure 6, right shows the fraction of AGNs in mergers as a function of the projected separation of the merging galaxies. The black square shows the total AGN fraction for non-merging galaxies. The AGN fractions in all bins of projected separation are marginally larger than the fractions for non-mergers—but not significantly so, due to the large error bars. Note that we are missing the coalescence phase, when the highest black hole accretion activity is expected (e.g., Springel et al. 2005; Hopkins et al. 2008; Debuhr et al. 2011). Some of the starburst galaxies in the non-merger sample are possibly mergers at the coalescence phase. For instance, Cibinel et al. (2019) investigate the fraction of close pairs and morphologically identified mergers on and above the star-forming main sequence at 0.2 < z < 2.0. They found that starburst galaxies are mostly dominated (more than 70%) by mergers in their late stages. If, for simplicity, we assume that all the starburst in the non-merging sample are mergers at coalescence
16
(78 of the 248 matched starbursting non-merging galaxies are AGN), then the fraction of AGNs at the coalescence phase (i.e., projected separation is zero) is 31.4% ± 3.6% (purple star in Figure 6) and we can see a clear increment in the AGN fraction at projected separations below 10 kpc. With this assumption, the total fraction of AGNs in mergers increases from  to 26.9% ± 2.8%, while the fraction in non-mergers changes from 15.4% ± 0.6% to 14.3% ± 0.6%. Therefore, the fraction of AGNs in non-mergers remains almost the same as originally measured, while in mergers it increases significantly. However, contrary to the merger origin of starbursts, there are also findings indicating that high-redshift starbursts could be the result of galaxies with high levels of cold gas content (Scoville et al. 2016; Oteo et al. 2017) rather than mergers at coalescence. It is out the scope of this paper to identify which of these starbursts are actually the result of a merger event.
4.4. Relation between BHAR and SFR
To analyze whether the black hole accretion rate (BHAR) is related to the star formation rate and/or the stellar mass in the galaxies, we use only X-ray and optically selected AGNs. With the X-ray and [O iii] luminosities of these AGNs, we can estimate their bolometric luminosity Lbol and the BHAR from Lbol =  , where
  is the matter-to-radiation efficiency conversion,
  is the black hole accretion rate, and c is the speed of light. Of the 703 non-merging galaxies with AGNs, 596 are X-ray and/or optically selected AGNs (we use 447 and 149 galaxies with X-ray and optical emission, respectively). For mergers, 12 systems are X-ray-selected AGNs while two merging galaxies are AGNs selected from their [O iii]+Hβ emission. When a merging system or a merging galaxy is selected as an optical- and X-ray-selected AGN, we will use the X-ray emission to measure the bolometric luminosity, because the [O iii] emission is uncorrected by dust attenuation. To perform this correction, a measurement of the Balmer decrement Hα/Hβ is necessary. However, these lines are not available simultaneously for our sources. Bolometric luminosities can be estimated assuming


where LX and L[O iii] are the X-ray and [O iii] luminosities, respectively. In X-ray, the bolometric luminosity is obtained by assuming a conversion factor kbol = 22.4, which is the median value obtained for local AGNs with Lx
= 1041–1045 erg s−1 (Vasudevan & Fabian 2007). When X-ray emission is not available, we obtain bolometric luminosities from the [O iii] line assuming the conversion factor of 3500 given in Heckman et al. (2004). This value is obtained for sources non-corrected by dust extinction. Assuming an efficiency of 10% (Marconi et al. 2004), the black hole accretion rate is given by

where the bolometric luminosity Lbol is in erg s−1 (Alexander & Hickox 2012). For mergers, we find bolometric luminosities in the range 2.4 × 1043–7.4 × 1046 erg s−1 and BHARs of 3.6 × 10⁻³–11.1 M⊙ yr−1 (median of 0.07 M⊙ yr−1). For non-mergers, bolometric luminosities are 2.2 × 1042–1.3 × 1048 erg s−1 and BHARs are in the range 3.4 × 10⁻⁴–194 M⊙ yr−1 (median of 0.04 M⊙ yr−1). For star-forming galaxies, we also measure the BHAR in starbursts and main-sequence galaxies (Table 1) to analyze whether starbursting galaxies have higher black hole accretion rates. We find that starbursting merging galaxies have higher accretion into their black holes compared to non-mergers (starbursts and main sequence) and main-sequence merging galaxies, although precaution has to be taken with this result, due to the poor statistics of starbursts. Figure 7 presents the position of merging and non-merging galaxies in the main-sequence diagram of star-forming galaxies. Galaxies are color-coded by the intensity of the BHARs. The diagram shows that the accretion rate into black holes increases with redshift.
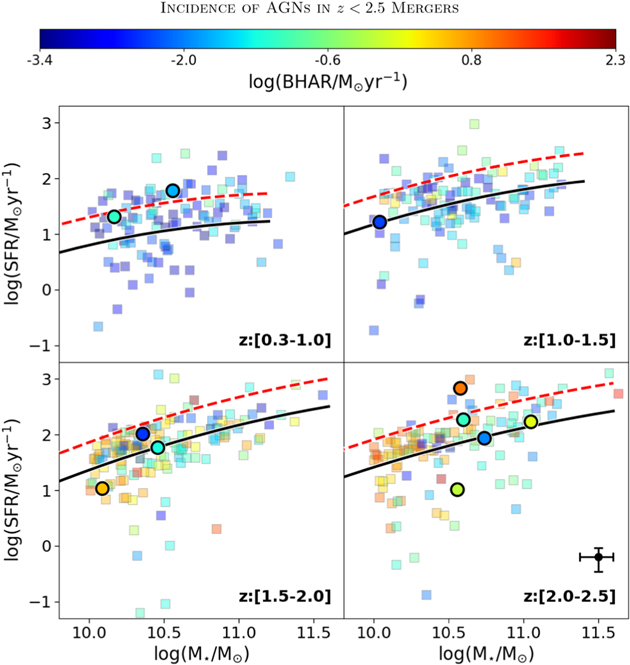
Figure 7. Star formation rate as a function of stellar mass for star-forming merging and non-merging galaxies in different redshift bins. Galaxies are color-coded by the intensity of black hole accretion rate. Circles are the positions of merging galaxies (11 of the 12 merging galaxies with X-ray and/or [O iii] emission are star-forming) while small squares are the positions of non-merging star-forming galaxies. Black curves show the main-sequence fit obtained by Whitaker et al. (2014). Red dashed curves indicate the minimum position for which galaxies are considered as starbursts. Median of the uncertainties in star formation rate and stellar mass are shown in the bottom right panel.
Download figure:
Standard image High-resolution imageTable 1. Values of the Black Hole Accretion Rate (BHAR) and Its Relation to the Star Formation Rate (SFR) for Optical or X-Ray-selected AGNs
| Median Values | Mergers | Non-mergers | |
|---|---|---|---|
| Lower SFR a (Ngal) | Higher SFR b (Ngal) | (Ngal) | |
| BHAR [M⊙ yr−1] | 0.07 (12) | 0.07 (12) | 0.06 (596) |
| BHAR Starbursts [M⊙ yr−1] | 11.1 (1) | 5.6 (2) | 0.02 (64) |
| BHAR Main Sequence [M⊙ yr−1] | 0.02 (7) | 0.08 (9) | 0.06 (417) |
| BHAR/SFR | 1.3 × 10⁻² (12) | 2.4 × 10⁻³ (12) | 1.9 × 10⁻³ (596) |
| BHAR/SFR (X-Ray Only) | 7.6 × 10⁻⁴ | 7.0 × 10⁻⁴ | 8.0 × 10⁻⁴ (447) |
| BHAR/SFR Starbursts | 1.6 × 10⁻² | 8.4 × 10⁻³ (2) | 1.0 × 10⁻⁴ (64) |
| BHAR/SFR MS. | 1.3 × 10⁻³ | 9.3 × 10⁻⁴ (9) | 2.2 × 10⁻³(417) |
Notes. In parenthesis are the number of galaxies taken for the measurements.
a Assuming that the merging galaxy in a system with the lowest star formation rate is the AGN source b Assuming that the merging galaxy in a system with the highest star formation rate is the AGN sourceDownload table as: ASCIITypeset image
We investigate the evolution of the relative growth rate of a galaxy and its central black hole at different cosmic times in mergers and non-mergers by measuring the ratio BHAR/SFR as a function of redshift. Figure 8 presents the median values of this ratio for mergers and non-mergers in the redshift range 0.3 < z < 2.5. For non-mergers, we show the median of the ratio in different redshift bins and find an increment with redshift—although not a significant one, given the high dispersion (black squares in Figure 8). The median of the BHAR/SFR ratios in the whole redshift range for non-mergers is 1.9 × 10⁻³ (dashed black line in Figure 8). Since the BHARs obtained from [O iii] luminosities are uncorrected by dust attenuation, we also analyze the ratio by using only the galaxies with BHARs obtained from X-ray emission. The median of the ratio in this case shows no evolution with redshift (orange triangles in Figure 8), similar to the lack of evolution shown in Silverman et al. (2009) for a sample of z ≲ 1 AGNs. However, we find a total median value for the ratio in non-mergers of 8.0 × 10⁻⁴ (dashed–dotted orange line in Figure 8), while Silverman et al. (2009) find 1.9 × 10⁻². This difference might be possible due to the different star formation rate indicators used in the measurements. Silverman et al. (2009) use the [O ii] line, which is known to be a tracer of current star formation activity, while in this work, we use star formation rates obtained from UV+IR, which trace long-term star formation. Because the X-ray AGNs are not resolved in 10 merging systems, we estimate the BHAR/SFR making two assumptions: the merging galaxy with the lowest and then with the highest star formation rate in a system is the AGN source. Differences in the measured values are listed in Table 1. When assuming that the merging galaxy with the highest SFR is the AGN source, we find a median for the BHAR/SFR ratio similar to that in non-mergers (2.4 × 10⁻³ and 1.9 × 10⁻³ for mergers and non-mergers, respectively). These values are similar to the values of the local relation MBH/Mbulge = 1.5 × 10⁻³ and the value predicted from the simulations of Silk (2013).

Figure 8. Ratio of the black hole accretion rate (BHAR) over the star formation rate (SFR) as a function of redshift for galaxies with X-ray or optically selected AGNs. Solid lines and filled purple circles correspond to the medians of the ratios over the whole redshift ranges for BHARs obtained from X-ray and/or [O iii] luminosities. Dashed filled circles and dotted purple lines are the medians for BHARs obtained using only the X-ray luminosities. For mergers, we assume that the merging galaxy with the highest star formation rate is the X-ray-selected AGN. Squares and triangles are the median of the ratios in different redshift bins for non-mergers. Black dashed and orange dotted-dashed lines indicate the medians of the BHAR/SFR ratios for non-merging galaxies over the whole redshift range. Lower and upper error bars correspond to the 15th and 85th percentiles of the distributions, respectively.
Download figure:
Standard image High-resolution imageFigure 9 presents the relation between the BHAR and the star formation rate and stellar mass for mergers and non-mergers. We perform linear fits of the type  , where x is log(M⋆) or log(SFR). The slopes in the BHAR versus stellar mass diagram are α = 0.38, −0.23, and 0.45 for mergers/non-mergers with BHARs obtained from the X-ray and/or [O iii] emission (BHARXR+[O III]) and non-mergers with BHARs from X-ray emission only (BHARXR), respectively. The slopes in the BHAR versus star formation rate diagram are α = 0.4, 0.17, 0.19 for mergers/non-mergers with BHARXR+[O III] and non-mergers with BHARXR, respectively. We find no correlation between the BHAR and the SFR and the stellar mass in non-mergers. In mergers, it seems that a correlation exists, but precaution has to be taken with this result, due to the poor statistics and the unresolved emission of the X-ray AGNs. In the Appendix, Figures 10 and 11 show more relations between the black hole accretion rate with the stellar mass and star formation rate.
5. Discussion
Numerical simulations suggest that, during a merger, there is a flow of large quantities of gas from kpc scales toward the central regions of the galaxies. When a merger is at coalescence, the system experiences the fastest black hole growth and the highest star formation activity (e.g., Springel et al. 2005; Hopkins et al. 2008; Debuhr et al. 2011). This is in agreement with observations mostly of z ≤ 1 galaxies, where AGNs, especially the brightest ones, have been found in advanced merger stages (e.g., Cotini et al. 2013; Goulding et al. 2018; Ellison et al. 2019). There are findings that show an excess of AGNs in galaxy pairs compared to isolated galaxies (e.g., Silverman et al. 2011; Satyapal et al. 2014; Ellison et al. 2019). Although our sample of 0.3 < z < 2.5 mergers contains galaxies with projected nuclei separations between 3 and 15 kpc, i.e., close to the coalescence stage, we find no such AGN excess (total AGN fractions of  and 15.4% ± 0.6%, respectively, for mergers and non-mergers) and no clear increment in the AGN fraction with decreasing projected separation between merging galaxies (Figure 6). In addition, in Silva et al. (2018), using the same sample of mergers used in this study, we found no difference between the star formation activity of mergers compared to non-mergers. The mass assembly of galaxies seems to occur in two main modes: merging and cold accretion through intergalactic filaments (Kauffmann et al. 1993; Kereš et al. 2005; Bournaud & Elmegreen 2009; Dekel et al. 2009; L'Huillier et al. 2012). In the merging scenario, cold gas in the galaxies loses angular momentum, increases its turbulence, and flows inward, with the nuclei activating rapid star formation and accretion into the SMBHs (e.g., Hernquist 1989; Barnes & Hernquist 1996). In the cold gas accretion picture, gas streams feed galaxies. This accretion triggers instabilities and turbulence in the gas, inducing mass inflows that allow the formation of star-forming clumps and the growth of the central SMBH (Bournaud et al. 2011, 2012). At high redshift, the universe was denser and had higher gas fractions than today (Daddi et al. 2010; Tacconi et al. 2010, 2018; Scoville et al. 2014). Therefore, the active parts of high-redshift galaxies are denser, more gas-rich, and more turbulent than local galaxies. It has been measured that gas fractions in massive spiral galaxies increase from ∼10% at z ∼ 0 to ∼50% at z ∼ 2, and so gravitational instabilities and velocity dispersions are also higher at higher redshift (σ = 30–100 km s−1) compared to those in low-redshift spirals (σ ∼ 10 km s−1; Andersen et al. 2006; Epinat et al. 2010; Swinbank et al. 2011; Stott et al. 2016). As cold streams continuously feed galaxies, gas fractions decrease with cosmic time, resulting in a declining in the star formation and black hole activity since z ∼ 2 (Silverman et al. 2008; Ebrero et al. 2009; Aird et al. 2010; Rodighiero et al. 2010; van de Voort et al. 2011; Cucciati et al. 2012). The lack of an excess of star formation and AGN activity as a result of merging, compared to the overall population of high-redshift galaxies found in Silva18 and in this work, may be due to the inefficiency of high-redshift mergers (Kaviraj et al. 2013; Fensch et al. 2017; Lofthouse et al. 2017). Since high-redshift galaxies are already highly turbulent and unstable due to the cosmic cold gas accretion, it is difficult for a merger to further increase their turbulence. Therefore, the increment due to merging in the star formation and AGN activity at high redshift might be mild compared to the increment that mergers produce in less turbulent, lower-redshift galaxies. On the other hand, we find that AGNs from mergers follow the same evolution as those resulting from non-merging galaxies, with an AGN fraction increasing with redshift. This is in agreement with what has been pointed out by, e.g., Ellison et al. (2019) and Draper & Ballantyne (2012), who suggest that mergers are probably not the dominant mechanisms that trigger AGN activity, since the fraction of mergers with AGN hosts has been mostly found to be low (e.g., Villforth et al. 2017; Marian et al. 2019).
We find a higher AGN fraction in star-forming than in quiescent galaxies for both mergers and non-mergers (Figure 3, middle), in agreement with the increment of AGN activity in mergers containing at least one star-forming galaxy, i.e., wet and mix mergers (Figure 5). In addition, starbursts galaxies present a higher AGN fraction for both merging and non-merging galaxies, compared to the total AGN fraction. Star-forming galaxies are sources containing higher cold gas fractions than quiescent galaxies 17 and high-redshift starbursts are possibly the result of galaxies containing high levels of cold gas (Scoville et al. 2016; Oteo et al. 2017). Therefore, it is an expected consequence that these populations will have higher AGN activity, since the accretion into a supermassive black hole and star formation are processes that need a cold gas supply to take place. Our results are in agreement with the findings of Santini et al. (2012), who report evidence of higher average star formation activity in X-ray-selected AGN hosts, compared to a control sample of inactive galaxies including both quiescent and star-forming galaxies at 0.5 < z < 2.5.
Although we find similar BHARs between merging and non-merging galaxies, we find that merging starbursting galaxies have higher BHARs and BHAR/SFR ratios compared to starbursts in non-mergers and main-sequence galaxies in both mergers and non-mergers. This result suggests that the merging of galaxies with high cold gas content (i.e., starbursts) are even more efficient at triggering AGNs. Similar to our results, Rodighiero et al. (2019) find higher BHARs in starbursts, with a factor of 3 enhancement compared to normal star-forming galaxies for a sample of 1.5 < z < 2.5 galaxies with a great diversity of star-forming properties. In their Figure 3, they present predictions of an enhancement of BHAR and BHAR/SFR during the merger phase, based on the hydrodynamical models of Di Matteo et al. (2005) and Hopkins et al. (2012), in agreement with our findings (see Table 1).
Hydrodynamical simulations presented in Volonteri et al. (2015b) suggest that nuclear SFR (<100 pc) have higher correlation with BHAR than galaxy-wide SFR, since the central regions are more influenced by the SMBH. The minimum physical size of the apertures for which the stellar mass and star formation rate were measured in our sample is ∼1.5 kpc (aperture of 03 at z = 0.3). Therefore, we are analyzing the large-scale SFR where no clear correlation between the BHAR and SFR is expected. On the other hand, the majority of our galaxies for which the BHAR was measured contain low-luminosity AGNs, with 67% and 68% of the merging and non-merging galaxies having Lbol < 1045 erg s−1, respectively. For galaxies with Lbol obtained from X-ray emission only, the fractions increase to 80% and 90% for mergers and non-mergers, respectively. Therefore, the lack of a direct correlation between BHAR and SFR and stellar mass in our sample is in agreement with previous studies toward low-luminosity AGNs (Lutz et al. 2010; Shao et al. 2010; Rosario et al. 2012; Rovilos et al. 2012), where the star formation and the black hole are dominated by secular processes. In our sample of mergers, it is difficult to analyze whether there is a correlation or not, due to poor statistics. However, at first glance, it seems that mergers have a higher correlation of BHAR with SFR than do non-mergers, possibly as a result of the influence of the merging process (Figures 9–11). In the coalescence phase, the merger should have its peak in star formation and AGN activity, and a correlation should emerge. Although we find no direct correlation between the BHAR and SFR, the mean of the ratios of BHAR/SFR is almost constant with redshift and with the same order of magnitude as that of the local MBH/Mbulge relation. This result suggests that the mean growth time of the SMBHs and the mean growth time of the stellar content in the galaxies are related in the same way, even at high redshifts.
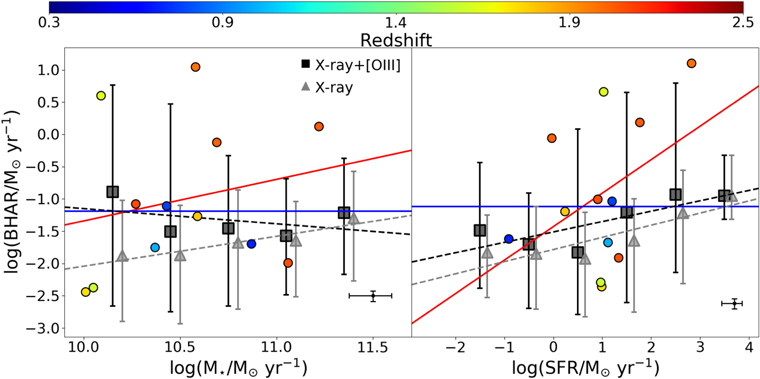
Figure 9. Black hole accretion rate as a function of stellar mass (left) and star formation rate (right) over the whole redshift range. Circles show the individual position of the 12 merging galaxies with X-ray and/or [O iii] emission. Black squares and gray triangles show the median of the BHAR in different bins of stellar mass/star formation rate for non-merging galaxies with BHARs obtained from the X-ray and/or [O iii] emission (BHARXR+[O III]) and X-ray emission only (BHARXR), respectively. Lower and upper error bars correspond to the 15th and 85th percentiles of the distributions, respectively. Solid red line is a linear fit of the position in this plot for mergers. Dashed black and gray lines are linear fits of the median values for non-merging galaxies. Solid blue lines correspond to the median of the log(BHAR) = −1.19 for mergers assuming no correlation at all between the BHAR and the stellar mass and the star formation rate. Median of the uncertainties are displayed at the bottom right in each panel.
Download figure:
Standard image High-resolution imageWhen we assume that the sources of unresolved X-ray or radio-selected AGNs are the two merging galaxies in a system, we find a higher AGN fraction in mergers compared to non-mergers (29.2 % versus 15.4% ± 0.6%). Although it is possible that some of these unresolved AGNs are dual, the observed fraction of dual AGNs with respect to the total AGN population has been found to be low. For instance, in the nearby universe, the fraction of dual AGNs has been found to be lower than 10% (Liu et al. 2011; Koss et al. 2012; Imanishi et al. 2020). Numerical simulations suggest that the fraction of dual AGNs increases with redshift (Volonteri et al. 2016; Rosas-Guevara et al. 2019). However, Silverman et al. (2020) recently found a fraction of dual AGNs of 0.26% with no evidence of evolution up to z < 4.5. The low observed fraction of dual AGNs is possibly because the AGN phase itself is ephemeral and its ignition depends on the properties of the host galaxy, such as stellar mass and gas fractions. Therefore, the chance of finding two active SMBHs is low. Since the number of confirmed dual AGNs is still scarce, it is difficult to determine the true frequency of dual AGNs and therefore estimate how many of our non-resolved AGNs are potentially dual. Higher-resolution observations are needed in order to probe whether each galaxy hosts a unique AGN. Some of the future projects that will help in the identifications of resolved AGNs, especially in samples of merging galaxies at high redshifts, are the following (see De Rosa et al. 2019 for detailed descriptions): Lynx
18
and AXIS (Mushotzky 2018) are missions under consideration by NASA to provide sensitive (at least 10 times better than Chandra) and high-resolution (∼05) observations of X-ray AGNs. The James Webb Space Telescope will provide both high angular resolution imaging and spectroscopy at mid-infrared wavelengths. Specifically, the Infrared Field Unit Near InfraRed Spectrograph (NIRSpec), which operates over a wavelength range of 0.6–5.3 μm, will have a resolution ∼5× better than the highest-resolution spectrograph in Spitzer. Finally, the Square Kilometre Array (SKA) will have resolutions of 05–1'' in the frequency range 0.95–1.76 GHz, which is ≥3 times better than current JVLA 1.4 GHz observations.
% versus 15.4% ± 0.6%). Although it is possible that some of these unresolved AGNs are dual, the observed fraction of dual AGNs with respect to the total AGN population has been found to be low. For instance, in the nearby universe, the fraction of dual AGNs has been found to be lower than 10% (Liu et al. 2011; Koss et al. 2012; Imanishi et al. 2020). Numerical simulations suggest that the fraction of dual AGNs increases with redshift (Volonteri et al. 2016; Rosas-Guevara et al. 2019). However, Silverman et al. (2020) recently found a fraction of dual AGNs of 0.26% with no evidence of evolution up to z < 4.5. The low observed fraction of dual AGNs is possibly because the AGN phase itself is ephemeral and its ignition depends on the properties of the host galaxy, such as stellar mass and gas fractions. Therefore, the chance of finding two active SMBHs is low. Since the number of confirmed dual AGNs is still scarce, it is difficult to determine the true frequency of dual AGNs and therefore estimate how many of our non-resolved AGNs are potentially dual. Higher-resolution observations are needed in order to probe whether each galaxy hosts a unique AGN. Some of the future projects that will help in the identifications of resolved AGNs, especially in samples of merging galaxies at high redshifts, are the following (see De Rosa et al. 2019 for detailed descriptions): Lynx
18
and AXIS (Mushotzky 2018) are missions under consideration by NASA to provide sensitive (at least 10 times better than Chandra) and high-resolution (∼05) observations of X-ray AGNs. The James Webb Space Telescope will provide both high angular resolution imaging and spectroscopy at mid-infrared wavelengths. Specifically, the Infrared Field Unit Near InfraRed Spectrograph (NIRSpec), which operates over a wavelength range of 0.6–5.3 μm, will have a resolution ∼5× better than the highest-resolution spectrograph in Spitzer. Finally, the Square Kilometre Array (SKA) will have resolutions of 05–1'' in the frequency range 0.95–1.76 GHz, which is ≥3 times better than current JVLA 1.4 GHz observations.
6. Summary and Conclusions
We quantify the presence of AGNs in a sample of merging systems at 0.3 < z < 2.5 with projected separations of 3–15 kpc between the galaxy nuclei. We analyze the sample obtained in the first paper of the series Silva et al. (2018), which was obtained from the CANDELS/3D-HST catalogs using the peak-finding algorithm developed in Lackner et al. (2014). We identify AGN activity in mergers and non-mergers (galaxies not selected as mergers) by measuring the X-ray and radio emission, their mid-infrared colors, and their [O iii]+Hβ optical line emission. Our findings can be summarized as follows:
- 1.Among galaxies with adequate measurements to find potential AGNs, we find a similar AGN fraction between mergers (16.4%) and non-mergers (15.4% ± 0.6%). The fraction in merging galaxies is obtained by assuming that only one of the merging galaxies is the AGN source (there are 16 merging systems with at least one AGN galaxy) when the AGN is obtained from unresolved observations. This result is in agreement with the lack of difference in the star formation activity between mergers and non-mergers found in Silva et al. (2018), indicating that mergers are inefficient in increasing the star formation and AGN activity at high redshifts. Due to the higher availability of cold gas at earlier cosmic times, the potential excess of star formation and nuclear activity as a result of merging fade with respect to the overall population of high redshift galaxies.
- 2.We find a higher AGN fraction in star-forming than in quiescent galaxies in both mergers and non-mergers. In addition, we find a higher AGN fraction in wet and mix mergers compared to dry mergers. These results indicate that mergers with at least one star-forming galaxy and star-forming non-mergers galaxies have a higher AGN incidence. Starburst galaxies, especially those in mergers, are the most efficient at triggering AGN activity, due to the high AGN fraction and BHARs they present compared to the rest of the population (even other star-forming galaxies).
- 3.We find no clear correlation between the black hole accretion rate and the star formation rate and stellar mass in mergers and non-mergers. Mergers seem to have a higher level of correlation with star formation than non-mergers, which might indicate that the merging process is influencing the star formation and AGN activity. Note that we do not probe the coalescence phase, for which a correlation is expected on theoretical grounds.
- 4.Higher-resolution observations are needed in order to resolve the emission of X-ray and radio-selected AGNs, to disentangle whether our sample contain dual AGNs.

D. M. acknowledges support from the Japan Society for the Promotion of Science (JSPS) through the JSPS Invitational Fellowships for Research in Japan (Short-term, ID S19135), and from the Tufts University Faculty Research Fund (FRF).
Appendix: Relation Black Hole Accretion Rate with Stellar Mass and Star Formation Rate
In this appendix, we present plots that relate the black hole accretion rate in galaxies with the star formation rate and the stellar mass. We only plot merging and non-merging galaxies with BHARs obtained from the X-ray and/or the [O iii] emission. For X-ray AGNs selected in mergers (i.e., the AGN is unresolved), we assume that the merging galaxies with the higher star formation rate is the AGN source. We also repeat our results by using BHARs obtained using only the X-ray emission of the AGNs. In Figures 10 and 11, we perform linear fits of the type  where x is log(M⋆) or log(SFR).

Figure 10. Black hole accretion rate as a function of star formation rate (color coded by stellar mass) in two redshift bins. Circles show the individual position of the 12 merging galaxies with X-ray and/or [O iii] emission. Black squares and gray triangles show the median of the BHAR in different bins of star formation rate for non-merging galaxies with BHARs obtained from the X-ray and/or [O iii] emission (BHARXR+[O III]) and X-ray emission only (BHARXR), respectively. Lower and upper error bars correspond to the 15th and 85th percentiles of the distributions, respectively. Solid red line is a linear fit of the position in this plot for mergers. Dashed black and gray lines are linear fits of the median values for non-merging galaxies. In the redshift range 0.3 ≤ z < 1.5, the slopes of the linear fits are α = 0.01, 0.13, and 0.11 for mergers/non-mergers with BHARXR+[O III] and non-mergers with BHARXR, respectively. In the redshift range 1.5 ≤ z < 2.5, the slopes of the linear fits are α = −0.015, −0.008, and 0.03 for mergers/non-mergers with BHARXR+[O III] and non-mergers with BHARXR, respectively. Solid blue line correspond to the median of the log(BHAR) for mergers assuming no correlation at all between the BHAR and the SFR. These median values are −1.70 and −1.08, respectively, for the lower and higher redshift ranges.
Download figure:
Standard image High-resolution image
Figure 11. Black hole accretion rate as a function of stellar mass (color-coded by the star formation rate) in two redshift bins. Circles show the individual position of the 12 merging galaxies with X-ray and/or [O iii] emission. Black squares and gray triangles show the median of the BHAR in different bins of stellar mass for non-merging galaxies with BHARs obtained from the X-ray and/or [O iii] emission (BHARXR+[O III]) and X-ray emission only (BHARXR), respectively. Lower and upper error bars correspond to the 15th and 85th percentiles of the distributions, respectively. Solid red line is a linear fit of the position in this plot for mergers. Dashed black and gray lines are linear fits of the median values for non-merging galaxies. In the redshift range 0.3 ≤ z < 1.5, the slopes of the linear fits are α = 0.19, 0.47, and 0.6 for mergers/non-mergers with BHARXR+[O III] and non-mergers with BHARXR, respectively. In the redshift range 1.5 ≤ z < 2.5, the slopes of the linear fits are α = −0.02, −1.3, and 0.23 for mergers/non-mergers with BHARXR+[O III] and non-mergers with BHARXR, respectively. Solid blue lines correspond to the median of the log(BHAR) for mergers assuming no correlation at all between the BHAR and the SFR. These median values are −1.70 and −1.08, respectively, for the lower and higher redshift ranges.
Download figure:
Standard image High-resolution imageFootnotes
- 7
This number includes galaxies with masses
- 8
The completeness in stellar mass at log(M⋆/M⊙) ≥ 10 is above 90% at z = 2.5.
- 9
Typical of optically thin synchrotron emission.
- 10
Venn diagrams were obtained by using pyvenn (https://github.com/LankyCyril/pyvenn/blob/master/pyvenn-demo.ipynb).
- 11
We do not apply any correction.
- 12
We also perform this analysis in different bins of redshifts, star formation rates, and stellar masses, and find no significant difference.
- 13
Since the total AGN fractions corrected and noncorrected by the variation of X-ray sensitivity in mergers and non-mergers are significantly the same, we do not apply a correction in the measurement of the following fractions.
- 14
Since a starburst is also a star-forming galaxy, this fraction also corresponds to the fraction obtained when assuming that, in an unresolved AGN, the star-forming galaxy is the AGN source.
- 15
Same fraction is obtained if we assume the AGN comes from the quiescent galaxy.
- 16
Maintaining the starbursts found in the mergers sample as galaxies in the pre-coalescence phase.
- 17
We do not have measurement of cold gas content in this sample of mergers.
- 18
