


Abstract
We observed the nearby irregular galaxy IC 1613 with the Chandra X-ray Observatory, for 49.9 ks using the ACIS S3 chip, and with the VLA at 6 cm for 0.7 hr. The Chandra observation targeted the extensive bubble region in the northeast quadrant. We detect 31 sources within the D25 diameter above a significance of 3σ corresponding to a point-source luminosity limit LX of ≈2 × 1035 erg s−1 (0.3–8 keV band). The VLA observation covered the entire galaxy with an angular resolution of 5''. We detect 11 sources: five do not fall on the ACIS chips, four fall on the S3 CCD, and two sit on the edge of the S2 CCD. We also describe corresponding Spitzer IRAC and MIPS images. Our detected source list matches the lists of two previous global point-source analyses except at the faint end. With the exception of one bright supernova remnant, the sources appear to be low-luminosity stellar sources (e.g., RS CVn stars) or X-ray binaries, or background objects. We identify one candidate supersoft source. All but one of the sources have at least one optical or infrared counterpart; three sources have radio counterparts. We describe our search for diffuse emission from the bubble region. We assign an upper limit of ≈5 × 1035 erg s−1 on the integrated flux and ≈1.4 × 1030 erg s−1 pc−2 on the surface brightness emission in the 0.5–2 keV band from that region.
Export citation and abstract BibTeX RIS

Original content from this work may be used under the terms of the Creative Commons Attribution 4.0 licence. Any further distribution of this work must maintain attribution to the author(s) and the title of the work, journal citation and DOI.
1. Introduction
Nearby galaxies are natural subjects of deep X-ray and radio observations because detections of discrete sources are possible (Fabbiano 2006). By surveying a nearby galaxy, the distances to all of the identified sources in that galaxy are essentially the distance to the galaxy, which eliminates the problem of determining distances to individual sources that plagues searches within the the Milky Way. The incompleteness of a sample identified in an external galaxy is much easier to define than for Galactic samples.
Further, classes of X-ray sources detected by surveys of local galaxies include X-ray binaries (XRBs) and supernova remnants (SNRs). Observations of XRBs and SNRs are essential in developing a thorough understanding of stellar evolution. Studies of those source classes in nearby galaxies provide an overview unavailable in our own Galaxy because of the significant absorption along Galactic lines of sight. For nearby galaxies, identification of counterparts at other wavelengths becomes possible.
To understand massive star formation and supernova (SN) evolution, different types of galaxies with varied properties must be surveyed to determine the effects of gas density and metallicity on star formation. Studies of irregular galaxies are important in understanding star formation, as they do not have spiral density waves—a cause of star formation. Isolated irregular galaxies with no galaxy interactions must rely on stochastic processes for star formation to occur (Hunter 1997; Chyźy et al. 2011, and references therein.) In this paper, we extend those studies to an irregular galaxy in the Local Group, IC 1613, with observations obtained using the VLA and Chandra.
IC 1613 is classified as a DDO Irr V (van den Bergh 2000) lying within the Local Group at a distance of ∼730 kpc (Dolphin et al. 2001; Karachentsev et al. 2004) or 724±17 kpc from a comparison study by Hatt et al. (2017). We here adopt 725 kpc for the distance. The scale at that distance is then 1'' ∼ 3.5 pc. We also adopt J2000.0 coordinates throughout the paper.
The known column density, NH in the direction of IC 1613 is ∼3 × 1020 cm−2 (Schlafly & Finkbeiner 2011). Given that the galaxy is a dwarf, its massive star formation history is of interest (e.g., Rosado et al. 2001; Lozinskaya et al. 2003). This is particularly important for IC 1613, given the very massive OB association in the northeast quadrant of the galaxy and the relative lack of star clusters elsewhere (Wyder et al. 2000). The OB association also contains the only known supernova remnant in the galaxy, S8, the X-ray emission of which was described in Schlegel et al. (2019).
Previous X-ray observations of IC 1613 include the initial Einstein IPC and HRI survey observations (Fabbiano et al. 1992). Eskridge (1995) matched the Einstein sources with objects at other wavelengths to demonstrate that the brightest source in the IC 1613 field is a background galaxy cluster, MCXC J0105.0 + 0201, at z ∼0.2.
The ROSAT HRI was used to observe IC 1613 twice (Lozinskaya et al. 1998), with both observations ∼20 ks in duration. Four sources were detected: the galaxy cluster just mentioned (briefly described in Section 8.1), the known SNR in IC 1613, an mv ∼ 11.4 foreground star, and a probable X-ray binary. The star falls on CCD 8 but outside of the D25 radius of IC 1613; it is briefly described in Section 8.2. The XRB lies inside the D25 radius of IC 1613, but outside of the Chandra's field of view to the west, so no data are available.
The first continuum VLA observation was obtained by Dickel et al. (1985). That observation focused on confirmation of the SNR, S8, first reported by Sandage (1971). Additional VLA observations covering IC 1613 have been obtained since and will be discussed shortly.
This paper is organized as follows: the X-ray and radio observations and data reduction are described in Section 2. Discrete sources detected with Chandra are described in Section 3 along with their X-ray properties. UV and IR properties of possible counterparts are discussed in Section 5 using archival data from Spitzer IRAC and Swift. Our upper limit on the diffuse emission in the northeast quadrant is described in Section 7. We also briefly discuss detected sources unassociated with IC 1613 in Section 8 before concluding. We discuss our results throughout the paper rather than pushing them into a lengthy discussion section.
2. Observations
2.1. Chandra
We used the Advanced Charge-Coupled Device (CCD) Imaging Spectrometer (ACIS; Garmire et al. 2003) on Chandra to observe IC 1613 on 2005 September 4 (Chandra Observation number 5905). Table 1 provides a brief summary. The aimpoint for the observation was approximately 1 5 east of the nucleus of the galaxy, to ensure coverage of the bubble complex in the northeast quadrant (nucleus: 01:04:47.8, +02:07:04.0 (NED
7
; ned.ipac.caltech.edu); aimpoint: 01:04:54, +02:08:34.6, all J2000.0)(q.v., Figure 1). The observation was obtained using the back-illuminated S3 CCD in Very Faint mode, to have the best chance of detecting low-energy emission from the bubble complex. The exposure lasted approximately 49,994 s; after correcting for the deadtime, the effective exposure time was 49,327 s. The Chandra Point Source Catalog reports 49,324.46 s.
5 east of the nucleus of the galaxy, to ensure coverage of the bubble complex in the northeast quadrant (nucleus: 01:04:47.8, +02:07:04.0 (NED
7
; ned.ipac.caltech.edu); aimpoint: 01:04:54, +02:08:34.6, all J2000.0)(q.v., Figure 1). The observation was obtained using the back-illuminated S3 CCD in Very Faint mode, to have the best chance of detecting low-energy emission from the bubble complex. The exposure lasted approximately 49,994 s; after correcting for the deadtime, the effective exposure time was 49,327 s. The Chandra Point Source Catalog reports 49,324.46 s.

Figure 1. Optical image (obtained from the NED, originally from Lowell Observatory) of IC 1613 with Chandra chips S6, S7, and S8 overlaid (top to bottom); Chandra CCDs are 84 on a side. The aimpoint of the observation is indicated by the small white circle. The large blue circle is the D25 circle (∼ diameter). Only about ∼51% of the galaxy is covered by the Chandra observation, based on the D25 and CCD sizes. The green circles, from top to bottom, correspond to the X-ray sources not associated with IC 1613 (source numbers 32, 33 (the cluster of galaxies MCXC J0105.0+0201), and 34 = GT Cet).
Download figure:
Standard image High-resolution imageThe offset in aimpoint means the entire galaxy is not covered by the observation, given that its size has been measured to be ∼16' ×20' (Ables 1972) and perhaps as large as ∼20' × 30' based on the discovery of carbon stars ∼15' from the center (Albert et al.2000). Essentially, the ACIS observation covered an ∼8' swath down the center of IC 1613 (Figure 1). Much of the optically brightest portion of the galaxy lies on the upper two-thirds of CCD 7 = S3. The galaxy cluster covers a portion of IC 1613 at the south end of CCD-7. We include CCDs 6 and 7 in our analysis, treating each separately where appropriate in the analysis.
The Chandra Interactive Analysis of Observations (CIAO) software (version 4.9) and the associated calibration files (version 4.7) were used. We filtered the event file to retain events from CCDs 7 and 6 (=S2) to provide as much coverage of the galaxy as possible. We accumulated source-free background areas offset south from the galaxy center and away from the galaxy cluster. We extracted a light curve using 50 s bins to test for the presence of soft background flares; no flares were detected.
Point sources were detected using wavdetect at 1'', 2'', and 4'' scales (Freeman et al. 2002) using the recommended 10−6 false-source threshold (one false source per CCD). The detected sources were merged into a final source list after eliminating duplicate detections. Source counts were extracted using apertures centered on the wavdetect positions and of sufficient radius to enclose 95% of the detected X-rays. We applied a signal-to-noise cut at 3.0, separating the sources into "detected" and "weak." We examined a random sample of the weak sources to verify that the detection routine had separated them correctly. We also ran the detection software on three bands: soft (0.3–1 keV), medium (1–2 keV), and hard (2–8 keV). This approach provides crude spectral information ("color"); we will discuss the colors in a later section.
All detected sources were also compared to the limiting count sensitivity of the CCDs as determined by the CIAO routine lim_sens. The limiting sensitivity task convolves the exposure map across the field of view with the effective area that any given X-ray would sense. Consequently, sources well off the optical axis must necessarily be brighter to be detected. Such sources all fell below 10–15 counts. Detections with extracted counts lower than the limiting sensitivity value at the location of the detected source were dropped. That limit is also the point at which the source count distributions of the ChaMP project turned over (their Figure 16; Kim et al. 2007).
Source counts were converted to fluxes using the PIMMS tool 8 . We adopted a 3 keV thermal bremsstrahlung spectrum absorbed by the known column toward IC 1613 and converted the counts to fluxes in the 0.5–8 keV band. Table 2 lists the source properties, which are further discussed in Section 3.
2.2. VLA
The VLA was used on 1995 Jan 2 and 3 for 0.7 hr to survey IC 1613 at 6 cm (4.86 GHz) in the C array configuration. The observing strategy was chosen to yield comparable surface brightness limits as part of a survey of nearby galaxies that includes M33, NGC 300, NGC 6946, and NGC 7793 (Gordon et al. 1993; Pannuti et al. 2000; Lacey et al. 1997; Pannuti et al. 2002). The observation of IC 1613, with a beam size of 4 5x43, results in a spatial resolution of ∼10 pc. The optical size of the galaxy is larger than the 9' field of view at 6 cm, although the most prominent optical and IR emitting regions are well within the radio field of view. To eliminate bandwidth smearing (chromatic aberration), 4IF spectral line mode, with eight channels with a total bandwidth of 25 MHz for each intermediate frequency (IF) pair, was used for the 6 cm observations.
The data were calibrated following the usual procedures in AIPS, produced and maintained by NRAO, and imaged using IMAGR. 3C 48 was observed as the primary calibrator and B0106 + 013 was used as the phase calibrator. The spectral channels were summed and an I polarization continuum map was cleaned using IMAGR in AIPS with Robust = −5 and uniform weighting, which produces a smooth background, well-suited to identify the isolated compact radio sources in IC1613. The resulting image rms sensitivity was 70 μJy for the map. Sources were identified using the AIPS subroutine STFND and measured with JMFIT after the primary beam correction was applied. Slices were taken through the sources with the routine SLICE to ensure that the sources were not located on positive or negative bowls of radio emission. Detected sources are listed in Table 4.
Because we are interested in compact objects, we did not need to add single-dish observations to get the zero spacings. The zero spacings are sensitive to the largest-scale structures such as the diffuse disk component, which adds unnecessary noise to the compact sources. At this resolution and sensitivity, most of the detected objects in IC 1613 are either not resolved or slightly resolved; thus, structural morphology cannot be used to discriminate between SNRs, HII regions, and background objects.
Table 1. Summary of Gross Properties of IC 1613 = UGC 668
| Property | Value | References |
|---|---|---|
| RA (J2000.0) | 01 04 47.8 | (1) |
| Dec (J2000.0) | +02 07 04.0 | (1) |
| Galactic Longitude l (°) | 129.738 | (1) |
| Galactic Latitude b (°) | −60.577 | (1) |
| Observed Diameter D25 (arcmin) | 9.2 | (2) |
| Axial Ratio d/D | 0.70 | (2) |
| Hubble Type | SA(s)d HII | (1) |
| HI Mass (M⊙) | 5.4–8 × 10⁷ | (3) |
| Distance (Mpc) | 0.73 | (4) |
| Inclination i (°) | 50 | (2) |
| Galactic Column Density NH (cm−2) | 2.9 × 10²⁰ | (5) |
Note. Units of R.A. are hours, minutes and seconds and units of decl. are degrees, arcminutes and arcseconds. References: (1) NED; (2) Tully (1988); (3) Grcevich & Putman (2009), Huchtmeier & Richter (1988); (4) Dolphin et al. (2001), Karachentsev et al. (2004); (5) Schlafly & Finkbeiner (2011).
Download table as: ASCIITypeset image
3. The Discrete Source Population
3.1. X-Ray Sources
As described above, we detected 31 discrete X-ray sources within the D25 radius of IC 1613 at or above the 3σ count level over the energy range of 0.3–8 keV. To calculate a flux for each source, we adopted a foreground column density of NH = 3 × 1020 cm−2 and a thermal bremsstrahlung model with a temperature of 3 keV. Table 2 lists the properties of these sources while Figure 2 shows the detected sources.

Figure 2. Chandra image of IC 1613 field. The image shows the back-illuminated CCD 7 (bottom CCD) and about 60% of the bottom of the front-illuminated CCD 6 (top CCD). Each CCD is 8' on a side. Point sources are labeled by increasing R.A., then increasing decl. The positions of all detected sources (corresponding to 90% confidence levels) are indicated with red ellipses and are labeled with numbers from 1 to 31 generally southwest of the respective ellipse. Blue circles are unlabeled and indicate the locations of sources detected by Liu (2011) but not by us (q.v. Table 3.2). Source 15 was not detected by Liu (2011). Source 26 indicates the galaxy's only known SNR; sources 4 and 5 represent a possible double source in an external galaxy. The large green box represents the Hubble Space Telescope WFC3 field-of-view. The small green circle to its upper left is the Chandra aimpoint. The large C at bottom center is a portion of the emission of a cluster of galaxies, MCXC J0105.0 + 0201, and identified as source 33 in Table 2. Not shown are sources 32, which lies north of source 12 in this figure by ∼ and source 34, which lies southeast of the galaxy cluster by ∼
 .
.
Download figure:
Standard image High-resolution imageTable 2. Properties of Chandra Sources in the IC 1613 Field a
| wavdetect | Flux × 10−15 | Luminosity × 1035 | |||||||
|---|---|---|---|---|---|---|---|---|---|
| No. | R.A. (J2000.0) | Decl. (J2000.0) | CCD | Net Counts b | σ | Absorbed | Unabsorbed | Absorbed | Unabsorbed |
| 1 | 01:04:32.3 | 02:13:12.6 | 6 | 21.2 ± 6.5 | 3.3 | 5.0 | 5.4 | 3.2 | 3.4 |
| 2 | 01:04:37.6 | 02:13:06.4 | 6 | 23.5 ± 6.0 | 3.3 | 5.5 | 5.9 | 3.5 | 3.7 |
| 3 | 01:04:43.9 | 02:05:39.9 | 7 | 14.5 ± 4.2 | 3.7 | 3.4 | 3.7 | 2.1 | 2.3 |
| 4 c | 01:04:44.1 | 02:04:38.7 | 7 | 35.7 ± 4.4 | 8.7 | 8.4 | 9.0 | ⋯ | ⋯ |
| 5 c | 01:04:44.3 | 02:04:36.9 | 7 | 35.9 ± 4.4 | 6.0 | 8.4 | 9.1 | ⋯ | ⋯ |
| 6 | 01:04:45.2 | 02:14:33.8 | 6 | 48.1 ± 8.8 | 4.3 | 11.3 | 12.2 | 7.2 | 7.7 |
| 7 | 01:04:47.2 | 02:05:51.5 | 7 | 87.9 ± 9.8 | 19.3 | 20.7 | 22.3 | 13.1 | 14.2 |
| 8 | 01:04:47.6 | 02:10:25.0 | 6 | 18.7 ± 4.7 | 3.3 | 4.4 | 4.7 | 2.8 | 2.9 |
| 9 | 01:04:47.9 | 02:07:30.6 | 7 | 31.5 ± 6.7 | 3.9 | 7.4 | 7.9 | 4.7 | 5.0 |
| 10 | 01:04:49.2 | 02:11:57.2 | 6 | 50.9 ± 7.7 | 3.5 | 11.9 | 12.9 | 7.5 | 8.2 |
| 11 | 01:04:49.6 | 02:09:08.7 | 7 | 22.2 ± 4.9 | 8.5 | 5.2 | 5.6 | 3.3 | 3.5 |
| 12 | 01:04:50.2 | 02:13:41.2 | 6 | 21.5 ± 5.8 | 4.6 | 5.1 | 5.4 | 3.2 | 3.4 |
| 13 | 01:04:50.8 | 02:12:59.2 | 6 | 324.8 ± 19.8 | 12.8 | 76.4 | 82.3 | 48 | 52 |
| 14 | 01:04:50.9 | 02:07:54.5 | 7 | 11.1 ± 3.6 | 3.2 | 2.6 | 2.8 | 1.6 | 1.8 |
| 15 | 01:04:52.3 | 02:06:26.8 | 7 | 10.5 ± 1.8 | 3.2 | 2.5 | 2.7 | 1.6 | 1.7 |
| 16 | 01:04:52.3 | 02:08:02.4 | 7 | 15.7 ± 4.2 | 4.3 | 3.7 | 3.9 | 2.3 | 2.5 |
| 17 | 01:04:54.6 | 02:02:10.3 | 7 | 31.0 ± 8.0 | 4.6 | 7.3 | 7.8 | 4.6 | 4.9 |
| 18 | 01:04:54.6 | 02:02:32.5 | 7 | 44.8 ± 8.8 | 4.5 | 10.5 | 11.3 | 6.7 | 7.2 |
| 19 | 01:04:56.3 | 02:12:13.4 | 6 | 40.9 ± 7.0 | 4.5 | 9.6 | 10.4 | 6.1 | 6.6 |
| 20 | 01:04:56.9 | 02:13:53.2 | 6 | 49.6 ± 8.2 | 3.9 | 11.7 | 12.6 | 7.4 | 8.0 |
| 21 | 01:04:57.5 | 02:04:00.4 | 7 | 14.6 ± 4.7 | 3.3 | 3.4 | 3.7 | 2.1 | 2.3 |
| 22 | 01:04:57.7 | 02:09:12.9 | 7 | 13.9 ± 3.7 | 4.8 | 3.3 | 3.5 | 2.1 | 2.2 |
| 23 | 01:04:57.9 | 02:03:39.9 | 7 | 47.5 ± 8.3 | 4.3 | 11.2 | 12.0 | 7.1 | 7.6 |
| 24 | 01:04:58.2 | 02:12:50.1 | 6 | 46.1 ± 7.5 | 4.0 | 10.8 | 11.7 | 6.8 | 7.4 |
| 25 | 01:05:01.0 | 02:11:26.6 | 6 | 56.6 ± 7.9 | 4.7 | 13.3 | 14.3 | 8.4 | 9.1 |
| 26 d | 01:05:02.4 | 02:08:42.1 | 7 | 584.7 ± 27.3 | 31.0 | 137.6 | 148.1 | 87 | 94 |
| 27 | 01:05:03.3 | 02:13:44.7 | 6 | 52.7 ± 9.3 | 5.6 | 12.4 | 13.3 | 7.9 | 8.4 |
| 28 | 01:05:03.9 | 02:02:47.9 | 7 | 27.4 ± 7.5 | 3.1 | 6.4 | 6.9 | 4.0 | 4.4 |
| 29 | 01:05:04.8 | 02:05:30.7 | 7 | 31.7 ± 6.3 | 5.7 | 7.5 | 8.0 | 4.7 | 5.1 |
| 30 | 01:05:08.3 | 02:06:39.0 | 7 | 35.7 ± 6.6 | 7.7 | 8.4 | 9.0 | 5.3 | 5.7 |
| 31 | 01:05:08.7 | 02:09:21.1 | 7 | 15.3 ± 4.7 | 3.3 | 3.6 | 3.9 | 2.3 | 2.5 |
| 32 e | 01:04:51.7 | 02:18:48.3 | 6 | 56 ± 15.4 | 3.6 | 13.2 | 14.2 | ⋯ | ⋯ |
| 33 f | 01:05:02.3 | 02:01:30 | 7 + 8 | 1468 ± 41.0 | 24.5 | 345.4 | 372.1 | 4 × 10⁸ | 4.5 × 10⁸ |
| 34 g | 01:05:16.1 | 01:59:11.7 | 8 | 42 ± 7.2 | 3.9 | 9.8 | 10.6 | ⋯ | ⋯ |
Notes.
a Net count rates, in units of counts s−1, are the number of extracted counts above background in the 0.3–8.0 keV energy range within the source extract region. Fluxes (both absorbed and unabsorbed) are in units of ergs cm−2 s−1 and have been computed assuming a foreground column density NH = 2.9 × 1020 cm−2 with an adopted thermal bremsstrahlung model of kT = 3 keV. Luminosities (both absorbed and unabsorbed) are in units of ergs s−1 and have been calculated assuming a distance d = 0.73 Mpc to IC 1613. b Sources with more than 18.5 counts lie above the limiting flux sensitivity; sources with fewer counts are significant based on the counts, but their corresponding fluxes are more poorly measured. Those sources are 3, 14, 15, 16, 21, 22, and 31. Source 15 was not detected by Liu (2011). c Sources 4 and 5 do not have a calculated luminosity as they do not have a redshift in the NASA Extragalactic Database. Very little appears to be known—see the end of Section 3.4 for comments. d Source 26 = S8, the only known SNR in IC 1613. The Chandra data are described in Schlegel et al. (2019). e Source 32 appears to lie outside of IC 1613. See Section Appendix 8.3 for a discussion. f Source 33 is a cluster of galaxies: MCXC J0105.0 + 0201. Fluxes quoted are derived from the spectral fits (q.v. Table 10); the cluster is discussed in Section Appendix 8.1. g Source 34 lies southeast of the cluster of galaxies and corresponds to the mv 11.4 mag foreground star noted in Lozinskaya et al. (1998). This source is discussed in Section Appendix 8.2.Download table as: ASCIITypeset image
We also calculated the limiting flux sensitivity—the counts needed to exceed a flux threshold. For the IC 1613 field, a flux threshold of ≈4σ requires a minimum of ∼18.5 counts leading to a minimum flux (CCD 7) of ∼4.3 × 10⁻¹⁵ erg s−1 cm−2 or an unabsorbed luminosity of ≈7.8 × 1034 ergs s−1. This threshold means that our six detected sources between 10 and 18 counts have poor flux measurements. The limiting flux sensitivity is about a factor of 2 above the limiting sensitivity of Kim et al. (2007).
3.2. Undetected Sources
We note that there are 16 objects reported by Liu (2011), using the same data, that we do not detect. There are also 17 sources listed in the Chandra Source Catalog (CSC) that we do not detect. We consider the work of Liu first: those objects are shown in Figure 2 and listed in Table 4. Both studies used the same values in the CIAO wavdetect task for the false source threshold and the wavelet detection scales. What leads to the differences between the two studies?
Table 3. Catalog of Radio Sources in IC 1613
| R.A. (J2000) | Dec. (J2000) | S20 a | S6 | Within | |||
|---|---|---|---|---|---|---|---|
| ID | (HH:MM:SS.s) | (°:':'') | (mJy) | (mJy) | α | CCD | Notes b |
| IC1613-1 | 01:04:25.03 | 02:12:05.9 | 69. ± 10. | 3.2 ± 0.4 | ∼−2.5 ± 0.1 | — | D-1 |
| IC1613-2 | 01:04:25.50 | 02:06:37.2 | ⋯ | 0.4 ± 0.2 | ⋯ | — | |
| IC1613-3 | 01:04:26.55 | 02:08:50.0 | ⋯ | 0.4 ± 0.2 | ⋯ | — | |
| IC1613-4 | 01:04:31.14 | 02:06:30.3 | ⋯ | 0.3 ± 0.2 | ⋯ | — | |
| IC1613-5 | 01:04:44.26 | 02:04:37.7 | 12. ± 1.8 | 3.4 ± 0.1 | ∼−1.1 ± 0.1 | 7 | D-2; X-4 + X-5 |
| IC1613-6 | 01:04:50.05 | 02:08:15.4 | ⋯ | 0.3 ± 0.2 | ⋯ | 7 | |
| IC1613-7 | 01:05:02.36 | 02:08:41.1 | 2.0 ± 0.3 | 0.5 ± 0.1 c | −1.1 ± 0.1 | 7 | S8; X-26 |
| IC1613-8a | 01:05:04.63 | 02:14:26.7 | 1.9 ± 0.3 | ⋯ | ⋯ | 6 edge | |
| IC1613-8b | 01:05:05.13 | 02:14:20.7 | 1.6 ± 0.3 | ⋯ | ⋯ | 6 edge | |
| IC1613-9 | 01:05:10.27 | 02:05:23.2 | ⋯ | 0.7 ± 0.1 | ⋯ | 7 | |
| IC1613-10 | 01:05:12.83 | 02:11:24.7 | ⋯ | 0.5 ± 0.1 | ⋯ | — | D-5 |
| IC1613-11 | 01:05:13.94 | 02:14:33.5 | 1.7 ± 0.3 | ⋯ | ⋯ | — | D-6 |
| IC1613-12 | 01:05:16.23 | 02:14:04.4 | 5.4 ± 0.3 | ⋯ | ⋯ | — | D-7 |
| IC1613-13 | 01:05:17.29 | 02:12:38.2 | ⋯ | 0.4 ± 0.1 | ⋯ | — | |
| IC1613-14 | 01:05:21.52 | 02:02:19.9 | ⋯ | 0.4 ± 0.2 | ⋯ | — |
Notes.
a 20 cm flux densities from Dickel et al. (1985). b Dickel et al. (1985) did not list an ID for the radio sources they identified. We assigned an ID number ("D-n") based on the order in which the sources were listed. X-n = matching X-ray source number. c Dickel et al. (1985) measured a 6 cm flux density of 0.7 ± 0.4, which is within the error of the 6 cm flux density reported by us.Download table as: ASCIITypeset image
For Liu sources 27, 38, 35, 45, 39, 41, 36, and 44, the signal-to-noise ratio falls below our initial signal-to-noise (S/N) acceptance screening of >3.0. Liu sources 6 and 19 lie outside of the D25 radius for IC 1613. Source 34 (CCD-7) lies on the exact edge of a CCD. Removing all those objects leaves sources 3, 28, 32, 40, and 42 as possible mis-detected objects. In the intervening time from the publication of Liu (2011), the limiting sensitivity task became available within the CIAO software package. Those sources lie below our calculated limiting count sensitivity value at the source's location on CCDs 6 or 7. The overall upshot of the differences: our analysis uses more exposure time on the background to define it more precisely, combined with an improved understanding of the characteristics of the point-spread function behavior with energy and off-axis angle.
Finally, we detect one source not listed in Liu (2011): source 15. This source lies near the limiting count sensitivity value, so a slight change in the adopted background, the minimum S/N threshold, or the false source acceptance threshold would exclude it. Several re-runs of the wavdetect task were tried using variations of the task's parameters. In each case, we detected source 15. The source lies near the ACIS aimpoint, so it remains puzzling that this source was not detected by Liu (2011) and we cannot offer an explanation at this time.
To build a list of detected point sources from the CSC, we entered the RA and Dec of IC 1613 (Table 1) into the catalog query and requested all CSC sources within 8 arc min of that position 9 . An 8-arc min circle easily covers CCDs 6, 7, and 8. The resulting list included 51 sources. The detected sources in this paper were present on the CSC list, but 17 additional point sources were present in the catalog that were not detected in this paper (Table 3). Of those sources, curiously, only four were in common with the undetected Liu sources. Figure 3 shows the fluxes as computed in this paper compared to the fluxes from the CSC. Overall, there is a 1:1 correspondence. The most glaring exception is the resolved SNR (Schlegel et al.2019)—the CSC's extraction circle does not include all of the events.
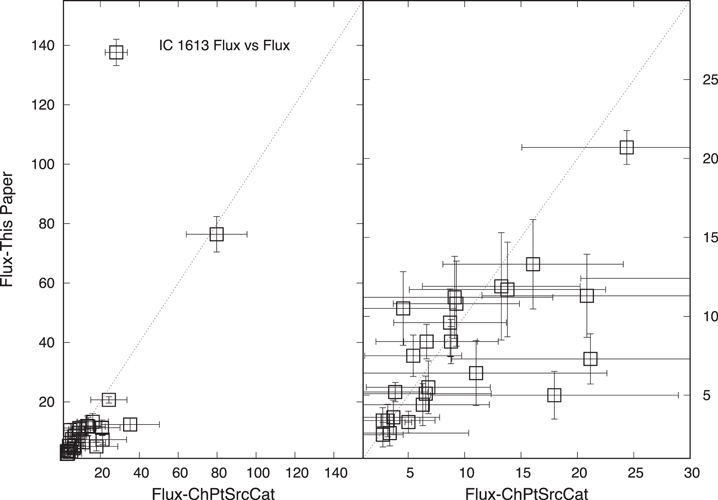
Figure 3. Fluxes for the detected sources as calculated in the Chandra Source Catalog (CSC) and as calculated in this paper. In general, the fluxes fall on the 1:1 line. The most egregious "failure" of the 1:1 line is the source with low CSC flux and high on the y-axis, and is the resolved SNR (Schlegel et al. 2019)—the CSC does not extract all of the counts.
Download figure:
Standard image High-resolution imageIn general, as listed in Table 5, the undetected CSC sources fall below our initial S/N cut. We checked the S/N ratio by converting the fluxes from the CSC to count rates assuming the known column toward IC 1613 and a 5 keV thermal bremsstrahlung. Sources with count rates less than ≈1.5 × 10⁻⁴ counts sec−1 in the IC 1613 field generate too few counts to rise statistically above the background. Our limiting sensitivity map is broadly comparable with that available from the CSC. We use "broadly comparable" because we used 0.5 arcsec pixels in calculating our map while the CSC used 3.96 arcsec pixels. The trend with off-axis angle is very comparable; values at specific locations in our map average to values on the CSC map. We discuss the colors of the CSC sources in Section 4.2 below.
Table 4. Sources in Liu (2011) Not Detected In This Paper
| Liu No. | CCD | R.A. (J2000) | Dec. (J2000) | Counts ± Err | Bkgrd ± Err | S/N | LimSens a | CPCat? b | Reason c |
|---|---|---|---|---|---|---|---|---|---|
| 3 | 6 | 01:04:29.4 | 02:15:45.2 | 32 ± 6.7 | 3.4 ± 0.7 | 5.4 | 62 | N | <LimSens |
| 27 | 6 | 01:04:33.1 | 02:15:11.9 | 11 ± 4.4 | 4.4 ± 0.8 | 2.8 | 59 | N | <S/N cut |
| 38 | 6 | 01:04:35.8 | 02:10:22.6 | 4 ± 3.2 | 4.9 ± 0.8 | 1.3 | 27 | N | <S/N cut |
| 35 | 6 | 01:04:36.6 | 02:13:32.6 | 3 ± 2.9 | 3.8 ± 0.7 | 1.1 | 42 | N | <S/N cut |
| 45 | 6 | 01:04:42.4 | 02:10:03.5 | 10 ± 4.3 | 3.3 ± 0.7 | 2.7 | 19 | Y | <S/N cut |
| 42 | 6 | 01:04:44.1 | 02:11:44.6 | 14 ± 4.8 | 4.1 ± 0.8 | 3.3 | 23 | Y | <LimSens |
| 39 | 6 | 01:04:44.8 | 02:10:11.5 | 10 ± 4.3 | 5.3 ± 0.8 | 2.5 | 16 | Y | <S/N cut |
| 40 | 7 | 01:04:48.4 | 02:07:10.3 | 25 ± 6.1 | 9.9 ± 1.2 | 4.2 | 33 | Y | <LimSens |
| 6 | 8 | 01:04:48.4 | 02:01:09.5 | 43 ± 7.6 | 3.9 ± 0.8 | 6.3 | ⋯ | N | off prime CCDs |
| 41 | 6 | 01:04:54.7 | 02:12:23.5 | 4 ± 3.2 | 6.0 ± 0.9 | 1.3 | 22 | N | <S/N cut |
| 19 | 5 | 01:04:57.0 | 02:19:31.7 | 10 ± 4.3 | 7.7 ± 1.0 | 2.4 | ⋯ | N | off prime CCDs |
| 36 | 6 | 01:04:58.9 | 02:14:15.8 | 6 ± 3.6 | 5.1 ± 0.8 | 1.8 | 38 | N | <S/N cut |
| 32 | 6 | 01:05:00.3 | 02:14:59.6 | 22 ± 5.8 | 6.8 ± 1.0 | 4.1 | 46 | N | <LimSens |
| 28 | 7 | 01:05:07.1 | 02:04:36.9 | 30 ± 6.5 | 11.4 ± 1.2 | 4.7 | 87 | N | <LimSens |
| 44 | 7 | 01:05:07.5 | 02:09:34.6 | 13 ± 4.7 | 10.2 ± 0.5 | 2.7 | 52 | N | <S/N cut |
| 34 | 7 | 01:05:11.3 | 02:08:53.0 | 7± 3.8 | 4.3 ± 0.8 | 2.1 | ⋯ | N | <S/N cut; CCD edge |
Notes.
a The limiting count sensitivity at the source's location. The variation in counts occurs because of the varying effective area with off-axis angle. CCDs 5 and 8 were not included in the limiting sensitivity calculation because of their very large off-axis angles. b Present in Chandra Point Source Catalog (CPCat) Evans et al. (2010) (Yes/No). c The reason a given source was not included in the detected source list yet is present in Liu (2011): "off prime CCDs" = source not on CCDs 6 or 7 where IC 1613 is present; "<S/N cut" = source fell below initial, count-based S/N cut; "<LimSens" = source falls below the limiting sensitivity cut at its location in the field-of-view.Download table as: ASCIITypeset image
3.3. Detected Background Objects
Some number of the detected X-ray sources are expected to be background active galaxies shining through IC 1613. The results from the Chandra deep surveys or the ChaMP project are useful to estimate the number of possible background sources (Campana et al. 2001; Kim et al. 2004, 2007).
With the limiting flux sensitivity map, we used the relation given by Campana et al. (2001) for the number N of background sources greater than a flux density S per square degree, which may be expressed in CGS units as
If we consider an entire ACIS chip (with a field of view of 81 × 81) plus the south half of chip 6, and given our flux limit of ≈4 × 10⁻¹⁵ erg s−1 cm−2, we estimate that ≈6 of our detected discrete X-ray sources are background objects.
3.4. Radio Sources
Eleven radio sources were identified in IC 1613 at 6 cm. Three of the sources, IC1613-1, IC1613-5, and IC1613-7, were also identified by Dickel et al. (1985) in a 20 cm and 6 cm survey of IC 1613. 10 Those authors reported only one source at 6 cm: the SNR S8. The Dickel VLA observations were centered on S8, but the data were observed in continuum mode, which means that the sources suffered from bandwidth smearing (chromatic aberration), which worsens farther from the phase pointing center.
Table 3 lists the 6 cm flux densities for the sources we detect. We also include the 20 cm sources of Dickel et al. (1985), yielding a complete-to-date catalog of the known radio sources in IC 1613 (see Figure 8). Dickel et al. (1985) did not list uncertainties for their 20 cm fluxes. We estimate those uncertainties at 15% of the 20 cm flux density. With those values, we then calculate spectral indices for the sources detected at 6 and 20 cm: IC1613-1, IC1613-5, and IC1613-7. IC1613-7 is the previously known radio and optical SNR S8 (α: 12h 28m 10s.94, δ: 44o 06' 48''.34 (J2000.0)) (Sandage 1971) and is discussed in Schlegel et al. (2019).
Table 5. Sources in Evans et al. (2010) Not Detected in This Paper a
| R.A. | Dec | Approx CSC | CSC | ||||
|---|---|---|---|---|---|---|---|
| N | CCD | (J2000) | (J2000) | CountRate b | Status c | Liu? d | Assessment |
| a | 6 | 01:04:42.36 | 02:10:03.9 | 1.02e-4 | True | Y | <S/N cut |
| b | 6 | 01:04:44.07 | 02:11:45.7 | 2.24e-4 | True | Y | <S/N cut |
| c | 6 | 01:04:44.81 | 02:10:11.5 | 2.13e-4 | True | Y | <S/N cut |
| d | 7 | 01:04:48.39 | 02:07:10.1 | 1.79e-5 | True | Y | <S/N cut |
| e | 6 | 01:04:48.46 | 02:15:03.2 | 5.56e-5 | Marginal | N | ⋯ |
| f | 7 | 01:04:49.99 | 02:05:29.6 | 3.06e-5 | Marginal | N | ⋯ |
| g | 7 | 01:04:50.48 | 02:07:31.4 | 5.59e-5 | Marginal | N | ⋯ |
| h | 6 | 01:04:51.01 | 02:13:15.3 | 2.27e-4 | True | N | <S/N cut |
| i | 7 | 01:04:52.30 | 02:02:48.9 | 5.52e-4 | True | N | <S/N cut |
| j | 7 | 01:04:52.55 | 02:04:00.4 | 3.55e-5 | Marginal | N | ⋯ |
| k | 7 | 01:04:54.51 | 02:07:52.2 | 7.71e-5 | True | N | <S/N cut |
| l | 7 | 01:04:57.59 | 02:09:53.1 | 3.39e-4 | True | N | <S/N cut |
| m | 7 | 01:04:59.62 | 02:04:31.6 | 2.27e-4 | Marginal | N | ⋯ |
| n | 7 | 01:04:59.70 | 02:06:35.7 | 7.24e-5 | Marginal | N | ⋯ |
| o | 6 | 01:05:01.83 | 02:14:05.1 | 2.93e-4 | Marginal | N | ⋯ |
| p | 7 | 01:05:07.11 | 02:04:37.1 | 2.87e-4 | True | N | <S/N cut |
| q | 7 | 01:05:10.26 | 02:06:09.5 | 2.61e-3 | Marginal | N | ⋯ |
Notes.
a We cite Evans et al. (2010) as the primary Chandra Source Catalog reference; we used Release 2 of the CSC: ADS bibcode 2019yCat.9057....0E. b An approximate count rate obtained by inverting the fluxes listed in the Chandra Point Source Catalog using the known column toward IC 1613 plus a 5 keV thermal bremsstrahlung spectrum. Count rates below ≈1.5 × 10⁻⁴ counts sec−1 generate too few counts to rise above the average background. c The status as listed in the Chandra Point Source Catalog. For sources labeled "Marginal" based on the Catalog, we do not consider them further. d Liu? = present in Liu (2011) source list (Yes/No)?Download table as: ASCIITypeset image
All three sources for which the spectral indices were calculated are nonthermal. The spectral index, α (where Sν ∝ να ), is used to distinguish between thermal sources and nonthermal sources. To discriminate between thermal and nonthermal radio sources, we use the definitions of spectral index given in Pannuti et al. (2000) and Pannuti et al. (2002). A spectral index of − 0.2 ≤ α < 0.2 is used as a criterion for identifying a thermal spectrum, e.g., a candidate H ii region. A spectral index of α ≥ 0.2 is used as a criterion for identifying a nonthermal spectrum, a candidate SNR, or a background object. As expected, the known SNR is a nonthermal source; the other two sources are probable background sources based on the correspondence with sources in the NVSS and FIRST surveys (Condon et al. 1998; Becker et al. 1995).
The beam sizes of the 6 cm and 20 cm observations are well-matched, allowing for direct comparison of the flux densities and calculation of the spectral indices. The error in the spectral index was calculated by differentially propagating the errors in the 20 cm and 6 cm flux densities, and the errors were added in quadrature. The average error in the position of the sources is ∼10.
To provide confirming evidence that the radio sources are associated with IC 1613, we compared IC 1613 to an Hα image (from NED archive; original image taken 1995 Dec 19 at KPNO), as both thermal radio HII regions and nonthermal SNRs produce Hα emission. Since IC 1613 has a low redshift velocity of −240 km s−1 (average value from NED), many background sources will have much higher velocities and the Hα emission would be redshifted out of the narrowband filter, discriminating between radio sources within the galaxy and background objects.
Unfortunately, 11 of the 15 sources from Table 3 fall outside of the spatial area covered by the Chandra observation (Figure 8); of the remaining four sources, two have X-ray counterparts. The first is the the SNR S8 (Schlegel et al. 2019).
The second is interesting in its own right: the source at 01:04:44, +02:04:37 (J2000.0) was originally detected by Dickel et al. (1985) at 20 cm. An infrared counterpart exists: the VLA source is consistent with 2MASX J01044429 +0204367, a source for which the NED has very little data beyond an object listed in each of the NVSS and FIRST surveys (Condon et al. 1998; Becker et al. 1995). Visually, the source appears to be a faint galaxy, potentially elongated. In spite of the paucity of data, we may conclude that the counterpart is a background galaxy or AGN.
But the Chandra wavdetect algorithm finds two sources at this location (Chandra 4 and 5) of nearly equal flux separated by (ΔRA = 0s
.2, Δδ = 19, or roughly 4 Chandra ACIS pixels in decl.). To determine whether the wavdetect result provided the correct interpretation, we generated an artificial source using CIAO's ChaRT and the MARX software from the MIT Chandra team.
11
We did not attempt to include the background, deeming the brightness of sources 4 and 5 sufficient to overwhelm the background. Figure 4 shows the result: the PSF is sufficiently broad at the position of the detected sources 4 and 5 that we are almost certainly looking at a single X-ray source. The observation was carried out as a single pointing, so aspect uncertainties are unlikely to explain the apparent doubling. No other source at comparable off-axis angles shows apparent doubling. Possibly, a small fluctuation within the galaxy's distribution could lead to an apparent double source. However, to properly verify that the source is not double would require an on-axis pointing. In the remainder of this paper, we treat the two "sources" as one.
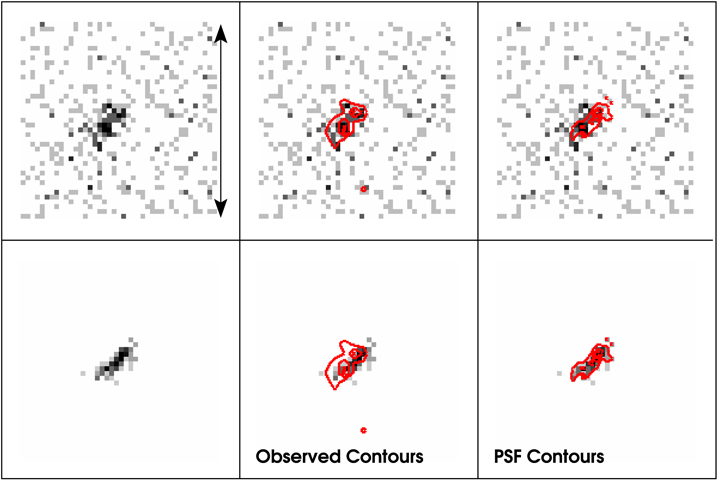
Figure 4. Investigation of whether sources 4 and 5 constitute a single object: the upper row includes the Chandra data; the lower row includes the artificial source generated using the MARX software. The left column shows the raw data and generated source with no binning; the middle column displays the observed contours overlaid; the right column shows the PSF contours overlaid. Contour lines are at 0.01, 0.03, 0.05, and 0.07 as a fraction of the total counts in the image. The vertical arrow in the upper left is 20 arcsec in length. North is up and east is left for all panels. The generated source is completely consistent with the two wavdetect-ed sources.
Download figure:
Standard image High-resolution image4. Properties of the X-Ray Detected Sources
To investigate the properties of the detected X-ray sources, we examined several different approaches, including quantiles and color–color plots. We describe each in turn.
4.1. Properties via Quantile Analysis
We adopted the quantile approach to a color–color diagram (Hong et al. 2004). The quantile method determines the energy below which falls a specified percentage of events. Colors are determined by ratios or differences of the resulting energies. Instead of an orthogonal grid as built for a hardness ratio, the interpretative grid has a distorted appearance that represents the true spectral energy information available from the instrument for a given spectral model.
In Figures 5(a) and (b), we present the quantile grids for the bremsstrahlung and power-law models, respectively (values in Table 6). For both grids, moving quasi-vertically in the grid crosses lines of equal NH with values of 0.001 (bottom), 0.005, 0.01, 0.05, 0.1, 0.5, and 1.0 × 1022 cm−2 (top). The bremsstrahlung temperature increments quasi-horizontally with values of 0.2 (left), 0.5, 1.0, 2.0, 5.0, and 10.0 keV (right). The power-law photon indices include grid values of 0.5 (right), 1.0, 1.5, 2.0, 2.5, 3.0, and 5.0 (left).

Figure 5. Distribution of IC 1613's point sources in quantile space for an adopted spectrum of a (a) bremsstrahlung; (b) power law. Three categories of detected sources are shown (as presented in Table 8): the heavy lines indicate high signal-to-noise sources (S/N > 7.0); thin lines indicate moderate S/N (4.0 < S/N < 7.0); asterisks indicate weak S/N (S/N < 4.0). Weak sources are shown without an error for legibility; in all cases, the error bars would cover at least half the grid. The filled red square represents a "typical" AGN with power-law index = 1.8; the filled blue circle represents a "typical" low-mass XRB with a bremsstrahlung temperature of 7 keV. See Section 4.1 for details.
Download figure:
Standard image High-resolution imageThe foreground NH is ∼3 × 1020 cm−2 and corresponds approximately to a line of constant  of 1. Each grid also contains two "typical" point sources: an AGN and an XRB. The spectrum of the AGN was built using an average power-law index (PLI) of 1.8. The spectrum was then fit with both power-law and thermal bremsstrahlung models absorbed by a column NH = 1 × 1021 cm−2 to recover the modeled spectral shape parameters as well as an approximate gauge using the other model. We adopted a higher column to mimic the typically higher columns toward AGN. Similarly, the XRB spectrum was built using a 7 keV bremsstrahlung model, then fit with power-law and bremsstrahlung models. For the AGN, the recovered values were PLI ∼1.85 and bremsstrahlung T ∼ 4 keV. For the XRB, the recovered values were ∼1.9 and 7.2 keV, respectively.
4.2. Properties via Color–Color Hardness Analysis
Prestwich et al. (2003) describe an X-ray color–color analysis of the discrete sources based on separating each source's counts into soft, medium, and hard bands. We followed their approach, defining the color bands using the same energy ranges: soft (S) equal to 0.3–1.0 keV, medium (M) as 1.0–2.0 keV, and hard (H) 2.0–8.0 keV. This then leads to two colors: M–S and H–M, each normalized by the total counts.
Figure 6 shows the result for IC 1613; the values are listed in Table 7. The majority of the sources are scattered throughout the regions labeled as "LMXBs," "HMXBs," and "Absorbed." The known SNR lies just outside of the SNR circle.
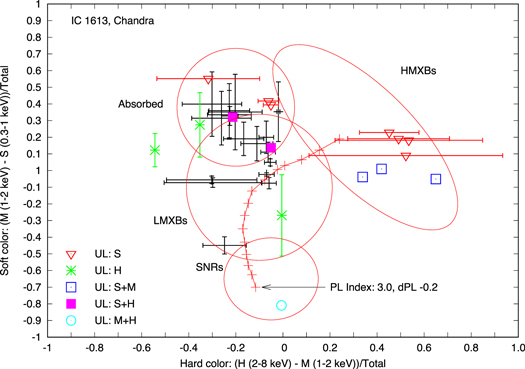
Figure 6. Distribution of IC 1613's point sources in X-ray color–color space following Prestwich et al. (2003). See Section 4.2 for details. The power-law curve (red "+") assumes a Galactic NH of 2 × 1020 cm−2. Higher values of NH pull the arc of points toward the center of the "Absorbed" circle. The known SNR lies just above the "SNRs" label.
Download figure:
Standard image High-resolution imageA very soft source, number 9, lies just inside the bottom edge of the SNR circle. It exhibits an upper limit on both the hard and medium energy bands; consequently, it is a candidate supersoft source. Supersoft sources are generally considered to be nuclear-burning white dwarfs (Kato 2010); whether that is the case here remains to be determined. Assuming zero local absorption, the luminosity of an accreting white dwarf of ≈0.5M⊙ would roughly match the detected X-ray luminosity, based on figures in Kato (2010). Larger masses are possible if local absorption exists.
We may also compare our color–color analysis with the CSC-extracted values. Figure 7(a) plots the (H–M)/B and (M–S)/B from our analysis versus the "same" quantities for the CSC. We restrict the comparison to the sources in common that have measured values in all bands (i.e., we ignore any source with an upper limit). We see a clear, systematic difference in both plots—this difference is attributed to the differing definitions of the bands. The CSC defines "soft" as 0.5–1.2 keV versus our definition of 0.5–1 keV; "medium" as 1.2–2 keV versus our 1–2 keV; and "hard" as 2–7 keV versus our 2–8 keV.
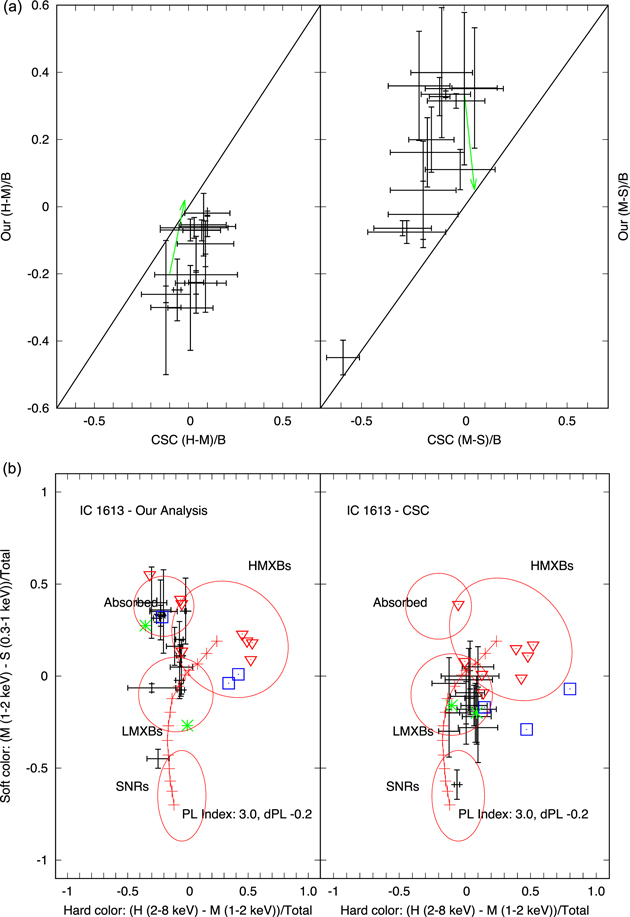
Figure 7. (a) Comparison of our color–color results vs. those from the Chandra Source Catalog. (a) Side-by-side comparison of the (H–M)/B and (M–S)/B values for sources in common. The band definitions differ as described in the text in Section 4.2. The green arrows in each show the shift calculated for one source changing from the CSC to our band definition. (b) Side-by-side comparison of the color–color plane as measured by our analysis vs. the Chandra Source catalog (CSC) for those sources in common. The overall CSC values are largely shifted downward—attributable to the different definitions of the soft and medium bands.
Download figure:
Standard image High-resolution imageDefining the "medium" band more restrictively will diminish the counts in that band, and for (M–S)/B, will shift them to S, hence making the resulting value more negative. In Figure 7(a), this results in a leftward shift. "Correcting" the CSC (M–S)/B will then require a rightward shift, as shown in the figure. A similar situation is also the case for the (H–M)/B band.
Figure 7(b) shows the color–color result side-by-side with our analysis—the points all fall roughly in the same general vicinity, but if the interpretation circles are used literally, then the CSC points all become LMXBs—whereas we would argue for there being some absorbed objects. To properly know which interpretations are correct, we need detailed identifications of the counterparts to each of the point sources.
4.3. X-Ray Time Variability
A relatively long observation can detect variability if the variability of each discrete source is of a relatively short duration. We used the CIAO routine glvary (and its associated setup tasks) to examine the variability of all of the sources. Only four sources emerged as possibly variable: numbers 8, 11, 16, and 30. An examination of the fractional effective area for each of these sources demonstrated that, while variable, the effective areas were all consistently variable, mostly due to the intentional dithering of Chandra. That eliminates changes in effective area as an explanation. We then examined each source in detail.
Source 16 is immediately dismissed as variable because it shows a very small degree of change, well within the uncertainties both before and after the change. In contrast, Source 8 shows a drop about halfway through the observation, from a count rate of 0.00194 ± 0.00020 counts s−1 to a rate of 0.00165 ± 0.00020 counts s−1.
Sources 11 and 30 are more difficult to assess—each has a short-term variation during the time range. Both lie on the glvary boundary between "probably not a variable" and "may be a variable." Neither lies near a chip boundary. Both have low counts, so the statistical variation could be dismissed as small number statistics.
Of the sources in IC 1613 during the Chandra observation, only source 8 appears to warrant some attention for variability. As the Chandra observation of IC 1613 was relatively short, we do not discuss possible variability further in this paper.
If we match the possibly variable sources with counterparts, source 8 lies in the HMXB circle of Figure 6, source 11 lies on the boundary of the LMXB and Absorbed circles, and source 16 lies near the center of the LMXB circle. Longer and deeper X-ray, optical, IR, and radio observations are necessary to confirm or refute any possible counterpart identifications.
5. UV and IR Correspondence: Search for Specific Types of Objects
IC 1613 has also been observed by GALEX (UV), Swift (UV), Spitzer (IR), and WISE (IR). In this section, we compare the Chandra sources with observations from those wavelengths. Table 8 lists the correspondences. Our overall goal is the identification of counterparts to any of the discrete point sources.
Table 6. Quantile Values for Point Sources
| Src | CCD | RA (J2000.0) | Dec (J2000.0) | QDx | err | QDy | err | Q25 | err | Q50 | err | Q75 | err |
|---|---|---|---|---|---|---|---|---|---|---|---|---|---|
| Sources with S/N >7.0 | |||||||||||||
| 4 | 7 | 01 04 44.1 | 02 04 38.7 | −1.019 | 0.047 | 1.290 | 0.176 | 0.056 | 0.004 | 0.087 | 0.009 | 0.131 | 0.020 |
| 7 | 7 | 01 04 47.2 | 02 05 51.5 | −0.434 | 0.013 | 1.436 | 0.108 | 0.172 | 0.003 | 0.269 | 0.006 | 0.360 | 0.005 |
| 11 | 7 | 01 04 49.6 | 02 09 08.7 | −0.841 | 0.101 | 1.110 | 0.379 | 0.087 | 0.018 | 0.126 | 0.042 | 0.236 | 0.112 |
| 13 | 6 | 01 04 50.8 | 02 12 59.2 | −0.757 | 0.018 | 1.126 | 0.078 | 0.103 | 0.004 | 0.149 | 0.005 | 0.276 | 0.022 |
| 26 | 7 | 01 05 02.4 | 02 08 42.1 | −1.148 | 0.007 | 1.727 | 0.028 | 0.048 | 0.001 | 0.066 | 0.001 | 0.083 | 0.001 |
| 30 | 7 | 01 05 08.3 | 02 06 39.0 | −1.006 | 0.040 | 0.812 | 0.295 | 0.049 | 0.013 | 0.090 | 0.034 | 0.182 | 0.094 |
| Sources with 7.0 > S/N > 4.0 | |||||||||||||
| 5 | 7 | 01 04 44.4 | 02 04 36.9 | −1.125 | 0.047 | 1.054 | 0.195 | 0.042 | 0.014 | 0.070 | 0.022 | 0.120 | 0.022 |
| 6 | 6 | 01 04 45.2 | 02 14 33.8 | −0.754 | 0.055 | 1.020 | 0.146 | 0.091 | 0.011 | 0.150 | 0.016 | 0.267 | 0.034 |
| 12 | 6 | 01 04 50.2 | 02 13 41.2 | −0.722 | 0.145 | 0.806 | 0.145 | 0.103 | 0.015 | 0.159 | 0.044 | 0.384 | 0.065 |
| 16 | 7 | 01 04 52.3 | 02 08 02.4 | −0.249 | 0.183 | 0.696 | 0.432 | 0.134 | 0.228 | 0.361 | 0.102 | 0.579 | 0.040 |
| 17 | 7 | 01 04 54.6 | 02 02 10.3 | −0.335 | 0.037 | 0.711 | 0.298 | 0.111 | 0.108 | 0.316 | 0.020 | 0.469 | 0.017 |
| 18 | 7 | 01 04 54.6 | 02 02 32.5 | −0.935 | 0.181 | 1.176 | 0.221 | 0.067 | 0.015 | 0.104 | 0.006 | 0.172 | 0.027 |
| 19 | 6 | 01 04 56.3 | 02 12 13.4 | −0.725 | 0.080 | 0.723 | 0.145 | 0.078 | 0.012 | 0.159 | 0.024 | 0.323 | 0.063 |
| 22 | 7 | 01 04 57.7 | 02 09 12.9 | −0.512 | 0.180 | 0.525 | 0.345 | 0.097 | 0.137 | 0.235 | 0.375 | 0.553 | 0.089 |
| 23 | 7 | 01 04 57.9 | 02 03 39.9 | −0.913 | 0.170 | 1.204 | 0.252 | 0.063 | 0.020 | 0.109 | 0.013 | 0.158 | 0.033 |
| 24 | 6 | 01 04 58.2 | 02 12 50.1 | −0.777 | 0.044 | 1.227 | 0.193 | 0.106 | 0.097 | 0.143 | 0.012 | 0.259 | 0.045 |
| 25 | 6 | 01 05 01.0 | 02 11 26.6 | −0.624 | 0.052 | 1.024 | 0.208 | 0.136 | 0.015 | 0.192 | 0.018 | 0.400 | 0.092 |
| 27 | 6 | 01 05 03.3 | 02 13 44.7 | −0.278 | 0.070 | 1.191 | 0.146 | 0.213 | 0.023 | 0.345 | 0.036 | 0.536 | 0.058 |
| 29 | 7 | 01 05 04.8 | 02 05 30.7 | −0.831 | 0.099 | 1.173 | 0.412 | 0.076 | 0.024 | 0.129 | 0.016 | 0.195 | 0.121 |
| Sources with S/N < 4.0 | |||||||||||||
| 1 | 6 | 01 04 32.3 | 02 13 12.6 | −0.728 | 0.093 | 0.769 | 0.165 | 0.084 | 0.019 | 0.157 | 0.028 | 0.328 | 0.044 |
| 2 | 6 | 01 04 37.6 | 02 13 06.4 | −0.780 | 0.075 | 1.074 | 0.290 | 0.098 | 0.017 | 0.142 | 0.021 | 0.273 | 0.079 |
| 3 | 7 | 01 04 43.9 | 02 05 39.9 | −0.602 | 0.068 | 1.869 | 0.511 | 0.165 | 0.021 | 0.200 | 0.024 | 0.265 | 0.084 |
| 8 | 6 | 01 04 47.6 | 02 10 25.0 | −0.208 | 0.172 | 1.081 | 0.331 | 0.199 | 0.071 | 0.383 | 0.092 | 0.552 | 0.079 |
| 9 | 7 | 01 04 47.9 | 02 07 30.6 | −2.215 | 0.050 | 0.967 | 0.279 | 0.003 | 0.003 | 0.006 | 0.001 | 0.009 | 0.078 |
| 10 | 6 | 01 04 49.2 | 02 11 57.2 | −0.809 | 0.050 | 1.242 | 0.317 | 0.097 | 0.009 | 0.134 | 0.013 | 0.234 | 0.071 |
| 14 | 7 | 01 04 50.9 | 02 07 54.5 | −0.281 | 0.201 | 0.907 | 0.324 | 0.178 | 0.074 | 0.344 | 0.061 | 0.588 | 0.042 |
| 15 | 7 | 01 04 52.3 | 02 06 26.8 | −0.428 | 0.063 | 0.541 | 0.615 | 0.082 | 0.516 | 0.272 | 0.203 | 0.455 | 0.183 |
| 20 | 6 | 01 04 56.9 | 02 13 53.2 | −0.779 | 0.062 | 1.222 | 0.220 | 0.109 | 0.099 | 0.143 | 0.017 | 0.267 | 0.055 |
| 21 | 7 | 01 04 57.5 | 02 04 00.4 | −0.714 | 0.190 | 1.116 | 0.886 | 0.106 | 0.035 | 0.162 | 0.067 | 0.286 | 0.668 |
| 28 | 7 | 01 05 03.9 | 02 02 47.9 | −0.903 | 0.186 | 1.263 | 0.437 | 0.073 | 0.037 | 0.111 | 0.021 | 0.173 | 0.115 |
| 31 | 7 | 01 05 08.7 | 02 09 21.1 | −0.952 | 0.430 | 1.325 | 0.657 | 0.077 | 0.015 | 0.100 | 0.048 | 0.174 | 0.311 |
Download table as: ASCIITypeset image
5.1. Ultraviolet Correspondence
Swift UVOT (Roming et al. 2004) images of IC 1613 show a large number of UV-bright sources, particularly in the northeast portion of the galaxy. Figure 8(a) displays the summed UVOT data in the filter UWM2 (∼2100 Å). A total of eight X-ray sources are definitely detected in at least one of the UV bands: sources 1, 2, 4 + 5, 9, 10, 18, and 26 (the SNR); sources 9, 14, and 15 must be investigated further, as possible multiple counterparts are found in the detection region. In general, however, there are few UV counterparts.
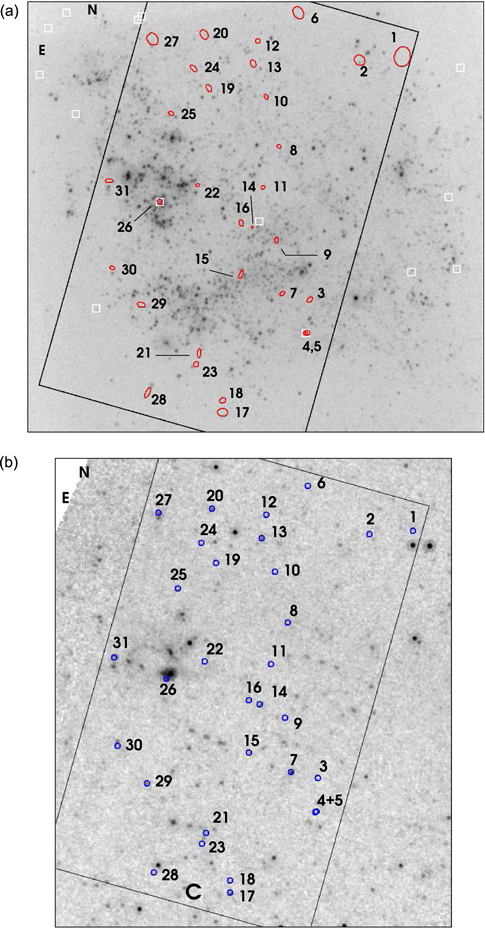
Figure 8. (a) Swift and Spitzer images of IC 1613. (a) Swift UVOT UWM2 view (gray scale) of IC 1613 with the Chandra coverage of IC 1613 indicated by the large black box. Detected Chandra sources are circled in red. White boxes indicate VLA detections; none of the VLA sources are labeled. Most of the VLA sources do not fall within the sky area covered by Chandra. Note that two VLA sources are also Chandra sources (4+5, 26). The cluster of galaxies is not labeled in this image but lies between sources 17 and 28. (b) Spitzer MIPS 24μ gray scale image of IC 1613 with the Chandra sources overlaid. The white space in the upper left corner indicates the edge of the MIPS field of view. Every source has a detectable flux (Table 9).
Download figure:
Standard image High-resolution imageThe same statement may be made about the GALEX F- and N-UV images. We do not show these images, because the correspondence is very close to that shown with the Swift UVOT image discussed above (Figure 8(a)). The list of sources with counterparts in the Swift image matches the list for GALEX counterparts.
5.2. Infrared Correspondence: Spitzer IRAC and MIPS
We also compared the X-ray-detected sources with images from the Infrared Array Camera (IRAC; Fazio et al. 2004) and the Multiband Imager Photometer for Spitzer (MIPS; Rieke et al. 2004) on board Spitzer.
We use IRAC because the spatial resolution is more than twice that of the Wide-field Infrared Sky Explorer (WISE; Wright et al. 2010). The IRAC frames for IC 1613 have been calibrated so fluxes were directly available. We use MIPS because the spatial coverage matches the Chandra ACIS field of view very well.
The chip offsets in the IRAC camera leave 10 Chandra sources without IR coverage for the 3.6 μ and 5.8 μ bands and four (different) sources without 4.5 μ and 8.0 μ coverage (q.v., Table 8). As a result, we use the WISE 3.4 μ and 4.6 μ bands to fill in some of the missing IRAC measures. We describe the correction from WISE to IRAC below.
In contrast to the UV sources (Section 5.1), nearly every X-ray source has at least one counterpart in one of the IR bands. We show the MIPS data with X-ray sources overlaid in Figure 8(b). Correspondences between the X-ray and their IR counterparts are listed in Table 8; fluxes are listed in Table 9. That every X-ray source has a MIPS counterpart with a significantly detected flux implies that the IRAC data would very likely have shown IR counterparts had the field of IC 1613 been fully covered.
Table 7. X-ray Color–Color Data for Each Source a
| N | CCD | RA (J2000.0) | Dec (J2000.0) | Cts-B | Err | Cts-H | Err | Cts-M | Err | Cts-S | Err | (H-M)/B | Unc | (M-S)/B | Unc |
|---|---|---|---|---|---|---|---|---|---|---|---|---|---|---|---|
| 1 | 6 | 01 04 32.3 | 02 13 12.6 | 21.2 | 6.5 | 1.8 | 1.4 | 1.9 | 1.4 | 7.6 | 3.3 | −0.0047 | ⋯ | −0.2688 | 0.24428 |
| 2 | 6 | 01 04 37.6 | 02 13 06.4 | 23.5 | 6.0 | 7.7 | 3.3 | 10.3 | 3.7 | 6.5 | 3.0 | −0.1106 | 0.06801 | 0.1617 | 0.10319 |
| 3 | 7 | 01 04 43.9 | 02 05 39.9 | 14.5 | 4.2 | 5.3 | 2.8 | 9.9 | 3.3 | 1.9 | 1.4 | −0.3172 | 0.21844 | 0.5517 | ⋯ |
| 4 + 5 | 7 | 01 04 44.2 | 02 04 37.6 | 35.8 | 8.7 | 4.6 | 2.8 | 15.3 | 3.3 | 17.6 | 4.4 | −0.3003 | 0.19958 | −0.0642 | 0.02261 |
| 6 | 6 | 01 04 45.2 | 02 14 33.8 | 48.1 | 8.8 | 17.8 | 5.3 | 21.2 | 5.7 | 11.6 | 4.2 | −0.0706 | 0.03117 | 0.1995 | 0.09713 |
| 7 | 7 | 01 04 47.2 | 02 05 51.5 | 87.9 | 9.8 | 62.5 | 8.3 | 22.8 | 5.0 | 2.7 | 1.7 | 0.4516 | 0.12626 | 0.2286 | ⋯ |
| 8 | 6 | 01 04 47.6 | 02 10 25.0 | 18.7 | 4.7 | 15.3 | 4.2 | 5.3 | 2.4 | 1.9 | 1.4 | 0.5347 | 0.31345 | 0.1818 | ⋯ |
| 9 | 7 | 01 04 47.9 | 02 07 30.6 | 31.5 | 6.7 | 1.8 | 1.4 | 2.0 | 1.4 | 27.5 | 5.2 | −0.0063 | ⋯ | −0.8095 | ⋯ |
| 10 | 6 | 01 04 49.2 | 02 11 57.2 | 50.9 | 7.7 | 15.5 | 4.4 | 27.1 | 5.5 | 8.8 | 3.3 | −0.2278 | 0.08668 | 0.3595 | 0.16266 |
| 11 | 7 | 01 04 49.6 | 02 09 08.7 | 22.2 | 4.9 | 7.1 | 3.0 | 11.6 | 3.5 | 3.8 | 2.0 | −0.2027 | 0.11436 | 0.3513 | 0.22682 |
| 12 | 6 | 01 04 50.2 | 02 13 41.2 | 21.5 | 5.8 | 4.2 | 2.4 | 8.8 | 3.6 | 1.9 | 1.4 | −0.2139 | ⋯ | 0.3209 | ⋯ |
| 13 | 6 | 01 04 50.8 | 02 12 59.2 | 324.8 | 19.8 | 94.5 | 10.9 | 167.8 | 14.2 | 61.3 | 8.5 | −0.2256 | 0.03509 | 0.3278 | 0.05689 |
| 14 | 7 | 01 04 50.9 | 02 07 54.5 | 11.1 | 3.6 | 8.7 | 3.6 | 2.9 | 1.7 | 1.9 | 1.4 | 0.5225 | 0.41145 | 0.0900 | ⋯ |
| 15 | 7 | 01 04 52.3 | 02 06 26.8 | 10.5 | 1.8 | 6.4 | 3.0 | 2.0 | 1.4 | 1.9 | 1.4 | 0.4190 | ⋯ | 0.0095 | ⋯ |
| 16 | 7 | 01 04 52.3 | 02 08 02.4 | 15.7 | 4.2 | 12.2 | 3.7 | 2.0 | 1.4 | 2.8 | 1.7 | 0.6496 | ⋯ | −0.0509 | ⋯ |
| 17 | 7 | 01 04 54.6 | 02 02 10.3 | 31.0 | 8.0 | 12.5 | 4.8 | 2.0 | 1.4 | 3.2 | 2.0 | 0.3387 | ⋯ | −0.0387 | ⋯ |
| 18 | 7 | 01 04 54.6 | 02 02 32.5 | 44.8 | 8.8 | 12.7 | 4.6 | 24.4 | 6.2 | 10.3 | 4.1 | −0.2611 | 0.02467 | 0.3147 | 0.02174 |
| 19 | 6 | 01 04 56.3 | 02 12 13.4 | 40.9 | 7.0 | 12.8 | 4.1 | 15.0 | 4.2 | 13.0 | 3.9 | −0.0537 | 0.09314 | 0.0488 | 0.14639 |
| 20 | 6 | 01 04 56.9 | 02 13 53.2 | 49.6 | 8.2 | 15.9 | 4.8 | 27.2 | 6.0 | 10.6 | 3.6 | −0.2278 | 0.03253 | 0.3346 | 0.00990 |
| 21 | 7 | 01 04 57.5 | 02 04 00.4 | 14.6 | 4.7 | 7.1 | 3.5 | 8.0 | 3.2 | 1.9 | 1.4 | −0.0616 | 0.04388 | 0.4178 | ⋯ |
| 22 | 7 | 01 04 57.7 | 02 09 12.9 | 13.9 | 3.7 | 4.9 | 2.4 | 5.6 | 2.4 | 3.7 | 2.0 | −0.0503 | 0.03540 | 0.1366 | ⋯ |
| 23 | 7 | 01 04 57.9 | 02 03 39.9 | 47.5 | 8.3 | 14.3 | 4.7 | 17.6 | 5.0 | 18.7 | 5.0 | −0.0694 | 0.03253 | −0.0231 | 0.09900 |
| 24 | 6 | 01 04 58.2 | 02 12 50.1 | 46.1 | 7.5 | 12.6 | 4.1 | 26.5 | 5.5 | 8.1 | 3.3 | −0.3015 | 0.12628 | 0.3991 | 0.19370 |
| 25 | 6 | 01 05 01.0 | 02 11 26.6 | 56.6 | 7.9 | 24.8 | 5.2 | 25.9 | 5.4 | 5.9 | 2.6 | −0.0194 | 0.00635 | 0.3533 | 0.17918 |
| 26 | 7 | 01 05 02.4 | 02 08 42.1 | 584.7 | 27.3 | 11.2 | 4.0 | 156.2 | 14.0 | 418.9 | 23.0 | −0.2479 | 0.09204 | −0.4492 | 0.05167 |
| 27 | 6 | 01 05 03.3 | 02 13 44.7 | 52.7 | 9.3 | 37.9 | 8.1 | 12.0 | 4.1 | 1.9 | 1.4 | 0.4914 | 0.21622 | 0.1916 | ⋯ |
| 28 | 7 | 01 05 03.9 | 02 02 47.9 | 27.4 | 7.5 | 11.3 | 4.7 | 12.7 | 4.9 | 1.9 | 1.4 | −0.0510 | 0.03218 | 0.3941 | ⋯ |
| 29 | 7 | 01 05 04.8 | 02 05 30.7 | 31.7 | 6.3 | 11.1 | 3.7 | 13.1 | 3.9 | 9.6 | 3.9 | −0.0630 | 0.03086 | 0.1104 | 0.05978 |
| 30 | 7 | 01 05 08.3 | 02 06 39.0 | 35.7 | 6.6 | 10.3 | 3.9 | 12.4 | 3.7 | 15.1 | 4.2 | −0.0588 | 0.03037 | −0.0756 | 0.03387 |
| 31 | 7 | 01 05 08.7 | 02 09 21.1 | 15.3 | 4.7 | 3.1 | 2.0 | 8.5 | 3.2 | 4.3 | 2.2 | −0.3529 | ⋯ | 0.2745 | 0.19369 |
| 32 | 6 | 01 04 51.7 | 02 18 48.3 | 57 | 15.4 | 1 | 1.7 | 32 | 6.1 | 25 | 5.4 | −0.5439 | ⋯ | 0.1228 | 0.10009 |
| 34 | 8 | 01 05 16.1 | 01 59 11.7 | 42 | 13.4 | 12. | 3.8 | 19. | 4.7 | 11. | 3.7 | −0.1667 | 0.08551 | 0.1905 | 0.10009 |
Note.
a Bands defined as: B = 0.3-8 keV; S = 0.3-1 keV; M = 1-2 keV; H = 2-8 keV. Only the cluster of galaxies, number 33, is not included. Uncertainties are not calculated whenever the signal-to-noise ratio in a band is ≲1.9. This occurs if the total counts are low or if the counts in a band are low.Download table as: ASCIITypeset image
Table 8. Multiwavelength Counterparts a of Chandra-detected Sources in the IC 1613 Field
| No. | RA (J2000.0) | Dec (J2000.0) | CCD | Radio | MIPS | IR4 | IR3 | IR2 | IR1 | V | UW1 | UM2 | UW2 | CXO b | Class |
|---|---|---|---|---|---|---|---|---|---|---|---|---|---|---|---|
| 1 | 01 04 32.3 | 02 13 12.6 | 6 | N | Y? | Y | — | Y | N-W | Y? | Y | Y? | N | LX5 | |
| 2 | 01 04 37.6 | 02 13 06.4 | 6 | N | Y | Y | — | Y | N-W | N? | Y? | Y | Y? | LX15 | |
| 3 | 01 04 43.9 | 02 05 39.9 | 7 | N | N | Y? | Y? | Y | Y | N | N | N | N | LX33 | |
| 4 + 5 | 01 04 44.2 | 02 04 38.8 | 7 | Y | N | Y | Y | Y | Y | Y | Y | N | N | LX17 | Galaxy |
| 6 | 01 04 45.2 | 02 14 33.8 | 6 | N | Y? | Y | — | Y | Y-W | N | N | N | N | LX14 | |
| 7 | 01 04 47.2 | 02 05 51.5 | 7 | N | Y | Y | Y | Y | Y | N | Y? | N | N? | LX7 | |
| 8 | 01 04 47.6 | 02 10 25.0 | 6 | N | Y? | Y | Y? | Y | Y | N? | N | N | N | LX23 | |
| 9 | 01 04 47.9 | 02 07 30.6 | 7 | N | N | Y | Y | Y | Y | Y? | Y | Y3? | Y3? | LX20 | |
| 10 | 01 04 49.2 | 02 11 57.2 | 6 | N | N | N? | — | Y | N-W | N? | Y | Y | Y | LX10 | |
| 11 | 01 04 49.6 | 02 09 08.7 | 7 | N | N | N? | Y? | Y | Y | Y? | N | N | N | LX26 | |
| 12 | 01 04 50.2 | 02 13 41.2 | 6 | N | Y? | Y | — | Y | Y-W | Y | N | N? | N? | LX21 | |
| 13 | 01 04 50.8 | 02 12 59.2 | 6 | N | Y | Y | — | Y | Y-W | Y | Y? | N? | N | LX2 | |
| 14 | 01 04 50.9 | 02 07 54.5 | 7 | N | Y | Y | Y | Y | Y | N? | Y2? | N? | N? | LX37 | |
| 15 | 01 04 52.3 | 02 06 26.8 | 7 | N | Y | Y | Y | Y | Y | N? | Y2? | N? | N? | ⋯ | |
| 16 | 01 04 52.3 | 02 08 02.4 | 7 | N | Y | Y | Y | Y | Y | Y? | Y? | N | Y? | LX31 | |
| 17 | 01 04 54.6 | 02 02 10.3 | 7 | N | Y | N | Y | Y | Y | Y? | N | N | N | LX18 | |
| 18 | 01 04 54.6 | 02 02 32.5 | 7 | N | N | Y? | Y | Y | Y | Y | Y | Y | N | LX16 | |
| 19 | 01 04 56.3 | 02 12 13.4 | 6 | N | N | Y | — | Y | N-W | N? | N | N | N | LX12 | |
| 20 | 01 04 56.9 | 02 13 53.2 | 6 | N | Y | Y | — | Y | Y-W | Y | N | Y? | N? | LX4 | |
| 21 | 01 04 57.5 | 02 04 00.4 | 7 | N | Y | Y? | Y? | Y | Y | N | N | N | N | LX30 | |
| 22 | 01 04 57.7 | 02 09 12.9 | 7 | N | N | Y | Y | Y | Y | N | N | N | N | LX29 | |
| 23 | 01 04 57.9 | 02 03 39.9 | 7 | N | N | Y? | N | Y | Y? | N | N | N | N | LX13 | |
| 24 | 01 04 58.2 | 02 12 50.1 | 6 | N | Y | Y | — | Y | Y-W | Y? | N | N | N | LX11 | |
| 25 | 01 05 01.0 | 02 11 26.6 | 6 | N | Y | Y | Y | Y | Y | N | Y? | Y? | Y? | LX9 | |
| 26 | 01 05 02.4 | 02 08 42.1 | 7 | Y | Y | Y | Y | Y | Y | Y | Y | Y | Y | LX1 | SNR |
| 27 | 01 05 03.3 | 02 13 44.7 | 6 | N | Y | — | — | N-W | Y-W | Y | N | N | N? | LX8 | |
| 28 | 01 05 03.9 | 02 02 47.9 | 7 | N | N | — | N | N-W | Y | N? | N | N | N | LX22 | |
| 29 | 01 05 04.8 | 02 05 30.7 | 7 | N | Y | Y | Y | Y | Y | Y | N | N | N | LX25 | |
| 30 | 01 05 08.3 | 02 06 39.0 | 7 | N | Y | Y | N | Y | Y | N | N | N | N | LX24 | |
| 31 | 01 05 08.7 | 02 09 21.1 | 7 | N | Y | — | Y? | N-W | Y | N | N | N | N | LX43 |
Notes
a Notes: Columns labeled "IRn" refer to the four Spitzer Infrared Array Camera bands (4 = 8.0 μ; 3 = 5.8 μ; 2 = 4.5 μ; 1 = 3.6 μ). The "UWn" and "UMn" columns refer to the Swift UVOT bands ("UW1": center wavelength = 2634 Å; "UM2": center wavelength = 2231 Å; "UW2": center wavelength = 2030 Å; Roming et al. 2004). A "Y" in an identification column indicates there is one counterpart in that band; a digit "n" after a "Y" indicates source confusion from "n" sources. Sources with a "–" in an IRAC column are those for which IRAC coverage of the source's position is not available. Sources with a "Y-W" or "N-W" indicate that the source was (or was not) detected in WISE images of IC 1613—these sources were not covered by IRAC. b For the CXO column, the reference is Liu (2011), hence "L(iu)X(ray source)-nn," where the "nn" refers to the source number in that catalog.Download table as: ASCIITypeset image
Table 9. IC 1613 Spitzer IRAC and MIPS Fluxes a
| Chandra | IRAC 3.6 | IRAC 4.5 | IRAC 5.8 | IRAC 8.0 | MIPS 24 | |||||||
|---|---|---|---|---|---|---|---|---|---|---|---|---|
| Src | Flux | Unc | Flux | Unc | Flux | Unc | Flux | Unc | R1 b | R2 c | Flux | Unc |
| 1 | ⋯ | 3.45 | 3.7 | 4.89 | ⋯ | 3.45 | 7.0 | 5.78 | ⋯ | >1.90 | 111.7 | 16.28 |
| 2 | ⋯ | 3.45 | 3.1 | 4.73 | ⋯ | 3.45 | 6.1 | 5.56 | ⋯ | >1.94 | 120.7 | 16.85 |
| 3 | 10.0 | 6.42 | 7.6 | 5.93 | 3.7 | 4.89 | 4.8 | 5.22 | <0.37 | <0.63 | 101.2 | 15.62 |
| 4 + 5 | 94.8 | 15.17 | 71.9 | 13.47 | 40.0 | 10.61 | 28.4 | 9.26 | 0.42 | 0.39 | 109.7 | 16.15 |
| 6 | 55W | 7 | 8.7 | 6.15 | ⋯ | 3.45 | 7.8 | 5.93 | <0.06 | 0.89 | 120.7 | 16.85 |
| 7 | 38.2 | 10.41 | 34.2 | 9.93 | 38.6 | 10.43 | 51.7 | 11.74 | 1.01 | 1.51 | 122.0 | 16.95 |
| 8 | 8.9 | 6.18 | 6.3 | 5.59 | 4.6 | 5.17 | 9.2 | 6.28 | <0.52 | 1.47 | 112.8 | 16.36 |
| 9 | 19.6 | 8.09 | 14.4 | 7.24 | 5.9 | 5.54 | 6.1 | 5.56 | 0.30 | 0.42 | 120.4 | 16.84 |
| 10 | ⋯ | 3.45 | 3.7 | 4.93 | ⋯ | 3.45 | 1.7 | 4.23 | ⋯ | ⋯ | 111.3 | 16.26 |
| 11 | 11.1 | 6.65 | 7.9 | 6.00 | 3.3 | 4.80 | 2.4 | 4.50 | <0.30 | <0.30 | 119.8 | 16.80 |
| 12 | 231W | 8 | 15.1 | 7.38 | ⋯ | 3.45 | 15.0 | 7.35 | <0.01 | 0.99 | 130.1 | 17.43 |
| 13 | 166W | 8 | 34.3 | 9.97 | ⋯ | 3.45 | 62.4 | 12.68 | <0.02 | 1.82 | 136.1 | 17.78 |
| 14 | 36.6 | 10.21 | 28.4 | 9.27 | 16.1 | 7.53 | 15.9 | 7.49 | 0.44 | 0.56 | 134.0 | 17.65 |
| 15 | 13.7 | 7.13 | 10.9 | 6.63 | 5.5 | 5.45 | 10.5 | 6.53 | 0.41 | 0.97 | 122.0 | 16.93 |
| 16 | 25.1 | 8.82 | 17.5 | 7.75 | 12.6 | 6.92 | 7.4 | 5.85 | 0.50 | 0.42 | 121.8 | 16.93 |
| 17 | 20.5 | 8.21 | 6.8 | 5.74 | 12.9 | 6.98 | 0.7 | 3.80 | 0.63 | <0.11 | 135.9 | 17.76 |
| 18 | 19.0 | 7.99 | 13.1 | 7.00 | 9.6 | 6.33 | 4.4 | 5.13 | 0.50 | <0.34 | 120.4 | 16.84 |
| 19 | ⋯ | 3.45 | 9.4 | 6.31 | ⋯ | 3.45 | 6.3 | 5.61 | ⋯ | 0.67 | 129.8 | 17.41 |
| 20 | 69W | 7 | 12.6 | 6.92 | ⋯ | 3.45 | 21.6 | 8.34 | <0.05 | 1.72 | 127.0 | 17.24 |
| 21 | 9.2 | 6.28 | 11.3 | 6.68 | 2.6 | 4.54 | 4.8 | 5.22 | <0.28 | <0.43 | 122.8 | 16.98 |
| 22 | 28.2 | 9.25 | 29.4 | 9.38 | 15.9 | 7.49 | 16.8 | 7.64 | 0.56 | 0.57 | 120.2 | 16.82 |
| 23 | 4.6 | 5.15 | 4.8 | 5.22 | <3.45 | 3.45 | 2.8 | 4.60 | <0.7 | ⋯ | 119.8 | 16.80 |
| 24 | 37W | 7 | 7.2 | 5.83 | ⋯ | 3.45 | 8.7 | 6.17 | <0.1 | 1.21 | 121.7 | 16.91 |
| 25 | 7.9 | 5.98 | 9.6 | 6.33 | 9.0 | 6.22 | 14.4 | 7.24 | 1.14 | 1.50 | 131.4 | 17.50 |
| 26 | 13.8 | 7.14 | 14.6 | 7.27 | 20.7 | 8.23 | 24.0 | 8.68 | 1.49 | 1.65 | 145.5 | 18.31 |
| 27 | 314W | 12 | 307W | 14 | ⋯ | 3.45 | ⋯ | 3.45 | <0.01 | ⋯ | 138.5 | 17.91 |
| 28 | 6.3 | 5.61 | ⋯ | 3.45 | <3.45 | 3.45 | ⋯ | 3.45 | <0.5 | ⋯ | 129.6 | 17.39 |
| 29 | 17.5 | 7.75 | 16.8 | 7.64 | 14.8 | 7.31 | 31.4 | 9.64 | 0.84 | 1.87 | 124.1 | 17.06 |
| 30 | 8.1 | 6.05 | 7.2 | 5.83 | 4.5 | 3.45 | 9.6 | 6.33 | 0.55 | 1.33 | 131.8 | 17.54 |
| 31 | 3.1 | 4.76 | ⋯ | 3.45 | 2.6 | 4.52 | ⋯ | 3.45 | <0.82 | ⋯ | 136.4 | 17.80 |
Notes.
a All fluxes in milliJy. Original IRAC and MIPS images in MJy/steradian; extraction apertures ≈5 arcsec × 5 arcsec in size to accommodate Spitzer PSF. Units converted to MJy/arcsec2, then to milliJy. Sources with "⋯" in a flux column do not fall on the IRAC detectors. For the 3.6 μ and 4.5 μ bands, the "⋯" also indicates the sources is undetected in the WISE W1 or W2 bands. Sources with "⋯" in a ratio column are not detected in both bands of the ratio definition, usually because the source does not lie within the detector's field of view. Where possible, the uncertainty value is treated as an upper limit, leading to a "<" sign in the ratio columns. Values with "W" are converted from WISE measurements. b Ratio R1 = 5.8/3.6 flux: values >1 imply source = AGN (Shalima et al. 2013). c If we assume the same behavior applies to the 4.5 and 8 μ bands, we define R2 = 8.0 μ/4.5 μ flux ratio.Download table as: ASCIITypeset image
We did make use of AllWISE data (Kirkpatrick et al. 2014) for those sources that fell outside of the IRAC field of view. The AllWISE data allow us to fill in missing 3.6 μ or 4.5 μ values. The AllWISE magnitudes were corrected to the IRAC bands using the relations in Monson et al. (2017): [3.6] = W1 + 0.038 ± 0.010; [4.5] = W2 + 0.027 ± 0.010.
Table 10. Spectral Fits for Cluster MCXC J0105.0 + 0201 a
| NH | Model | Flux b | |||||||
|---|---|---|---|---|---|---|---|---|---|
| Model | DoF | cstat | χ2/DoF | kTbr | (1022 cm−2) | Abundance | Norm | Absorbed | Unfolded |
| bremss, CCD-7 | 424 | 586.7 | 1.33 |

|

| ⋯ | 1.30(80)[−4] | 6.76[−14] | 1.24[−13] |
| CCD-8 | ⋯ | ⋯ | ⋯ | ⋯ | ⋯ | ⋯ | 1.93(16)[−4] | 1.7[−13] | 2.51[−13] |
| apec, CCD-7 | 423 | 732.4 | 1.67 |

|

| <0.14 |
 [−4] [−4] | 8.2[−13] | 8.8[−13] |
| CCD-8 | ⋯ | ⋯ | ⋯ | ⋯ | ⋯ | ⋯ |
 [−4] [−4] | 6.7[−13] | 8.1[−13] |
Notes.
a Numbers in () = uncertainty in last digit(s); numbers in [] = 10XX ; b All fluxes in ergs s−1 cm−2 in the 0.3–8 keV band.Download table as: ASCIITypeset image
We plot three different approaches to classification using IR colors. First, Figure 9(a) shows a color–color plane with 3.6 μ–4.5 μ versus 5.6 μ–8.0 μ magnitude differences. The boxes labeled "AGNs" and "Stars" were defined by Allen et al. (2004) and Stern et al. (2007). In this plot, sources 21, 22, 25, and 26 plus sources 7 and 29, which lie on the box edge, would be identified as candidate AGN. The remaining sources would be identified as stars, with sources 8 and 15 of questionable identification because both lie well away from the boundaries of either box.
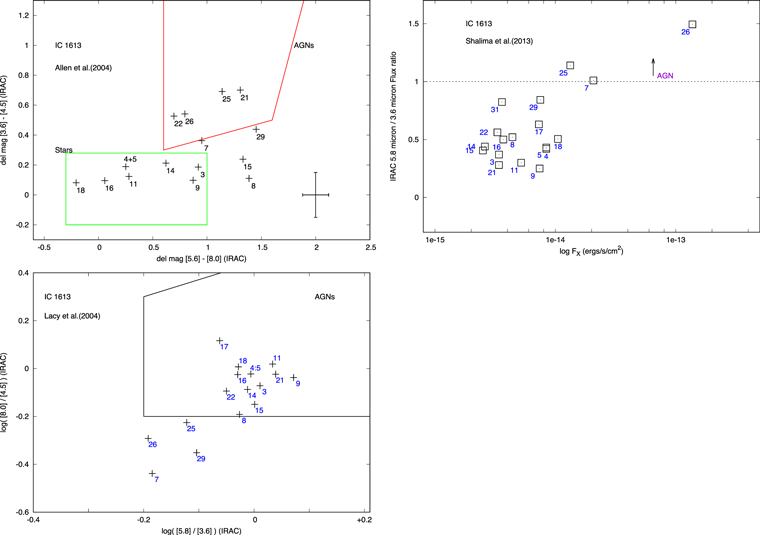
Figure 9. Color–color or color–flux figures aimed at identification of background objects using the (a) IRAC color–color plane of Allen et al. (2004) and Stern et al. (2007); (b) the IRAC 5.8 μ/3.6 μ-X-ray flux plane of Shalima et al. (2013); and (c) the IRAC color–color plane of Lacy et al. (2004). For (a), the colored boxes are approximate regions—e.g., source 4 + 5 is a galaxy and possible AGN, but appears in the top portion of the "stars" box; source 26 is a known SNR and appears in the lower portion of the "AGN" box. The black unlabeled point indicates a typical uncertainty. For (b), the gray horizontal line indicates the dividing 5.8/3.6 ratio that separates AGN (>1) from non-AGN. Source 26 is the known SNR S8 falling into "AGN territory." For (c), the "AGN" box is defined in Lacy et al. (2004).
Download figure:
Standard image High-resolution imageAssuming the sources falling within the AGN box of Figure 9(a) and the sources touching the edge of the box are all AGN, then this exercise yields 6 possible candidates of 15 sources with available IR colors. This is approximately in line with our previous estimate of background objects unrelated to IC 1613.
The second Figure (9) plots the ratio RShal−1 =F(5.8 μ)/F(3.6 μ) > 1 (Shalima et al. 2013) versus the X-ray flux. Using this plot, sources 7, 25, and 26 are identified as candidate AGN. Note that in neither plot is source 4 + 5 (discussed at the end of Section 3.4) identified as an AGN, yet this source was detected in the VLA observations as a nonthermal source. Note that sources 25 and 26 appear in the AGN realm based on the criteria of Allen et al. (2004) and Shalima et al. (2013). We will return to that point momentarily.
The third Figure (9) plots the ratio RShal−2 = log(F(8.0 μ)/F(4.5 μ)) versus RShal−1 = log(F(5.8 μ)/F(3.6) μ)) as in Lacy et al. (2004). This ratio is intended to separate objects with strong blue versus red continua. The AGN box is indicated. Only "clean" sources are plotted, where "clean" equals a detection in all four IRAC bands. Based on this figure, 12 of the 16 completely detected sources fall within the AGN box.
If the Shalima et al. (2013) approach also applies to the ratio of the 8.0 μ/4.5 μ fluxes, i.e., if a value > 1 indicates an AGN, then the "RShal−2" ratio implies 11 sources are AGN. That then leads to a background sky density about 80% higher than the Chandra-determined density. The Swift BAT survey showed significant variations across the sky (Ajello et al. 2012). From that paper, IC 1613 lies in or near a region where the AGN density is ≈1.5 × higher than a uniform distribution. We do not push this interpretation, as the background work to establish the "RShal−2" ratio has not apparently been done—but the interpretation is reasonably consistent with published behavior.
However, there is an issue here: AGN exhibit significant IR excesses and these have been used to identify them in IR surveys (e.g., Maitra et al. 2019 for the SMC). We note that the known SNR, source 26, lies within the AGN box of Figure 9(a) and has an RShal−1 > 1 as defined in the previous paragraph. Very likely this occurs because, in the infrared, SNRs are dusty emission line objects (e.g., Cherchneff 2016), a description equally applicable to AGN (e.g., Mason 2015). This raises a significant caution for identification of AGN through a galaxy, as some of the sources could be SNRs. Such a restriction would not apply for candidate AGN identified in the field. Slightly reassuringly, in Figure 9(c) the SNR lies outside of the AGN box.
Given the proximity of IC 1613, follow-up studies can and should be made of the X-ray-detected sources to identify the optical or infrared counterparts. Such a follow-up would not only be useful for investigating the IC 1613 sources, but could also aid in establishing which of the AGN identification criteria most closely identifies actual AGN. For example, analyses of the spectral indices of detected radio counterparts would likely distinguish SNRs from background AGN.
5.3. Specific Types of Objects or Specific Objects
Given the relative proximity of IC 1613, there is a long list of objects that have been studied at other wavelengths. We have extracted the positions of H II regions (Smith 1975; Price et al. 1990; Hodge et al. 1990), OB stars and associations (Borissova et al. 2004; Garcia et al. 2009), Mira variables (Kurtev et al. 2001), and planetary nebulae (Magrini et al. 2005), and compared each to the detected Chandra sources. None of these objects have been detected.
The possible X-ray detection of a W-O star (Davidson & Kinman 1982; at (J2000) 01:05:01.7, +02:04:20.8) was Lozinskaya et al. (1998)'s original motivation for the ROSAT HRI observation, but they obtained an upper limit. Our Chandra observation likewise does not detect this object, with an upper limit of ≈2 × 1035 erg s−1 based on the counts, or an upper limit of ∼8 × 1035 erg s−1 based on the limiting sensitivity, at the location of the star. While our upper limit improves on the ROSAT value by an order of magnitude, the value remains several orders of magnitude above the to-date measured X-ray luminosities of ∼1030–31 erg s−1 for W-O and other Wolf–Rayet stars in the Milky Way (Oskinova 2015).
We also do not detect the cluster of galaxies 2MASX J01044836 + 0207107 centered on the cD galaxy at 01:04:48, +02:07:11.3 (J2000.0), and visible through IC 1613. The cluster is easily visible in HST images (e.g., HLA 12304_07_wfc3_uvis_f350m). That location is within the region of highest spatial resolution on CCD 7. We do detect the galaxy cluster MCXC J0105.0 + 0201—this source is discussed in Section 8.1.
6. Luminosity Function of Discrete X-Ray Sources
The number of sources N detected in a galaxy as a function of the flux (S) will increase as the flux decreases: this is sensible, as there will be few very bright sources and many faint ones. The resulting log N–log S relation can contain clues to the evolution of the X-ray-emitting population in the galaxy. Some of those objects will be background sources, particularly active galaxies or clusters of galaxies. Over the past decade or so, a number of studies have also demonstrated a connection between the X-ray luminosity of a galaxy and its star formation rate (e.g., Ranalli et al. 2003; Colbert et al. 2004; Persic & Rephaeli 2007; Lehmer et al. 2008, 2010, 2016 2019, 2020; Mineo et al. 2012a, 2012b; Basu-Zych et al. 2013a; Aird et al. 2017) and its metallicity (e.g., Dray 2006; Mapelli et al. 2010; Kaaret et al. 2011; Basu-Zych et al. 2013b, 2016; Fragos et al. 2013a, 2013b; Brorby et al. 2014, 2016; Douna et al. 2015; Lehmer et al. 2017; Antoniou et al. 2019; Fornasini et al. 2019, 2020; Kouroumpatzakis et al. 2020; Kovlakas et al.2020).
Determining a log N–log S relation is easy in some bands because all sources across the field of view have an equal chance to be detected. In the X-ray band, however, this is not the case: the point-spread function and effective area vary with energy as well as off-axis angle, directly affecting the detection probability. A number of authors have described the determination of a log N–log S distribution based on the limiting sensitivity of the Chandra detectors (e.g., Binder et al. 2017; Wang 2004 among others). A variety of additional corrections have been introduced over the past decade or so to address the incompleteness. Many of these approaches are not completely clear to us. For some of the approaches, the corrections will likely be as large or larger than the number counts. Here, we make an approximation in lieu of a more complete analysis.
X-ray source detection is inherently incomplete, as the off-axis angle increases. For the IC 1613 sources, we can see the effect clearly: separating the sources by CCD (7, i.e., "on-axis" versus 6, i.e., "off-axis") and by counts (10–20, 20–30, and >30) yields 10 sources (CCD 7) versus 8 (CCD 6) for sources with counts above 30, 2 (CCD 7) versus 3 (CCD 6) for counts in the 20–30 range, but 7 (CCD 7) versus 1 (CCD 6) for counts below 20. Clearly, CCD 6, with a typical off-axis angle of 6'–7', means the source point-spread functions are wider, hence the source must be brighter to be detected. Consequently, we include in our log N–log S analysis only those sources with sufficient counts to lie above the statistical flux threshold.
Further, if we look at the simulations of Wright et al. (2015), and correct for the differing distances, we estimate the 90% completeness level for the portion of IC 1613 observed by Chandra as ≈8 × 1035 erg s−1 or ≈50 counts. That value corresponds rather closely with the break in the observed slope of the log N(>S) relation for IC 1613 (Figure 10). We adopt that energy as the "break energy." Given the low number of sources, and the number and magnitude of the corrections we would need to make, we elect to fit the distribution only above the break energy.
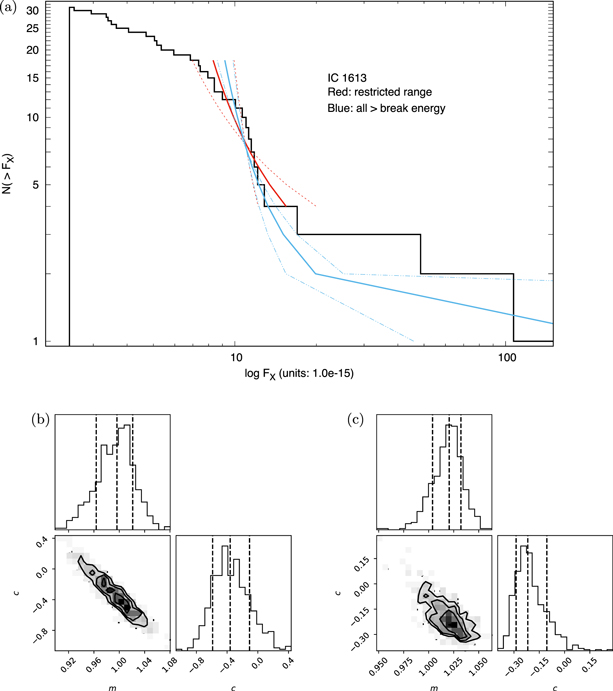
Figure 10. (a) Fitted log N–log S distribution for the point sources in IC 1613. The black stepped line represents the data. The text discusses the break point energy near 10−14 erg s−1 cm−2. The thick red line is the fit above the break energy, but ignoring the three most luminous sources. The thick blue line includes all sources above the break energy. The thinner dashed lines represent the 16% and 84% uncertainty range on the fit parameters, and were generated by building a distribution based on the fit + uncertainty and fit—uncertainty values. This explains why the uncertainties appear to form an "X" on the fitted slope. See Section 6 for further discussion. (b) The corner plots for the log N–log S distribution: (b) the restricted range (left); (c) all points above the break energy (right).
Download figure:
Standard image High-resolution imageWe also fit the distribution twice: once for sources above the break point but below the "high luminosity" tail, and once for all sources above the break point. Figure 10 shows the results with the flux plotted in units of 10−15 erg s − 1 cm−2. If we model the distribution as a power law, we obtain a value for the power-law index of  for the restricted range fit (red lines in Figure 10) and
  for the fit to all points above the break energy (blue lines) where the uncertainties are the 16% and 84% range as determined from the MCMC "walker" distribution. As a test, if we drop the faintest three objects, the fitted slope becomes
  . The largest change occurs with the inclusion of the two or three most luminous sources in IC 1613.
These values are consistent with those of Ott et al. (2005) in their study of dwarf starburst galaxies for which they obtained an index of − 0.24 ± 0.06. The galaxies in the Ott et al. study are very rough stand-ins for IC 1613-like galaxies: metallicity values, for example, for about half of the galaxies are 10x or more subsolar, but the metallicity for IC 1613 is 50–100x subsolar (0.001, Hashemi et al. 2019).
Most of the luminosity distribution studies done to date have not only focused on more massive galaxies, but have also focused on the high-mass X-ray binaries (HMXB) portion of the X-ray binary distribution (Lehmer et al. 2021). None of the sources in IC 1613 may be described as HMXBs, unless all of them were in a low state at the time of the observation. That seems unlikely. The absence of HMXBs suggests the absence of recent star formation. Hashemi et al. (2019) argue that IC 1613 has not undergone significant star formation over the past ∼5 Gyr, after investigating a variety of rates as a function of differing metallicities as well as radially differing rates. Regardless, the X-ray log N–log S and the star formation history appear to agree, suggesting that it seems likely that the X-ray point sources in IC 1613 are Be-XRBs or low-mass XRBs (LMXBs).
Differences between the slopes of the luminosity functions of the different galaxies may be reconciled by applying corrections for star formation rates. This result was demonstrated by Grimm et al. (2003), who aligned seemingly discrepant luminosity functions after applying corrections for star formation rates in these galaxies. In the case of IC 1613, such a correction is small (≈few × 10−4 M⊙ yr−1 kpc−2, per Hashemi et al. 2019).
7. Diffuse Emission
The original motivation for the observation of IC 1613 centered on the possibility of detecting the extensive bubble in the northeast quadrant of the galaxy. The preliminary estimate of possible emission ranged over ≈1034−37 erg s−1 and was based on the 30 Doradus emission region corrected for the differing distances (Wang 1999).
Given that we do not readily detect any emission, we then must work through a careful procedure to compare possible emission against a blank sky observation. We proceed as follows: (i) copy the blank-sky data from the Chandra archive and reproject it into the IC 1613 reference frame; (ii) extract from the IC 1613 data the particle background (PB) data in the 11.5–13 keV range; (iii) repeat for the blank-sky PB and compare the rates, generating a correction factor; (iv) filter both data sets for energies 0.4–7 keV; (v) extract spectra from the northeast quadrant of both data sets; (vi) correct the blank-sky background spectrum by the correction factor; (vii) compare the IC 1613 northeast quadrant spectrum to the corrected blank-sky spectrum and note whether systematic differences exist. Emission in the northeast quadrant greater than the blank-sky spectrum is an indication of diffuse emission in that quadrant.
We find that the blank-sky PB must be scaled by ≈0.693 to match the IC 1613 PB. Figure 11 shows the result. Given that the slight difference could represent a detection, we remind the reader that the difference has been integrated over the extraction region (∼ in radius). With a statistical uncertainty in the background plus possible low-luminosity background sources that lie below the limiting sensitivity of the instrument, we conclude that we have not detected any diffuse emission from IC 1613.
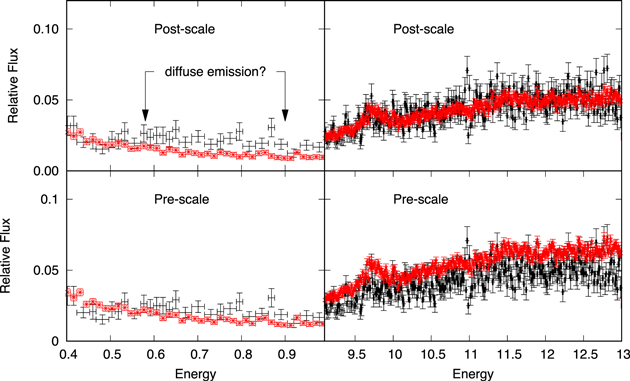
Figure 11. Extracted X-ray spectra (black points) in a low-energy band (left half) where diffuse emission should dominate, and in a high-energy band (right half) where the particle background dominates (red points). The bottom row presents the raw data, while the top row shows the data after scaling. All spectra were extracted using the same region in the northeast quadrant of the IC 1613 observation and the blank-sky background reprojected to the IC 1613 coordinates. The rescaled, upper left plot shows the final result: a small difference (between the arrows) in the low-energy band that may represent weak, diffuse emission. We arrived at that plot starting with the lower row. The reprojected, prescale, high-energy blank-sky points (lower right) must then be multiplied by 0.69 to match the 11.5–13 keV count rates—this rescaling lowers the red points to match the black ones in that band and is shown in the upper right. We then apply the same correction to the prescale, low-energy band (lower left) to obtain our final result (upper left). See Section 7 for a discussion.
Download figure:
Standard image High-resolution imageWe assign an upper limit by fitting the extracted spectrum of the IC 1613 region, then increasing the normalization until it exceeds the blank-sky spectrum by 90%. That leads to an upper limit of ≈8 × 1035 erg s−1 at the distance to IC 1613 and integrated over the extraction region. Using the extraction region leads to an upper limit on the surface brightness of ≈1030 erg s−1 pc−2 for the complex, approximately 50–100 times lower than Carina (Townsley et al. 2011).
Does that upper limit number make sense? The 30 Doradus region exhibits a broad range of luminosities given the number of point sources, supernova remnants, and diffuse emission in the region. Townsley et al. (2006) measure the 0.5–2 keV diffuse X-ray surface brightness to be 3–126 × 1031 erg s−1 pc−2, or a total luminosity integrated over the entire 30 Dor complex of ∼8–325 × 1036 erg s−1. At the distance of IC 1613, 30 Doradus would exhibit a flux of ≈1–51 × 10−13 erg s−1 pc−2. Let us focus on the lower value—in our 50 ks exposure, that flux would generate ≈550 counts, easily detected with our Chandra observation. At best, the northeast complex in IC 1613 generates a factor of ≈10 less flux than 30 Dor, which matches our estimated upper limit based on the surface brightness. The proper approach would count massive OB stars to estimate or measure the resulting X-ray emission. However, the comparison with local star-forming regions encounters the high obscuration typically present, rendering a census considerably uncertain.
8. Detected Sources Not Associated with IC 1613
As we mentioned earlier, we detect three sources that are definitely not associated with IC 1613. We describe those sources here.
8.1. The Galaxy Cluster MCXC J0105.0 + 0201 = ACT-CL J0105.0 + 0201
The cluster of galaxies MCXC J0105.0 + 0201 (hereafter, J0105; Piffaretti et al. 2011), at a redshift of 0.197, is visible through the southern portion of IC 1613. The cluster is indicated by a green circle in Figure 1 (the middle green circle). In Figure 2, the cluster is positioned between X-ray sources 18 and 28 and straddles the boundary between CCDs 7 and 8 (marked "C"). It is source 33 in Table 2.
We extracted the events using two rectangular regions, one for the source and one for the background. The spectral extraction was carried out twice, once for each portion of the cluster on the two CCDs. Response matrices and effective area files were constructed for each CCD. We fit the resulting four files simultaneously using an absorbed thermal bremsstrahlung model for the source and a power-law model for the background. Model parameters were forced to vary together, with the sole exception of the component norms (Table 10). Note that the adopted model does not include an abundance variable.
The raw spectra of J0105 both peak near 1 keV, while the background components are generally sloped from low- to high-energy (Figure 12). The cluster spectrum merges with the background near ∼4–5 keV. We obtained a temperature of ∼1.4 keV and a column density of ∼0.14 × 1022 cm−2. The model norms yielded a 0.3–8 keV flux of ∼6.7 × 10⁻¹⁴ erg cm−2 s−1 (CCD7) and 1.7 × 10⁻¹³ erg cm−2 s−1 (CCD8), and unfolded fluxes of ∼1.2 × 10⁻¹³ and ∼2.5 × 10⁻¹³ erg cm−2 s−1, respectively. Summing these values yields a total, unabsorbed flux of ∼3.7 × 10⁻¹³ erg cm−2 s−1 and a total, 0.3–8 keV, unabsorbed luminosity of ∼4.4 × 1043 erg s−1, assuming the redshift of ∼0.2 is precise and corresponds to the luminosity distance of 1000 Mpc.

Figure 12. (a) Extracted spectrum of the galaxy cluster showing the best-fit model. The fit and contours in (b) were obtained from a simultaneous fit of the north and south spectra; the spectra were added solely for plotting purposes. (b) Confidence contours for the parameters NH and kTbrems for the cluster.
Download figure:
Standard image High-resolution image
An optically thin thermal gas model (apec; Foster et al. 2010) yielded a slightly higher temperature of 1.5 keV, but within the uncertainties, both temperatures are identical. The column density is 50% higher, but again, within the uncertainties, the fitted columns are identical. Only an upper limit of 0.14 could be assigned to the abundances.
Based on the XMM-Newton survey of clusters in the COSMOS field, Finoguenov et al. (2007) plot the cluster luminosity versus redshift, with bands representing the ∼10x range in luminosity. Most of the clusters in the survey field lie near a curve of increasing luminosity with increasing redshift. On that plot, J0105 would lie on the high side of the trend for its redshift. To fall within the trend of other clusters at a redshift of 0.2, the luminosity of J0105 would need to be about 5–10x lower. We acknowledge that our flux estimate could be incorrect, given that the flux was estimated by summing over portions of the cluster spread not only over two CCDs, but also over the gap between those CCDs. We do not think, however, that our estimate is incorrect by such a large factor.
8.2. Foreground Star: Source 34: CXO J010516.1 + 015911.7 = GT Cet
Lozinskaya et al. (1998) mentioned that a ROSAT HRI source corresponded to a mag mv 11.4 star. Our coordinates are essentially identical to those of Lozinskaya et al. (1998), impressive given that the star lies on CCD 8, about 12' from the aimpoint (the southernmost green circle in Figure 1). The variable star GT Cet lies within 3'' of the coordinates, based on the SIMBAD database (Wenger et al. 2000), with no other object within 50''. GT Cet has been labeled a classical Cepheid (δ Cep type; Kazarovets et al. 2011).
8.3. Unknown Source
Source 32 appears to lie outside of IC 1613 (the northernmost green circle in Figure 1). It falls very near or into the chip gap at the north edge of CCD 6. It does not exhibit a counterpart at UV wavelengths. The archive-available optical and IR data are unusable because diffraction spikes from HD 6375, a star of mag 1.7, cover its location. At present, the only information that appears to be available about this source is its color–color location (Figure 6(c)). It exhibits an upper limit in the hard band, hence it is a medium-soft to soft source. It is the leftmost point in the figure. Based on the color–color values, the source is likely a foreground star, but not an extremely bright one.
9. Discussion
IC 1613 is of interest for several reasons: it is a nearby dwarf galaxy; its star formation rate indicates no significant formation over the past ∼5 Gyr (Hashemi et al. 2019; Tolstoy et al. 2009); and it has a low metallicity. With its metallicity values of 0.001 (Dolphin et al. 2001) to 0.003 (Tautvaisiene et al. 2007), approximately comparable to the SMC, IC 1613 becomes a potential local stand-in for objects at high redshift.
The proximity certainly means the X-ray-detected sources can be identified. In this paper, we have made a first foray into the identification of the sources, and much of a traditional "discussion section" has been covered in the earlier sections discussing source properties. To make additional progress, we need deeper observations with high spatial resolution to identify counterparts to the X-ray sources and spectroscopic observations to verify the identifications. We would expect many of the local IC 1613 sources to be X-ray binaries.
X-ray binaries are important to study in their own right. However, recent cosmological simulations demonstrate that X-ray binaries may be responsible for ionization of the early Universe (e.g., Bluem et al. 2019). The early universe will have low metallicity, so the study of local X-ray binaries in low-Z conditions gains in importance. We have cross-identified to the degree possible the detected X-ray sources with infrared and radio observations. More work remains to be done: characterization of the individual sources, particularly to separate background X-ray sources (e.g., AGN and galaxies) from the X-ray-emitting sources that are part of IC 1613; monitoring of the sources to detect variability; and studies of the surroundings to detect possible star cluster membership.
10. Summary
The conclusions of this paper may be summarized as follows: a 50 ks Chandra observation of the dwarf irregular galaxy IC 1613 detects 30 point sources, the natures of which are generally unknown. The sources that are part of the galaxy could be low-luminosity X-ray binaries. Several sources must be background AGN and there are several specific objects that could be AGN candidates. The original justification for the observation, the detection of hot gas in the region of star formation in the northeast quadrant of IC 1613, leads to a probable upper limit on the presence of diffuse emission in IC 1613.
This research made use of NASA's Astrophysics Data System as well as the NASA Extragalactic Database, which is operated by the Jet Propulsion Laboratory, California Institute of Technology, under contract with the National Aeronautics and Space Administration.
This research has also made use of data obtained from the High Energy Astrophysics Science Archive Research Center (HEASARC), provided by NASA's Goddard Space Flight Center.
This work is based [in part] on observations made with the Spitzer Space Telescope, operated by the Jet Propulsion Laboratory, California Institute of Technology under a contract with NASA.
This publication also makes use of data from the Wide-field Infrared Survey Explorer, a joint project of the University of California, Los Angeles, and the Jet Propulsion Laboratory/California Institute of Technology, funded by the National Aeronautics and Space Administration.
This work was partially supported by Chandra Grant GO3-4104Z and the Vaughan Family fund at UTSA.
Facilities: CXO(ACIS) - Chandra X-ray Observatory satellite, VLA - .
Software: CIAO v4.9; (Fruscione et al. 2006), MARX (Davis et al. 2012), AIPS (van Moorsel et al. 1996); zeus MCMC code (Karamanis et al. 2021) and the CornerPlot module A. Williams (github.com/anguswilliams91/CornerPlot).
Footnotes
- 7
NED = NASA Extragalactic Database.
- 8
WebPIMMS, available at http://heasarc.gsfc.nasa.gov/docs/tools.html.
- 9
We do not consider resolved sources here, as there is only one within IC 1613—the SNR (Schlegel et al. 2019).
- 10
Two VLA observations, at 1.45 and 4.86 GHz, on 1984 Oct 21 in B configuration for 0.11 hr each. Resulting angular resolutions of 0
7 × 04 (1.45 GHz) and 49 × 48 (4.86 GHz) and sensitivities of 40 and 70 μJy, respectively. - 11