


Abstract
We observed short-period comet 252P/LINEAR post-perihelion during its 2016 passage, which presented a favorable opportunity to survey its chemical composition at a close Earth approach (∼0.14 au). We characterized the comet's chemical composition on four dates (UT 2016 April 12, 19, 26, and 29) using spectroscopic measurements with the Near-infrared Spectrograph (NIRSPEC) at the Keck Observatory on Maunakea, HI. Our high-resolution infrared spectra yielded production rates for four species (H2O, CH3OH, C2H6, and HCN) and upper limits for five species (NH3, H2CO, C2H2, CO, and CH4). We measured water at an average production rate of 4.9 ± 0.1 × 1027 molec s−1. The chemical properties of 252P suggest a rather typical composition, yet somewhat enriched in methanol and ethane but low in formaldehyde (upper limit) compared to other short-period comets surveyed at infrared wavelengths. Analysis of the ortho/para ratio in water indicates a nuclear spin temperature larger than ∼38 K, consistent with statistical equilibrium (2σ). Spatial distributions of gases, which are representative of possible heterogeneity in the nucleus and/or gas dynamics upon sublimation, showed rather symmetric profiles, with subtle enhancements of the more volatile species C2H6 and HCN toward the sunward hemisphere, while water showed spatial distributions that were extended toward the anti-sunward hemisphere. The continuum was characterized by a narrow distribution. We place our infrared results in the context of observations with the Discovery Channel Telescope, the James Clerk Maxwell submillimeter Telescope, and the Hubble Space Telescope.
Export citation and abstract BibTeX RIS
1. Introduction
Comets are remnants of our early solar system, whose icy nuclei contain the building blocks from the natal environment where planets and moons eventually formed the planetary system we know today. Since these early times, comets have remained in two distant reservoirs: the Kuiper Belt (source of Jupiter family comets, JFCs, aka ecliptic comets) and the Oort cloud (source of nearly isotropic Oort cloud comets, OCCs). Every so often, however, gravitational forces perturb comets into trajectories through the inner solar system.
As these primordial bodies come sufficiently close to the Sun, solar radiation triggers the release of gas and dust, allowing techniques such as high-resolution spectroscopy to analyze the molecular species released from their icy nucleus. These molecular signatures contain clues to different physical processes that took place during the early evolutionary states of the solar system (e.g., Mandt et al. 2015), as well as hints to the role comets played in the alteration of planets (such as the potential delivery of organic compounds and water to Earth; Mumma & Charnley 2011). As the knowledge of cometary composition expands, it is critically important to understand the chemical properties of comets from these different reservoirs. At present, the chemical taxonomy of comets at infrared (IR) wavelengths encompasses ∼40–50 comets, with JFCs accounting for less than half the total (Mumma & Charnley 2011; Dello Russo et al. 2016). JFCs are thus a known underrepresented population in the IR catalog of comets, due to their (typically) lower activity and corresponding detection constraints, so their characterization is strongly needed to better understand this cometary population—and comets as a whole.
In early 2016, comet 252P/LINEAR (hereafter 252P) presented ground and space telescopes with a prime opportunity to observe a JFC at close range. In fact, 252P made one of the closest approaches to Earth, reaching a minimum geocentric distance of ∼0.04 au (about 14 lunar distances) on 2016 March 21. The Hubble Space Telescope characterized a relatively small nucleus (of ∼0.6 km diameter) and a narrow, sunward jet rotating with a periodicity of 7.24 hr in 2016 April (Li et al. 2017). Yet, comet 252P was likely in a nonprincipal axis rotation, as suggested by measurements of the photometric light curve by Li et al. indicating a periodicity of 5.41 hr. The calculations of dust production by Ye et al. (2016) and observations of millimeter-sized dust production by Coulson et al. (2017) suggested that 252P's activity was significantly higher in 2016 compared to previous apparitions,3 and had a rather gas-rich (dust-poor) coma.
In this paper, we present results describing a chemical survey of primary volatiles in 252P based on ground-based IR observations in 2016 April (post-perihelion). We found that 252P had unusual production of methanol and ethane relative to other comets, posing intriguing questions related to the origin and possible chemical/physical mechanisms that shaped 252P throughout its history. What could abundant methanol and ethane tell us about primordial conditions during formation? How representative are these chemical abundances to the true nuclear composition of 252P? Could a possible transient jet release distinct (intact) material from the nucleus? Our results provide constraints to these questions, so we organize this paper as follows. Section 2 provides details of our IR observations, their data reduction and analysis. We report rotational temperatures, production rates, and molecular abundances in Sections 3.1–3.2. Section 3.3 presents 2D spatial profiles of four volatiles (H2O, CH3OH, C2H6, and HCN) and the continuum, and Section 3.4 describes the ortho-para ratio (OPR) in water and a brief description of its significance. We discuss the chemical characteristics of comet 252P in context of previous observations of JFCs in Section 4, with a focus on the enhancements in methanol and ethane. Section 5 provides a summary of our results.
2. Observations and Data Reduction
We observed 252P on UT 2016 April 12, 19, 26, and 29 from the 10 m Keck Observatory, located at Maunakea, Hawaii, using the Near-infrared Spectrograph (NIRSPEC)—a high spectral resolution (λ/Δλ ∼ 25,000) cross-dispersed echelle grating spectrograph, featuring a 24'' entrance slit. NIRSPEC was equipped with a 1024 × 1024 InSb array detector with 0 144 × 0198 (spectral × spatial) pixel dimensions (McLean et al. 1998), permitting the simultaneous measurement of multiple primary volatiles thanks to its cross-dispersed capabilities. We used four spectral settings (KL1a/b, KL2, and MW) on the comet with a slit size of 0432 × 24'', the following echelle/cross-dispersion characteristics: KL1a: 63.50/32.50, KL1b: 64.11/32.50, KL2: 61.80/32.72, and MW: 60.73/36.90. The individual spectral orders of each setting covered ∼40 cm−1 and targeted specific volatile species. KL1 and KL2 targeted H2O, OH*, C2H6, HCN, CH3OH, CH4, H2CO, C2H2, and NH3, while the MW setting targeted H2O, OH*, and CO. Flux calibration was obtained through observations of standard star BS-3982 using the 0720 × 24'' slit configuration. The minimum geocentric distance of the comet during our campaign was ∼0.14 au on 2016 April 12. A list of observation parameters is provided in Table 1.
Table 1. Log of Observations
| Date (UT 2016) | Rh (au) | Rh-dot (km s−1) | Δ (au) | Δ-dot (km s−1) | PsAng (°) | PsAMV (°) | θ (°) | Slit P.A. (°) | Setting | UT | Tint (minutes) |
|---|---|---|---|---|---|---|---|---|---|---|---|
| Apr 12 | 1.07 | 8.8 | 0.14 | 9.4 | 258.8 | 304.4 | 56.4 | 79.1 | KL1a | 9:47–10:06 | 12 |
| Apr 19 | 1.11 | 10.4 | 0.18 | 9.6 | 252.3 | 302.8 | 49.3 | 49.4 | MW | 9:42–10:03 | 12 |
| KL1b | 10:06–10:22 | 12 | |||||||||
| Apr 26 | 1.16 | 11.7 | 0.22 | 9.8 | 245.2 | 299.5 | 42.6 | 42.7 | KL1b | 9:44–10:06 | 16 |
| KL2 | 10:08–10:18 | 8 | |||||||||
| Apr 29 | 1.18 | 12.2 | 0.23 | 10.0 | 241.9 | 297.9 | 39.9 | 39.5 | KL2 | 9:25–09:58 | 24 |
| MW | 10:01–10:20 | 9 |
Note. Rh: heliocentric distance; Rh-dot: heliocentric velocity; Δ: geocentric distance; Δ-dot: geocentric velocity; PsAng: position angle of the extended Sun–comet vector; θ: phase angle (Sun–observer–comet); Slit P.A.: position angle of the slit (with respect to north); PsAMV: the negative of the comet's heliocentric velocity vector as seen in the observer's plane-of-sky. (Source: https://ssd.jpl.nasa.gov/horizons.cgi; these values represent the mid-point of data acquisition for each night).
Download table as: ASCIITypeset image
The cometary observations followed a standard four-step sequence "ABBA" with an integration time of 60 s/step or 20 s/step (depending on atmospheric conditions), nodding the telescope by 12'' between the A and B positions. The operation (A1–B1–B2+A2) canceled the thermal background emission and sky line emission from the Earth's atmosphere. Individual frames were flat-fielded to correct for pixel-to-pixel differences in sensitivity and dark-subtracted to eliminate dark current signal. We then applied a series of pixel masks to eliminate high-dark current pixels. Each order from stacked ABBA sets was then cropped, spatially and spectrally registered, and flux calibrated using our IR standard star observations. To obtain spectra, we integrated the flux over nine rows of pixels centered on peak comet continuum intensity (i.e., the nucleus). A synthetic model of the atmosphere was normalized to and subtracted from the cometary continuum signal to remove terrestrial absorption features. For a detailed account of this observing procedure, we refer the reader to Bonev (2005).
Identification of target species was performed through least-square fitting of the spectra using custom fluorescence models: H2O (Villanueva et al. 2012b), OH* (Bonev et al. 2006), C2H6 (Villanueva et al. 2011b), CH4 and C2H2 (Gibb et al. 2003; Villanueva et al. 2011a), NH3, HCN (Lippi et al. 2013; Villanueva et al. 2013), H2CO (DiSanti et al. 2006), CO (Paganini et al. 2013), and CH3OH (Villanueva et al. 2012a; DiSanti et al. 2013). Nucleus-centered production rates were derived using

where Δ is the geocentric distance of the comet, Fline is the flux at the top of the atmosphere—including correction for transmittance at the Doppler-shifted position of the line, τ is the photodissociation lifetime for a given species, gi is the fluorescence efficiency of the molecule, and f (x) the expected fraction of molecules within the slit's aperture. In our calculations we adopt a spherically symmetric gas outflow velocity of  km s−1 (Rh is the heliocentric distance, astronomical unit).
The final (global) production rate Qtotal is the product of Qnuc and a growth factor (GF; assuming a symmetric outflow at uniform velocity). The GF is the ratio of Qterm/Qnuc, where Qterm is measured at the distance from the nucleus where production rates reach a terminal value, and is required to correct for the loss of cometary signal during observations due to atmospheric seeing (disturbances in the signal) and aperture effects (Xie & Mumma 1996; Mumma et al. 2003).
3. Results
3.1. Rotational Temperature
Accurate production rates for each molecular species require reliable estimates of a rotational temperature. To obtain a rotational temperature, we compare modeled and observed line fluxes spanning a sufficient range of rotational energies. The modeled spectral line intensities are derived from our custom quantum mechanical fluorescence models, which provide fluorescence efficiencies (g-factors) at the specified rotational temperature. The test temperature is modified in 1 K increments until a satisfactory fit is obtained, and then the optimum value for Trot (and its 1σ uncertainty) is used to derive robust measurements of production rates.
During our observational campaign, we obtained rotational temperatures for four molecules (H2O, CH3OH, C2H6, and HCN). For the species whose rotational temperatures could not be determined (e.g., due to insufficient spectral lines, restricted energy range, and/or poor signal-to-noise ratio, S/N), we adopted a rotational temperature based on values extracted for other simultaneously observed molecules. All derived rotational temperatures were consistent on each date (within 1σ; see Table 2), suggesting a common temperature among species in the inner coma, as we generally find for most comets in our IR survey.
Table 2. Measurements of Molecular Composition in Comet 252P/LINEARa
| Date | Molecule | Setting/Order | νcenterb | Lines | Trotc (K) | GF | Qtotald (1024 molec s−1) | Abundancee (% H2O) |
|---|---|---|---|---|---|---|---|---|
| Apr 12 | H2O | KL1a/26+27 | 3434.33 | 11 |

|
2.46 ± 0.08 | 4960 ± 200 | 100 |
| CH3OH | KL1a/22 | 2858.94 | 12 |

|
2.23 ± 0.27 | 229 ± 33 | 4.61 ± 0.68 | |
| C2H6 | KL1a/23 | 2991.81 | 6 |

|
2.16 ± 0.07 | 52 ± 2 | 1.06 ± 0.06 | |
| Apr 19 | H2O | KL1b/26+27 | 3463.31 | 9 |

|
2.49 ± 0.13 | 5470 ± 330 | 100 |
| CH3OH | KL1b/22 | 2853.99 | 14 |

|
1.86 ± 0.17 | 253 ± 24 | 4.62 ± 0.48 | |
| C2H6 | KL1b/23 | 2990.15 | 7 |

|
1.61 ± 0.08 | 46 ± 2 | 0.84 ± 0.05 | |
| CO | MW/16 | 2143.14 | 8 | (72) | (1.61 ± 0.08) | <242 | <4.43 | |
| Apr 26 | H2O | KL1b/26+27 | 3465.11 | 9 |

|
2.16 ± 0.09 | 4560 ± 220 | 100 |
| CH3OH | KL1b/22 | 2852.76 | 17 |

|
1.68 ± 0.18 | 254 ± 28 | 5.56 ± 0.66 | |
| C2H6 | KL1b/23 | 2990.14 | 7 |

|
1.47 ± 0.06 | 46 ± 2 | 1.01 ± 0.07 | |
| HCN | KL2/25 | 3309.30 | 6 |

|
1.52 ± 0.12 | 11 ± 1 | 0.25 ± 0.03 | |
| CH4 | KL2/23 | 3033.62 | 2 | (76) | (1.47 ± 0.06) | <179 | <3.92 | |
| NH3 | KL2/25 | 3323.12 | 8 | (76) | (1.46 ± 0.06) | <35 | <0.77 | |
| H2CO | KL2/21 | 2783.27 | 23 | (76) | (1.47 ± 0.06) | <8 | <0.18 | |
| C2H2 | KL2/25 | 3306.00 | 16 | (76) | (1.47 ± 0.06) | <5 | <0.10 | |
| Apr 29 | H2O | KL2/26 | 3454.72 | 9 |

|
1.74 ± 0.13 | 4380 ± 430 | 100 |
| HCN | KL2/25 | 3303.54 | 5 |

|
1.56 ± 0.11 | 9 ± 1 | 0.21 ± 0.03 | |
| CO | MW/16 | 2143.15 | 8 | (77) | (1.56 ± 0.11) | <236 | <5.40 | |
| CH4 | KL2/23 | 3033.63 | 2 | (77) | (1.56 ± 0.11) | <181 | <4.13 | |
| NH3 | KL2/25 | 3324.66 | 9 | (77) | (1.56 ± 0.11) | <30 | <0.67 | |
| H2CO | KL2/21 | 2782.15 | 20 | (77) | (1.56 ± 0.11) | <6 | <0.13 | |
| C2H2 | KL2/25 | 3304.84 | 14 | (77) | (1.56 ± 0.11) | <3 | <0.08 |
Notes.
aAll dates listed are UT. Uncertainties represent 1σ and upper limits represent 3σ. The reported errors in production rates include the line-by-line scatter in measured column densities, along with photon noise, systematic uncertainty in the removal of the cometary continuum, and uncertainties in retrieval models. bCenter wavenumber of all emission lines (used for this reduction) from a particular species. cValues enclosed in parenthesis indicate species whose rotational temperature could not be determined. For these calculations, we used rotational temperatures derived for water on that date. dGlobal production rate, after applying a measured growth factor to compensate for slit losses. eDetermination of abundance uses water retrieval from KL1 or KL2 settings (shown at 100% for each date).Download table as: ASCIITypeset image
3.2. Production Rates and Molecular Abundances
The retrieval of accurate rotational temperatures yielded production rates for four species (H2O, CH3OH, C2H6, and HCN) and upper limits for five species (NH3, H2CO, C2H2, CO, and CH4). A summary of production rates and abundances from our chemical survey is given in Table 2.
Water emission lines were detected across the entire observation campaign, yielding a weighted mean water production rate (4.9 ± 0.1 × 1027 molec s−1). The water output was measured using emission lines from orders 26 and 27 in the KL1 setting and from order 26 in the KL2 setting, using both ortho and para H2O species (also see Section 3.4 for an OPR analysis). In addition to water measurements, we quantified the output and abundances for a suite of trace gases routinely observed in cometary comae (Figure 1). Our average methanol abundance (relative to water) was 4.87 ± 0.34%, based on emissions in order 22 of the KL1 setting from April 12, 19, and 26, thus representing the most abundant detected organic after water. Methanol is then followed by ethane with an average abundance of 0.95 ± 0.04% and hydrogen cyanide of 0.23 ± 0.02% (relative to H2O). The mean ethane mixing ratio is based on secure detections from order 23 in the KL1 setting on April 12, 19, and 26, while HCN was seen in order 25 in the KL2 setting on April 26 and 29. We also obtained upper limits for NH3 (<0.67%, order 25 in KL2), H2CO (<0.13%, order 21 in KL2), and C2H2 (<0.08%, order 25 in KL2). Regarding the hypervolatiles, we derived upper limits for CO (<4.43%, from order 16 in MW) and CH4 (<3.92%, order 23 in KL2).
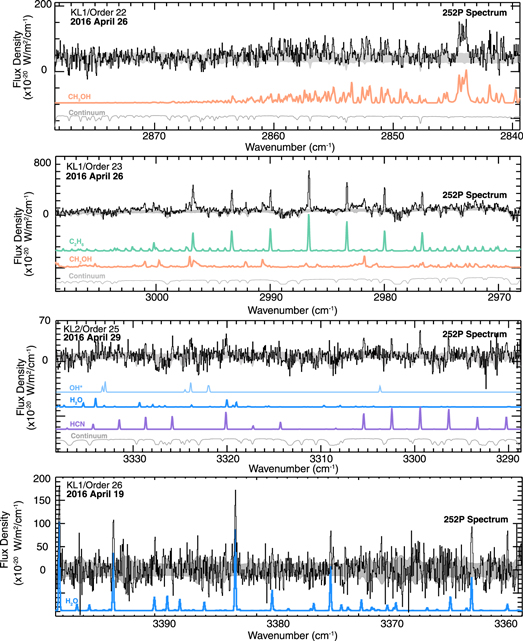
Figure 1. Detection of volatiles in comet 252P. High-resolution IR spectra yielded production rates for four species (H2O, CH3OH, C2H6, and HCN) and upper limits for five species (NH3, H2CO, C2H2, CO, and CH4). The measurement of these molecules was obtained by least-square fitting of 252P's spectra using fluorescence models (in colors, shifted for clarity). The 1σ noise envelope is shaded in gray. The (weak) continuum was subtracted from the spectrum in the bottom panel (KL1/Order 26). For results and details, see Table 2 and Section 3.2.
Download figure:
Standard image High-resolution imageAt optical wavelengths, Li et al. (2017) obtained production rates for water ([5.8 ± 0.1] × 1027 molec s−1, based on observations of OH) and CN ([1.25 ± 0.01] × 1025 molec s−1) on April 17. At submillimeter wavelengths, Coulson et al. (2017) obtained rates for CH3OH (7.1 × 1026 molec s−1), HCN (6.4 × 1024 molec s−1), and H2CO ([3.9–46] × 1024 molec s−1, depending on the assumed parent scale lengths) between March 27 and April 2.
Compared to observations at optical wavelengths, our water production rate of [5.5 ± 0.3] × 1027 molec s−1 on April 19 is comparable to that estimated from the observations of OH from Li et al. on April 17. Regarded as a main product species from HCN dissociation (e.g., Paganini et al. 2010), the production rate of CN ([1.25 ± 0.01] × 1025 molec s−1) on April 17 (with the Discovery Channel Telescope, DCT) agrees with our results on HCN output ([1.1 ± 0.1] × 1025 molec s−1) on April 26, thus supporting the view of HCN as the principal source of CN in this comet.
We note a larger separation between IR and radio observations (>9 days), thus limiting a direct comparison between these results. Taking the latter into account, we observe a factor of ∼3 lower outputs of CH3OH for IR compared with radio measurements ([2–3] × 1026 molec s−1 versus 7 × 1026 molec s−1), but a factor of ∼2 larger outputs of HCN for IR compared with radio measurements (1 ×1025 molec s−1 versus 0.6 × 1025 molec s−1), possibly suggesting different phases of CH3OH and HCN in the nucleus. However, the different beam sizes of radio and IR telescopes and the different dates of the observations make the comparison somewhat uncertain. Although not constraining, our most sensitive upper limit for H2CO (<6 × 1024 molec s−1) on April 29 is consistent with the parent (or primary) formaldehyde measurements (3.9 × 1024 molec s−1) obtained at radio wavelengths.
3.3. Spatial Profiles
Figure 2 shows spatial profiles for H2O, CH3OH, C2H6, HCN, and the continuum. On 2016 April 12, we oriented the slit along the Sun–comet direction at a position angle (slit P.A.) of ∼79°, while subsequent observations used a more northern position relative to the Sun–comet direction, with slit P.As. of ∼49°, ∼43°, and ∼40° on April 19, 26, and 29, respectively.
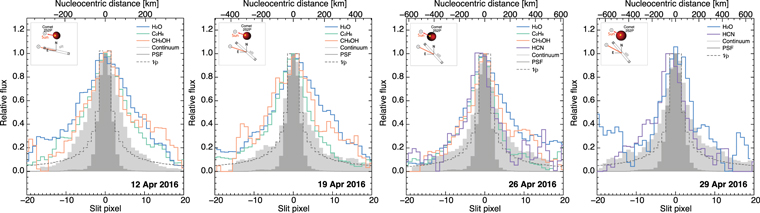
Figure 2. Spatial profiles of primary volatiles observed in comet 252P/LINEAR. The dark shaded region represents the point-spread function (PSF), which illustrates the response of the instrument to a point source (i.e., the nucleus). The light shaded area is the continuum profile. The dotted line represents a 1/ρ decay rate expected for a species that is released from the nucleus, where ρ is the nucleocentric distance. The inset found in each panel illustrates the Sun–comet vector and positioning of the slit. Profiles for the April 12, 19, and 26 data were extracted using the KL1 setting, while profiles for observation on April 29 were extracted using the KL2 setting. From left to right, one spatial slit pixel corresponds to 19, 25, 31, and 34 km, respectively.
Download figure:
Standard image High-resolution imageThe spatial profiles for H2O, CH3OH, C2H6, and HCN were fairly symmetric on all dates, with subtle enhancements that we describe next. On April 12, spatial profiles showed rather extended profiles for three gases (H2O, CH3OH, C2H6) relative to the continuum and a slightly more extended profile for water than for CH3OH and C2H6. On April 19, we observed slight enhancements of water in the anti-sunward hemisphere, while the more volatile species ethane had slight enhancements toward the sunward hemisphere, relative to their distribution in the opposite hemisphere. HCN and CH3OH differed significantly in the anti-solar direction, with HCN being strongly enhanced in the sunward direction. A similar morphology was observed on April 26, but with slight enhancements of ethane (and HCN) toward the sunward hemisphere, while water was extended toward the anti-sunward hemisphere. On April 29, water showed a similar symmetric configuration, yet with a less extended profile compared to previous dates. HCN showed a rather asymmetric configuration with enhancements toward the sunward hemisphere (similar to C2H6 and HCN on previous dates) and peak emission intensity extended out to ∼100 km from the nucleus, probably related to extended sources near the nucleus (e.g., icy grains).
In summary, gases showed rather symmetric profiles, with subtle enhancements of the more volatile species C2H6 and HCN toward the sunward hemisphere, while water showed spatial distributions that were somewhat extended toward the anti-sunward hemisphere. The growth factors for H2O exceed those for CH3OH and C2H6 on April 12, 19, and 26 (Table 2)—a possible indication of a distinct phase of water-rich icy grains. Regarding the continuum emission (resulting from reflected sunlight and thermal emission from micron-size particles), it is apparent that the continuum profile of 252P was less extended than the volatile emission during our survey. In particular, the rather extended water profiles agree with the view of possible icy grains in the coma of 252P (see Coulson et al. 2017; Li et al. 2017), perhaps resulting from enhanced activity driven by the abundant ethane and/or methanol.
Our IR spatial profile of H2O on April 19 shows similar (broad) distributions compared to OH images obtained with DCT on April 17 (see Figure 3 in Li et al. 2017), with slight enhancements toward the southwest. Similarly, but with opposite configuration, we note enhanced CN toward the northeast in the DCT data on April 17, similar to our HCN profiles on April 26. While not conclusive, considering the similar production rates of HCN and CN (see Section 3.2), the similar distributions of HCN and CN support the view of HCN as the principal source of CN. Furthermore, the narrow continuum (using the BC and RC filters) is in agreement with the narrower continuum (compared to gases) observed in our IR observations. A low dust profile is consistent with the observations by Coulson et al. (2017), who reported a dust-to-gas ratio (concerning millimeter-sized grains) of just 0.025, which is among the lowest ever observed for a comet. Despite such a low dust-to-gas ratio, 252P's gas activity in 2016 was much higher compared to past apparitions.
3.4. Ortho-to-para Ratio and Nuclear Spin Temperature of H2O
Molecules with symmetric hydrogen atoms in their structure (e.g., H2O and H2CO) are quantized by the total nuclear spin angular momentum, which depends on the relative orientation of the proton spins. Essentially, these species indicate the molecular spin of the hydrogen atoms, being parallel (ortho) or anti-parallel (para). The abundance of these spins is contingent upon the temperature when the molecule was last equilibrated (Bockelée-Morvan et al. 2004) and these spin properties are thought to be unmodified by inelastic collisions or radiative processes in the coma (Mumma et al. 1987; Kawakita & Kobayashi 2009, and references therein). Following these molecular properties, Crovisier (1984) and Mumma et al. (1987) have suggested that the OPR could serve as an indicator of the thermal conditions when cometary ices agglomerated, and thus can provide perspectives on the formation regions within the protoplanetary disk.
To obtain the OPR in water, we used ortho-water and para-water emission lines from orders 26 and 27 in the KL1 setting. This analysis was possible from observations on April 12, 19, and 26, yet poor S/N of para H2O lines (from KL2) precluded an OPR analysis on April 29. The OPR analysis led to the following values on April 12: 3.29 ± 0.16 (H2O lines used for the analysis: eight o-H2O/two p-H2O), April 19: 3.04 ± 0.21 (five o-H2O/three p-H2O), and April 26: 2.72 ± 0.19 (six o-H2O/two p-H2O). We noticed a small decrease of the OPRs on April 26, yet these values agree within 1σ. One could speculate that such a decrease may be linked to the release of fresh material during an outburst event, characterized by different ice phases in the nucleus relative to the pre-outburst release, but the information at hand precludes any definitive conclusions. Instead, we present a weighted mean value of these OPRs (∼3.05 ± 0.11), which corresponds to a spin temperature (Tspin) larger than ∼38 K, consistent with statistical equilibrium (2σ). Previous studies have reported spin temperatures in water (Crovisier 2006) and ammonia (Kawakita et al. 2004) to be clustered near 30 K in several comets, although estimates in some comets are consistent with OPR in statistical equilibrium (OPR = 3.0, or Tspin > 50 K; e.g., Bonev et al. 2007; Dello Russo et al. 2008). For a comprehensive review of spin temperatures in water, ammonia, and methane, see Mumma & Charnley (2011) and for a collection of recent OPR (water) measurements in comets, see Faggi et al. (2018).
4. Discussion: A Story Behind 252P's Chemical Composition
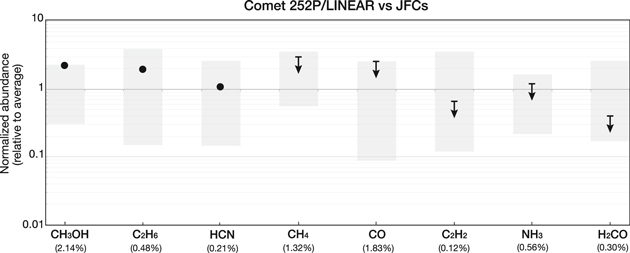
The chemical properties in comet 252P reveal some interesting characteristics that could provide insights to the primordial conditions governing the early stages of its formation. To place these measurements in context, we compare mixing ratios in 252P to values observed in other JFCs at IR wavelengths (see Figure 3 and Table 3). What stands out in 252P's composition is the rather high abundance of CH3OH (∼4.87%) and C2H6 (∼0.95%), about a factor of two larger than the average value of all JFCs (2.14% and 0.48%, respectively). In fact, the methanol abundance is also in the upper range of values measured in OCCs (∼2%; Paganini et al. 2015).
Figure 3. Relative abundance of minor species in comet 252P in context of measured values in JFCs. The gray boxes represent the range of values (minima and maxima), normalized to the mean of all measurements in JFCs (shown in parenthesis for each species). For a list of existing measurements used in this representation see Table 3.
Download figure:
Standard image High-resolution image
Table 3. Molecular Abundances of Minor Species (Relative to H2O) in Jupiter Family Cometsa
| Comet | CH3OH | C2H6 | HCN | CH4 | CO | C2H2 | NH3 | H2CO |
|---|---|---|---|---|---|---|---|---|
| 252Pb | 4.87 ± 0.34 | 0.95 ± 0.04 | 0.23 ± 0.02 | <3.92 | <4.43 | <0.08 | <0.67 | <0.13 |
| 2Pc | 3.48 ± 0.27 (1) | 0.31 ± 0.03 (1) | 0.09 ± 0.01 (1) | 0.34 ± 0.10 (1) | <1.77 (1) | <0.08 (1) | ⋯ | <0.13 (1) |
| 2Pd | 0.87 ± 0.09 (2) | 0.04 ± 0.01 (2) | 0.12 ± 0.01 (2) | 0.11 ± 0.01 (2) | 0.43 ± 0.04 (2) | <0.01 (2) | 0.61 ± 0.04 (2) | 0.27 ± 0.04 (2) |
| 6P | 2.80 ± 0.50 (3) | 0.29 ± 0.05 (3) | 0.03 ± 0.01 (3) | ⋯ | ⋯ | <0.05 (3) | 0.52 ± 0.15 (3) | 0.36 ± 0.09 (3) |
| 9P | 1.40 ± 0.20 (4) | 0.29 ± 0.04 (4) | 0.20 ± 0.03 (4) | 0.54 ± 0.30 (4) | 4.30 ± 0.10 (4) | 0.13 ± 0.04 (4) | 0.90 ± 0.30 (4) | 0.84 ± 0.18 (4) |
| 10P | 1.58 ± 0.23 (5) | 0.39 ± 0.04 (5) | 0.13 ± 0.02 (5) | ⋯ | ⋯ | <0.07 (5) | 0.83 ± 0.20 (5) | <0.11 (5) |
| 17P | 4.10 ± 0.60 (6) | 1.85 ± 0.22 (6) | 0.54 ± 0.08 (6) | ⋯ | ⋯ | 0.34 ± 0.05 (6) | <0.50 (6) | ⋯ |
| 21P | 1.22 ± 0.11 (7) | 0.12 ± 0.02 (7,14,15) | <0.27 (7) | ⋯ | 2.20 ± 1.50 (14,15) | <0.42 (14) | ⋯ | <0.8 (14) |
| 45P | 3.59 ± 0.31 (8) | 0.52 ± 0.04 (8) | 0.05 ± 0.01 (8) | 0.79 ± 0.06 (8) | 0.60 ± 0.04 (8) | 0.01 ± 0.03 (8) | 0.64 ± 0.24 (8) | 0.36 ± 0.04 (8) |
| 73P-B | 0.54 ± 0.11 (9) | 0.17 ± 0.01 (9, 16) | 0.29 ± 0.02 (9, 16) | <4.10 (16) | <1.9 (9) | 0.03 ± 0.01 (9, 16) | <0.09 (9) | 0.14 ± 0.02 (9) |
| 73P-C | 0.49 ± 0.06 (9) | 0.11 ± 0.01 (9, 17) | 0.22 ± 0.01 (9, 17) | <0.25 (17) | 0.53 ± 0.13 (9) | 0.03 ± 0.01 (9, 17) | <0.16 (9) | 0.12 ± 0.02 (9, 17) |
| 81P | 0.90 ± 0.30 (10) | 0.45 ± 0.05 (10) | 0.27 ± 0.03 (10) | ⋯ | ⋯ | 0.15 ± 0.05 (10) | 0.60 ± 0.30 (10) | 0.22 ± 0.08 (10) |
| 103P | 1.95 ± 0.07 (11, 12, 13) | 0.75 ± 0.02 (11) | 0.24 ± 0.01 (11, 12, 13) | <0.47 (11, 13) | 0.30 ± 0.15 (12) | 0.10 ± 0.01 (11, 12, 13) | 0.66 ± 0.06 (11, 12, 13) | 0.13 ± 0.02 (11, 12, 13) |
| Meane | 2.14 | 0.48 | 0.21 | 1.32 | 1.83 | 0.12 | 0.56 | 0.30 |
Notes.
aFor comets whose molecular abundance have more than one measurement, we show weighted averages from Dello Russo et al. (2016). bThis work. Values are weighted means, while upper limits are the most sensitive value obtained during our observing campaign. cMeasurements in 2003. dMeasurements in 2017. eMean value of all measurements, including upper limits as values.References. (1) Radeva et al. (2013), (2) Roth et al. (2018), (3) Dello Russo et al. (2009), (4) Mumma et al. (2005), (5) Paganini et al. (2012), (6) Dello Russo et al. (2008), (7) DiSanti et al. (2013), (8) DiSanti et al. (2017), (9) Dello Russo et al. (2007), (10) Dello Russo et al. (2014), (11) Mumma et al. (2011), (12) Dello Russo et al. (2011), (13) Kawakita et al. (2013), (14) Weaver et al. (1999), (15) Mumma et al. (2000), (16) Kobayashi et al. (2007), (17) Villanueva et al. (2006).
Download table as: ASCIITypeset image
Hydrogen cyanide (∼0.23%) and upper limits for NH3 (<0.67%) and C2H2 (<0.08%) are consistent with typical JFC values. By contrast, the H2CO (<0.13%) is among the lowest measured in JFCs, and is consistent with measurements at submillimeter wavelengths (<0.12%; Coulson et al. 2017). Concerning the hypervolatile species, the upper limits for CO (<4.43%) and CH4 (<3.92%) are not sensitive enough to derive any conclusions, however, these particular volatiles are characterized by a significant paucity of measurements in JFCs (DiSanti et al. 2017).
What could abundant methanol and ethane tell us about primordial conditions during formation? The rather high abundances of CH3OH and C2H6 could reflect agglomeration of these cometesimals in a cold environment, a key characteristic that would permit effective hydrogenation of simple hydrocarbons (e.g., H2CO and C2H2), wherein adsorbed H atoms have higher sticking coefficients (Hiraoka et al. 2000). For instance, high abundances of CH3OH would indicate efficient hydrogenation of CO and H2CO ice, following the CO → H2CO → CH3OH chemical reaction (Watanabe et al. 2003; Fuchs et al. 2009). In 252P, the ratio CH3OH/(H2CO+CH3OH) ∼ 97% suggests effective hydrogenation of formaldehyde in its precometary ice. Similarly, we can probe the reaction of C2H2 → C2H4 → C2H6 using the ratio C2H6/(C2H2+C2H6), which results in >92%, also suggesting efficient hydrogenation of acetylene. Such processing at cold temperatures could indicate a possible heritage of some precometary ices to interstellar chemistry, yet ubiquitous presence of methanol has also been found in cold regions of young stellar objects (Boogert et al. 2008, 2011, and references therein). These latter studies suggest alternative sources for C2H6 and CH3OH in precometary ices, where irradiated methane ice might serve as a source of ethane by the exothermic reaction of two methyl radicals (Hudson & Moore 1997; Bennett et al. 2006). An alternative mechanism for the low abundance of volatile species (CO, H2CO, C2H2) could be related to the preferential loss of the more volatile species, especially in small JFCs. However, the rather abundant ethane contradicts this hypothesis.
How representative are these chemical abundances to the true nuclear composition of 252P? Comets are typically observed over single apparitions, especially OCCs (because of their long periodicity) and sometimes JFCs due to their low activity. At times, temporary outbursts could expose material in the nucleus containing trapped volatiles not released before such an event. This is why observing the comet at different orbital conditions and apparitions is of paramount importance. The recent development of sensitive high-resolution instruments featuring improved spectral coverage (e.g., the Immersion Grating Echelle Spectrograph (iSHELL) at NASA's Infrared Telescope Facility (IRTF) and the upgraded NIRSPEC at Keck) is permitting more efficient observations of the undersampled JFCs, allowing not only measurements of multiple volatiles in single snapshots along a given orbit/visit, but also the measurement of key chemical volatiles over different heliocentric distances (for both JFCs and OCCs) and/or multiple apparitions (for JFCs), possibly improving the interpretation of molecular taxonomy (see DiSanti et al. 2017; Faggi et al. 2018; Roth et al. 2018). There are a few cases suggesting developing chemical characteristics in comets. The significant variation of mixing ratios in JFC 2P/Encke in 2003 (Radeva et al. 2013) relative to the more recent 2017 observations (Roth et al. 2018) is notable, and suggests a dynamic chemical scenario. For instance, the abundance of CH3OH and C2H6 (relative to water) decreased by a factor of ∼4 and ∼8, respectively, from the different apparitions (Table 3). Several explanations were proposed to address this discrepancy, including the possibility of a heterogenous nucleus, seasonal effects, and the change in heliocentric distance between observations. Roth et al. (2018) noted that a compositionally diverse nucleus for 2P/Encke is not improbable, as this was observed for 67P/Churyumov–Gerasimenko with the Rosetta mission (Rickman et al. 2015). Detection of deuterated water in Oort Coud comet C/2014 Q2 (Lovejoy) increased by a factor of ∼2–3 between observations pre-perihelion (Biver et al. 2016) and post-perihelion (Paganini et al. 2017). Even though the observations of comet C/2014 Q2 were done at similar distances to the Sun and water had a similar output, the increase of deuterated water (relative to water) suggested either possible chemical heterogeneity in the nucleus or different activation mechanisms at play. The water trapped in the icy nucleus could sublimate first, before the deuterium, or radiation near the Sun could modify the water's deuteration, both effects changing the ice properties during observations (e.g., Brown et al. 2012). Perhaps similar release mechanisms controlled 252P's activity in 2016 April, but further observations are required to probe this hypothesis and explain such discrepancies.
Could a possible transient jet release distinct (intact) material from the nucleus? The observations of enhanced methanol and ethane could be related to outgassing triggered by these volatiles, exposing more of these volatiles relative to the standard water outgassing, and thus indicating possible heterogeneity in the nucleus. Similar enrichment of methanol, ethane, and hydrogen cyanide was measured in comet 17P, yet such an effect could be attributed to the relatively large heliocentric distance (Rh = 2.4 au) of the comet during those observations, where water outgassing might not be fully activated (Dello Russo et al. 2008). Such explanation, however, is not applicable to our 252P observations at 1.1 au from the Sun. Moreover, our IR spatial profiles observed in 2016 April also suggest a preferential escape toward the sunward hemisphere for some volatiles (C2H6 and HCN) that agree with the bright and narrow jet of a few hundred kilometers long in the sunward direction observed with the Hubble Space Telescope on 2016 April 4, and CN images with DCT on 2016 April 17 (Li et al. 2017). These findings could be linked to release of fresh, highly volatile material from the nucleus, producing a temporary increase of these molecules relative to the typical composition. The HCN abundance (∼0.23%) in 252P, however, did not show a large abundance relative to mean values found in JFCs, possibly arguing against such a hypothesis.
5. Conclusions
We measured water (average production rate of 4.9 ± 0.1 × 1027 molec s−1), and obtained abundances of CH3OH (4.87 ±0.34%), C2H6 (0.95 ± 0.04%), HCN (0.23 ± 0.02%), and upper limits for NH3 (<0.67%), H2CO (<0.13%), C2H2 (<0.08%), and hypervolatiles CO (<4.43%) and CH4 (<3.92%) relative to water. The chemical abundances in 252P showed a relatively typical composition, excepting the enriched mixing ratios for CH3OH and C2H6, and the low upper limit for H2CO. Spatial profiles showed slight enhancements of the more volatile species (C2H6 and HCN) toward the sunward hemisphere, while water showed spatial distributions that were rather extended toward the anti-sunward hemisphere. The somewhat extended water profiles agree with the view of possible icy grains in the coma of 252P, in agreement with observations at radio and optical wavelengths (Coulson et al. 2017; Li et al. 2017). The growth factors for H2O exceed those for CH3OH and C2H6 on April 12, 19, and 26—a possible indication of a distinct phase of water-rich icy grains. Regarding the continuum, its distribution was less extended than the gas emissions. The rather unusual chemical composition of 252P suggests agglomeration of precometary ices in a somewhat cold environment, with the enhancement of methanol and ethane possibly due to effective hydrogenation and/or (transient) jet activity releasing distinct (intact) material from the nucleus. The observations presented herein set the basis for future exploration of the chemical composition of comet 252P. The next apparition of 252P in 2021 could provide a proper avenue to test this hypothesis and further illuminate—if existent—what factors might change chemical abundances in comets, or whether temporal effects (e.g., transient outbursts) altered the chemical composition observed in 2016 April.
We thank the staff of the W. M. Keck Observatory for their exceptional support throughout our observing program of Jupiter's moon Europa and comet 252P (N200S, PI: LP), and the anonymous referee for valuable suggestions. This work was supported by NASA's Keck PI Awards (RSA 1541943, 1466335 to LP), Solar System Observations (NNX17AI85G to LP), and the NASA Astrobiology Institute (13-13NAI7-0032 to GSFC, PI MJM). All data are publicly available at the Keck Observing Archive. The authors recognize and acknowledge the very important cultural role and reverence that the summit of Maunakea has always had within the indigenous Hawaiian community. We are most fortunate to have the opportunity to conduct observations from this mountain.
Footnotes
- 3
Comet 252P was discovered in 2000 by the LINEAR survey and has a period of 5.33 yr.