


ABSTRACT
We performed a sensitive search for HDO in comet D/2012 S1 (ISON) on 2013 November 16, 17, and 22 using CSHELL and the NASA Infrared Telescope Facility. We constrained the HDO/H2O ratio to <2.0 VSMOW (the terrestrial ocean value) at the 3σ uncertainty level from two independent measurements corresponding to different H2O outgassing rates. This represents the best constrained HDO/H2O ratio for a comet using a small (3 m) telescope and illustrates that when CSHELL is replaced with iSHELL, 3 m class telescopes are still strong contenders for detecting minor volatile species in moderately bright comets.
Export citation and abstract BibTeX RIS
1. INTRODUCTION
Cometary nuclei are primitive bodies that formed beyond the snow line (∼5 AU) in the early solar system. Subsequent gravitational scattering by the giant planets emplaced comets into their current reservoir of either the Kuiper Belt or the Oort Cloud. They retain the icy volatiles from which they formed, but the processing of this material prior to being incorporated into a comet is the subject of much debate. Volatiles in the comet-forming region of the disk may have been composed of material that survived from the cold presolar cloud, material that was vaporized and subsequently re-adsorbed onto grains, and material that underwent ion–molecule chemistry before being transported to the outer disk mid-plane (Visser et al. 2011). One key diagnostic of formation history is the D/H ratio in cometary ices. The D/H ratio of water (and other molecules) depends strongly on temperature when produced at low temperatures (Willacy & Woods 2009), and temperature gradients in the disk can introduce local variations in the production of deuterated species. Subsequent mixing through transport of materials formed in different disk regions can modify the radial dependence of D/H in water in the early solar system (Albertsson et al. 2014), and the net D/H ratio in individual comet nuclei. Given the potential cosmogonic significance of D/H in cometary volatiles, and the compositional diversity observed among comets (Mumma & Charnley 2011), it is important to characterize this ratio in as many comets as possible. Without extensive studies of volatiles and their isotopologues (e.g., HDO), we cannot test scenarios for chemical and dynamical processes in the early solar system.
We performed a search for HDO in Comet D/2012 S1 (ISON) in 2013 November, prior to the comet's destruction by its very close solar approach. The predicted brightness of ISON enabled a search for HDO from the ground, and while ISON did not attain the predicted brightness, it was still active enough near perihelion to warrant a dedicated search for HDO. The comet's daytime availability during peak brightness meant that the observations could only be performed with NASA's Infrared Telescope Facility (IRTF). In Section 2 we discuss our observations and data analysis procedures. We present our results in Section 3 and discuss them in the context of solar-system formation in Section 4. We close by discussing implications for the future of high-resolution, near-infrared spectroscopy of comets with the iSHELL instrument currently under development at the University of Hawaii for the IRTF (Tokunaga et al. 2008; Rayner et al. 2012).
2. OBSERVATIONS AND DATA ANALYSIS
Comet D/2012 S1 (ISON) was discovered by Vitali Nevski and Artyom Novichonok at the International Scientific Optical Network's (ISON) 40 cm reflector in Kislovodsk Observatory on 2012 September 20/21 (Nevski & Novichonok 2012). Comet ISON was dynamically new, and was making its first close approach to the Sun since its emplacement in the Oort cloud nearly 4.6 Gyr ago (Nakano 2013). We performed pre-perihelion observations to search for HDO on 2013 November 16, 17, and 22 using long-slit spectroscopy with the Cryogenic Echelle Spectrometer (CSHELL) on NASA's IRTF on Maunakea, HI (Greene et al. 1993).
Our observing log is shown in Table 1. We used the 5 pixel (1'') wide slit, permitting acquisition of data with high spectral resolution (λ/Δλ ∼ 24,000). We used our standard ABBA nod pattern, with a 15'' beam separation along the 30'' long slit. Details of our data acquisition for comet ISON are given by Bonev et al. (2014) and DiSanti et al. (2016). The observations were performed during daytime when ISON was nearing perihelion and peak brightness.
Table 1. Results—Water and HDO in D/2012 S1 ISON
| UT Date | UT Time | TOS | Rha | Δa | dΔ/dta | Trot (K)b | Q(H2O)b | Q(HDO)c | QHDO/ (VSMOW)c (VSMOW)c
|
|---|---|---|---|---|---|---|---|---|---|
| (2013) | (2013) | (minute) | (AU) | (AU) | (km s−1) | (nucleus) | (1029 s−1) | (1026 s−1) | |
| Nov 16 | 16:57–17:56 | 20 | 0.56 | 0.88 | −20.6 | 89 ± 5 | 0.91 ± 0.08 | ⋯ | ⋯ |
| 18:11–20:30 | 78 | ⋯ | ⋯ | −20.0 | (90) | ⋯ | <2.25 | <8.0 | |
| Nov 17 | 17:04–18:07 | 24 | 0.534 | 0.874 | −16.7 | 107 ± 3 | 1.83 ± 0.13 | ⋯ | ⋯ |
| 18:12–22:25 | 120 | ⋯ | ⋯ | −16.0 | (107) | ⋯ | <8.8 | <4.9 | |
| 22:50–23:34 | 24 | ⋯ | ⋯ | −15.3 |

|
1.68 ± 0.18 | ⋯ | ⋯ | |
| Nov 22 | 17:43–18:00 | 12 | 0.353 | 0.860 | +8.6 | 138 ± 5 | 9.92 ± 0.45 | ⋯ | ⋯ |
| 18:18–19:05 | 32 | ⋯ | ⋯ | +9.0 | (135) | (9.2)d | <6.0 | <2.0 | |
| 19:25–19:34 | 8 | 0.350 | 0.860 | +9.2 | 134 ± 2 | 3.86 ± 0.44 | ⋯ | ⋯ | |
| 19:08–19:20 | 104 | ⋯ | ⋯ | +9.4 to +9.8 | (130) | (4.15 ± 0.20)e | <2.7 | <2.1 | |
| 19:40–22:15 | ⋯ | ⋯ | ⋯ | ⋯ | ⋯ | ⋯ | ⋯ | ⋯ | |
| 22:42–22:50 | 8 | 0.345 | 0.861 | +10.5 |

|
4.01 ± 0.38 | ⋯ | ⋯ |
Notes.
aTOS is the time on source (in minutes); Rh and Δ are heliocentric and geocentric distance respectively; dΔ/dt indicates geocentric Doppler shift. bWater production rates and rotational temperatures for November 16 and 22 are from Bonev et al. (2014), those for November 17 and the average on November 22 are from DiSanti et al. (2016). Values for rotational temperature in parentheses are assumed. c3σ upper limits. dInterpolated water production rate, see Section 3. eAverage water production rate after outburst, from DiSanti et al. (2016).Download table as: ASCIITypeset image
Data were processed using our custom algorithms to achieve dark subtraction, flat fielding, and removal of pixels with high dark current and cosmic-ray hits. Detailed descriptions of the reduction procedures and flux calibration (achieved through observations of infrared standard stars) can be found in Villanueva et al. (2011a), Radeva et al. (2010), Bonev (2005, Appendix 2), and references therein. Atmospheric spectra were synthesized using the Line-By-Line Radiative Transfer Model (LBLRTM, Clough et al. 2005), which was optimized for Maunakea's atmospheric conditions (see Villanueva et al. 2011b). We used these models to assign wavelength scales to the extracted spectra and to determine column burdens for absorbing species in the Earth's atmosphere. The atmospheric model was binned to the resolution of the comet's spectrum, normalized, and scaled to the comet's continuum level (see Figure 1). The residual cometary line fluxes (upper limits) were obtained by subtracting the atmospheric model from the processed cometary spectra (row by row), and the measured residual fluxes for cometary emission lines were corrected for the monochromatic transmittance at the Doppler-shifted position of each line.
Because of the small angular separation between the comet and the Sun (∼20°) on November 22, we intentionally vignetted the primary mirror (up to ∼50%) during our first water and HDO observations (corresponding to UT 18:12–19:30, Table 1) in order to protect the focal plane from direct sunlight. This mechanical vignetting introduced a reduction in cometary flux proportional to the percentage of the mirror that was covered. Each AB pair was reduced separately and corrected for vignetting by interpolating from the mirror obstruction at the beginning of the observations (50%) until the mirror was completely clear of obstruction at 19:30 UT. The absolute uncertainty in flux calibrations introduced by vignetting is estimated to be 10%, based on uncertainty in the percentage of cometary vignetting at the time of the observations, and was added (in quadrature) to the 5% uncertainty in absolute flux calibration between settings (DiSanti et al. 2016).
The different spatial profiles for gas and dust complicated the analysis of HDO. The dust emission profile was non-symmetric (extended in the anti-sunward direction) while the gas emission profile was symmetric and slightly offset (sunward, typically by 1–2 pixels) from the peak of the dust continuum (see Figure 3 in Bonev et al. 2014 and Figures 3 and 6 in DiSanti et al. 2016). However, the shape of the continuum profiles was similar from setting to setting and from day to day during our observations, making it possible to use the spatial emission profiles for dust and water to estimate the growth factor for the (undetected) HDO emission. In order to quantitatively constrain HDO, we determined the HDO upper limit on the nucleus (offset by 1 pixel from the dust continuum peak, as for water) and assumed that the spatial profile of HDO followed that for water, which was measured on the same day either immediately before or after the HDO settings (see Table 1). Our HDO growth factor—needed to convert nucleus-centered to total production rate—was given by the growth factor for water multiplied by the ratio of the dust continuum growth factors for the HDO and H2O settings. We used the rotational temperatures for H2O retrieved at the position of the peak H2O spatial profile (e.g., see Figure 1 for November 22 in Bonev et al. 2014).

Figure 1. Spectral extracts for the HDO setting on November 22 showing the average spectrum during the outburst (top, from 18:18 to 19:05 UT) and post-outburst (bottom, from 19:08 to 22:15 UT). Overplotted are the synthetic LBLRTM telluric models for each (red). Below each spectral extract is the corresponding residual (multiplied by 10 or 5, as indicated) with the 1σ error envelope overplotted in green. The blue line in the middle is a synthetic HDO model to illustrate the expected (but undetected) HDO line positions. The HDO rest and Doppler-shifted frequencies are indicated by vertical dashed and solid lines, respectively. The emission feature near 2690.8 cm−1 is unidentified.
Download figure:
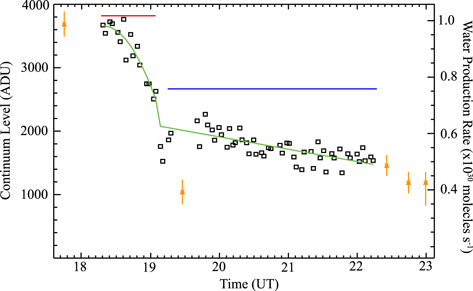
Standard image High-resolution imageWe acquired HDO spectra bracketed by H2O on November 22 (Table 1), when ISON was recovering from an outburst (Combi et al. 2014). DiSanti et al. (2016) noted that the continuum profile was consistently asymmetric in the anti-sunward direction in all settings (including those measuring H2O), and its width (along the slit) varied in proportion to the seeing, which ranged from ∼1 2 at 17:00 UT to ∼2'' at 22:00 UT. Although the water production rate varied during our observations, the overall abundance ratios of molecules in ISON relative to water did not vary, and there were no systematic differences between mixing ratios measured during or after the outburst (DiSanti et al. 2016). We note that the continuum flux level tracked the H2O production rate, making the dust profile a very good proxy for the relative changes in H2O production rate during the HDO observations. In Figure 2, we compare our measured water production rates (orange triangles) and the dust continuum flux measured for each AB pair (corresponding to 2 minutes of integration time and corrected for vignetting when appropriate). Using the dust continuum as a proxy for water production was crucial to our analysis, particularly for the time interval when the water production rate was dropping rapidly (∼18:00–19:10 UT).
Figure 2. Dust continuum level (black squares) as a function of universal time on 2013 November 22 for the HDO setting. The continuum level decreased steeply with time as the comet was coming out of outburst and the ejecta cloud expanded, but the level changed more slowly after ∼19:20 UT, probably owing to the departure of excess dust ejecta from the inner coma (Sections 2 and 3). The red and blue horizontal lines indicate respectively the time spans over which the first and second values for November 22 in Table 1 are based. Most of the scatter reflects slight issues with tracking and/or seeing. The orange triangles indicate the measured water production rates (Bonev et al. 2014; DiSanti et al. 2016). The green curve is a polynomial fit through the HDO observations, broken between the steep decline following the outburst and the more shallow decrease after ∼19:10. We extracted the average HDO production rates using these trend lines (Section 2 and Table 1).
Download figure:
Standard image High-resolution image
The dust flux decreased dramatically during the interval 18:18–19:05 UT (indicated by the red horizontal line in Figure 2; see also Figure 1). We fit the dust continuum with a second-order polynomial (limiting the fit to the first AB pair in each set, which is less affected by drift during the observations). We then scaled the polynomial to the water production rate measured at the beginning of this interval and constructed a time-variable function for water production. The average water production rate [Q(H2O)] over this interval was ∼9.2 × 1029 molecules s−1. The dust flux stabilized after UT 19:05, possibly due to the exit of outburst material from the inner coma region. Values for Q(H2O) were measured at the beginning and end of the second interval (blue horizontal line in Figure 2), and their individual values were consistent within measurement error (Bonev et al. 2014). For this second interval, we used the weighted mean of Q(H2O) for comparison with HDO. The rotational temperatures and water production rates used for our upper limits are presented in Table 1.
3. RESULTS
Water production rates and rotational temperatures varied dramatically during the comet's approach to the Sun, implying rapid evolution, as evidenced also by an outburst that occurred just prior to our observations on November 22 (see Combi et al. 2014). We measured H2O production from October 22 to November 23 (Rh 1.21–0.34 AU). Bonev et al. (2014) presented an analysis of water for comet ISON on November 17 and 22 (summarized in Table 1 and shown in Figure 2), while DiSanti et al. (2016) analyzed water on November 16, as well as the overall volatile chemistry throughout the comet's appearance.
We obtained upper limits for HDO on three dates, reporting single values on November 16 and 17 and two values for November 22. On November 22, the first HDO value was taken during the dramatic decrease in continuum flux at the beginning of the day; the second was taken when the production rates were more stable (Table 1 and Figure 2, see also DiSanti et al. 2016). Our most stringent values for the abundance ratio of HDO and H2O were obtained on November 22, with HDO/H2O < 6.48 × 10⁻⁴ (3σ) (i.e., <2.0 VSMOW (Vienna Standard Mean Ocean Water)) during the rapid decline and <6.54 × 10⁻⁴ (i.e., <2.1 VSMOW) after the rapid decline ended (Table 1). (The abundance ratio of HDO to H2O is 3.116 × 10⁻⁴ in VSMOW and the ratio of D to H in VSMOW is 1.558 × 10⁻⁴.) During the second sequence, the dust intensity (and thus H2O production) declined much more slowly and the telescope was free from vignetting. The higher telescope efficiency and the greater time on source largely compensated for the smaller (mean) water production rate during that interval (Table 1).
To better constrain HDO, it is desirable to combine data sets, especially on November 22. However, our reduction methods were developed for comets in which water production was nearly in a steady state, i.e., did not change appreciably over the timescale of hours, but that condition is not valid for comet ISON on November 22. An expanding cloud following an outburst will produce an unpredictable density profile with distance from the nucleus. We lack the quantitative information needed to model the effects of such an outflow, and so we ignore the systematic uncertainties they may introduce. However, we do measure variations in the rotational temperature of water and the overall water production rate (see Figure 2; also Bonev et al. 2014; DiSanti et al. 2016). Accordingly, we combined the complete HDO data set on November 22 in the following fashion:
1. The rotational temperature of water on the nucleus was higher during the outburst (138 K) than during the subsequent measurements (∼125–130 K). The upper limit scales as σ(flux)/g-factor and the g-factors are temperature-dependent, so combining data sets of different temperatures requires compensation for the different g-factors. We scaled the HDO data during the outburst (18:18–19:05 UT) to a rotational temperature of 125 K by adjusting the g-factors to compensate for the temperature difference (the ratio of g-factors from 138 to 125 K for the HDO lines used in this study is 0.89).
2. To account for the higher productivity of the comet earlier in the sequence, we scaled data from 18:18 to 19:05 UT down by the ratio of water production rates to the average of the water production rates measured after 19:20 UT.
The result was a slight improvement in the HDO upper limit, to 1.8 VSMOW (3σ). However, given the changing nature of the comet (productivity and rotational temperature) on November 22, we conclude that the 3σ upper limit of <2.0 VSMOW is more robust. We compare this value for the ratio of D and H in water in comet ISON with measurements and upper limits reported for other comets in Table 2 (see also Section 4).
Table 2. D/H Ratios and Upper Limits for Water in Comets
| Comet |

|

|
Type of Comet | Reference |
|---|---|---|---|---|
| (×10−4) | [VSMOW]a | |||
| 1P/Halley | 3.16 ± 0.34 | 2.03 ± 0.22 | Halley Family | Eberhardt et al. (1995) |
| Balsiger et al. (1995) | ||||
| C/1995 O1 | 3.3 ± 0.8 | 2.1 ± 0.5 | Oort Cloud | Meier et al. (1998) |
| (Hale-Bopp) | <1.8 | <1.2 | Crovisier et al. (2004) | |
| C/1996 B2 (Hyakutake) | 2.90 ± 1.00 | 1.86 ± 0.64 | Oort Cloud | Bockelée-Morvan et al. (1998) |
| C/2002 T7 (LINEAR) | 2.5 ± 0.7 | 1.6 ± 0.4 | Oort Cloud | Hutsemékers et al. (2008) |
| 8P/Tuttle | 4.09 ± 1.45 | 2.62 ± 0.93 | Oort Cloud | Villanueva et al. (2009) |
| C/2009 P1 (Garradd) | 2.06 ± 0.22 | 1.32 ± 0.14 | Oort Cloud | Bockelée-Morvan et al. (2012) |
| 103P/Hartley 2 | 1.61 ± 0.24 | 1.03 ± 0.15 | Jupiter Family | Hartogh et al. (2011) |
| 67P/Churyumov–Gerasimenko | 5.3 ± 0.7 | 3.4 ± 0.4 | Jupiter Family | Altwegg et al. (2015) |
| C/2007 N3 (Lulin) | <5.6 (3-σ) | <3.6 | Oort Cloud | Gibb et al. (2012) |
| 153P/Ikeya-Zhang | <2.8 (3-σ) | <1.8 | Oort Cloud | Biver et al. (2006) |
| 45P/Honda-Mrkos-Pajdusáková | <2.0 (3-σ) | <1.3 | Jupiter Family | Lis et al. (2013) |
| D/2012 S1 (ISON) | <3.1(3-σ) | <2.0 | Oort Cloud | This work |
Note.
aVSMOW (Vienna Standard Mean Ocean Water) corresponds to HDO/H2O = 3.116 × 10⁻⁴ or = 1.558 × 10⁻⁴.
Download table as: ASCIITypeset image
4. DISCUSSION
Why are the HDO production rates or upper limits important? Cometary volatiles are thought to have condensed primarily in the cold mid-plane of the outer (beyond ∼5 AU) protoplanetary disk of the early solar system, where low (≲150 K) temperatures would have dominated. The material there was likely a combination of presolar material that was not heated enough to evaporate before being incorporated into the disk and material that had sublimated but later recondensed (Visser et al. 2011). However, the presence of crystalline silicates in comets (Hanner et al. 1994; Wooden 2008 and references therein) suggests that mixing of material from the hot inner disk to the outer mid-plane and/or from the disk surface to the mid-plane also likely occurred. Therefore, the abundance ratio of HDO/H2O ice in the mid-plane of the protoplanetary disk would depend on both thermal history and disk mixing.
At very low temperatures, deuteration in the gas phase is driven by ion–molecule reactions with, for example, H2D+, which is formed by the reaction of  with HD (Willacy & Woods 2009; Ceccarelli et al. 2014; Willacy et al. 2015). Due to an activation barrier, the reverse reaction is inhibited at low temperatures, leading to significant enhancements in the gas-phase D/H ratio that propagate to molecules like water via additional ion–neutral reactions. Other reactions, such as HD with OH+ or
  are also expected to lead to enhancements of HDO in cold gas (Ceccarelli et al. 2014). In the ice phase, atom addition reactions on cold (<20 K) icy grain surfaces are more frequent for the more strongly bound deuterium than for hydrogen, leading to enriched D/H abundances for molecules that are believed to form on grain surfaces, such as HDO and CH3D. Freeze-out of CO, the main destruction pathway for H2D+, in the outer disk mid-plane further increases the gas-phase D/H ratio and enhances the amount of D available for reactions on icy grain surfaces.
Another scenario for the production of HDO in the protoplanetary disk involves neutral–neutral reactions, such as HD + O to produce OD, which reacts with H2 to form HDO (Thi et al. 2010). This pathway requires warm gas (T = 100–1000 K) and would have taken place above the cold disk mid-plane or close to the young Sun. Overall, Albertsson et al. (2014) suggested that gaseous material that formed in the inner disk should carry a D/H ratio closer to the protosolar value. Comets that later incorporated such material (via turbulent transport to the outer disk) should carry a lower HDO/H2O signature than those with higher contributions from either presolar material or material that formed in the cold mid-plane.
Dynamical modeling suggests a contribution of both asteroidal and cometary bodies to the terrestrial planets' region early in the solar system's history (Gomes et al. 2005; Walsh et al. 2011). To determine the relative contribution of each population of object, a statistically significant sample of cometary measurements is needed. To date, HDO has been detected in only eight comets, and stringent upper limits have been reported for an additional three comets. The results of these HDO/H2O studies are summarized in Table 2. So far, the average of HDO detections in Oort Cloud comets is consistent with HDO/H2O ratios about twice the value in Earth's oceans (VSMOW). More recently, Jupiter Family comets 109P/Hartley 2 (Hartogh et al. 2011) and 45P/Honda-Mrkos-Pajdušáková (Lis et al. 2013) were found to have HDO consistent with 1 VSMOW, perhaps less in the case of 45P. Recent in-situ Rosetta observations of 67P/Churyumov–Gerasimenko found D/H in water to be about three times the terrestrial value (Altwegg et al. 2015); however, it is not known whether this ratio reflects the bulk ratio in the nuclear ice, particularly since this was measured at relatively large heliocentric distance (Rh = 3.5 AU) before water was fully activated.
These recent results imply that we have not yet sampled the full range of HDO abundances in cometary objects. Additionally, many of the detections were for brighter comets observed with state-of-the art instrumentation but were, nevertheless, near the detection limit for the instruments in question. This implies that the measurements to date may be biased toward objects enriched in deuterated water. The question remains whether Oort Cloud comets may also exhibit a wide range of HDO/H2O ratios, possibly including values consistent with or below that for Earth's oceans and also whether some Jupiter Family comets may have D/H in water significantly less than 1 VSMOW. Given the small number of detections and upper limits, further deep searches for HDO in comets are clearly necessary if we are to fully understand water distribution in the early solar system and its potential delivery by comets to the early Earth.
5. IMPLICATIONS FOR ISHELL
HDO can be directly detected from the ground at radio and infrared wavelengths. Currently, high-resolution spectral capability in the near-infrared is limited to only a few instruments. NIRSPEC on Keck II has several distinct advantages over CSHELL and the IRTF, including the size of the telescope (10 m compared to 3 m) and its much greater spectral coverage owing to the larger detector array and to cross-dispersion. The western elongation limitation for Keck II and the prohibition against daytime observing limit its usefulness for some comet apparitions. CRIRES on the VLT is an option in the Southern Hemisphere. It is currently undergoing an upgrade and will be available in 2018. Its advantages include a high resolving power of 50,000–100,000, and it will be cross-dispersed. However, it may be less efficient for comet observations due to the short slit length (10''), which will necessitate nodding to blank sky for many comets. Occasionally the Phoenix instrument is available on Gemini South, and while its high resolving power (50,000–70,000) is an advantage, it is not cross-dispersed and has a narrow spectral coverage.
None of the instruments discussed above can be utilized for the frequent comets with daytime availability, which is a key advantage of the IRTF. Such daytime studies were hindered by the narrow spectral grasp of CSHELL and the lack of IR guiding. However, NASA will replace CSHELL at IRTF in early 2016 with a cross-dispersed, high-dispersion (λ/Δλ up to ∼70,000) spectrometer that will provide full coverage for wavelengths below 3.75 μm (Tokunaga et al. 2008; Rayner et al. 2012). iSHELL will also have an infrared slit-viewing/guide camera that will enable daytime guiding, which is not currently possible with CSHELL. This advance will dramatically improve the efficiency of observing daytime targets by eliminating the need to image the comet between each observing set (ABBA) to check guiding, and it will reduce loss of light due to cometary drift (which causes some of the scatter in Figure 2). The improved sensitivity and significantly larger spectral coverage within a setting, coupled with the ability to guide during daytime, will make IRTF a much more powerful facility for observing comets such as ISON, which are often at small solar elongation when they are most productive and are then not optimally placed for night-time observing. The larger spectral coverage will also enable simultaneous sampling of HDO with other molecules, including OH prompt emission, which is a well-known proxy for water production rates (Mumma et al. 2001; Bonev et al. 2004, 2006; Bonev 2005). This will result in less uncertainty due to inter-order calibration. Altogether, iSHELL will be a powerful instrument for performing studies on a wide range of cometary targets.
With a moderately sized 3 m telescope and an instrument built more than 20 years ago, we were able to achieve a significant upper limit for D/H in cometary water, similar to the detections found with other methods and using higher sensitivity instruments and larger telescopes. With sensitivity sufficient to characterize the HDO/H2O at or below the value for Earth's oceans, iSHELL will enable searches for HDO in moderately bright comets, including those only available during daytime. By sampling a significant population of both Oort cloud and Jupiter Family comets we can determine with some confidence the extent to which comets may have contributed volatiles to the early terrestrial planets.
We thank NASA's PATM (NNX12AG60G), PAST and Astrobiology programs, and the NSF Astronomy and Astrophysics Research Grants (AST-1211362). For supporting various team members in this work. We thank NASA IRTF's staff for their exceptional support. We are most fortunate to have the opportunity to conduct observations from Maunakea, recognizing the very significant cultural role and reverence that the summit has always had within the indigenous Hawaiian community. B.P.B.'s contribution to the ISON Observing Campaign is dedicated to the memory of Hristov for his long distinguished service as a physics teacher in the Foreign Language School "Romain Rolland," Stara Zagora, Bulgaria.