


ABSTRACT
We report the discovery of a remarkable concentration of massive galaxies with extended X-ray emission at zspec = 2.506, which contains 11 massive (M* ≳ 1011 M⊙) galaxies in the central 80 kpc region (11.6σ overdensity). We have spectroscopically confirmed 17 member galaxies with 11 from CO and the remaining ones from Hα. The X-ray luminosity, stellar mass content, and velocity dispersion all point to a collapsed, cluster-sized dark matter halo with mass M200c = 1013.9±0.2 M⊙, making it the most distant X-ray-detected cluster known to date. Unlike other clusters discovered so far, this structure is dominated by star-forming galaxies (SFGs) in the core with only 2 out of the 11 massive galaxies classified as quiescent. The star formation rate (SFR) in the 80 kpc core reaches ∼3400 M⊙ yr−1 with a gas depletion time of ∼200 Myr, suggesting that we caught this cluster in rapid build-up of a dense core. The high SFR is driven by both a high abundance of SFGs and a higher starburst fraction (∼25%, compared to 3%–5% in the field). The presence of both a collapsed, cluster-sized halo and a predominant population of massive SFGs suggests that this structure could represent an important transition phase between protoclusters and mature clusters. It provides evidence that the main phase of massive galaxy passivization will take place after galaxies accrete onto the cluster, providing new insights into massive cluster formation at early epochs. The large integrated stellar mass at such high redshift challenges our understanding of massive cluster formation.
Export citation and abstract BibTeX RIS
1. INTRODUCTION
Clusters of galaxies represent the densest environments and trace the most massive dark matter (DM) halos in the universe. Studying the formation and evolution of galaxy clusters and their member galaxies is fundamental to our understanding of both galaxy formation and cosmology (Kravtsov & Borgani 2012). Massive galaxy clusters in the local universe are characterized by a significant population of massive, passive ellipticals in their cores. Galaxy cluster archeology and numerical simulations suggest that these massive clusters and their member galaxies have experienced a rapid formation phase at z > 2, when the bulk of the stars in central cluster galaxies was formed (Thomas et al. 2005; De Lucia & Blaizot 2007), and the first collapsed, cluster-sized halos (progenitors of today's most massive galaxy clusters) with masses M200c ≳ 1014 M⊙ were assembled (Chiang et al. 2013). Observations of galaxy structures in this rapid formation phase are critical to map the full path of galaxy cluster formation and to answer fundamental questions about the effect of dense environments on galaxy formation and evolution. Such structures, however, have been so far difficult to detect due to their rareness and distance.
Extensive efforts have been made to search for high-redshift structures during the last decade with a variety of techniques, and a number of galaxy (proto)clusters at z ≳ 1.5–2 have been discovered. A few of these structures found up to z ∼ 2 already show evidence of a collapsed, cluster-sized halo and exhibit a high concentration of quiescent galaxies in the core (with a well-defined red sequence, Papovich et al. 2010; Gobat et al. 2011; Stanford et al. 2012; Andreon et al. 2014; Newman et al. 2014), hence they can be classified as bona fide mature clusters. Some of them still contain a substantial number of star-forming galaxies (SFGs) (Brodwin et al. 2013; Gobat et al. 2013; Strazzullo et al. 2013; Clements et al. 2014; Valentino et al. 2015; Webb et al. 2015), and a few of them show clear evidence of a reversal of the star formation–density relation (Elbaz et al. 2007) with enhanced star formation in cluster members with respect to field galaxies (Tran et al. 2010; Santos et al. 2015). However, most of these clusters are already dominated by quiescent galaxies in the core, at least at the massive end (M* ≳ 1011 M⊙), with a significantly higher quiescent fraction compared to the field. Hence to probe the main formation epoch of the most massive cluster galaxies, we need to explore even higher redshifts, i.e., z > 2.
Most currently known z ≳ 2 structures exhibit lower galaxy number densities and are spread in multiple, less massive, and not collapsed halos compared to mature clusters (Steidel et al. 1998; Kurk et al. 2000; Venemans et al. 2007; Miley & De Breuck 2008; Chapman et al. 2009; Daddi et al. 2009; Capak et al. 2011; Tanaka et al. 2011; Hayashi et al. 2012; Spitler et al. 2012; Trenti et al. 2012; Chiang et al. 2013; Diener et al. 2013; Koyama et al. 2013; Lemaux et al. 2014; Yuan et al. 2014; Casey et al. 2015; Mei et al. 2015; Kubo et al. 2016). These structures are believed to be in various early evolutionary stages of cluster formation, and are usually called "protoclusters." Although there is no consensus on the distinction between protoclusters and clusters, recent works suggest that the lack of a collapsed, cluster-sized halo (M200c ≳ 1014 M⊙) is a key feature to differentiate protoclusters from clusters (Diener et al. 2015; Muldrew et al. 2015). This distinction could be important since the dominating environmental process that shapes galaxy evolution depends on the mass of the host DM halo, such as ram pressure stripping (Gunn & Gott 1972) and strangulation (Larson et al. 1980). Moreover, in contrast to mature galaxy clusters, most of the galaxies in protoclusters are found to be star-forming, with no clear evidence of an elevated quiescent fraction compared to field galaxies. Hence the transition between protoclusters and mature clusters requires both the collapse of a massive, cluster-sized halo and the formation and quenching of a significant population of massive galaxies. Clear evidence for galaxy structures in such a rapid transition phase, however, is lacking from current observations.
From a theoretical perspective, the halo assembly history of today's massive clusters is relatively well understood. Numerical simulations suggest that the progenitor of a present day "Coma"-type galaxy cluster (M200c > 1015 M⊙) exhibits overdensities of galaxies over an extended area, ≳25 Mpc at z > 2, and consists of many separated halos (Chiang et al. 2013; Muldrew et al. 2015; Contini et al. 2016). Among these halos, the most massive one could reach a few times 1013 to 1014 M⊙ and should be detected as a cluster. These results are in good agreement with observations. However, details on the build-up of the stellar mass content of massive clusters and the physical mechanisms leading to the distinct galaxy population in clusters and the field are still under active debate. Much of these debates focus on the relative importance of different environmental effects on massive galaxy evolution. For instance, it remains unclear whether the bulk population of central cluster ellipticals are formed after galaxies have become part of a cluster (due to, e.g., ram pressure stripping and frequent mergers), or whether they are already established due to "pre-processing" in a grouplike environment before their accretion onto a cluster-sized halo (due to, e.g., strangulation). A few recent theoretical studies provide some insights into this issue, however, reaching different conclusions (Balogh et al. 2009; Berrier et al. 2009; McGee et al. 2009; De Lucia et al. 2012; Granato et al. 2015; Contini et al. 2016). The major difficulty in constraining these theoretical models comes form the lack of comprehensive understanding of star formation and quenching (quiescent fraction) in halos with different masses at high redshifts. The fact that most galaxy clusters up to z ∼ 2 are already dominated by quiescent galaxies in the core suggests that we need to explore structures at even higher redshift to put observational constraints on this issue.
In this paper we report the discovery of CL J1001+0220 (CL J1001, hereafter), a remarkable concentration of massive SFGs at z = 2.506 with 17 spectroscopic members. The detection of extended X-ray emission and the velocity dispersion of its member galaxies are suggestive of a virialized, cluster-sized halo with M200c ∼ 1013.9 M⊙, making it the most distant X-ray-detected galaxy cluster known to date. However, unlike any clusters detected so far, the core of this structure is dominated by SFGs with a star formation rate (SFR) density of ∼3400 M⊙ yr−1 in the central 80 kpc region, suggesting that most of the ellipticals in this cluster will form after galaxies accrete onto the cluster core. This provides one of the first observational constraints on the role of "pre-processing" in the early formation of massive clusters.
This paper is organized as follows. We describe the target selection and multiwavelength imaging of CL J1001 in Section 2. Spectroscopic follow-up observations and redshift determinations are shown in Section 3. We present the X-ray observations of the cluster from Chandra and XMM-Newton in Section 4. In Section 5, we discuss the global properties of the cluster. In Section 6, we explore physical properties of its member galaxies. We then discuss the implications of this cluster on galaxy and cluster formation, as well as on cosmology, in Section 7. Section 8 summarizes our main results. Unless specified otherwise, all magnitudes are in the AB system, and we assume cosmological parameters of H0 = 70 km s−1 Mpc−1, ΩM = 0.3, and ΩΛ = 0.7. A Salpeter (1955) initial mass function (IMF) is adopted to derive stellar masses and SFRs. When necessary, we converted literature values of stellar masses and SFRs based on the Chabrier (2003) IMF to Salpeter by multiplying by a factor of 1.74 (0.24 dex). Throughout this paper, we define M200c as the total halo mass contained within R200c, the radius from the cluster center within which the average density is 200 times the critical density at the cluster redshift.
2. TARGET SELECTION AND MULTIWAVELENGTH IMAGING
Searching for overdensities of massive galaxies represents a relatively unbiased way of identifying galaxy (proto)clusters at high redshifts. A number of (proto)clusters have been identified based on overdensities of color-selected massive galaxies (Papovich et al. 2010). In particular, the distant red galaxy (DRGs, Franx et al. 2003) population has been shown to be quite efficient at selecting massive galaxies (including both quiescent and star-forming ones) at z > 2 (van Dokkum et al. 2003). To search for galaxy clusters at z > 2, We have performed a systematic study of overdensities of DRGs with  in the COSMOS field using a Ks-band selected catalog (Ks < 23.4, 90% completeness, McCracken et al. 2012; Muzzin et al. 2013). Overdensities of DRGs have been shown to be good tracers of potential massive structures at z > 2 (Uchimoto et al. 2012). We constructed a galaxy surface density map using a local galaxy density indicator, Σ10, which is
  with r10 the distance to the 10th nearest neighbor on a grid (Figure 1). We then fitted the distribution of log(Σ10) values in the map with a Gaussian function, as shown in the right panel of Figure 1. The most significant outlier (centered at R.A. = 10:00:57.13, decl. = +02:20:11.83) of the best-fit Gaussian distribution exhibits a Σ10 ∼ 11.6σ higher than the mean. We have also tried to use different density estimators, e.g., Σ5, which is
  with r5 the distance to the 5th nearest neighbor, yielding similar significance for this overdensity. This overdensity includes 11 DRGs and 2 blue galaxies within a 10'' radius, or 80 kpc at z = 2.5. The photometric redshift distribution of these 13 galaxies shows a prominent peak at z ∼ 2.5 with one of them identified as a Lyα emitter at z ∼ 2.5 ± 0.1 based on intermediate-band data (IA427 filter) in the Subaru COSMOS 20 survey (Taniguchi et al. 2015).
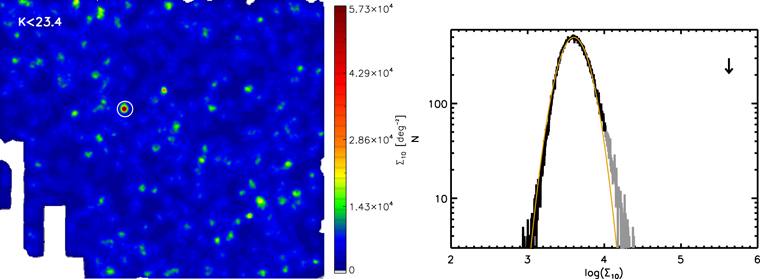
Figure 1. Left: a smoothed map of Σ10 for the whole sample of DRGs in COSMOS. The parts of the map that are affected by image borders or bad areas are masked out. The white circle with a radius of 2' denotes the overdensity region studied in this paper, which has the highest Σ10 value. Right: the distribution of log Σ10 values in the map and its Gaussian fit (white and orange lines, respectively). The grayed-out part of the distribution is not considered in the fit to avoid overdensities affecting the fitting results. The white arrow shows the peak Σ10 value of the overdensity.
Download figure:
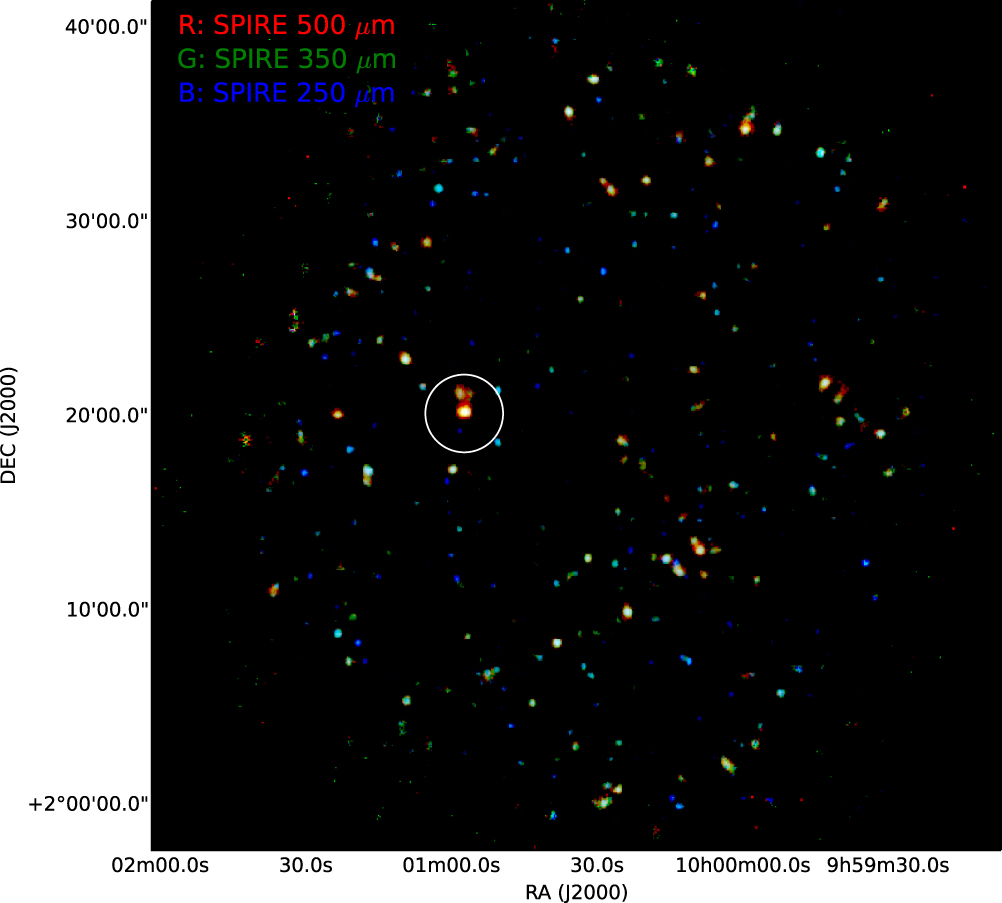
Standard image High-resolution imageThe same overdensity also corresponds to the brightest Herschel/SPIRE source (unresolved) in the region covered by the CANDELS-Herschel survey (PI: Mark Dickinson) in the COSMOS field (Figure 2), with flux densities of ∼61, 77, and 66 mJy at SPIRE 250, 350, and 500 μm, respectively. With a peak at 350 μm, the far-infrared spectral energy distribution (SED) of this overdensity provides further evidence that most of its member galaxies are likely at z ∼ 2.5. This overdensity was also detected at 850 μm with SCUBA-2 (Casey et al. 2013) and 1.1 mm with Aztec (Aretxaga et al. 2011) with flux densities 14.8 and 8.9 mJy, respectively. The same region was also observed as a candidate of lensed sources with ALMA at band-7 (870 μm) as described in Bussmann et al. (2015). ALMA resolves 5 out of the 11 DRGs in the core down to S870 μm > 1.6 mJy (Figure 3). These observations suggest that vigorous star formation is taking place in the member galaxies of this structure. Motivated by its high far-infrared and millimeter flux densities, we have performed a series of follow-up observations from near-infrared to millimeter to explore properties of this overdensity and its member galaxies.

Figure 2. RGB Herschel/SPIRE composite color image of the COSMOS field covered by the CANDELS-Herschel survey. The R, G, and B channels correspond to SPIRE 500, 350, and 250 μm, respectively. Only sources brighter than 20 mJy at one or more of the three SPIRE wavelengths are shown. Sources with redder colors tend to be at higher redshifts. The large white circle with a radius of 2' indicates the position of the galaxy overdensity, which is the brightest SPIRE source in the whole field.
Download figure:
Standard image High-resolution image
Figure 3. RGB composite color image of the region around the cluster core. The R, G, and B channels correspond to the Ks, J, and Y bands from the UltraVISTA survey, respectively. The left panel (a) corresponds to a 4' × 4' region while the right panel (b) is an enlarged image of the central 30'' × 30'' region around the cluster core. Red arrows indicate distant red galaxies (DRGs) outside the core with zphot = 2.5 ± 0.5, while white arrows indicate spectroscopically confirmed members within 3σ of the peak of the redshift distribution (zspec = 2.506 ± 0.018), including 7 galaxies in the core (indicated in the right panel) and 10 galaxies in the outskirts. Extended X-ray emission (0.5–2 keV) and ALMA 870 μm continuum are overlaid, respectively, with yellow and white contours in the right panel. There are 11 DRGs (5 detected with ALMA at 870 μm) and 2 blue galaxies within the central 10'' region, or 80 kpc at z = 2.5.
Download figure:
Standard image High-resolution image3. SPECTROSCOPIC OBSERVATIONS AND REDSHIFT DETERMINATION
3.1. IRAM-NOEMA
We first conducted observations with IRAM-NOEMA to resolve the millimeter emission and measure the redshift of this overdensity through the CO(5-4) line. Observations were carried out as part of a DDT program at NOEMA between 2014 November 7th and 2015 March 5th. Aiming at the detection of CO(5-4), we performed a frequency scan between 161.1 and 171.5 GHz, which corresponds to a redshift range of 2.36 < z < 2.58 sampled by the CO(5-4) line. We used the 3.6 GHz instantaneous bandwidth of the WideX correlator in three frequency setups centered at 162.9, 166.1, and 169.7 GHz. Between 1 and 1.5 hr were devoted to each setup, reaching an rms of ∼13 mJy at the original resolution, or ∼0.3–0.4 mJy over an integrated 1000 km s−1 band. Following up a preliminary detection, we further integrated 1.8 extra hours at 164.45 GHz, and 2.4 hr at 98.68 GHz to detect the CO(3-2) transition. Gain calibration was performed on the nearby quasars 1055+018 and 0906+015, which were also used for regular pointing and focus measurements. Calibration was carried out with GILDAS.15
In total, we detected three sources in CO(5-4) down to integrated line fluxes of ∼0.6 Jy km s−1 (5σ) in the central 10'' region, two of which were also detected in CO(3-2). The spectroscopic redshifts of the three sources (zspec = 2.494, 2.503, 2.513) are all consistent with being at the same structure at z = 2.50. The CO(5-4) spectra and intensity map are shown in Figure 4.

Figure 4. ALMA and IRAM-NOEMA observations of the cluster core. ALMA 870 μm continuum map of the cluster core (20'' × 20''), overlaid with CO(5-4) emission line detections from IRAM-NOEMA. In total, five sources in the cluster are detected with ALMA, three of which are also detected in CO(5-4) with NOEMA. The ALMA and NOEMA beams are denoted by the small and large ellipses, respectively. The CO(5-4) line spectra for the three sources are shown in the right panel. The zero velocity of all the spectra corresponds to CO(5-4) at z = 2.5. The area filled with colors indicate the regions where positive emission is detected.
Download figure:
Standard image High-resolution image3.2. VLT/K-band Multi-object Spectrograph (KMOS)
Further near-infrared spectroscopic observation with the KMOS (Sharples et al. 2004, 2013) on the VLT was performed during P96 under ESO program 096.A-0891(A) (PI: Tao Wang) in 2015 December. KMOS is a multiplexed near-infrared integral-field spectroscopy system with 24 deployable integral field units over a 7 2 diameter field. The K-band filter was used to target the Hα emission line for candidate members at 2 < zphot < 3 in and around the overdensity. The K-band filter covers the wavelength range 1.9–2.4 μm, which corresponds to Hα at z ∼ 1.9 − 2.6. The spectral resolution in the K-band filter is around R ∼ 4200.
The observations were prepared with the KMOS Arm Allocator (KARMA; Wegner & Muschielok 2008) and each pointing was observed for 450 s using a standard object–sky–object dither pattern. The observations were taken in good conditions with a typical seeing of 0 6–08. The total on-source exposure time for each target is ∼1.5 hr. Data were reduced using the ESO pipeline (version 1.3.14) in combination with custom scripts developed by us.16
We detected 11 galaxies with signal-to-noise ratio (S/N) above 4 in Hα at z > 2 down to fHα ∼ 3 × 10⁻¹⁷ erg s−1 cm−2. Seven of them are at 2.494 ≤ zspec ≤ 2.512, which are consistent with being cluster members. The spectra of these seven galaxies are shown in Figure 5.
6–08. The total on-source exposure time for each target is ∼1.5 hr. Data were reduced using the ESO pipeline (version 1.3.14) in combination with custom scripts developed by us.16
We detected 11 galaxies with signal-to-noise ratio (S/N) above 4 in Hα at z > 2 down to fHα ∼ 3 × 10⁻¹⁷ erg s−1 cm−2. Seven of them are at 2.494 ≤ zspec ≤ 2.512, which are consistent with being cluster members. The spectra of these seven galaxies are shown in Figure 5.

Figure 5. Extracted and smoothed one-dimensional K-band KMOS spectra (left) and the corresponding S/N plot (right) for cluster members. The best-fit FWHM of each Hα line, which was used to smooth the spectra, is indicated in the right panels. All the listed sources are detected with an S/N > 5 except source 130359, which is detected at 4.9σ. Although in most cases we have detected only one line, given the range of their photometric redshifts (Table 1) we determined their redshifts assuming the line to be Hα. The position of the Hα line is indicated by the solid line, while dotted lines show the expected position of [N ii] as well as the [S ii] doublet.
Download figure:
Standard image High-resolution image3.3. VLA
Although our KMOS observation successfully detected a number of member galaxies, none of them are located in the core. This is likely caused by the fact that the DRGs in the core are severely attenuated. To obtain spectroscopic redshifts for these massive and dusty sources and also constrain their molecular gas content, we performed CO(1-0) Karl G. Jansky Very Large Array (JVLA) observations of the cluster core in 2015 December under VLA program 15B-290 (PI: Tao Wang). Observations were carried out in the D array at the Ka band. The WIDAR correlation was configured with four spectral windows (SPWs) of 64 channels and 2 MHz per channel resolution. The effective frequency coverage is 32.2–33.59 GHz, corresponding to z ∼ 2.43–2.58 for CO(1-0).
The nearby quasar J1024-0052 was used for gain and pointing calibration and the source 3C147 was used as flux calibrator. The effective integration time is ∼10 hr. The data were reduced using the Common Astronomy Software Application (CASA) package (McMullin et al. 2007) and were imaged using the CLEAN algorithm in CASA with a natural weighting scheme. More details on data reduction and molecular gas content of individual galaxies will be presented in a future work (T. Wang et al. 2016, in preparation). Eleven galaxies were detected in CO(1-0) down to integrated line fluxes 0.05 Jy km s−1, including all the 3 CO(5-4) detections by IRAM/NOEMA and 1 Hα detection by VLT/KMOS. Example CO(1-0) spectra of ALMA-detected galaxies in the cluster core are shown in Figure 6. Combining spectroscopic redshifts determined from IRAM-NOEMA and VLT/KMOS, we have in total spectroscopic redshifts for 21 galaxies extending up to ∼1 Mpc from the overdensity. Figure 7 shows the redshift distribution of these galaxies, which reveals a prominent spike at z ∼ 2.50. The biweight mean of the redshifts of these 21 galaxies yields zmean = 2.506 with 17 galaxies falling in the range zspec = 2.506 ± 0.012. The other five galaxies deviates from the mean by >3σ. The redshift histogram distribution around the biweight mean is well described by a Gaussian profile. A maximum likelihood estimation of the dispersion with the 17 galaxies yielded σz = 0.006, and all the 17 galaxies fall in zmean ± 3 ∗ σz, hence are classified as cluster members. Spectroscopic redshifts of these 17 galaxies are listed in Table 1.

Figure 6. Spectra of CO(1-0) emission for the four (out of five) ALMA detections that were detected in CO(1-0) with S/N > 5. The blue lines show the moving average of the spectra while the red lines show the best-fitting Gaussian profile.
Download figure:
Standard image High-resolution image
Figure 7. Redshift distributions of the galaxies in and around the overdensity. The histogram in red shows the redshift distribution for all DRGs within 2' from the core of the structure. DRGs with spectroscopic redshift are indicated by the line-filled histogram. The inner panel shows the redshift distribution of all the galaxies in and around the overdensity (including non-DRGs) with spectroscopic redshifts 2.45 < zspec < 2.55 from our spectroscopic surveys.
Download figure:
Standard image High-resolution imageTable 1. Measured Physical Properties of Spectroscopically Confirmed Members
| IDa | R.A. | Decl. | zzpec | zphot | J − Ks | log M* | Redshift Determination | Type |
|---|---|---|---|---|---|---|---|---|
| (J2000) | (J2000) | (M⊙) | ||||||
| 128484 | 150.22348 | 2.30719 | 2.495 | 2.55 | 0.70 | 10.82 | Hα | SF |
| 129305 | 150.23940 | 2.31750 | 2.512 | 2.65 | 0.71 | 10.19 | Hα | SF |
| 129444 | 150.24875 | 2.31921 | 2.510 | 2.57 | 1.59 | 10.77 | Hα | SF |
| 131661 | 150.23584 | 2.34488 | 2.501 | 2.64 | 1.57 | 11.03 | Hα | SF |
| 131864 | 150.23454 | 2.34770 | 2.511 | 2.64 | 0.53 | 10.38 | Hα | SF |
| 132636 | 150.22505 | 2.35620 | 2.510 | 2.55 | 0.49 | 10.68 | Hα | SF |
| 130359 | 150.22899 | 2.32978 | 2.507 | 2.47 | 1.93 | 11.26 | Hα, CO(1-0) | SF |
| 130842 | 150.23746 | 2.33612 | 2.515 | 3.04 | 1.77 | 11.12 | CO(1-0) | SF |
| 130891 | 150.23987 | 2.33645 | 2.513 | 2.68 | 2.09 | 11.06 | CO(1-0), CO(5-4) | SF |
| 130901 | 150.23923 | 2.33637 | 2.508 | 2.20 | 1.74 | 11.58 | CO(1-0) | SF |
| 130933 | 150.23869 | 2.33683 | 2.504 | 2.28 | 2.23 | 11.29 | CO(1-0) | SF (radio AGN) |
| 130949 | 150.23701 | 2.33571 | 2.503 | 2.49 | 1.66 | 11.57 | CO(1-0), CO(3-2), CO(5-4) | SF |
| 131077 | 150.23735 | 2.33814 | 2.494 | 2.82 | 1.39 | 11.16 | CO(1-0), CO(3-2), CO(5-4) | SF |
| 131079 | 150.23695 | 2.33748 | 2.502 | 2.57 | 1.46 | 11.36 | CO(1-0) | SF |
| 132044 | 150.23650 | 2.34881 | 2.504 | 2.35 | 1.47 | 11.13 | CO(1-0) | SF |
| 132627 | 150.23421 | 2.35659 | 2.506 | 2.36 | 1.34 | 10.90 | CO(1-0) | SF |
| ⋯b | 150.23419 | 2.33647 | 2.504 | ⋯ | 0.7 | 11.0 | CO(1-0) | SF |
Notes.
aIDs are from the Ks-selected catalog (Muzzin et al. 2013). bThis source is clearly detected in the UltraVista images, but is close to a low-redshift galaxy, hence it was not included in the Ks-selected catalog.Download table as: ASCIITypeset image
4. XMM-NEWTON AND CHANDRA IMAGING
We combined the latest Chandra and XMM-Newton surveys of the COSMOS field (Cappelluti et al. 2009; Elvis et al. 2009; Civano et al. 2016) to search for extended emission at a 16" spatial scale with wavelet-based detection techniques in the whole field. The depth of the Chandra and XMM-Newton survey reaches ∼160 and ∼60 ks per pointing, respectively. We co-added the XMM and Chandra background-subtracted count images and computed the total exposure. The procedure has been described in Finoguenov et al. (2009) and shown to work even to much longer exposures such as those of CDFS in Finoguenov et al. (2015). We used detailed background modeling developed and verified in previous works (Cappelluti et al. 2013; Erfanianfar et al. 2013; Finoguenov et al. 2015). A number of significant detections (>4σ) associated with galaxy overdensities at high redshift were discovered (A. Finoguenov et al. 2016, in preparation). The cluster reported in this paper exhibits the most prominent galaxy overdensity which is also in the most advanced stage of follow-up observations.
At the position of the cluster we did not detect any significant emission on scales smaller than 16'' (Figure 8), which eliminates the possibility of a point-source origin of the X-ray emission. With the selected detection threshold of 4σ, the possibility of detecting such a source by chance in the Chandra COSMOS survey can be rejected at 99.5% confidence. Roughly 90% of the 4σ detections are associated with a galaxy overdensity (down to Ks < 23.4), with the one discussed in this paper being the most extreme case. The extended X-ray emission, together with the high number of matching spectroscopic redshifts, safeguards the detection from being a mere projection on the sky.

Figure 8. X-ray detections (>4σ at 0.5–2 kev) in the combined Chandra and XMM-Newton images on the 16'' (left and middle) and 1''–8'' scales (right). The left panel shows a larger region (0 4 × 04) while the middle and right panels show the central 2' × 2' region around the cluster core. In the right panel, it is clear that the cluster does not have any significant detection at smaller scales. The blue contours indicate the extended emission of the cluster detected on the 16'' scale.
Download figure:
Standard image High-resolution imageIn order to derive the X-ray flux of the cluster, we used two apertures of radius 20'' and 32''. The 20'' aperture matches the extent of the detection while the 32'' aperture matches the expected size (r500c) of the emission of the cluster, albeit with lower S/N. After a standard background subtraction, we measured the net counts in the soft-band image (0.5–2 keV) for the small and large apertures, which are 57 ± 15 and 78 ± 23, respectively. To determine the total flux of the cluster, we started from the flux encompassing these two apertures and iteratively extrapolated them to r500c. This iterative procedure is fully described in Finoguenov et al. (2007). In each step a correction factor is applied to the aperture flux assuming a β-model of the cluster brightness profile and an initial guess of r500c, then a new r500c is estimated and a new correction factor is applied until it converges. The final estimate of r500c of the cluster is 24'' (or ∼185 kpc at z = 2.5), and the total flux within r500c determined based on the two apertures are 5.4 ± 1.4 × 10⁻¹⁶ and 6.9 ± 2.0 × 10⁻¹⁶ erg cm−2 s−1, respectively. The differences in the extrapolated estimates from the two apertures are attributed to the systematic errors and are small compared to the expected scatter in the LX–Mhalo relation of ∼20% in mass for our method (Allevato et al. 2012). Since the 32'' aperture is larger than the final estimate of r500c, no flux extrapolation is needed. We hence take the flux measured from the 32'' aperture as our total flux estimate. This flux translates to an X-ray luminosity of L0.1–2.4 keV = 8. 8 ± 2.6 × 1043 erg s−1 at z = 2.5 with a K-correction from 0.5 to 2 keV to rest-frame 0.1–2.4 keV of 2.66. This X-ray luminosity measured in r500c is also used for calibrating the X-ray luminosity, LX, to weak lensing mass at redshifts up to 1 (Leauthaud et al. 2010).
While the non-detection at smaller scales suggests that the X-ray flux does not originate from a single galaxy, we investigate the possible contribution from combined star formation activities of the member galaxies. The aggregated infrared luminosity estimated from the combined infrared flux in the core, 1013.2 L⊙, translates to an X-ray luminosity L0.5–2 kev = 1.26 × 1043 erg s−1 assuming the calibrated  relation (Ranalli et al. 2003). Therefore we estimate that at most ∼14% of the X-ray flux originates from star formation.
We also examine the possibility that the extended X-ray emission originated from inverse Compton (IC) scattering of the cosmic microwave background photons by relativistic electrons in the central radio source. We argue that this is unlikely to be the case. The few structures/galaxies with extensive IC extended X-ray emission are mostly strong and extended radio galaxies (usually with strong jets, Fabian et al. 2003; Overzier et al. 2005; Johnson et al. 2007), with radio fluxes one to two orders of magnitudes higher than the central, point-like radio source of this structure. If we assume that the extended X-ray emission is fully produced through IC emission form the central radio source (ID 130933), we find that the resulting magnetic field is ∼0.5 μG (Harris & Grindlay 1979), assuming a spectral slope of −1 for the radio emission. This magnetic field strength is significantly lower (radio emission is too weak compared to the X-ray emission) than the estimates for IC-origin structures in the literature, 30 ∼ 180 μG (Overzier et al. 2005). Although there is still a possibility that the X-ray emission is due to an IC ghost/fossil jet of the central radio source (in this case, the source of the IC scattering is an older population of electrons, with a steeper spectral slope, from a previous outburst of the radio source), the non-detection of this structure at 324 MHz (3σ upper limit ∼1.5 mJy, Smolčić et al. 2014) suggests that the spectral index is less steep than ∼−2. Further deeper follow-up at low frequencies would be required to fully exclude this hypothesis, which is quite challenging with current facilities.
5. CL J1001: A YOUNG GALAXY CLUSTER AT z = 2.506
The high density of massive galaxies, extended X-ray emission, and velocity dispersion of this overdensity suggest that it is embedded in a collapsed, cluster-sized halo, and hence a bona fide galaxy cluster. At a redshift of z ∼ 2.506, it is the most distant, spectroscopically confirmed galaxy cluster, which pushes the formation time of galaxy clusters ∼0.7 Gyr back in cosmic time compared to previously discovered clusters (Gobat et al. 2011). In this section we further explore the structure and mass of CL J1001, and compare these properties to simulations.
5.1. Structure and Masses of CL J1001
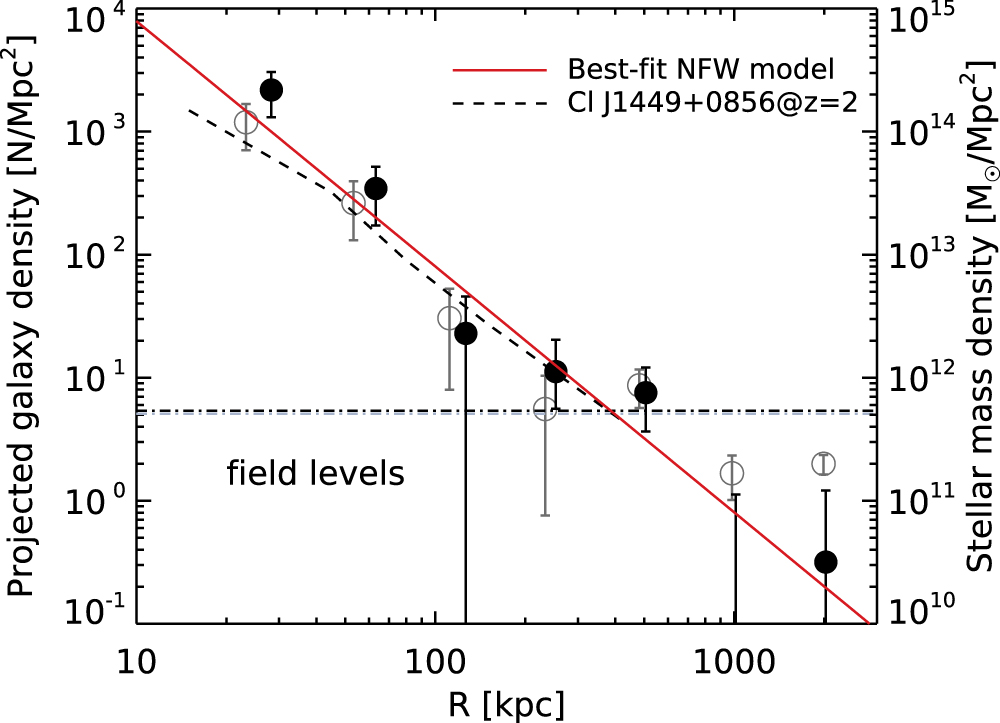
On large scales, this dense galaxy concentration is surrounded by a wider overdensity of DRGs at zphot ∼ 2.50 ± 0.35 extending up to ∼1 Mpc (Figure 9). The mass density profile of this structure, as calculated from these DRGs, resembles that of CL J1449+0856, a mature X-ray cluster with a total mass of M200c ∼ 6 × 10¹³ M⊙ at z ∼ 2 (Strazzullo et al. 2013). The best-fitting projected NFW (Navarro et al. 1997) profile of this structure is consistent with a single logarithmic slope of −3, suggesting that its host halo has a relatively high concentration, consistent with what has been observed in z ∼ 1 clusters (van der Burg et al. 2014). This provides further evidence of the existence of a virialized, cluster-sized halo of this structure. The absolute normalization of its mass density profile is most likely higher than Cl J1449+0856, since our Ks-selected catalog is only complete down to M* = 1011M⊙ while the profile for Cl J1449+0856 was derived using a galaxy catalog complete down to 1010 M⊙.

Figure 9. Projected numbers (open circles) and mass densities (filled circles) of DRGs extending to ∼2 Mpc from the overdensity. The average number and mass densities of field DRGs, as denoted by the gray and black horizontal lines, have been subtracted from the data points. The best-fitting projected NFW profile, which has a scale radius of  kpc, is shown by the red line. The stellar mass density profile of the mature X-ray cluster Cl J1449+0856 at z = 2 (Gobat et al. 2011; Strazzullo et al. 2013) is shown as the dashed line.
Download figure:
Standard image High-resolution imageWe estimated the total halo mass of CL J1001 with three different methods, which are based on the X-ray luminosity, velocity dispersion, and the stellar mass content, respectively. Using the established LX–Mhalo correlation in Leauthaud et al. (2010), the total X-ray luminosity of CL J1001, L0.1–2.4 keV = 8.8 ± 2.6 × 1043 erg s−1, corresponds to a total halo mass M200c ∼ 1013.7±0.2 M⊙, which is comparable to that of the mature galaxy cluster CL J1449+0856 at z ∼ 2 (Gobat et al. 2011). While the redshift evolution in the LX–Mhalo scaling relation used here is based on studies of clusters at z < 1, similar studies including more distant clusters yield consistent redshift evolution up to z ∼ 1.5 (Reichert et al. 2011). The same scaling relation was also shown to be valid at z ∼ 2 based on comparisons of the halo masses inferred from clustering analysis and stacked X-ray signals (Béthermin et al. 2014). Moreover, most of the detected deviations in the expected evolution in the LX–Mhalo relation is driven by the evolution of the cool cores (Reichert et al. 2011). We assume 10% of the emission to come from the cool core, which is typical for clusters studied in Leauthaud et al. (2010). Given the absence of the detection on smaller scales, a dominant contribution of the cool core to the total luminosity of this cluster can be ruled out.
Galaxy cluster velocity dispersion provides another reliable tool for measuring cluster mass (Evrard et al. 2008; Munari et al. 2013; Saro et al. 2013). But we also note the large uncertainties in estimating mass for an individual cluster with velocity dispersion due to the influence of large-scale structure in and around clusters (White et al. 2010). The cluster redshift, z = 2.506, is determined by the biweight average of the 17 spectroscopic members. The galaxy proper velocities vi are then derived from their redshifts zi by  (Danese et al. 1980). The line of sight velocity dispersion σv is the square root of the biweight sample variance of proper velocities (Beers et al. 1990; Ruel et al. 2014), which is estimated to be σv = 530 ± 120 km s−1. Using the relation between velocity dispersion and total mass suggested in Evrard et al. (2008),

with  the normalization at mass 1015 M⊙ and α the logarithmic slope, we derived the total mass of CL J1001 to be M200c ∼ 1013.7±0.2 M⊙ using the canonical value of
  ∼ 1083 km s−1 and α ∼ 0.336.17
This estimate of the total mass is in good agreement with that derived from X-ray. We are aware that the sample used to estimate the velocity dispersion only includes SFGs. However, given that this cluster is dominated by SFGs (at at least M* > 1011 M⊙, where our sample is complete), we do not expect that including quiescent galaxies would change significantly the velocity dispersion estimation. Nevertheless, we are planning to spectroscopically confirm more member galaxies (including the quiescent ones) with follow-up observations, which will further improve the accuracy of the velocity dispersion estimation.
∼ 1083 km s−1 and α ∼ 0.336.17
This estimate of the total mass is in good agreement with that derived from X-ray. We are aware that the sample used to estimate the velocity dispersion only includes SFGs. However, given that this cluster is dominated by SFGs (at at least M* > 1011 M⊙, where our sample is complete), we do not expect that including quiescent galaxies would change significantly the velocity dispersion estimation. Nevertheless, we are planning to spectroscopically confirm more member galaxies (including the quiescent ones) with follow-up observations, which will further improve the accuracy of the velocity dispersion estimation.
Studies of galaxy clusters at z ∼ 0–1.5 show that the total stellar mass content is well correlated with the halo mass (van der Burg et al. 2014), hence providing another tool to infer the cluster mass. To calculate the total stellar mass of the cluster we need to determine which galaxies are actual cluster members. Since not all the galaxies have spectroscopic redshifts, we have to rely on photometric redshifts determined by Muzzin et al. (2013). Based on the 20 galaxies with spectroscopic redshifts at 2 < z < 3, the normalized median absolute deviation (σnmad18
, Brammer et al. 2008) of  is σNMAD ∼ 0.033. Hence we define galaxies with redshifts with
  as candidate members. We added stellar masses for all the DRGs (∼50% have spectroscopic redshifts) with this redshift range within R200c for a halo of M200c ∼ 1013.7 M⊙ to determine the total stellar mass content. Field contamination is further estimated and subtracted based on the average surface number/mass density of DRGs in COSMOS at this redshift range.
The stellar mass of individual galaxies was derived from SED fitting with FAST (Kriek et al. 2009). We fit the UV to 4.5 μm photometry with the Bruzual & Charlot (2003) stellar population synthesis models, assuming solar metallicity and exponentially declining star formation histories with e-folding times τ ∼ 0.1–10 Gyr. We allowed the galaxies to be attenuated with AV = 0–6 with the Calzetti (Calzetti et al. 2000) attenuation law. The mass estimate is in good agreement with those calculated by Muzzin et al. (2013) considering the small differences in the spectroscopic redshift used here and photometric redshifts used in their work. The median stellar mass of the 11 DRGs in the core is  with the two most massive ones reaching
  . As a reference, for a DM halo of M200c ∼ 1013 M⊙ (with a virial radius R200c ∼ 186 kpc) models expect only one galaxy as massive as M* ∼ 1011.2 M⊙ at z ∼ 2.5 (Behroozi et al. 2013), suggesting that this overdensity resides in a very massive halo.
We estimated the halo mass of this structure based on the stellar mass-to-total halo mass relation calibrated for z ∼ 1 clusters (van der Burg et al. 2014). If we add DRGs with M* > 1011 M⊙ (where our sample is 90% complete), and do not apply any correction for mass incompleteness, we derive a combined stellar mass M* ∼ 2.1 × 10¹² M⊙ after correction for field contamination, which is <10%. If instead we correct for the incompleteness and extrapolate down to 109 M⊙ by assuming the same stellar mass function as that in the field as determined from the CANDELS fields (Grogin et al. 2011; Koekemoer et al. 2011; Schreiber et al. 2015), we derived a total stellar mass M* ∼ 4.3 × 10¹² M⊙, suggesting M200c ∼ 1014.6 M⊙. The true halo mass is most likely between the two estimates considering that massive galaxies tend to be more abundant in clusters than in the field (hence a smaller correction factor when extrapolated to lower stellar mass) as shown at z ∼ 1 (van der Burg et al. 2013). Therefore, we estimate that the total mass of the halo is in the range of M200c ∼ 1013.7–14.6 M⊙. Combined with the mass estimate based on X-ray and velocity dispersion, our best estimate of the halo mass is M200c = 1013.9±0.2 M⊙.
5.2. Comparison with Simulations
We conclude that we have found a massive galaxy concentration embedded in a virialized, cluster-sized halo at z = 2.506. Halos of similarly high masses at these redshifts are predicted to be very rare in the Λ-CDM framework. The cumulative number of DM halos with z > 2.5 and M200c > 1(0.5) × 1014M⊙ expected in the COSMOS field is 0.01(0.3) with Planck cosmology (twice lower using WMAP 7 cosmology) (Murray et al. 2013; Planck Collaboration et al. 2015). More accurate halo mass estimates and more similarly massive structures at high redshifts are hence required to put stringent constraints on our cosmological model.
To understand properties of this cluster in a cosmological context, we have searched similar structures in mock catalogs for light cones (Henriques et al. 2012, 2015) constructed for the semi-analytic galaxy formation simulation of Guo et al. (2011), which were built on merger trees from large DM simulations, the Millennium Simulation (Springel et al. 2005) and Millennium-II (Boylan-Kolchin et al. 2009) Simulation. These mock catalogs include in total a ∼47 times larger area than the COSMOS field. We have extracted all the friends-of-friends halos at z = 2.5 ± 0.2 exceeding M200c = 1013 M⊙. We then derived the total stellar mass of galaxies with M* > 1011 M⊙ in each halo, and present this total stellar mass versus halo mass in Figure 10. The stellar mass content of CL J1001 appears significantly higher, by a factor of ∼4, than those of similarly massive halos in simulations. This may indicate that the stellar mass build-up in massive clusters at z > 2, at least for the most massive galaxies, is more rapid than what was predicted in simulations and semi-analytical models. Alternatively, it may suggest that structures like CL J1001 are extremely rare and are not present even in today's largest cosmological simulations.

Figure 10. Stellar mass content vs. total halo mass for massive halos at z = 2.5 ± 0.2 from mock catalogs. The total stellar masses are calculated for galaxies with Ks < 23.4 mag and M* > 1011 M⊙ within R200c of the halo center, as defined as the most massive galaxy in each halo. The data point for each halo is color-coded by the number of member galaxies with M* > 1011 M⊙. The purple dashed line indicates the best linear fit of the stellar mass-to-halo mass relation based on the data points. The stellar mass estimate for CL J1001 and its uncertainties are denoted by the red dashed lines. The red star indicates our estimate of the halo mass and total stellar mass (also only accounting for galaxies with M* > 1011 M⊙) for CL J1001.
Download figure:
Standard image High-resolution imageBased on the evolution of the mass of the most massive progenitor halo in simulations (Springel et al. 2005; Chiang et al. 2013), a massive halo with M200c ≳ 1013.9 M⊙ at z = 2.5 will evolve into a ∼2 × 10¹⁵ M⊙ halo at z = 0, i.e., a "Coma"-type cluster (M200c > 1015 M⊙). As shown in these simulations, the main progenitor (the most massive halo) of a "Coma"-type cluster at z > 2 is embedded in a large-scale filamentary structure spreading over several tens of Mpc. Hence if CL J1001 will evolve into a "Coma"-type cluster at z ∼ 0, then the presence of a large-scale galaxy structure around its position is expected. Indeed, a large-scale filamentary structure at z ∼ 2.47 whose geometric center coincides with CL J1001 was recently spectroscopically confirmed in the same field (Casey et al. 2015). The same region has also been identified as a protocluster candidate at similar redshifts based on photometric redshifts (Chiang et al. 2014). The redshift difference (2.47 versus 2.50) corresponds to a comoving line of sight distance of ∼35 Mpc, which is consistent with the extension of the progenitor of a massive cluster at these redshifts. The presence of this ∼30 Mpc scale overdensity surrounding CL J1001 provides further evidence that it will eventually form a massive, "Coma"-type galaxy cluster in the present day universe.
6. PROPERTIES OF MEMBER GALAXIES
6.1. Star Formation and Supermassive Black Hole Accretion in the Cluster Core
While the halo mass and peak galaxy density of CL J1001 already resemble those of low-redshift mature clusters, member galaxies in the core of CL J1001 show unusual star formation properties compared to previously discovered clusters, as indicated by the exceptional far-infrared (FIR) and millimeter emission in the core. Using the total infrared flux densities measured in the core, we conducted an infrared SED fitting to derive its infrared luminosity in order to estimate the combined SFRs of the massive galaxies in the core. To keep the SED fitting simple, we fit the 250 μm to 1.1 mm data points with an FIR SED consisting of a coupled single-dust-temperature blackbody and mid-infrared power law described in Casey (2012). We have also fitted the SED with the Chary & Elbaz (2001) infrared SED templates. The two methods yielded similar results, LIR = 1013.2±0.1 L⊙. This infrared luminosity translates to an SFR of ∼3400 M⊙ yr−1 based on the calibration in Kennicutt (1998). Such high SFRs were seen in some of the protoclusters at high redshifts (Daddi et al. 2009); however, these are quite unusual for a structure with such a high concentration of massive galaxies, whose peak massive galaxy density is already comparable to that of mature clusters at lower redshifts.
We also derived the dust mass in the cluster core from the best-fit graybody templates of the combined SED. During the fit, the dust emissivity index is fixed at β = 1.5 to reduce the number of free parameters. We then converted dust masses into gas masses assuming a metallicity determined from the mass–metallicity relation at z = 2.5 (Erb et al. 2006). For the conversion we assumed a metallicity corresponding to a galaxy with M* ∼ 1011.2 M⊙, the median mass of the 11 DRGs in the core. The total dust mass is then calculated to be Mdust = 109.3±0.1 M⊙, translated to a molecular gas mass of Mgas = 5 ± 1 × 10¹¹ M⊙. This large amount of molecular gas and the high current SFR suggest that the cluster core is still actively assembling its stellar mass and will increase its mass substantially in a short timescale despite the fact that its current stellar mass density (or the number of massive galaxies) is already comparable to that of mature clusters.
Only 2 out of the 11 DRGs in the 80 kpc core are classified as quiescent galaxies based on the rest-frame UVJ diagram (Williams et al. 2009). Figure 11 shows the quiescent fraction at M* > 1011 M⊙ as a function of clustercentric radius for massive galaxies in CL J1001, as well as for two X-ray clusters, ClJ1449+0856 and JKCS 041, at z ∼ 2. Unlike ClJ1449+0856 and JKCS 041, which show a quiescent fraction of 70%–100%, the quiescent fraction in CL J1001 is significantly lower, ∼20%, indistinguishable from that in the field at the same redshifts.

Figure 11. Fraction of galaxies classified as quiescent as a function of clustercentric radius. The quiescent fraction at M* > 1011 M⊙ in this structure as well as two mature clusters at z ∼ 2 (CI J1449+0856 and JKCS 041) are shown. The quiescent fraction is calculated for two radial bins of clustercentric radius (r < 150 kpc and 150 < r < 700 kpc), with the number of galaxies used to calculate this fraction indicated at each data point. Error bars are 1σ confidence level for binomial population proportions. The shaded region indicates the quiescent fraction at the same stellar mass at z = 2.5 ± 0.3 for field galaxies, which was derived from the CANDELS and 3D-HST (Brammer et al. 2012) survey.
Download figure:
Standard image High-resolution imageThe rich available data set in this structure allows us to probe further star formation properties of individual galaxy members. In particular, for the five ALMA detections, we performed a-prior-based PSF fitting using FASTPHOT (Béthermin et al. 2010) at shorter wavelengths, i.e., 24, 100, and 160 μm, to obtain the full far-infrared SEDs. We then estimated LIR by fitting their infrared SEDs across 24 μm, 100 μm, 160 μm, 870 μm, and 1.8 mm bandpasses using the same method as we did for the combined SED. Figure 12 shows the best-fit infrared SEDs for the five galaxies detected with ALMA, as well as the combined infrared and millimeter emission in the cluster core. The derived LIR are listed in Table 2. All the five ALMA detections have  . Based on the Kennicutt (1998) relation, the LIR of these five galaxies adds up to an SFR ∼ 2700 M⊙ yr−1, which is consistent with our SFR estimation using the combined infrared SED (3400 M⊙ yr−1) considering that some of the star-forming members are not detected with ALMA. For non-ALMA detected sources in the cluster core, we estimated their SFR based on SED fitting results with FAST.

Figure 12. Infrared SEDs for the five candidate members with ALMA 870 μm detections. The colored solid lines show the SED fitting results for the five ALMA detections while the black line shows the SED fitting result for the combined flux densities in the core. The 3σ upper limits for non-detections at 100 μm, 160 μm, and 1.4 GHz are shown.
Download figure:
Standard image High-resolution imageTable 2. Infrared and Radio Properties of Member Galaxies Detected with ALMA
| IDa | S24 μm | S100 μm | S160 μm | S250 μm | S350 μm | S500 μm | S870 μmb | S1.1 mm | S1.8 mm | S1.4 GHz | log LIR |
|---|---|---|---|---|---|---|---|---|---|---|---|
| (mJy) | (mJy) | (mJy) | (mJy) | (mJy) | (mJy) | (mJy) | (mJy) | (mJy) | (μJy) | (L⊙) | |
| 130891 | 0.15 ± 0.01 | <4.5 | <9.8 | ⋯ | ⋯ | ⋯ | 3.77 ± 0.32 | ⋯ | 0.39 ± 0.07 | 40 ± 13 | 12.6 ± 0.15 |
| 130901 | 0.04 ± 0.01 | <4.5 | <9.8 | ⋯ | ⋯ | ⋯ | 2.23 ± 0.41 | ⋯ | <0.2 | <40 | 12.1 ± 0.15 |
| 130933 | 0.06 ± 0.01 | <4.5 | <9.8 | ⋯ | ⋯ | ⋯ | 1.66 ± 0.21 | ⋯ | 0.24 ± 0.07 | 81 ± 15 | 12.2 ± 0.15 |
| 130949 | 0.17 ± 0.02 | <4.5 | <9.8 | ⋯ | ⋯ | ⋯ | 1.69 ± 0.25 | ⋯ | 0.09 ± 0.07 | <40 | 12.5 ± 0.15 |
| 131077 | 0.28 ± 0.02 | 6.3 ± 1.7 | 20.1 ± 2 | ⋯ | ⋯ | ⋯ | 5.26 ± 0.26 | ⋯ | 0.63 ± 0.07 | 78 ± 13 | 12.8 ± 0.10 |
| cluster core | ⋯ | ⋯ | ⋯ | 61 ± 6 | 77 ± 6 | 66 ± 6 | 14.8 ± 2 | 8.9 ± 2 | ⋯ | ⋯ | 13.2 ± 0.1 |
Notes.
aIDs are from the Ks-selected catalog (Muzzin et al. 2013). bFlux densities for individual galaxies at 870 μm are from Bussmann et al. (2015), while the combined flux (at a slightly different wavelength, 850 μm) in the core is from Casey et al. (2013).Download table as: ASCIITypeset image
Figure 13 presents the stellar mass–SFR relation for galaxies in CL J1001 and their comparison with field galaxies. The two brightest ALMA detections, or 25% (2/8)19 in terms of fraction, have SFR ∼4 times higher than the main-sequence SFGs at the same mass, indicating an elevated starburst activity in this structure (this starburst fraction is ∼3%–5% in field galaxies; Elbaz et al. 2011; Rodighiero et al. 2011; Schreiber et al. 2015). Averaging over all the star-forming members (as shown by the filled stars in Figure 13), the mean SFR versus stellar mass relations for these cluster SFGs fall on the same relation within uncertainties as galaxies in the field.

Figure 13. SFR–stellar mass relation for the 13 member galaxies in the cluster core (within 10''). Filled circles denote galaxies that are classified as star-forming, while open circles are galaxies classified as quiescent based on the rest-frame U − V vs. V − J diagram. Galaxies that are detected at 870 μm with ALMA, CO(1-0) with JVLA, and CO(5-4) with IRAM-NOEMA are respectively denoted by red filled circles, blue open triangles, and purple open squares. SFRs for ALMA 870 μm detected sources are derived from their infrared luminosity while the others are from UV to NIR SED fitting. The main sequence of field star-forming galaxies at z ∼ 2.5 and associated 0.3 dex and 0.6 dex scatter (Schreiber et al. 2015) are shown with orange lines. The filled stars indicate the mean value for the star-forming members in two mass bins separated at M* = 1011 M⊙.
Download figure:
Standard image High-resolution imageMoreover, 3 out of the 11 DRGs are detected at 1.4 GHz with F1.4 GHz ∼ 70–80 μJy though none are detected in X-rays. Two of them are classified as radio AGNs based on their larger radio-to-IR luminosity ratio than that for normal SFGs. This (radio) AGN fraction (∼18%) is is much higher than that in the field (≲3.8%, assuming that all the DRGs with 1.4 GHz detections down to F1.4 GHz ≳ 50 μJy are radio AGNs), suggesting enhanced radio AGN activities in this dense structure.
6.2. Structural Properties of Member Galaxies
We studied structural properties of cluster member galaxies using HST/WFC3 J110 image (711.74 s integration time) from the HST archive (PI: M. Negrello). Data were reduced using the IRAF MultiDrizzle package (see Negrello et al. 2014 for further details). With the algorithm GALFIT (Peng et al. 2010) we fitted the galaxy light distribution with a single Sérsic law (Sérsic 1968). Uncertainties associated with re measurements were derived through Monte Carlo simulations by fitting simulated galaxies that were injected into the real image.
The J110 band corresponds to rest-frame ∼3300 Å at z ∼ 2.5. To make a proper comparison with other studies, we corrected this size to rest-frame 5000 Å following an empirically calibrated morphological k-correction relation for quiescent and SFGs in the CANDELS fields (van der Wel et al. 2014). Both corrections are relatively small and our conclusion remains unchanged with and without applying this morphological k-correction.
We show the mass–size relation of candidate cluster members in Figure 14. At M* > 1011 M⊙ both quiescent and star-forming members fall on the mass–size relation for field quiescent galaxies, which are more compact than their local counterparts. The fact that the quiescent members in CL J1001 are as compact as those in the field differs from what has been found in a number of mature clusters at z ∼ 1–2 (Papovich et al. 2012; Bassett et al. 2013; Strazzullo et al. 2013; Delaye et al. 2014; Newman et al. 2014), in which the quiescent galaxies are less compact than their field counterparts (so-called accelerated evolution of the mass–size relation in clusters). This is consistent with the fact that CL J1001 was caught in an earlier phase of cluster formation (right after the collapse of the cluster-sized halo), when the cluster environment had not yet affected the structural evolution. On the other hand, in contrast to the mass–size relation for SFGs in the field, most of the massive star-forming members in CL J1001 are significantly smaller and fall on the same mass–size relation as quiescent galaxies. This indicates that these cluster SFGs are promising progenitors of quiescent galaxies and may soon be quenched.

Figure 14. Mass–size relation for quiescent and star-forming candidate members of the structure. Galaxies within R < 150 kpc from the core are denoted by filled circles, while those within 150 < R < 700 kpc are denoted by open circles. UVJ-quiescent galaxies are shown in red, while UVJ-star-forming galaxies are shown in blue. The mass–size relations for quiescent and star-forming field galaxies at z ∼ 2.5 (van der Wel et al. 2014) are shown with red and blue lines, respectively. The 1σ scatter of the mass–size relation for field quiescent galaxies is shown with red dashed lines. The large error bar in the bottom right indicates typical uncertainties of mass and size measurements of our sample galaxies. The mass–size relation for the nearby Coma cluster is indicated with the dotted line (Andreon 1996).
Download figure:
Standard image High-resolution image7. DISCUSSION: IMPLICATIONS OF CL J1001 ON THE FORMATION OF MASSIVE CLUSTERS AND THEIR MEMBER GALAXIES
With the presence of both a massive, collapsed halo and a predominant population of massive SFGs, CL J1001 provides a rare chance to study the rapid build-up of a dense cluster core. The discovery of structures in such a phase itself helps to bridge the gap between previously discovered photoclusters and clusters at high redshift. Its properties provide new insights into when and how massive cluster ellipticals formed at high redshift.
Despite the presence of a cluster-like environment (including both a collapsed massive halo and a high concentration of massive galaxies in the core), the fraction of galaxies that are classified as quiescent in CL J1001 at M* > 1011 M⊙ is estimated to be less than ∼20%. This quiescent fraction is similar to that in the field and is significantly lower than that in known z ∼ 2 mature clusters, suggesting that most central cluster galaxies will be quenched only after they accrete onto the cluster. This is different from the "pre-processing" scenario in which galaxies are quenched in groups or large-scale filaments prior to cluster assembly, due to, e.g., strangulation. We speculate that this might be due to the fact that at high redshifts, only a small fraction of cluster galaxies were accreted onto the final cluster halo as a member of a group-sized halo with M200c > 1013 M⊙, as suggested by simulations (Balogh et al. 2009; McGee et al. 2009). Moreover, simulations suggest that cold streams can penetrate moderately massive, group-sized halos with M200c ∼ 1013 M⊙ at z ≳ 2 (Dekel & Birnboim 2006), which makes it difficult to fully quench protocluster galaxies even if they were located in a group-sized halo before their accretion onto the cluster. These arguments are also consistent with the fact that there is no clear evidence for suppressed star formation or an elevated quiescent fraction in protocluster regions. In fact, based on current studies of z ≳ 2 protoclusters, star formation in protoclusters seems to be elevated (Casey 2016) rather than suppressed compared to field galaxies.
We caution that while many studies of high-redshift protoclusters observed a high volume density of highly SFGs or dusty galaxies (detected down to some flux level in the far-infrared or submillimeter), it is unclear whether this is caused by elevated SFRs in individual galaxies or simply caused by the fact that there are more massive galaxies in protocluster regions. A thorough examination of the mass–star formation relation as well as the relative fraction of quiescent and SFGs in protocluster regions, and its comparison to field galaxies, is required to obtain solid conclusions. This is, however, quite difficult for protoclusters due to their extended region (several tens of Mpc) and lower significance of galaxy overdensities, which inhibit a census of its member galaxies (particularly quiescent ones). Moreover, simulations suggest that a significant fraction of protocluster galaxies may not end up in clusters at z ∼ 0, especially those low-mass galaxies in the outskirts (Contini et al. 2016). This makes it more complicated to compare observations of protoclusters and simulations.
Although the current observed quiescent fraction in CL J1001 is similar to that in the field, several pieces of evidence suggest that this fraction will increase over a short timescale. The total molecular gas mass for galaxies in the core is estimated to be Mgas ∼ 5 × 10¹¹ M⊙ (Section 6). Considering their current SFR, this structure will consume all the available gas within ∼150–200 Myr (twice larger if using Chabrier IMF for the stellar mass estimation). The halo mass of this structure (∼1014 M⊙) falls in the regime where the infalling gas is fully shock-heated instead of forming cold streams (Dekel & Birnboim 2006). These properties suggest that the cluster will likely form a predominant population of quiescent galaxies in the core by z ∼ 2.2. Moreover, most of the massive SFGs in the core already fall on the mass–size relation of quiescent galaxies at the same redshift (Figure 14), providing further evidence that these galaxies may soon transform into quiescent galaxies.
Compared to field galaxies, massive galaxies in the core of CL J1001 exhibit a higher starburst fraction, suggesting that cluster ellipticals may form their stars through more violent starbursting events and in shorter timescales than field galaxies. This is consistent with galaxy cluster archeology studies (Thomas et al. 2005). This high starburst fraction may be partly due to a higher merger rate, as expected for this high density region with moderate velocity dispersion. Indeed, one of the starbursting galaxies (ID 130949) appears to be a complex multi-component galaxy system in the high-resolution WFC3 J110 image while the other one (ID 131077) is completely undetected due to obscuration and the shallow depth of J110 imaging (Figure 15). The high starburst fraction could be also caused by the compression on the molecular gas in galaxies by the hot intracluster medium (IGM), which could trigger the collapse of molecular clouds and lead to efficient star formation within a short timescale (Fujita & Nagashima 1999; Bekki & Couch 2003). Deeper WFC3 imaging in the rest-frame optical and spatially resolved distribution of both star formation and molecular gas are required to provide further insights into these questions, which we defer to a future work.

Figure 15. HST/WFC3 J110-band stamp images of the two massive starbursts in the cluster core. The crosses mark the source positions in the UltraVista Ks-band.
Download figure:
Standard image High-resolution image8. CONCLUSION
We conclude that we have found a massive galaxy overdensity at z = 2.506, which is likely to be the most distant X-ray cluster known to date. This overdensity is embedded in a collapsed, cluster-sized halo as suggested by its high density of massive galaxies in the core, extended X-ray emission, cluster-like mass density profile, and velocity dispersion of member galaxies. Moreover, this structure exhibits both a high SFR density and a predominant population of massive SFGs in the core, indicating that it is in a major formation phase for the central massive cluster galaxies when most of them have not been quenched. These properties differentiate this structure from other structures recently discovered at similar redshifts and suggest that it may represent the missing link between mature clusters and protoclusters. The following are our findings on its main properties and its implications for cluster formation.
1. The structure was identified as the most significant overdensity of DRGs in COSMOS with 11 DRGs distributed over an 80 kpc region. It is also the brightest Herschel/SPIRE source (unresolved) in the central COSMOS region covered by the CANDELS-Herschel survey with flux densities 60–80 mJy in the SPIRE bands.
2. Extensive follow-up observations with IRAM-NOEMA, VLT/KMOS, and JVLA spectroscopically confirmed 17 members including 7 DRGs in the core. Based on these 17 members, the cluster redshift is determined to be z = 2.506 with a velocity dispersion of 530 ± 120 km s−1.
3. Combining XMM-Newton and Chandra observations of the field, the overdensity exhibits extended X-ray emission at the 4σ confidence level with an X-ray luminosity L0.1–2.4 keV = 8. 8 × 1043 erg s−1. The X-ray luminosity, the velocity dispersion, and the stellar mass content of this structure all suggest a total halo mass of M200c = 1013.9±0.2 M⊙.
4. The structure exhibits a high star formation density in the 80 kpc core with a combined SFR ∼3400 M⊙ yr−1 and a gas depletion time of ∼200 Myr. Galaxies in the core show both elevated starburst activities and supermassive black hole accretion compared to field galaxies.
5. The core of this structure is dominated by SFGs with only 2 out the 11 DRGs classified as quiescent galaxies. At M* > 1011 M⊙ the quiescent fraction is around ∼20% without significant dependence on the clustercentric distance up to ∼700 kpc from the core. This quiescent fraction is similar to field galaxies at the same redshift and significantly lower than that in previously discovered mature clusters at z ∼ 2.
6. At the massive end (M* > 1011 M⊙), both quiescent galaxies and star-forming ones in the core of the structure appear to be compact, which is consistent with the mass–size relation for quiescent galaxies in the field.
One of the most prominent features of this structure is the presence of both a collapsed, cluster-sized halo and a high abundance of massive, highly SFGs. Its discovery suggests that most cluster ellipticals likely formed only after their accretion onto a cluster-sized halo, though more similar structures are needed to confirm. Recently a number of Planck sources with high Herschel/SPIRE fluxes have been discovered and are likely to be z ≳ 2 (proto)cluster candidates (Planck Collaboration et al. 2015), some of which may be in massive halos similar to this structure, although further follow-up observations are needed for detailed comparisons. Future studies of a large number of similar structures will definitively clarify the formation path of massive galaxy clusters and provide critical constraints on cosmology.
We thank the anonymous referee for helpful comments which improved the content of this paper. This study is based on observations with the IRAM Plateau de Bure Interferometer. IRAM is supported by INSU/CNRS (France), MPG (Germany), and IGN (Spain). This paper makes use of the data from the Karl G. Jansky Very Large Array. The National Radio Astronomy Observatory is a facility of the National Science Foundation operated under cooperative agreement by Associated Universities, Inc. This paper makes use of the following ALMA data: ADS/JAO.ALMA#2011.0.00539.S. ALMA is a partnership of ESO (representing its member states), NSF (USA), and NINS (Japan), together with NRC (Canada), NSC, ASIAA (Taiwan), and KASI (Republic of Korea), in cooperation with the Republic of Chile. The Joint ALMA Observatory is operated by ESO, AUI/NRAO, and NAOJ. This work is partly based on observations collected at the European Organization for Astronomical Research in the Southern Hemisphere under ESO program 096.A-0891(A).
This research is supported by the European Commission through the FP7 SPACE project ASTRODEEP (Ref.No: 312725). T.W. acknowledges support for this work from the National Natural Science Foundation of China under grant 11303014.
Facilities: HST - Hubble Space Telescope satellite, Herschel (PACS - , SPIRE) - , Spitzer (IRAC - , MIPS) - , Chandra - , XMM-Newton. -
Footnotes
- 15
- 16
Detailed procedure and related codes are fully described here: https://github.com/cschreib/kmos-scripts
- 17
We note that this relation is derived from DM-only simulations, however, simulations including baryonic physics yield fully consistent results (Munari et al. 2013).
- 18
 .
. - 19
If we exclude the two UVJ-SFGs that fall 0.6 dex below the star formation main sequence, the starburst fraction would be 33%.
