


ABSTRACT
We explore the role of heliospheric magnetic field configurations and conditions that favor the generation and confinement of small-scale magnetic islands associated with atypical energetic particle events (AEPEs) in the solar wind. Some AEPEs do not align with standard particle acceleration mechanisms, such as flare-related or simple diffusive shock acceleration processes related to interplanetary coronal mass ejections (ICMEs) and corotating interaction regions (CIRs). As we have shown recently, energetic particle flux enhancements may well originate locally and can be explained by particle acceleration in regions filled with small-scale magnetic islands with a typical width of ∼0.01 au or less, which is often observed near the heliospheric current sheet (HCS). The particle energization is a consequence of magnetic reconnection-related processes in islands experiencing either merging or contraction, observed, for example, in HCS ripples. Here we provide more observations that support the idea and the theory of particle energization produced by small-scale-flux-rope dynamics (Zank et al. and Le Roux et al.). If the particles are pre-accelerated to keV energies via classical mechanisms, they may be additionally accelerated up to 1–1.5 MeV inside magnetically confined cavities of various origins. The magnetic cavities, formed by current sheets, may occur at the interface of different streams such as CIRs and ICMEs or ICMEs and coronal hole flows. They may also form during the HCS interaction with interplanetary shocks (ISs) or CIRs/ICMEs. Particle acceleration inside magnetic cavities may explain puzzling AEPEs occurring far beyond ISs, within ICMEs, before approaching CIRs as well as between CIRs.
Export citation and abstract BibTeX RIS
1. INTRODUCTION
Theoretical investigations of particle energization associated with dynamically evolving magnetic islands (or bubbles/plasmoids) have revealed the possibility that suprathermal charged particles may be effectively accelerated in the solar wind via reconnection-related processes (see Zank et al. (2014, 2015a, 2015b), le Roux et al. (2015a, 2015b) and references therein). Magnetic reconnection is thought to occur in many locations of a region filled with small-scale magnetic islands separated by thin current sheets. The so-called anti-reconnection electric field that can accelerate charged particles is generated via magnetic island merging when two islands of the same chirality approach each other due to the Lorence force. Particle acceleration in a sea of magnetic islands is also due to the contraction of magnetic islands, when trapped particles experience multiple reflections from the strongly curved field lines at the ends of elongated contacting islands. A stochastic randomly occurring mirroring and acceleration via either a first-order Fermi mechanism (in the case of compressible contraction) or a second-order Fermi mechanism (if the contraction is incompressible) results in an accelerated particle population.
Particles of initially moderate energies trapped in merging or contracting magnetic islands might gain several times higher energies, as the acceleration occurs in a system of mostly closed magnetic field line structures, where the trapped particles experience multiple interactions with the reconnection electric field during a prolonged time period comparable with the magnetofluid characteristic time. The idea was proposed by Matthaeus et al. (1984); Goldstein et al. (1986) and Ambrosiano et al. (1988), and further developed by Drake et al. (2006a, 2006b, 2013); Egedal et al. (2008); Pritchett (2008); Oka et al. (2010); Tanaka et al. (2010), Le et al. (2012); Bian & Kontar (2013); Zhou et al. (2015) and others (see Zank et al. 2014, 2015a, 2015b and references therein). It should be noted that most of these studies were based on numerical simulations.
Recently, a kinetic transport theory was developed by Zank et al. (2014) and extended by le Roux et al. (2015a, 2015b) to explain particle energization in dynamic magnetic islands and to explore related energy changes to the particle distribution function. The general solution is a power-law-like spectrum depending on the Alfvén Mach number and the ratio of the charged particle diffusion timescale and the magnetic island contraction time. This allows us to estimate the slope of the spectrum at different distances from the Sun (Zank et al. 2014), to identify changes in spectral slope with changing solar wind conditions (Zank et al. 2014, 2015a, 2015b; le Roux et al. 2015a, 2015b), and to explain unusual "time-intensity" profiles behind the heliospheric termination shock (HTS) via a combination of the diffusive shock acceleration (DSA) mechanism and acceleration in the sea of magnetic islands downstream of the HTS (Zank et al. 2015b).
The results described above have stimulated us to seek observational evidence for particle energization in turbulent regions, where small-scale magnetic islands experience either contraction or merging. It was not surprising to discover that the crossing of such regions often coincides with enhancements in the flux of energetic particles with energies up to 1 MeV and that cannot be classified as ordinary solar energetic particle events (SEPs) (Khabarova et al. 2015a). In all cases, particle energization, most probably, occurred locally, close to where the observations were made. This kind of particle energization is a complementary addition to the classical mechanisms of particle acceleration in the solar wind.
Two main mechanisms of particle acceleration are usually employed to explain SEP events or strong energetic particle flux enhancements (EPFEs) at 1 au: either (i) acceleration by solar flares or (ii) DSA. The latter may occur at the coronal mass ejection (CME) shock formed not far from the Sun (Zank et al. 2000, 2007; Li et al. 2003; Reames 2009, 2013; Chollet et al. 2010). At the same time, shock fronts formed fully beyond ∼2 au by corotating interaction regions (CIRs) or stream interaction regions (SIRs) may be regarded as the primary origin of energetic particle enhancements at the Earth's orbit that are unrelated to flares or CMEs. Reverse CIR shocks that form beyond the spacecraft accelerate energetic particles that stream toward the Sun (Malandraki et al. 2007; Gómez-Herrero et al. 2011). Both scenarios suppose that with the events we observe merely consequences of processes developing far from 1 au.
The picture of gradual SEP events or CIR-related EPFEs is characterized by a wide front of accelerated particles, predominantly propagating away from the Sun in the case of CME shock/flare acceleration or sunward (in the CIR case). Crossings of the particle front in two distant points at 1 au within a rather wide range of angle separations behave as simultaneous increases in energetic particle fluxes of the same energy (Zank et al. 2000, 2004, 2007; Reames 2009, 2013). This, indeed, is true for most intense events. However, unusual long-lasting spikes or long-duration moderate increases in energetic particle fluxes of an unclear nature are sometimes observed near the Earth orbit.
Atypical moderate energetic particle flux increases in the solar wind were a focus of some earlier works (Leske et al. 1999; Mazur et al. 2000; Malandraki et al. 2005, 2008; Chollet & Giacalone 2008; Mulligan et al. 2008; Al-Sawad et al. 2009; von Rosenvinge et al. 2009; Chollet et al. 2010 ). Attempts to explain such events were mostly based on classical approaches that assumed particle acceleration occurring far from 1 au, although the role of specific local configurations of the interplanetary magnetic field (IMF) on the propagation of particles was discussed as well. At the same time, alternative explanations for the existence of particles accelerated to energies of 1 MeV in the solar wind were considered (see for example, Al-Sawad 2009; Stasiewicz et al. 2013). For instance, Stasiewicz et al. (2013) suggested that the observed ion heating in the solar wind near the Earth's bow shock can be local and related to electromagnetic structures that possess abrupt spatial gradients in the electric field (which is typical for turbulent areas that contain small-scale current sheets).
We have discovered that at least some atypical energetic particle events (AEPEs) of such a sort are observed when a spacecraft crosses areas filled with dynamical magnetic islands (Khabarova et al. 2015a, 2015b), which is in agreement with the earlier work of Murphy et al. (1993). An association of magnetic islands/flux ropes with increases in the heat flux was discussed by Osman et al. (2011), Chasapis et al. (2015), Wang et al. (2012). As is predicted by the theory of Zank et al. (2014) and le Roux et al. (2015a, 2015b), both magnetic island merging and contraction may lead to local particle energization. On the one hand, Khabarova et al. (2015a) presented in situ multi-spacecraft solar wind observations of magnetic island merging and the related AEPEs near the heliospheric current sheet (HCS), thought to be due to magnetic reconnection. On the other hand, we showed events when magnetic islands contraction most probably occurred. Similar results with magnetic island merging were obtained from Cluster observations near the reconnecting terrestrial magnetotail (Wang et al. 2016) and in the Earth's magnetosheath downstream of the quasiparallel shock (Chasapis et al. 2015). These observations support the theory (Zank et al. 2014, 2015a, 2015b; le Roux et al. 2015a, 2015b) and show that magnetic island coalescence is a universal process occurring near primary reconnecting current sheets in different plasmas. The experimental findings discussed above were not surprising, because both earlier simulations and observations had related magnetic islands to magnetic reconnection (Eastwood et al. 2002; Retinò et al. 2007; Huang et al. 2011; Huang & Bhattacharjee 2013; Eriksson et al. 2014).
In the solar wind, the probability of observing small-scale magnetic islands is larger the closer one is to the heliospheric current sheet (HCS) (Cartwright & Moldwin 2010). As suggested in Khabarova et al. (2015a), the presence of magnetic islands/ropes of various sizes near the reconnecting HCS may explain the unusual suprathermal electron behavior observed during heliospheric plasma sheet crossings (see the discussion of such events in Crooker et al. 2001; Foullon et al. 2011; Zharkova & Khabarova 2015). Due to the variability of the solar wind, magnetic reconnection occurs recurrently in regions of strong current sheet formation, including those associated with the HCS. It generates secondary current sheets of smaller scales, instabilities, waves and evolving multi-scale magnetic islands, as has been shown both theoretically and observationally (Bárta et al. 2011a, 2011b; Khabarova & Zastenker 2011; Osman et al. 2014; Greco et al. 2016; Zhou et al. 2015). determines the plasma and magnetic field properties near the HCS.
If undisturbed by high-speed solar wind streams or CIRs/SIRs, magnetic inland merging is a dominating process near the HCS. Confinement of magnetic islands results from the rippled profile of the HCS. This leads to the formation of tokamak-like structures that provide additional energization of pre-accelerated particles (Khabarova et al. 2015a, 2015b). The ability of the HCS to both generate and confine magnetic structures such as magnetic islands and their ability to accelerate charged particles may resolve the problem of what is thought to be ineffective possible processes for direct particle acceleration at 1 au. The combination of acceleration by reconnection and dynamical magnetic islands is certainly significant since some crossings of the HCS show EPFEs up to 1 MeV for many hours in the vicinity of a sector boundary crossing (Zharkova & Khabarova 2015). Observationally, it appears that particles gain energy as a consequence of the reconnection rate increasing and the local HCS profile (Khabarova et al. 2015a, 2015b). The impact of interplanetary coronal mass ejections (ICMEs), CIRs/SIRs, and interplanetary shocks (ISs) can increase the reconnection rate and hence the production of magnetic islands.
The dynamical solar wind ensures that magnetic island contraction will occur everywhere, and is likely to be most effective when ICMEs and CIRs interact with the HCS. The interaction of ICMEs and CIRs with the HCS leads to (i) the confinement of plasma between the HCS and the propagating front of the ICME/CIR complex; (ii) strong compressions, and more intense magnetic reconnection at the HCS. Such dynamic interactions between flows and structures results in the observation of intense AEPEs in regions between different solar wind streams and the HCS (Khabarova et al. 2015a, 2015b), with energies that are comparable to those observed in strong SEP events.
Another region where contraction and merging of magnetic islands can occur is in the turbulent wake that isolated ISs create downstream as they propagate through the heliosphere. If an IS is followed by an ICME, the region is sometimes called the ICME turbulent sheath. Both observations and simulations reveal the formation of magnetic island-like structures in the turbulent wake of heliospheric or ISs, including planetary bow shocks (Sergis et al. 2013; Karimabadi et al. 2014; Chasapis et al. 2015). It has been shown that a combination of the DSA mechanism with acceleration by magnetic island dynamics can explain why the spectra of energetic particles that are supposed to be accelerated at heliospheric shocks are sometimes observed to be harder than predicted by DSA theory (Zank et al. 2015a, 2015b; le Roux et al. 2016). Moreover, such an approach allows us to explain and describe other unusual features of accelerated particles not predicted by classical DSA, such as energetic particle flux intensity peaks that are observed downstream of heliospheric shocks instead of peaking directly at the shock as predicted by DSA theory (see statistics for such cases in Tessein et al. 2015). Promising results on particle acceleration associated with shocks and other discontinuities were obtained by Tessein et al. (2013, 2015). Zank et al. (2015b) predicted the peak location of energetic particles to be behind the heliospheric termination shock (HTS) and showed that the distance from the shock to the peak depends on particle energy, which is in agreement with Voyager 2 observations. Similar particle behavior is observed near strong ISs in the outer heliosphere as observed by Voyager 2.
Observations show that heliospheric shocks are accompanied by current sheets. It is not rare to find an IS near the HCS. For example, Xie et al. (2006) find that the majority of CME-driven ISs occurred near the HCS. At the same time, IS crossings coincide with abrupt changes in the IMF azimuthal angle and the IMF strength, which is typical for strong current sheets. We will show below that the presence of current sheets in the vicinity of ISs acts to magnetically confine magnetic islands and increases the effectiveness of the proposed acceleration mechanism.
The important evidence for local particle acceleration via dynamics of magnetic islands is that ion/electron flux increases may sometimes be observed by different spacecraft with a time delay (Khabarova et al. 2015a), which obviously correspond to crossings of the local particle acceleration region embedded into expanding and rotating background solar wind.
The observations presented and discussed here provide support for theoretical ideas and simulations that suggest that particle energization is due to the presence of magnetic islands that have been confined to specific regions of the supersonic solar wind. We present examples of HCS-CIR, HCS-IS and unusual HCS-ICME interactions. Of particular interest is the role that current sheets play in confining magnetic islands. Also important is the analysis of the effect of high density (or high total pressure) on observed energetic particle flux time intensities. As a whole, this work is focused on support for ideas developed by Zank et al. (2014, 2015a, 2015b), le Roux et al. (2015a, 2015b). The work presented here advances the idea that the structure of the local IMF and its role in generating and confining small-scale magnetic islands is of particular importance when investigating particle acceleration at 1 au, an aspect that has received little attention until now.
2. AEPES OBSERVED IN ASSOCIATION WITH THE PRESENCE OF SMALL-SCALE MAGNETIC ISLANDS
Small-scale magnetic islands are commonly observed in the solar wind at 1 au. A typical small-scale magnetic island has a size of 0.01 au or less, and an island crossing by a spacecraft can take from a few minutes to several hours. Unlike large-scale magnetic islands, also called magnetic clouds, small-scale islands exhibit some grouping (Cartwright & Moldwin 2010). Small-scale magnetic islands can be identified by an increase in the IMF strength and corresponding decrease in density inside an island, together with a rotating magnetic field and small-scale current sheets bordering the structures.
The way to identify small-scale magnetic islands was shown in Moldwin et al. (2000), Cartwright & Moldwin (2010), Khabarova et al. (2015a). The Grad-Shafranov reconstruction of flux ropes can help determine the structure of magnetic fields locally (see ftp://ftp.iwf.oeaw.ac.at/pub/moestl/publicgscode/GS_handbook_june_2014.pdf and (Hu & Sonnerup 2001)), but it has some limitations, it is not easy to perform, and can be inaccurate. The use of a hodogram, widely employed in magnetospheric physics, sometimes combined with the minimum variance analysis, provides a ready and effective visualization of the rotating IMF within the magnetic island events (Nykyri et al. 2004; Wright et al. 2008; Dumitrache et al. 2011; Khabarova et al. 2015a, 2015b). The method relies on identifying an obvious rotation i.e., a semicircle in one of the planes Br–Bt, Bt–Bn or Br–Bn during an island crossing. Here and below, indices r, t and n correspond to radial, tangential and normal directions in the RTN coordinate system. For in-ecliptic spacecraft, r = −x in the GSE system, which is related to the ecliptic plane. A full circle or multiple circle hodogram usually corresponds to the crossing of two or a chain of magnetic islands. Another signature of a chain of magnetic islands is the anti-correlation of a pair of IMF components together with a changing correlation between density and IMF over a period of several hours, which may indicate a passage through a chain of magnetic islands as well.
The mechanisms proposed by Zank et al. (2014, 2015a, 2015b) and le Roux et al. (2015a, 2015b), can yield energetic particles accelerated to 1–1.5 MeV as observed at 1 au (Khabarova et al. 2015a, 2015b) by locally confining small-scale magnetic islands in a region for the time needed for particle energization. Therefore, the local structure of the IMF at 1 au leads to more effective acceleration processes than usually expected. In this regard, it is important to analyze the full picture of stream (or structure) interactions with strong current sheets of various origin and locations to better understand possible plasma/IMF configurations that lead to observed effects. Nearly whole sky data for the period 2003–2011 can be obtained from the Solar Mass Ejection Imager, SMEI. Bisi et al. (2008) and Jackson et al. (2010, 2013) provide a detailed description of both the SMEI solar wind density plots and the restored velocity plots derived from the Solar Terrestrial Environment Laboratory (STELab) interplanetary scintillation data. Because the solar wind velocity profile derived from STEL ground-based interplanetary scintillation data corresponds approximately to IMF spatial variations, one can reconstruct the spatial distribution of the IMF from the Sun to 1 au over the periods that we analyze (Tokumaru 2013). 3D tomographic reconstructions performed with a 102 minute cadence and resolutions of 0.05 au in height and 1° × 1° in latitude and longitude can be found on the SMEI page: http://smei.ucsd.edu/new_smei/data&images/data&images.html. Solar wind density profiles are provided from SMEI visible light observations of the whole sky. In general, the velocity and related IMF plots exhibit different patterns than those of the solar wind density. SMEI images show that the plasma flows nearly radially outward from the Sun, whereas velocity/IMF figures show both rotation and expansion.
Khabarova et al. (2015a) showed that increases in energetic particle fluxes coincided with the presence of magnetic islands in the vicinity of the HCS as it experienced magnetic reconnection. An analysis of observed time-intensity profiles of energetic particle fluxes due to particle energization in merging/contracting magnetic islands during a HCS-ICME interaction as well as during the crossing of the isolated HCS, can be found in Part 1 of this paper (Khabarova et al. 2015a). The case of a HCS-CIR interaction, during which magnetic islands were confined inside a delta-shaped magnetic cavity, is discussed in (Khabarova et al. 2015b). This work extends the multi-spacecraft study of Khabarova et al. (2015b) to consider particle acceleration in regions where magnetic islands are confined between magnetic walls (represented by current sheets of various origins) and plasma boundaries (CIRs, ICMEs, shocks). Our analysis is complemented by using observations derived from SMEI/STEL.
2.1. The HCS–CIR Interaction
Here we study the formation of time-intensity suprathermal particle flux profiles associated with local CIR–HCS interaction. In this case, we consider a region bounded by the HCS and the CIR front (which also contains local current sheets). We will show that the bounded region contains magnetic islands and investigate the possibility of significant associated particle acceleration.
The energetic particle flux variations observed by the STEREO pair in 2007 August (Figure 1(a)) were analyzed in Wu et al. (2014). The AEPEs appeared to be related to CIRs and were observed both before the approach of the first CIR and between the two CIRs. The classical explanation of the event, given by Wu et al. (2014), is that particles were accelerated beyond the Earth at reverse/forward shocks that belonged to the two CIRs, which formed V-structure during their expansion and propagation from the Sun. Our interest here is in addressing the ion flux enhancements that were observed before the arrival of the first CIR (see Figure 1(b)), which was not discussed in (Wu et al. 2014).
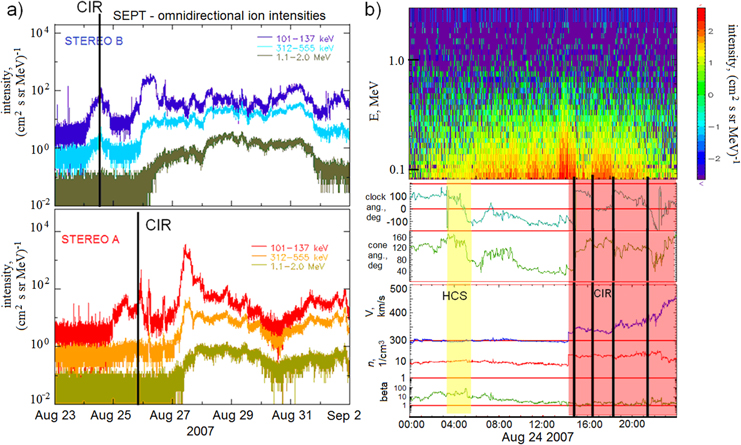
Figure 1. The atypical energetic particle event (AEPE) observed before arrival of two CIRs in 2007 August. (a) An increase in energetic ion flux up to 500 keV as seen by STEREO B (the upper panel) and STEREO A (the lower panel). The leading front of the first of two CIRs is shown by the vertical line. (b) STEREO B observations on 2007 August 24, showing the heliospheric plasma sheet/HCS crossing (the yellow stripe) before the CIR (the pink stripe). From top to bottom: spectrogram of energetic ion flux, clock and cone angles of the IMF, the speed of the solar wind, the solar wind density and the plasma beta. EPFEs can be identified between the HCS and the current sheet at the CIR leading edge and between current sheets within the CIR (vertical black lines).
Download figure:
Standard image High-resolution imageThe leading edge of the first CIR, indicated by vertical lines in Figure 1(a), was observed in sequence by STEREO B and STEREO A. Details of STEREO observations of energetic particles carried out by the Solar Electron and Proton Telescope can be found in (Müller-Mellin et al. 2008). STEREO A and B were separated by only 27°. Unlike a typical SEP event, the CIR-related energetic particle increases detected by STEREO B and A had a time delay of many hours. The delay time corresponded to the rotation of the structure from the first spacecraft to the other. The changes observed in the time-intensity energetic particle flux profiles appear to be determined by the local IMF configuration.
Consider the pre-CIR AEPEs shown in Figure 1(a). Subsequent crossings of the heliospheric plasma sheet containing the HCS and the CIR observed by STEREO B are indicated in Figure 1(b). The yellow stripe identifies the plasma sheet, and the pink stripe indicates the body of the CIR. Approximately 10 hr prior to the arrival of the CIR, the IMF changed direction, as can be seen from the changes in the IMF clock and cone angles. The clock angle is measured in the Tangential-Normal plane: 90° correspond to the normal to the ecliptic plane (which is the Radial–Tangential plane in the RTN coordinate system). A zero cone (azimuthal) angle coincides with the anti-sunward (Radial) direction in the Radial–Tangential (ecliptic) plane, and 180° indicates that the IMF vector directed toward the Sun. The average Parker spiral direction is 135°. Both angles change significantly during the HCS/plasma sheet crossing and the pre-CIR period shown in Figure 1(b). The clock angle is nearly +/−90°, which means that the HCS front is approximately perpendicular to the ecliptic plane, creating a kind of magnetic wall. This is accompanied by a very high plasma beta and an increased plasma density in a low velocity background. STEREO B first observed a weak shock with trailing density and velocity increases. The upper panel of Figure 1(b) shows the energy of omni-directional ions (spectrogram).
Clearly seen are energetic flux enhancements between the HCS and the CIR. The spikes occur in magnetic islands, within which the IMF vector was observed to rotate (see Khabarova et al. 2015b). A second remarkable observation is that the maximum increases in flux are observed between the HCS and a current sheet at the leading edge of the CIR as well as in between strong local current sheets inside the CIR (identified by vertical lines) instead of exactly at the CIR-related shock (the left side of the pink stripe). This example therefore illustrates very clearly the magnetic confinement of magnetic islands, perhaps produced by the disturbed HCS as discussed in (Khabarova et al. 2015a).
The presence of a cavity formed by the strongest CIR-related currents sheet and the HCS is confirmed by STEL/SMEI measurements. The magnetic cavity confines magnetic islands for a long time and allows them to trap and accelerate particles most probably via contraction due to the increasing pressure from the CIR side. According to SMEI and STEL data, CIRs were generated by the combination of (i) a long-lived low-latitude coronal hole, and (ii) weak CMEs that did not collide with the Earth. Over the period of interest, low latitude coronal holes were were alongside active regions that produced weak CMEs (see the corresponding images at http://spaceweather.com/ and CME movies at http://sidc.oma.be/cactus/catalog.php). The interaction of the flows in the solar wind led to the formation of a sequence of CIRs and magnetically confined regions that possess a delta (or nabla) shape.
The ∇-shape IMF cavities can be seen in Figure 2. To interpret the figures for the 2007 August event, let us provide some guidelines on how to recognize different streams in the SMEI and STEL plots. SMEI plots show propagation of dense regions formed around high-speed streams as well as CIRs and SIRs that are not as regular as CIRs. Therefore, SMEI is unable to show the detailed internal structure of streams, but is successful in showing turbulent dense borders of moving ICMEs or coronal hole flows.
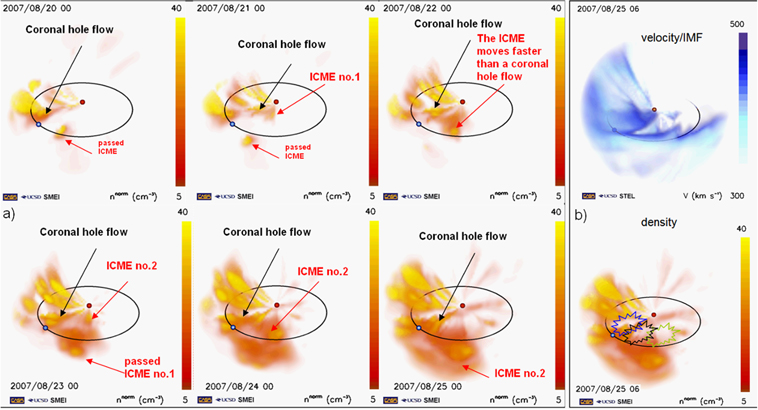
Figure 2. (a) SMEI observations showing daily plots of the solar wind density between the Sun and Earth for the period corresponding to Figure 1. The interaction of the coronal hole flow and ICMEs generates the CIRs that were detected by the STEREO pair, which eventually yielded the energetic particle fluxes shown in Figure 1. The black ellipse shows the Earth orbit, the blue dot denotes the Earth, and the heavy red dot the Sun. (b) The solar wind speed (blue) measured by STEL indicates ∇-shape IMF cavities in the solar wind and corresponding SMEI measurements of the solar wind density.
Download figure:
Standard image High-resolution imageStreams can exhibit many shapes, have a variety of speeds, and follow different propagation paths from the Sun to 1 au. ICMEs expand spherically and propagate nearly radially and look like expanding balls (see Figure 2(a)), whereas streams from coronal holes look like expanding tubes. High-latitude coronal holes may easily be identified as long-lived nearly vertical bright structures, but their identification at low latitudes is not so obvious, because flows from coronal holes are dynamical and may disappear for some time. However, if a tube-like dense structure appears again approximately in the same place, this definitely represents the coronal hole flow. Most streams that flow from low-latitude coronal holes face weak or strong ICMEs that originate in low latitudes as well. The development of a long-lived coronal hole flow and its interaction with other streams is shown in Figure 2(a) in detail. ICMEs (even from weak CMEs), usually move faster than coronal hole flows, and produce ball-like "CIR-shells." Sometimes an ICME can move more slowly than the coronal hole plasma flow, but since the latter has a permanent source at the Sun, it appears as though the ICME propagates against the background of a stable slowly rotating stream. The changing density (yellow and red figures) is partially responsible for what for what is seen in the blue velocity/IMF STEL figures (compare upper and lower panels in Figure 2(b)). Since the plasma velocity determines the shape of the IMF, a full interpretation of a particular event can be determined by an analysis of the velocity and density plots.
STEL plots are based on interplanetary scintillations and show dynamics of the solar wind velocity between the Earth's orbit and the Sun, which, in fact, reflects the behavior of the HCS. The undisturbed HCS has the shape of a well-known smooth surface, resembling a wavy ballerina skirt, but periods when such a structure occurs are quite rare even in solar minima, as any high-speed stream or a irregular SIR disturbs the HCS. For a short time during the passage of a ICME or a SIR, the HCS may be disrupted or even torn, which produces significant restructuring of the whole structure.
Multi-stream interactions may strongly disturb the HCS and produce quasi-stable large-scale structures propagating with the surrounding solar wind. An example is shown in the STEL plot of the upper Figure 2(b). As a result of multi-stream interactions, at least three unusual ∇-shaped IMF structures formed between the Sun and 1 au during the examined period. Unlike the common conception that a flow expanding from the Sun appears as a V-shaped structure, note that the top of the ∇ lies closer to the Sun than the pointed part. The cavity borders shown in Figure 2(b) correspond to the HCS and the current sheets from the CIR that has passed and the one that is arriving. The cavity so created acts to confine dynamically interacting small-scale magnetic islands that may be responsible for local particle energization.
2.2. Complicated Cases of Unusual Particle Acceleration Associated with ICMEs and Streams Flowing from Coronal Holes. Magnetic Cavities of Different Origin
The CIR-HCS case discussed above is similar to a ICME–HCS example described by Khabarova et al. (2015a). Observational evidence indicates the same paradigm for local particle acceleration by dynamically interacting magnetic islands, all of which (islands and particles) are confined spatially by the HCS and an approaching flow (CIR or ICME). Khabarova et al. (2015a) discussed two interaction cases in terms of possible scenarios analyzed by Manchester et al. (2014). These are (i) a pre-existing HCS disturbed by an ICME, and (ii) a post-ICME interaction with the HCS, which was quickly restored after the passage of the magnetic cloud.
Very complicated cases showing the impact of multiple CMEs with the HCS have been observed, showing that the HCS loses its simple structure, experiencing considerable disruption or reconnection along the leading front of the ICME, and acquiring ripples. The STEL 3D velocity plots reveal tearing of the HCS and its temporary absence in some regions or the existence of multiple rose-leaf shaped current sheets instead of ordinary slightly waved HCS (see the 3.avi movie from Khabarova et al. 2015b). A strong deformation of the HCS or other strong current sheet results in their splitting or bounding, which may lead to the formation of magnetically confined cavities. The interactions of different streams propagating at different angles to each other may produce similar cavities. Let us consider three cases: (i) a sequence of strong ICMEs that disrupted the HCS structure, producing numerous isolated current sheets, (ii) a long-lived low-latitude coronal hole which showed unstable flow after its interaction with an ICME, which formed a magnetically confined cavity; and (iii) a strong ICME that interacted with a long-lived coronal hole flow that reflected and split the ICME front, producing complex plasma/IMF structures associated with unusual variations in energetic particle intensities inside the ICME body.
2.2.1. Multiple ICME Interactions with the Rippled HCS
Event number 6 from the STEREO ICME list was detected by STEREO A on 2007 November 19. The start of the magnetic obstacle or flux rope was 22:00 UT (the left vertical line in Figure 3), ending at 3:17, 2007 November 21 UT (the right line in Figure 3). Figure 3, bottom panel, shows that this time interval corresponds to the main increase and growth in total pressure. It is debatable whether the event can be classified as a clear ICME since the velocity increase occurs after the magnetic cloud passes. This is not typical of ICMEs. On the other hand, the IMF clearly rotates inside the magnetic cloud, as seen from variations of the clock and cone IMF angles (the third and the fourth panels from top). It is interesting that the energetic particle flux increase is not associated with the enhancements in either the solar wind density or the total pressure. Instead, two strong EPFEs indicated in Figure 3 by yellow stripes can be seen at the beginning and end of the passage of the large magnetic cloud. The arrival and departure of the cloud is characterized by an increased solar wind density and IMF strength.
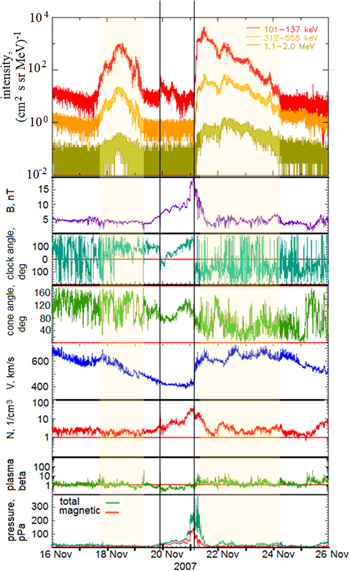
Figure 3. The case of an ICME surrounded by a rippled HCS. The EPFEs are not observed during the ICME magnetic cloud passage (bounded by two vertical lines), but there are two strong increases associated with the areas filled with magnetic islands (indicated by yellow stripes).
Download figure:
Standard image High-resolution imageThe first EPFE is very interesting. There is nothing remarkable in the nature of the various parameters that typically characterize particle energization. Figure 3 shows that there is no large increase in density during the different energy ranges of the EPFEs, and the solar wind speed decreases after the passing of the previous ICME. During this time, the IMF vector direction changes frequently, which indicates the presence of multiple current sheets. The plasma beta, which is another marker of the presence of current sheets, is high during the period, and one can see two sharp plasma beta increases at the edges of the left yellow stripe, characterizing crossings of two strong current sheets, confining the turbulent multi-current sheet region.
We find that the observed frequent changes in the IMF direction results from the HCS becoming strongly rippled (see Figure 4). As revealed by STEL, the strongly disrupted and rippled HCS surrounded the ICME. Small-scale magnetic islands within the HCS ripples are revealed by the IMF vector rotation hodograms illustrated in Figures 4(a), (b). Figures 4(a) and (b) show the IMF vector rotation during the first and second energetic ion flux increases shown in Figure 3 i.e., before and after the passage of the ICME magnetic cloud. It's important to recognize that the flux enhancements were local, because the AEPEs were detected by STEREO B with some time shift relative to STEREO A. Furthermore, STEREO A and B measured the energetic ion flux time intensity profiles to be only slightly different (not shown).
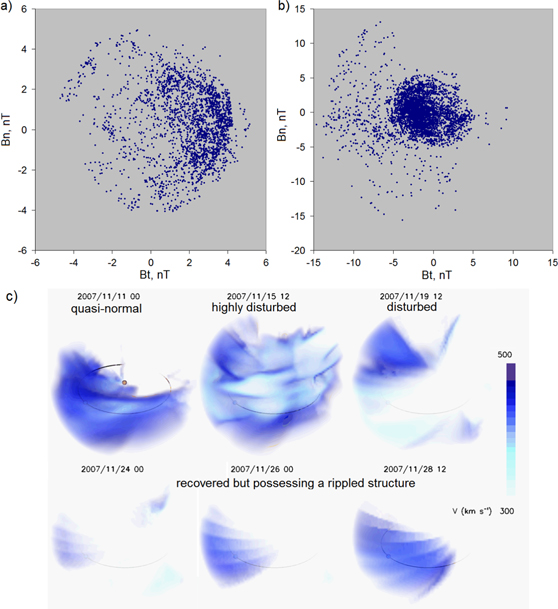
Figure 4. Rotation of the IMF inside magnetic islands and related STEL observations. (a, b) Shown is the rotation of the IMF coincident with the two strong EPFEs illustrated in Figure 3. STEREO A 1 minute data. (c) Samples of the HCS shapes as seen by STEL during the period 2007 November 16–26 compared to the quasi-stable HCS shape on 2007 November 11.
Download figure:
Standard image High-resolution imageFigure 4(c) illustrates sensitivity of the HCS structure to variable solar wind conditions. Being a quasi-stable structure that keeps its ballerina-like shape in response to a single event such as an ICME, an IS or a CIR passage, the HCS may experience intensive deformation or even tearing if numerous events occur simultaneously. Although a typical HCS shape is quickly restored after such relatively short periods, in our experience, this is always followed by observations of an intensively rippled structure of the HCS, as shown in Figure 4(c), where four states of the HCS are illustrated for the event of 2007 November 16–26.
In summary, our results emphasize the importance of the structure of the local IMF the confinement and acceleration of charged particles in the supersonic solar wind. The example of AEPEs discussed here suggests that particles accelerated diffusively at the ICME-driven shock wave could not stream freely away into the solar wind. Instead, the energized particles were confined by a complicated HCS structure and trapped and perhaps further energized by magnetic islands in the region surrounding the ICME. Consequently, our understanding of particle energization was "inverted": areas where energetic ion flux enhancements are usually observed had no SEPs, but the surrounding HCS-related magnetic islands were full of accelerated particles.
2.2.2. Magnetic Cavities Formed Due to Unstable Streaming from a Long-lived Coronal Hole
In Part 1, we discussed AEPEs observed by both STEREO B and STEREO A many hours before and after the main gradual SEP event in 2007 May (Khabarova et al. 2015a). By analogy with the events considered here, moderate particle intensity increases up to 1 MeV were detected by two spacecraft with a time delay corresponding to the plasma structure propagation from one spacecraft to another, as illustrated in Figure 5(a). The first increase, as indicated inside the rectangular box (1) in Figure 5(a), was due to the occurrence of magnetic islands near the HCS preceding the ICME as discussed in (Khabarova et al. 2015a). The second increase observed on 2008 May 28–30, delineated by box (2) in Figure 5(a), is no less remarkable, because formally there was no specific structure like the HCS that could be associated with it as it follows from Figure 5(b), where solar wind parameters are shown. Both plasma and IMF parameters show quite typical relaxation after the ICME passage on 2007 May 27–30, except for the plasma beta, which was high and permitted the possible formation of numerous current sheets (for the relation between the plasma beta and the current sheet occurrence see Crooker et al. 2001; Foullon et al. 2010, 2011; Khabarova & Zastenker 2011; Khabarova et al. 2015a, 2015b and references therein).
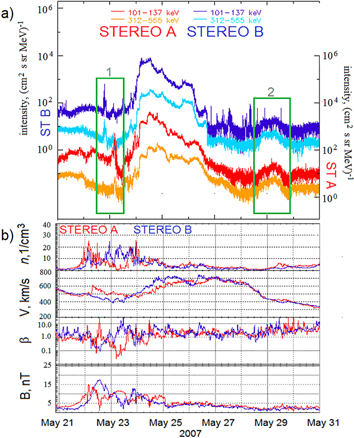
Figure 5. Energetic particle intensity increases observed by STEREO Ahead and STEREO Behind related to neither shocks nor flares. (a) Intensity increases before (1) and after (2) the main SEP event. (b) From top to bottom: the corresponding plasma density, the solar wind speed, the plasma beta and the IMF strength measured by STEREO Ahead (red) and Behind (blue).
Download figure:
Standard image High-resolution imageLooking at Figure 5(a), one can notice an interesting feature: all changes in parameters are observed by STEREO A first, and then by STEREO B unlike the ordinary sequence of measurements typical for a similar relative position of spacecraft (as shown, for example, in Figure 1). This situation is quite unusual, as STEREO B should detect all structures first due to the solar wind rotation from left to right as shown in Figure 6(a), where the spacecraft positions, the separation angles and the averaged IMF spiral are indicated. However, if the IMF structure does not correspond to the nominal Parker spiral shown in Figure 6(a), and if the stream front is more parallel to the tangential (Y) direction than usual, STEREO A observes the structure first, which apparently was the case during the event.
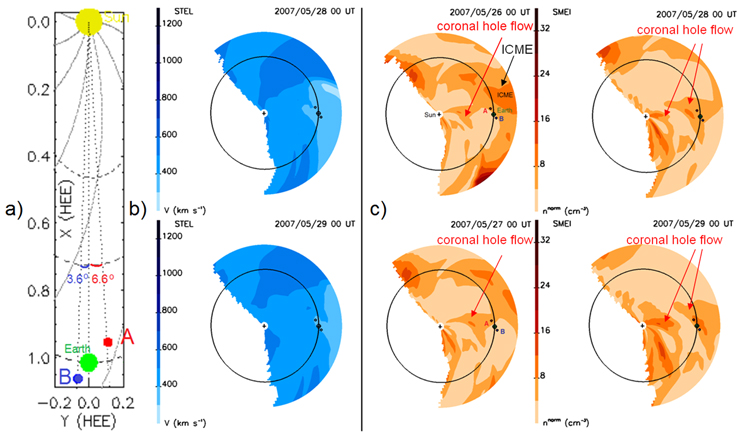
Figure 6. Observations of the plasma/IMF configuration that leads to magnetic island confinement during 2007 May 28–29. (a) Positions of STEREO Ahead (the blue dot) and STEREO Behind (the red dot) with respect to the Sun, the Earth and the nominal Parker's spiral shown in the ecliptic plane. (b) STEL plots in the ecliptic plane show that on 2007 May 28–29 the real IMF spiral was twisted more strongly then the supposed Parker spiral, and the IMF lines were more strongly inclined to the Earth orbit direction (c) SMEI observations in the ecliptic plane after the ICME passage. The coronal flow stream interruption produced a cavity, inside which particle acceleration occurred.
Download figure:
Standard image High-resolution imageAs illustrated in Figure 6(b), the IMF spiral was not Parker-like. It was more strongly inclined to the Y direction, as STEL measurements showed. One can use the density measurements provided by SMEI to analyze an approximate view of the structures formed between the Earth and Sun for the corresponding period (Figure 6(c)). After the ICME passage on 2007 May 26, the Earth was inside the stream from a long-lived coronal hole shown by the red arrow in Figure 6(c). The existence of the coronal hole is confirmed by SOHO (see, for example, http://spaceweather.com/ for the period in question). However, the flow was unstable as seen from the development of structures from 2007 May 26–29. The formation of the second dense area flowing from the Sun shown by the second red arrow is due to a temporal interruption of the coronal hole flow. As a result, the near-Earth environment was located inside a turbulent area between the two flows from 2007 May 28 to June 1. The plasma cavity formed between the Earth and Sun on 2007 May 28, when combined with a strongly twisted IMF spiral (as shown in Figure 6(b)), magnetically confined numerous small-scale magnetic islands as can be seen in Figure 7.
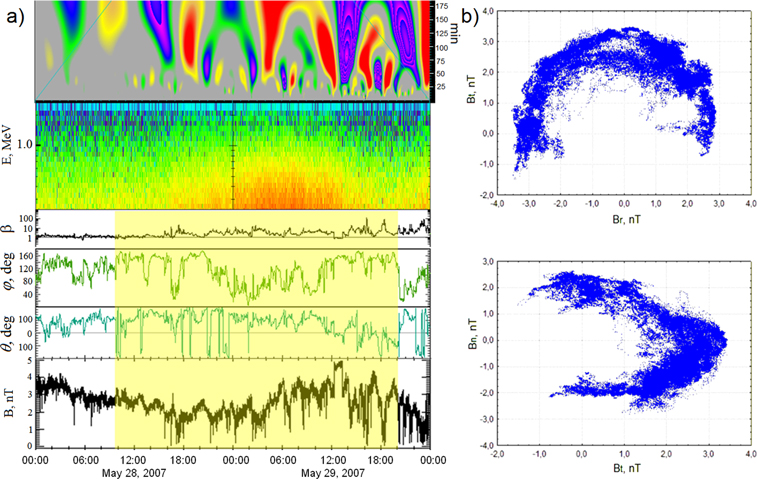
Figure 7. An example of observations of magnetic islands inside a turbulent region between two flows from the same coronal hole shown in Figure 6 as seen by STEREO A. From top to bottom: (a) the local wavelet power spectrum of the IMF strength using the Mexican hat wavelet (derivative of a Gaussian); energetic ion flux spectrogram; the plasma beta; the cone and clock IMF angles; the IMF strength. (b) Hodogram showing the IMF vector rotation in RTN coordinates, corresponding to the crossing of islands from 8:38 to 12:18 UT on 2007 May 28, 1 s resolution.
Download figure:
Standard image High-resolution imageThe occurrence of magnetic islands in the region between two streams from the same coronal hole corresponds to the appearance of quasi-stable variations of the IMF strength in a range from 20 minutes to 2 hr as seen in the results of Fourier analysis shown in Figure 7(a) (upper panel). The right axis is the Fourier period in minutes. Repeating small-scale structures appear in the upper panel mainly within the 20–50 minute interval of periods, which means that a corresponding quasi-periodic signal exceeds 95% confidence level for a red-noise process. This confirms that magnetic islands formed under certain conditions in the solar wind have typical sizes that can be estimated as shown in (Khabarova et al. 2015a). The wavelet technique may be useful for the automatic detection of areas filled with magnetic islands. The ion intensity increase shown in the second panel in Figure 7(a) inside the yellow highlighted area, corresponding to the entry of the STEREO A spacecraft into the magnetic cavity indicated in Figure 6(c), coincides with the detection of quasi-periodic structures having the typical sizes of small-scale magnetic islands as observed by STEREO A.
The high beta values (the third panel from the top in Figure 7(a)) observed inside the area confirm the presence of small-scale current sheets, which obviously correspond to borders of small-scale magnetic islands. The rotation of the IMF vector inside numerous magnetic islands can be seen from the behavior of the cone and the clock IMF angles (the fourth and the fifth panels in Figure 7(a)). Like the previous cases, the clock angle's sharp changes at the edges of the highlighted area indicate the existence of magnetic walls produced by the interrupted coronal hole flow, which allows for the trapping of magnetic islands inside the cavity. One can see an example of the IMF vector rotation inside the islands detected by STEREO A with high resolution from 8:38 to 12:18 UT (Figure 7(b)).
Therefore, magnetically confined cavities may occur at 1 au as a result of unstable coronal hole flow, which is usually not considered. The interrupted flow produces turbulent areas between the leading and trailing edges of coronal hole streams at which current sheets form during the propagation of the stream from the Sun. Since the coronal hole flow geometry indicates nearly perpendicular fronts with respect to the ecliptic plane, the strongest current sheets at leading and trailing edges essentially form magnetic walls. Such walls are thought to play a key role in particle transport (Reames & Ng 2002; Sarris & Malandraki 2003; Tan et al. 2012). Reames & Ng (2002) suggested that some atypical features in energetic particle propagation are due to the occurrence of magnetic boundaries, reflecting Fe ions beyond the Earth. During periods when low-latitude coronal holes and CMEs coexist, the passage of an ICME may increase the probability to observe such structures at 1 au.
Although it is still unclear why the coronal hole flow shown in Figure 6(c) was interrupted, the occurrence of a very weak ICME is quite possible. During the period of interest, the Heliospheric Imager instruments (HIs) onboard STEREO B observed swirl-like rotating structures that might be related to the bubbles observed in situ by STEREO A on 2007 May 28–30. HIs are wide-angle visible light imagers that, similar to SMEI, provide information on most dense structures that can be traced from Sun to the Earth and even beyond, allowing for the detection of CME features down to less than 1% of the F-coronal intensity (Rouillard et al. 2008; Sheeley et al. 2008; Davies et al. 2009; Davis et al. 2009; Eyles et al. 2009). Two HI-B cameras look toward the western limb of the Sun (toward the STEREO A direction as shown in Figure 6(a)). Important documents on HIs, including the user's guide can be found at http://www.stereo.rl.ac.uk/documents.html.
In Figure 8, we present running difference images of the inner camera, HI1-B, for the period from 2007 May 27–29. HI1-B controls the 20° × 20° area; the Sun is on the left hand side, 4° apart; solar north is upwards. The frame in Figure 8 approximately covers the light area behind the coronal hole flow shown by the arrow in Figure 6(c) on 2007 May 27. According to manual identification of solar transients (Helcats et al. 2015), a CME-like structure was first detected by the HI1-B at ∼10 UT on 2007 May 27. The swirl propagated relatively independently of the rest of the solar wind that slipped and flowed around the structure, producing its slow rotation, which is clearly seen in the supporting video. The HI2-B instrument that could show the rest of the stream's way did not allow the complete tracing because of strong saturation, as the Earth lays in its field of view during the early days of the STEREO mission. However, HI2-B showed that the swirl was fragmented as propagated farther from the Sun, and the first swirl-associated structures reached 1 au approximately between 2007 May 29 and 30. Since STEREO A detected more prominent energetic ion flux enhancements and clearer signatures of magnetic islands in comparison with STEREO B (not shown), it is quite possible that STEREO A observed energetic particles resulted from propagation of the structure shown in Figure 8.
Figure 8. Running difference images derived from HI1 onboard STEREO B, showing the evolution of a swirl-like structure on 2007 May 27–29.
(An animation of this figure is available.)
Download figure:
Video Standard image High-resolution imageThe angular width of the formation seen by HI-1B extended from approximately 270°–295° (counted from north, anticlockwise, see corresponding explanations at http://www.helcats-fp7.eu/catalogues/wp2_cat_v02_release.html). The CACTUS automatic CME detection that employs images from the LASCO instrument on-board the SOHO spacecraft (Robbrecht et al. 2009) suggests that the CME-like structure was first observed at 11:06 UT http://sidc.oma.be/cactus/catalog/LASCO/2_5_0/2007/05/CME0027/CME.html. The velocity of the swirl's center was ∼300 km s−1 (which is in agreement with estimations based on HI1-B images), but the edges propagated incomparably faster, with a speed up to 1800 km s−1. The structure was attached to a flow with the angular width of 44°, which was located closer to the solar equator and detected one day earlier (see the CACTus catalog at http://sidc.be/cactus). According to LASCO measurements, the principal angle was 297° and the width was ∼12°, which is very small for a CME, i.e., the transient might have an alternative origin. Overall, both manual and automatic detections do not allow one to conclude that it was unquestionably a CME. It could be either a turbulent flow formed due to a temporal interruption of the coronal hole flow or a consequence of the CME-coronal hole interaction very close to the Sun, in the "blind" area which was not covered by coronagraphs. Independently of their origin, bubble-like structures detached from Sun may produce unexpected effects such as local acceleration of trapped particles, which will be further proved in the next paragraph.
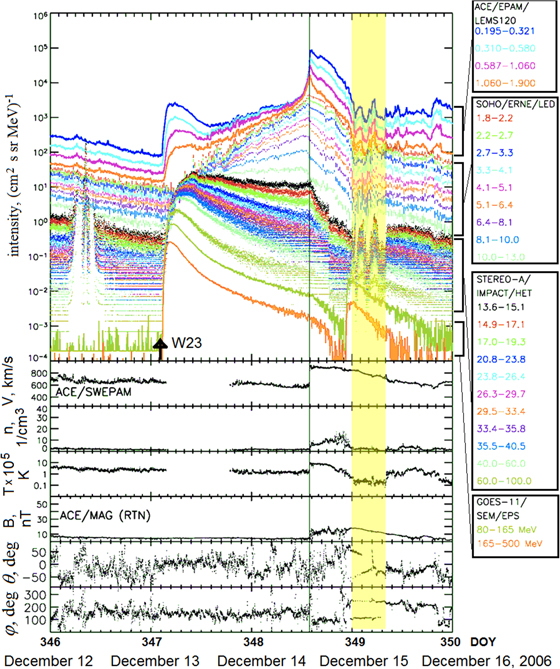
Figure 9. The unusual SEP event of 2006 December 13–15. From top to bottom: strong variations in energetic particle flux in the MeV range (indicated by the yellow band) are observed on 2006 December 15 by different spacecraft in the solar wind at 1 au (upper panel). ACE measurements of the solar wind speed, density, temperature, the IMF strength, the latitude and longitude (azimuth) angles. The black arrow shows the beginning of the event that started at 02:14 UT on 2006 December 13 with the X3.4 flare (W23 near the arrow means the longitude). The vertical line corresponds to the arrival of the IS to 1 au. Modified from (Aran et al. 2010), see also http://fp7-spacecast.eu/help/bg_sp.pdf.
Download figure:
Standard image High-resolution image2.2.3. ICME Interaction with a Long-lived Coronal Hole Flow. Magnetic Cloud Distortion and Combined DSA-flux Rope Acceleration
The unusual SEP event of 2006 December 13–15 attracted a lot of interest (Liu et al. 2008; Mulligan et al. 2008; Hippler 2009; Malandraki et al. 2009; von Rosenvinge et al. 2009; Verkhoglyadova et al. 2010). The event is shown in Figure 9, adapted from Aran et al. (2010), where we highlighted the intense proton flux variations that were observed by several spacecraft on 2006 December 15. ACE and SOHO were at the Lagrangian (L1) point and the STEREO pair passed the Earth's bow shock three days before the event (one can see corresponding strong energetic particle acceleration reflected in sharp changes in the time-intensity STEREO A profiles in Figure 9). The positions of the spacecraft are illustrated in Figure 10(a). The most intriguing fact about this event is that the variations highlighted in Figure 9 occurred inside the ICME body with ∼20 minutes delay between the spacecraft at L1 and STEREO (near the Earth bow-shock), and were not detected inside the magnetosphere by GOES-11.
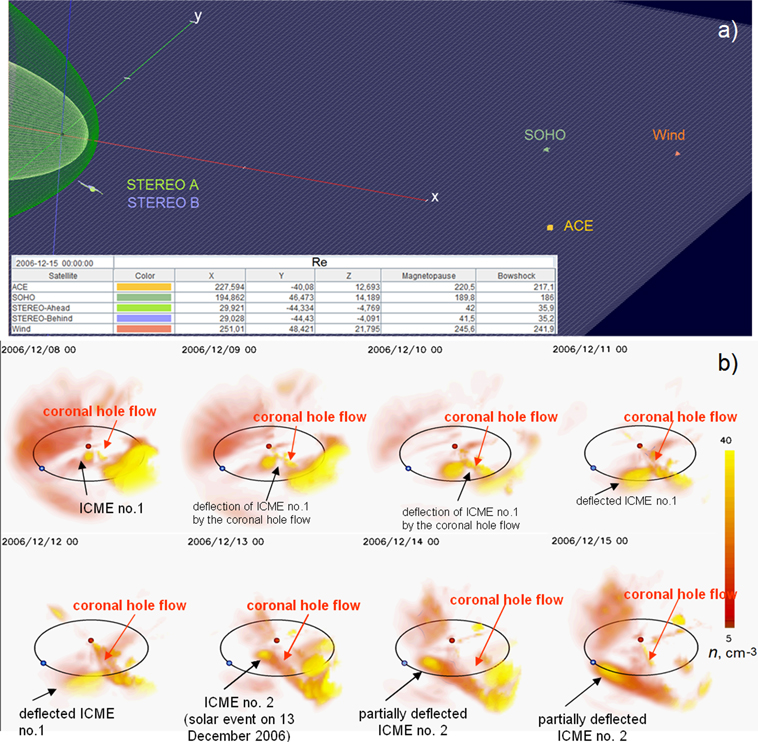
Figure 10. (a) Multi-spacecraft observations of the AEPE shown in Figure 9. The STEREO pair was closer to the Earth than the other spacecraft and located below the ecliptic plane XY (GSE). ACE, SOHO and Wind were above the ecliptic plane, shown by grid lines. Energetic particle variations shown in Figure 9 were detected by STEREO ∼20 minutes later than observed by spacecraft at the libration point. (b) Deflection of the ICME front by a long-lived low latitude coronal hole flow as seen by SMEI. ICME no.2 has a wide front, part of which is deflected by the coronal flow, which produces two interacting magnetic clouds within the same 2006 December 14–15 event observed by the spacecraft shown in the upper panel. Energetic particle flux variations are associated with the magnetic clouds.
Download figure:
Standard image High-resolution imageLet us describe the event as shown in Figure 9. On 2006 December 13 (day 347), several spacecraft observed strong increases in the energetic particle flux originating from solar active region 10930 (X3.4, W23°, 02:40 UT). This moment is shown in Figure 9 by the black arrow and the sign W23. Then the time-intensity profiles exhibited a second increase with the peak at the ICME-related IS occurring on 2006 December 14. The subsequent passage of the turbulent region observed downstream of the IS corresponded to a gradual energetic particle flux intensity decrease, seen slightly differently by different spacecraft, with some dependence on the observer's angle of view (see Lario & Simnett 2004; von Rosenvinge et al. 2009; Rodríguez-Gasén et al. 2014). The next SEP event occurred on 2006 December 14—DOY 348 (X1.5, W46°, 22:15 UT) nearly simultaneously with the magnetic cloud's leading edge propagating through the spacecraft positions. The event on 2006 December 14 does not seem to be very intense, as no spacecraft in the solar wind observed a significant particle flux increase. The fact that GOES-11 detected a particle enhancement at high energies inside the magnetosphere could be related to the peak in the IMF pressure that occurred at 1 au simultaneously with the flare as well as to the effective energy transfer from the solar wind to the position of the particular spacecraft in the magnetosphere. In the solar wind, the EPFE was negligibly weak in the background of the previous gradual SEP event and was followed by the unusual variations in the particle intensity discussed above.
The variations associated with the magnetic cloud passage have been treated as being of solar origin or being due to acceleration at the ICME shock, but propagating along different magnetic field lines, for example, inside two interwoven magnetic flux tubes. This way of explaining the observations was suggested by von Rosenvinge et al. (2009), who noticed the occurrence of at least one strong current sheet inside the magnetic cloud. A detailed analysis shows that the cloud is separated into two major and several minor parts. However, the time delay of 20 minutes between the L1 point and STEREO's position would not be observed if particles were accelerated far from the Earth. 1–30 MeV protons traverse 200 Earth's radii separation between the spacecraft shown in Figure 10(a) in a negligible time for any magnetic configuration. In fact, the ∼20 minutes delay corresponds to the time for propagation of the solar wind plasma with the speed of ∼800 km s−1 (Figure 9) from ACE and SOHO to STEREO (Figure 10(a)). Therefore, most probably, the source of such particle variations (or modulation) was local.
SMEI measurements may help to solve the mystery and explain what happened to the ICME that was expected to produce a quite ordinary SEP event. Figure 10(b) illustrates the propagation of the ICME's front from the Sun to the Earth. During the period of interest, a long-lived coronal hole occurred at low latitudes (indicated by the red arrow). It did not face the Earth from 2006 December 8 to 16, but, according to SMEI, it deflected ICMEs twice. As illustrated in Figure 2, ICMEs usually propagate radially from the Sun. However, that was not the case for the events described here.
The first event occurred on 2006 December 8–12. We show it in Figure 10(b) to establish the ability of high-speed streams from coronal holes to deflect (or even reflect) ICMEs if the ejection takes place not very far from the low-latitude coronal hole. In the case shown in Figure 10(b), ICME no. 1 significantly changed its propagation direction due to reflection from the coronal hole, but survived as a structure that contained one magnetic cloud. The second event was the interaction of ICME no. 2 from the 2006 December 13 flare with the same coronal hole flow. Since the later ICME had a wider leading front in comparison with the previous one, it was only partially reflected. A large part of the front was deflected, and the ICME propagated both anti-Sunward and along the coronal hole flow direction. At the same time, the part of the ICME front that was closer to the coronal hole flow experienced stronger deflection. As a result, at least two middle-size magnetic clouds were formed and propagated relatively independently.
Two middle-size magnetic clouds can be identified inside the ICME body from the analysis of the IMF data shown in Figure 11(a). The ICME is characterized by a prolonged period of post-shock turbulent solar wind (a turbulent wake behind the IS), and instead of one large magnetic cloud, a complex region filled with flux ropes can be identified. Simultaneous variations in the suprathermal electron pitch-angle distributions (PADs), the solar wind tangential and normal speed components, and in the plasma density, shown in Figure 11(a), confirm that clouds 1 and 2 are separated by a strong current sheet. The edges of these largest clouds are shown by thin purple vertical lines, the final current sheet separating the area filled with clouds/flux ropes from the ICME trailing edge is shown by the thick vertical purple line, and the IS crossing that preceded the clouds' arrival is indicated by the red vertical line.
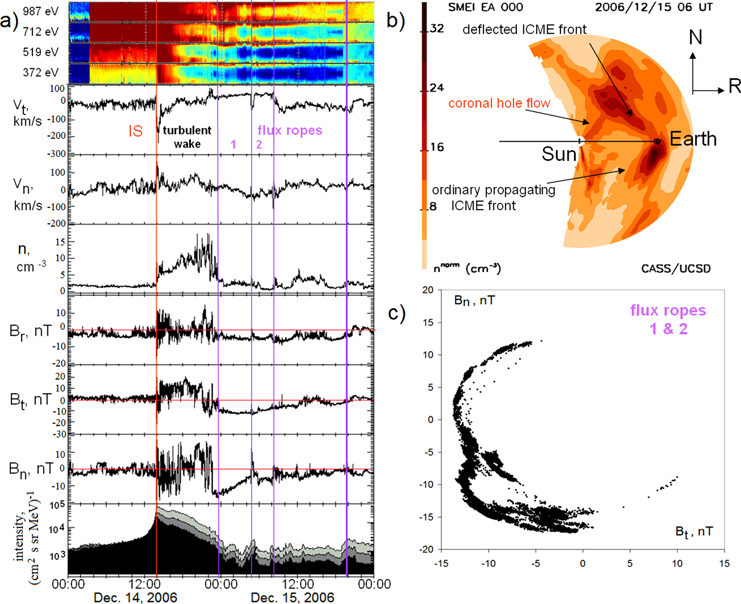
Figure 11. IMF and plasma structures associated with the ICME magnetic clouds passages according to ACE measurements. (a) From top to bottom: electron pitch angle spectrograms at different energies, angles vary from 0° to 180°; the tangential and vertical solar wind velocity components, the solar wind density, three components of the IMF in RTN coordinate system, and sector averaged particle flux intensities in three energy channels of LEMS120: 0.31–0.58 MeV/nuc, 0.58–1.05 MeV/nuc and 1.05–1.89 MeV/nuc, respectively, from the upper curve to the lower. The red line shows the position of the IS. Purple lines indicate current sheets separating two large-scale magnetic clouds, the occurrence of which reflects two directions for the ICME body to reach the Earth, being partially deflected by a long-lived coronal hole. (b) Meridional cut of a SMEI plot (density in visible light) on 2006 December 15 (see 3D plots in Figure 10). The ICME was partially deflected, which produced two magnetic clouds behind leading fronts 1 and 2. (c) Hodogram showing the IMF vector rotation inside the magnetic clouds indicated by the purple vertical lines in (a).
Download figure:
Standard image High-resolution imageFigure 11(b) illustrates the approximate view of ICME fronts between the Earth and Sun in the plane orthogonal to the ecliptic as seen by SMEI on 2006 December 15, when the main body of ICME faced the Earth. An unusual arc-like plasma configuration formed by the coronal hole stream and two magnetic clouds can be seen in the SMEI plot. The interaction of the coronal hole flow with the ICME apparently occurred close to the Sun, and the resulting plasma structures observed at 1 au were characterized by the strong deformation of the ICME front. As seen from Figure 11(b), the two magnetic clouds propagated nearly perpendicular to each other. The IMF hodogram in Figure 11(c) clearly illustrates independent rotation of the IMF vector in the tangential-normal plane (RTN coordinates) inside the two identified clouds.
The important feature that is revealed in Figures 10(b) and 11(b) is that, according to SMEI, the ICME was completely detached from the Sun. Figure 11(a) confirmed the closed structure of the ICME, as the entry into the clouds was accompanied by a decrease of the particle intensity associated with the shock (bottom panel). Therefore, the 2006 December 15 magnetic cloud topology resembles a spheromak (Vandas et al. 1997, 1998; Mulligan & Russell 2001; Gibson & Fan 2008) rather than a conic-like structure, as usually assumed.
Interestingly, this may be indirectly confirmed by observations of counter-streaming strahls (bi-directional field-aligned suprathermal electron flows) during the crossings of the main body of ICME as seen in the top panel of Figure 11(a). Bi-directional strahls corresponds to the two thin red and yellow stripes along the 0° and 180° directions (bottom and top of each of four spectrograms). This puzzling feature was discussed in several papers (one can find the most comprehensive analysis in (von Rosenvinge et al. 2009)). Strahls are the most energetic component of suprathermal electrons propagating along the IMF lines, so the presence of bi-directional strahls must indicate a looped structure (Gosling et al. 1987; Steinberg et al. 2005). Since all strahls are believed to have a solar origin, it is usually interpreted as having connection to the Sun, i.e., streaming along the ICME front that has its roots on the Sun. However, this interpretation sometimes faces problems, for example, when bi-directional strahls are observed very far from the Sun or in regions where the IMF and plasma configurations allow one to conclude that the connection to the accelerated electron source on the Sun is doubtful. The statistics of strahls is discussed in (Lavraud et al. 2010), and examples of complicated cases can be found in (McComas et al. 1994; Rouillard et al. 2010).
Zharkova & Khabarova (2012, 2015) used particle-in-cell simulations of accelerated particles to show that at least some strahls observed in the solar wind near current sheets can be produced locally by magnetic reconnection. If a current sheet is aligned with the surrounding IMF, as in the case of the HCS, then one observes a suprathermal electron stream dominating in one direction. However, if a current sheet belongs to a structure moving approximately perpendicular to the IMF lines, the existence of bi-directional strahls just means propagation of suprathermal electrons along the strongest current sheet that experiences reconnection. This occurs, for example, at the leading edges of ICMEs or CIRs or in the sheaths of magnetic clouds (Ruffenach et al. 2012; Feng & Wang 2013; Zharkova & Khabarova 2015). For higher particle energies, the stronger is the bi-directional effect (exactly as seen in Figure 11). Therefore, bi-directional strahls may propagate independently of the surrounding IMF along a structure containing reconnecting current sheets without the Sun acting as a source, which easily explains all controversial cases. In the particular case of the ICME on 2006 December 14–15, the occurrence of bi-directional strahls confirms the existence of closed magnetic structures. A closed magnetic structure is necessary for particle acceleration in a sea of magnetic islands since the mechanism needs the effective confinement of magnetic islands to ensure particle trapping (Zank et al. 2014; Khabarova et al. 2015a, 2015b).
Variations in proton fluxes measured by ACE EPAM correspond very well to the crossings of IMF/plasma structures, showing enhancements near the edges of magnetic islands, i.e., near current sheets (bottom panel in Figure 11(a)). Subsequent less pronounced flux variations are associated with smaller-scale flux ropes as well (not shown), reflecting the complex coronal hole flow-ICME interaction. The efficiency of particle acceleration in dynamical magnetic islands depends to a high degree on the (i) typical size of magnetic islands (flux ropes), (ii) energies of pre-accelerated particles (the seed population), and (iii) the manner of magnetic confinement. Taking this into account, we suggest that the large scale of the formed magnetic clouds, the existence of seed particles pre-accelerated via DSA, the occurrence of additionally ejected energetic particles from the flare on 2006 December 14, and the magnetic confinement of magnetic clouds inside the ICME body all contributed to the observed acceleration of particles and flux modulation associated with the magnetic clouds.
Particles accelerated in the sea of dynamical magnetic islands (which serves as a pool of trapped and accelerated particles) may interact with the IS, be re-accelerated again via DSA and returned again into the turbulent region (Zank et al. 2015b). The presence of both small-scale magnetic islands in the turbulent region right behind the IS and mid-scale bubbles (clouds) observed farther downstream provides the possibility to examine features of particle acceleration related to a combined local DSA-magnetic cloud acceleration mechanism.
It is important to note that particle acceleration at the ICME-related IS was not in accord with the classical DSA mechanism scenario. Calculations of the flux amplification factor, obtained by dividing flux values in each energy channel by the values observed at the IS, shows that it is not 1 as predicted by DSA (Figure 12). The normalized ion flux intensities of high-energy particles measured by STEREO A (Figure 12(a)) and STEREO B (Figure 12(b)) significantly increase during the passage of magnetic clouds. The amplification factor is ordered by increasing energy as predicted by Zank et al. (2015b) for the combined DSA-magnetic island acceleration mechanism: i.e., the factor increases with increasing energy (the most energetic particles experience more acceleration), which is not the case before the IS crossing.
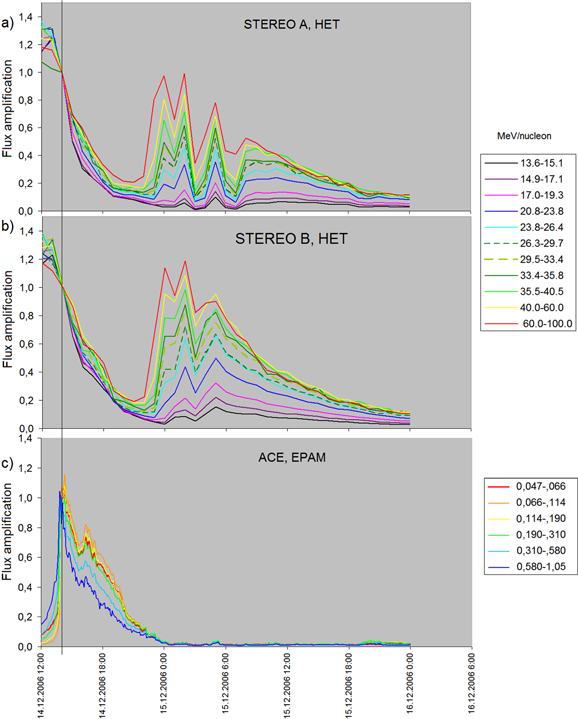
Figure 12. Flux amplification factor obtained from and (a) STEREO A (HET); (b) STEREO B (HET)—daily averages, and (c) ACE EPAM (LEMS120)—5 minute averages. Correspondence between colors and energies is shown on the right. Proton flux intensities are normalized at the shock (shown by the vertical line). The amplification factor for high energies (a, b) is in accord with the predictions of Zank et al. (2015b), and is the inverse for low energies (a) as was first found in (Zank et al. 2015b).
Download figure:
Standard image High-resolution imageAs seen in Figures 9 and 11(a), the time-intensity energetic particle flux profile has two peaks behind the shock, and the most prominent flux increase occurs in the wide turbulent wake, which was observed to be full of small-scale magnetic islands and thin current sheets downstream of the shock. As Figure 12(c) shows, the amplification factor for lower-energy particles (i) peaks in the wake of the IS, but not inside the magnetic clouds as in the case of high-energy particles, and (ii) it reveals the inverse order of amplification (the amplification factor is largest for the smallest energy). This phenomenon was first found and discussed by Zank et al. (2015b), who suggest that there is a threshold energy below which advection of magnetic islands together with trapped particles away from the shock must be taken into account.
Here we confirm the existence of the threshold, which is obviously different in different plasmas. It is important to emphasize that the difference in the behavior of high- and low-energy particle flux amplification factors clearly indicates the localization of areas filled with flux ropes of different sizes (compare the indicated areas in Figure 11 and the locations of peaks in Figures 12(a), (b) and (c)). One might suggest that it reflects different routes for particle acceleration in very small- and larger-scale islands. As a whole, it is obvious that smaller-scale islands correspond to smaller gyroradii, therefore it is quite natural to see some features reflected in low-energy particle flux characteristics (Figure 12(c)) instead of high-energy ones (Figures 12(a), (b)). At the same time, larger-scale islands correspond to larger Larmor radii and can accelerate particles to higher energies, as large as observed on 2006 December 15. However, the effect of the amplification factor ordered inversely remains puzzling and demands further investigation.
This event has provided the possibility to test both the idea of particle acceleration in magnetically confined regions filled with dynamically interacting magnetic islands and the dominant DSA paradigm. At the moment, such events cannot be explained in the usual way, which is recognized by many investigators. For example, Al-Sawad et al. (2009) stressed the necessity to find another way to explain some events and suggested the possibility of energetic particles being temporarily confined on their way from the Sun to the Earth. A significant distortion of magnetic clouds due to the ICME interaction with other streams or simply due to its propagation through the solar wind with changing speed (Owens 2006) can result in such particle confinement. Moreover, in combination with the presence of the IS in front of the ICME, we have the possibility to re-accelerate energetic particles via the combined DSA-flux rope mechanism proposed by Zank et al. (2015b).
2.3. The HCS–IS Interaction
The importance of the presence of an IS in a system that confines magnetic islands can be illustrated in another way. The strange SEP event of 2006 December 13–15 showed the necessity of taking into account all structures and streams that may interact in the solar wind and provide closed magnetic structures that confine magnetic islands. Another case that cannot be ignored is the IS–HCS interaction. ISs are therefore followed by magnetic and plasma structures that can, on impact, modify the HCS structure. Consequently, the reconnection rate at the HCS can increase with the associated production of more magnetic islands in that region of the supersonic solar wind. The net result may be the increased effectiveness of local particle energization. Although the HCS is in principle transparent to the propagation of isolated ISs, Hu & Jia (2001) have found that shocks can disrupt the HCS. The HCS appears to respond to the transmission of shock by attempting to maintain its original structure, but the shock compression warps and pushes the HCS forward, after which it recovers its structure. STEL movies may capture the dynamical response of the HCS to a shock quite nicely. A spacecraft in the immediate vicinity of the HCS may then detect the HCS crossing first, followed by the IS crossing, as shown in Figure 13(a). The restoration of the HCS to its original structure results in a second crossing of the HCS some time after the passage of the shock (see the second crossing of the HCS in Figure 13(a)). The HCS-shock interaction is poorly understood observationally, although simulations shed a little light on the process (Odstrcil et al. 1996; Hu & Jia 2001).
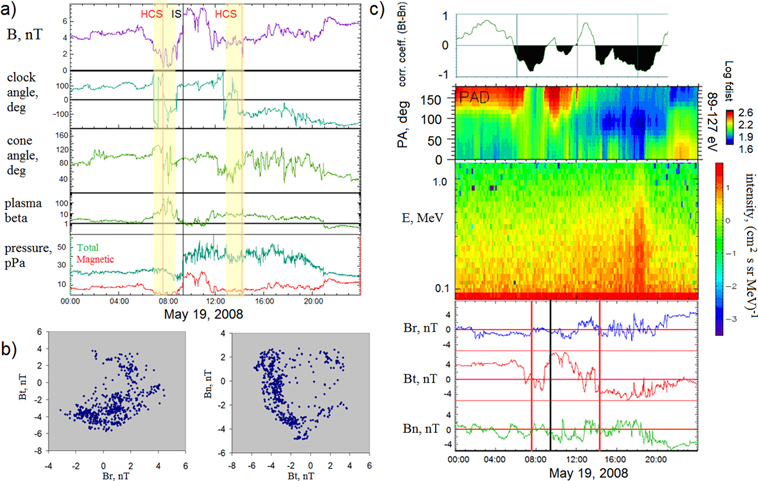
Figure 13. 2008 May 19 STEREO A observations of plasma and magnetic field parameters during an interaction of an IS with the HCS. STEREO A observations on 2008 May 19. (a) From top to bottom: the IMF strength, the clock and the cone IMF angles, the plasma beta, the total and the magnetic pressure. The vertical black line identifies the shock, red lines identify the main HCS crossings, and yellow stripes show the heliospheric plasma sheet. (b) Hodogram showing rotation of the IMF vector in islands observed from 12:04 to 21:15 UT with 1 minute resolution. (c) From top to bottom: the running correlation coefficient between Bt–Bn components, the suprathermal electron pitch-angle distribution function (spectrogram), and the energy of ions (spectrogram). The main enhancement in the energetic ion flux occurs downstream of the shock (black line), and at the same time, a prolonged dropout in the electron heat flux occurs, and corresponds to the largest magnetic island in the vicinity of the HCS.
Download figure:
Standard image High-resolution image
The state of the solar wind and the possible energization of charged particles after an IS passes through the HCS are not well understood. As discussed in the previous section, we found that the turbulent wake that trails an IS contains numerous magnetic islands (see also Odstrcil et al. 1996; Zank et al. 2015a). If this indeed is true, (i) the post-shock magnetic islands may be trapped in the vicinity of the highly disturbed HCS; (ii) the disturbed HCS may have a higher reconnection rate and consequently produce more magnetic islands. We can expect that the HCS and its neighborhood are likely to experience an extended highly turbulent state after its traversal by an IS. Figure 13 presents an example showing the interaction of an IS with the HCS.
An isolated IS passed STEREO A at 9:18 UT on 2008 May 19 (see the STEREO shock list at http://www-ssc.igpp.ucla.edu/forms/stereo/stereo_level_3.html). This corresponds to a sharp increase in the total pressure as shown in the bottom panel of Figure 13(a), marked by the black vertical line. With the exception of the HCS, an examination of solar wind plasma parameters does not reveal the presence of any other structures that can possibly contaminate this observation. The vertical red lines in Figure 13(a) identify the main HCS crossings. Yellow stripes, in common with previous examples, identify regions in which the IMF fluctuates, and which may be treated as the plasma sheet. The crossing of the HCS was seen to occur several hours prior to the arrival of the IS at 1 au. The clock and cone angles change sharply and the plasma beta exceeds 100 during the HCS crossing. The IS drives the HCS back so that the STEREO A finds itself again in the same sector it was in before the crossing of the HCS. Several hours later, the now restored HCS was detected by STEREO A for the second time (see Figure 13(a)).
An increased magnetic reconnection rate in combination with the occurrence of the turbulent wake of the IS leads to formation of a turbulent area containing numerous magnetic islands behind the IS. Figure 13(b) illustrates that the region of the crossing contains HCS-associated magnetic islands and a rotating magnetic field.
Figure 13(c) shows the suprathermal electron PAD function in the energy range 89–127 eV, the energetic ion dynamic spectrum, and the varying components of the IMF, over the same period used in Figure 13(a). Figure 13(c), upper panel, shows the running correlation coefficient between the tangential Bt and the vertical Bn components of the IMF (the time-window where the coefficient is calculated is 180 minutes, and the consequent shift is one minute).
The suprathermal electron PAD indicates that the electron propagation direction can fluctuate over a wide range. Bi-directional strahls (green horse-shoe-like area after the IS crossing) were observed during the HCS/plasma sheet crossing, which is in agreement with the suggestions of Zharkova & Khabarova (2015) discussed in Section 2.2.3. An extended flux dropout coincides with the main energetic ion increase, as shown in Figure 13(c). Khabarova et al. (2015a) suggested that strong pitch angle scattering near the HCS was a signature that magnetic islands are present. Using the RTN system as usual, one can find that the rotation of the IMF vector in the T–N plane is most prominent (Figure 13(b)). We can identify the approximate location of magnetic islands in time from the negative correlation coefficient between Bt and Bn (Figure 13(c), upper panel). We note that times with a strong negative correlation coefficient coincide with both suprathermal electron dropouts and multi-directional propagation.
The most significant increase in the energetic ion flux is behind the shock (Figure 13(c)). The maximum ion flux occurs exactly during the longest lasting electron flux dropout and period of pitch-angle isotropy.
In summary, the interaction of an IS with the HCS leads to a highly disturbed HCS that is eventually restored several hours later. The interaction yields energetic ion fluxes that increase significantly downstream of the shock, because the interaction confines and generates magnetic islands near the HCS.
Although just one example, this event illustrates that many unusual energetic particle events may admit an interpretation in terms of an IS interacting with the HCS. The theoretical models of Zank et al. (2015a, 2015b) and le Roux et al. (2015a, 2015b) incorporate many of the effects discussed here, but the detailed specifics of particle acceleration during this complex interaction remain to be elucidated.
3. DISCUSSION AND CONCLUSIONS
This paper presents several case studies of atypical energetic particle events (AEPEs) observed at 1 au that are not easily explained by the dominant SEP (keV–MeV) energization paradigm (DSA or flare-related acceleration) in the solar wind. DSA is a cumulative process that begins well before 1 au with the first formation of the shock, and of course flare-related acceleration occurs low in the solar corona. Both processes are evidently not local, meaning that an observer measures the result of distant physical processes. As described in this paper, numerous discrepancies between observations and standard or accepted theoretical interpretations indicate the possibility that important energization processes are instead occurring locally. This idea can be tested by considering observations made by multiple spacecraft.
A recently developed theory that posits particle energization via the dynamical compression and merging of magnetic islands in the supersonic solar wind (Zank et al. 2014, 2015a, 2015b, 2016; le Roux et al. 2015a, 2015b, 2016) can explain the observations described here. Although Zank et al. (2014, 2015a, 2015b, 2016) and le Roux et al. (2015a, 2015b, 2016) theoretically investigate particle acceleration that occurs in 2D magnetic islands, the theory can be applied to both 2D and 3D cases, first of all, as the analysis includes energization via induced and turbulent electric fields, whether they are produced by 2D islands or component reconnection with 3D structures. The essence of our approach is that the process is stochastic. Particles gain energy via an electric field, for example, induced by merging islands or flux ropes, trapped temporarily by large magnetic field curvatures or gradients before the pitch angle changes enough for the particle to escape in the 3rd dimension from the trapping region. The escaped particles propagate diffusively, experiencing pitch-angle scattering from fluctuations and waves that fill the regions between structures (and even within structures) until they encounter and are possibly temporarily trapped within another structure or encounter another electric field. Second, the observed hodograms show clear almost complete rotation of the IMF vector within magnetic islands, which is a sign of a twisted structure. It has been shown that the three-dimensionality plays an essential role in cases of Grad-Shafranov reconstructions of (i) very large flux ropes, observed, for example, within ICMEs (Riley et al. 2004; Möstl et al. 2009) or (ii) when a flux rope is significantly disrupted (González et al. 2015). At the same time, small-scale magnetic islands observed both in the terrestrial magnetosphere and in the solar wind at 1 au, and even larger flux ropes with a strongly pronounced twisted magnetic structure, can generally be analyzed under the 2D approach very well (Lui et al. 2008; Teh et al. 2010; Hu et al. 2014). Moreover, simulations allow to suppose that even large-scale structures, such as ICME magnetic clouds, resemble pancakes at 1 au, becoming more and more oblate during their propagation from the Sun (Riley & Crooker 2004), which is shown to be consistent with magnetically circular cross-sections of flux ropes observed in situ at 1 au (Savani et al. 2013). Therefore, the theory of Zank et al. (2014, 2015a, 2015b, 2016) and le Roux et al. (2015a, 2015b, 2016) that addresses many of the problems, arising typically from standard models of particle acceleration in the solar wind, can be applied to the cases considered in this observational work. We have discussed the different ways that particles may be confined, trapped and accelerated in some plasma/IMF configurations not only alternatively, but additionally to well-known mechanisms, supporting the theory developed by Zank et al. (2014, 2015a, 2015b, 2016) and le Roux et al. (2015a, 2015b, 2016). The confinement of flux ropes may be due to (i) the HCS–stream interaction, (ii) variations/interruptions of coronal flow streaming, (iii) stream-stream interaction, and (iv) HCS–IS interactions.
The HCS plays an important role in the formation of magnetic cavities and the production of small-scale magnetic islands. Khabarova et al. (2015a) have established that magnetic islands are permanently present in the vicinity of the reconnecting HCS, especially if it processes a rippled form, and that they are highly dynamical and evolve via reconnection-related processes such as contraction and merging. These processes occur concurrently and the rate at which one process or the other evolves is likely to depend on the local IMF configuration and what structures interact with the HCS (ICMEs, ISs, or CIRs/SIRs). Besides enhancing the generation of and creating a possibly rapid dynamical evolution of the magnetic islands, the presence of different structures leads to the confinement of the islands between two or more current sheets.
The occurrence of HCS distortion due to non-stationary processes has been discussed before, but it is usually supposed to be large-scale (see Foullon et al. 2010 and references therein). The HCS distortion and its folding back to the Sun is a popular way to explain the difference between sector crossings identified from electron pitch-angle spectrogram changes and via HCS signatures in IMF data (Kahler & Lin 1994, 1995; Crooker et al. 2004). However, observations of interplanetary scintillations that illustrate the HCS profile show that the HCS is a quite stable and "elastic" structure that significantly changes its form during interaction with ICMEs or CIRs, but does not show characteristics of folding back (Khabarova et al. 2015a). Under quiet conditions, the HCS tends to possess a large-scale wavy and rippled (plisse-like) form, which is in agreement with simulations (Czechowski et al. 2010; Merkin et al. 2011). Sometimes, these ripples can be observed through the whole of the HCS plane. The small-scale HCS ripples confine magnetic islands, which allows for a much more efficient particle energization process than is likely to occur when the HCS is planar or wave-like on a large spatial scale. The combination of magnetic reconnection and a rippled form of the HCS can produce particle acceleration even without the HCS-stream interaction, but it is especially effective if the rippled HCS is distorted by propagating ICMEs, CIRs, coronal hole flows or ISs.
We confirm here our previous conclusion (Khabarova et al. 2015b) that the presence of strong current sheets at the leading/trailing edges of interacting structures increases the probability to observe regions filled with magnetic islands, because such current sheets are thought to represent magnetic walls or magnetic boundaries that propagate approximately perpendicular to the ecliptic plane. Their interaction leads to the formation of magnetically confined cavities as observed by SMEI and STEL. The occurrence of EPFEs near coherent magnetic structures, most of which are strong current sheets, has also been found by Tessein et al. (2016).
In summary, observations show that energetic particles may be accelerated locally in the solar wind due to both dynamical processes in magnetically confined magnetic islands and a combination of DSA and magnetic-island-reconnection-related processes (Zank et al. 2014, 2015a, 2015b, 2016; le Roux et al. 2015a, 2015b, 2016).
(i) We find that significant particle acceleration may be observed in regions filled with magnetic islands that are bounded by the HCS and the strongest current sheet at the leading edge of a CIR interacting with the HCS. Within CIRs, particles appear to be accelerated up to keV–MeV energies if magnetic islands exist between CIR-associated current sheets. Due to complicated interactions, boundaries of CIRs may form ∇-shaped magnetic cavities that confine dynamical magnetic islands, accelerating particles to MeV energies, as sometimes observed between CIRs.
(ii) Observations, such as those of the ICME–HCS interaction, show that an ICME-associated increase in the solar wind density/total pressure does not contribute to effective particle acceleration to MeV energies, but AEPEs can be observed in regions of low density, surrounding an ICME, if the occurrence of disturbed and rippled HCS around the ICME prevents free streaming of particles accelerated diffusively at the ICME-driven shock wave. The energized particles get confined by the rippled HCS and trapped by magnetic islands in this region.
(iii) When magnetic islands are present in the vicinity of strong current sheets, we confirm that prolonged electron heat flux dropouts and strong pitch-angle scattering often coincide with energetic ion intensity increases observed in areas filled with small-scale magnetic islands. We also provide evidence for the propagation of bi-directional strahls along local strong current sheets not connected to the Sun, which is in accordance with results obtained by Zharkova & Khabarova (2015), who simulated particle dynamics and showed that strahls observed in the solar wind near current sheets might be created locally by magnetic reconnection.
(iv) The occurrence of magnetic islands in turbulent regions associated with ISs leads to AEPEs observations that cannot be explained by classical DSA theory. Intense energetic ion flux enhancements are often observed in the turbulent wake behind ISs rather than exactly at the shock, as would be predicted by DSA theory. For CIRs, the maximum energetic ion increase can be associated with current sheets that confine magnetic islands, but not with the forward/reverse shocks. For an isolated IS interacting with the HCS, maximum energies can be associated with the post-shock restoration of the HCS and magnetic islands in the case of an isolated shock, which coincides with a strong current sheet. For ICMEs, the maximum increase of energetic ion flux can be observed both in the turbulent sheath and within the main body of an ICME detached from the Sun.
(v) Magnetic confinement may occur due to the trapping and re-acceleration of particles inside distorted magnetic clouds as a result of the ICME interaction with other streams. If an ICME is not connected to the Sun, and the original magnetic cloud is fragmented into several middle-size flux ropes, the theory of particle acceleration by dynamical magnetic islands may be applied.
(vi) The HCS enhances the efficiency and effectiveness of the post-shock magnetic island energization process because it makes the turbulent post-shock region broader, acts to generate magnetic islands due to the increased reconnection rate and effectively confines the created magnetic islands, providing favorable conditions for particle re-acceleration via mechanisms proposed by Zank et al. (2014, 2015a, 2015b) and le Roux et al. (2015a, 2015b).
Figures 1, 2 and 13 were discussed in Khabarova et al. (2015b) and published in accordance with the IOP Proceedings License http://conferenceseries.iop.org/content/quick_links/IOP%20Proceedings%20Licence. Figure 9 is modified from Aran et al. (2010). SMEI and STELab data are from the official website http://smei.ucsd.edu/new_smei/data&images/data&images.html (we are grateful to B. Jackson for his work on the SMEI/STEL project and popularization of its results). Heliospheric Imager movies can be found at the SECCHI official website: http://secchi.nrl.navy.mil/index.php?p=movies (thanks to R. Harrison, the principal investigator). The Solar Electron and Proton Telescope STEREO data were obtained from the http://www2.physik.uni-kiel.de/STEREO/index.php (University of Kiel, Germany). We personally thank representatives of the STEREO team B. Heber and A. Klassen for their interest to the paper. HET data are from http://www.srl.caltech.edu/STEREO/Public/HET_public.html (thanks to A. Davis and T. von Rosenvinge), and other STEREO data were provided by the STEREO science center: http://stereo-ssc.nascom.nasa.gov/data.shtml. The list of disturbances and transients observed by STEREO A and B can be found at http://www-ssc.igpp.ucla.edu/forms/stereo/stereo_level_3.html (thanks to Lan Jian), and lists from the Wind and ACE spacecraft—at https://www.cfa.harvard.edu/shocks/wi_data/ and http://www.ssg.sr.unh.edu/mag/ace/ACElists/obs_list.html correspondingly.
High-resolution ACE data were taken from the official Goddard Space Flight Center OMNIweb plus Web site: http://omniweb.gsfc.nasa.gov. TIPSOD 4.2 application was used to build spacecraft orbits, thanks to the NASA Goddard Space Flight Center, Space Physics Data Facility. We thank the teams that provide CACTUS and Heliospheric Imager catalogs (http://sidc.oma.be/cactus/catalog.php and http://www.helcats-fp7.eu/catalogues/wp2_cat.html respectively). We acknowledge the partial support of NASA grants NNX08 AJ33G, Subaward 37102-2, NNX09AG70G, NNX09AG63G, NNX09AJ79G, NNG05EC85C, Subcontract A991132BT, NNX09AP74A, NNX10AE46G, NNX09AW45G, and NNX14 AF43G, and NSF grant ATM-0904007. OVK was supported by RFBR grant 14-02-00769 and partially by RFBR grant no. 16-02-00479. JAlR acknowledges support from NASA grants NNX14AF43G and NNX15AI65G. OEM received funding from the European Union's Horizon 2020 research and innovation program under grant agreement No 637324.