


Abstract
Titan's thick atmosphere is primarily composed of nitrogen and methane. Complex chemistry happening in Titan's atmosphere produces optically thick organic hazes. These hazes play significant roles in Titan's atmosphere and on its surface, and their optical properties are crucial for understanding many processes happening on Titan. Due to the lack of such information, the optical constants of laboratory-prepared Titan haze analogs are essential inputs for atmospheric modeling and data analysis of remote-sensing observations of Titan. Here we perform laboratory simulations in a Titan-relevant environment, analyze the resulting Titan haze analogs using vacuum Fourier transform infrared spectroscopy, and calculate the optical constants from the measured transmittance and reflectance spectra. We provide a reliable set of optical constants of Titan haze analogs in the wavelength range from 0.4 to 3.5 μm and will extend it to 28.5 μm in the near future, which can be used for analyzing both existing and future observational data of Titan. This study establishes a feasible method to determine optical constants of haze analogs of (exo)planetary bodies.
Export citation and abstract BibTeX RIS

Original content from this work may be used under the terms of the Creative Commons Attribution 4.0 licence. Any further distribution of this work must maintain attribution to the author(s) and the title of the work, journal citation and DOI.
1. Introduction
In Titan's atmosphere, complex chemistry induced by solar UV radiation and Saturn's magnetospheric electron bombardment produces thousands of organic molecules, leading to the formation of organic hazes and condensate layers (see, e.g., Sagan et al. 1992; Coll et al. 1999, 2013; Cable et al. 2012; Hörst 2017). The organic materials will eventually fall to the surface of Titan and may interact with surface materials. The organic chemistry and resulting organic molecules are intriguing because of their prebiotic implications (see, e.g., Neish et al. 2010; Hörst et al. 2012; Sebree et al. 2018). Titan has a dense N2-rich atmosphere, an Earth-like hydrological cycle, seasonal weather patterns, stable liquid on its surface (rivers, lakes, and seas) and other Earth-like surface features (sand dunes, deltas, and mountains), and, most importantly, the complex, carbon-rich chemistry happening in the atmosphere and on the surface (Hörst 2017). The combination of all of these features makes Titan an ideal place for studying prebiotic chemistry outside of Earth's environment. The successful Cassini–Huygens mission revealed many mysteries of Titan and rewrote our understanding of this Earth-like world, and the upcoming Dragonfly mission will explore the habitability of and investigate the prebiotic chemistry happening on Titan.
The organic hazes not only affect Titan's physical and chemical processes but also impact our observations and understanding of Titan. The optical and physical properties of Titan hazes are essential for modeling and analyzing observational data but are not always available. Therefore, Titan haze analogs, or tholins, have been prepared in the laboratory to simulate the chemical processes happening in Titan's atmosphere. Four decades of studies on tholins have advanced our understanding of Titan's atmosphere (see, e.g., Cable et al. 2012; Coll et al. 2013; Brasseé et al. 2015). The properties of tholins have been widely used for interpreting Titan observations, especially the optical constants that have been used for analyzing data acquired by several instruments on board the Cassini–Huygens spacecraft (Tomasko et al. 2008; Bellucci et al. 2009; Lavvas et al. 2010; Rannou et al. 2010; Vinatier et al. 2012), including the Huygens Descent Imager/Spectral Radiometer (DISR; 0.35–1.7 μm), the Cassini Visible and Infrared Mapping Spectrometer (VIMS; 0.35–5.1 μm), and the Composite Infra-Red Spectrometer (CIRS; 7–1000 μm). The optical constants of tholins can also be utilized for future observations with the James Webb Space Telescope and the Dragonfly mission.
Several studies have reported the optical constants of tholins that were prepared using different setups and under different conditions (e.g., Khare et al. 1984; Ramirez et al. 2002; Tran et al. 2003; Vuitton et al. 2009; Hasenkopf et al. 2010; Imanaka et al. 2012; Mahjoub et al. 2012; Sciamma-O'Brien et al. 2012; Ugelow et al. 2017). They also used different techniques to determine the optical constants, such as spectrophotometry, ellipsometry, Brewster angle spectroscopy, cavity ring-down spectroscopy (CRDS), and photodeflection spectroscopy. Unsurprisingly, Titan tholins from these studies show wide variations in optical constants (Brasseé et al. 2015). The tholins used in the previous work were prepared at room temperature (300 K) rather than cryogenic temperature to simulate Titan's environment. Most of the optical measurements were performed under ambient conditions, and the results may be impacted by contamination from Earth's atmosphere. The purpose of this study is to provide a reliable set of optical constants of the Titan tholins produced using the Planetary HAZE Research (PHAZER) chamber (He et al. 2017). Our Titan experiment is conducted at ∼100 K, and the optical properties are measured using vacuum Fourier transform infrared spectroscopy (FTIR). We focus on the optical constants in the wavelength range from 0.4 to 3.5 μm in this study and will extend to 28.5 μm in the near future.
2. Materials and Experimental Methods
2.1. Haze Analog Production
The Titan haze analog is produced using the PHAZER chamber (Figure 1) at Johns Hopkins University (He et al. 2017). The gas mixture is prepared in a stainless-steel cylinder by mixing 5% CH4 (99.99% Airgas) in N2 (99.999% Airgas). The gas mixture is cooled down to 100 K by flowing through a cooling coil. As reported previously (He et al. 2017), the 15 m stainless-steel cooling coil is immersed in liquid nitrogen (77 K), which cools the gas mixture and removes trace impurities, and the temperature of the gas mixture is determined based on the ideal gas law (P1 /P2 = T1/T2). The gas flow rate is 10 standard cm3 minute–1, and the pressure in the chamber is 2 Torr. Under such conditions, the reactant gas mixture is exposed to the cold plasma discharge for about 3 s. The detailed experimental procedure can be found in our previous study (He et al. 2017).
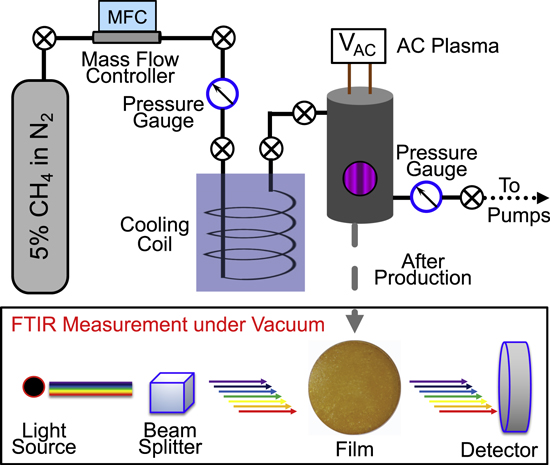
Figure 1. Schematic of the experimental setup for tholin film sample production and FTIR measurement.
Download figure:
Standard image High-resolution imageTo prepare a film sample for the spectroscopy measurement, we placed optical-grade quartz substrates (diameter: 25.4 mm; thickness: 1.6 mm; Ted Pella, Inc.) in the chamber for sample collection. After continually running the experiment for 72 hr, we put the chamber under vacuum for 48 hr to remove the volatile components. Therefore, our measurement may not be able to capture some spectral features of the volatile components in the tholin. After warming up, the film samples were collected in a dry-N2 glove box (InertCorp.). The freshly produced film samples (within 2 hr after collection) are used for the spectroscopy measurement to avoid aging or contamination. The film samples are yellow-orange in color, as shown in Figure 1, and the surfaces are very smooth, with a surface roughness (Rq ) of less than 3 nm (examined using atomic force microscopy; He et al. 2018a).
2.2. Vacuum FTIR Measurement
The film samples deposited on quartz substrates are characterized with a Vertex 70v FTIR spectrometer (Bruker Corp.). It is a vacuum spectrometer (both the sample compartment and the optics), which can reduce the spectral features of Earth's atmosphere (H2O or CO2 absorption) and thus increase the peak sensitivity without masking very weak spectral features. The spectrometer is capable of measuring transmittance and reflectance from 0.4 to 28.5 μm (25,000 to 350 cm−1) with a resolution of 0.4 cm−1. Our film samples are deposited on quartz substrates because quartz is chemically inert, neither changing under glow discharge nor reacting with the gas mixture in our reaction chamber. However, quartz is opaque to wavelengths longer than 3.5 μm. Therefore, in the current study, we only measured the film samples on quartz substrates in the wavelength range of 0.4 to 3.5 μm, despite the spectrometer's wider wavelength coverage. We will explore other potential substrates that can be used in the reaction chamber and are also transparent in the mid-IR range, such as CaF2, KBr, NaCl, and Si, in order to accurately measure the spectra of the film samples in the mid-IR range.
For the measurement, a fresh film sample was carefully transferred to the spectrometer for measurement without exposure to air (using a N2 glove bag). The transmittance and reflectance of the film on quartz substrate were measured from 0.4 to 3.5 μm under vacuum (below 0.2 mbar) at room temperature (294 K). The spectra were acquired with two detectors (silicon diode and DLaTGS) and two beam splitters (quartz and KBr). From 0.4 to 1.11 μm (25,000 to 9000 cm−1), we employed the silicon diode detector and quartz beam splitter; from 0.83 to 1.25 μm (12,000 to 8000 cm−1), we employed the DLaTGS detector and quartz beam splitter; and from 1.11 to 3.5 μm (9000 to 2850 cm−1), we employed the DLaTGS detector and KBr beam splitter. Overlapping data confirm that the spectrometer is calibrated properly across different wavelength ranges. We configured the instrument to acquire 250 scans for each measurement and obtain spectra with a resolution of ∼2 cm−1. The transmittance was measured at a normal angle with a standard sample holder, while the reflectance was measured with a reflection accessory (A510 reflection unit). We measured the transmittance of a blank quartz disk and the reflectance of the gold standard as references. The transmittance and reflectance spectra of the sample were obtained by dividing the sample measurement by the reference measurement in each case. This procedure ensures that all other factors (the light source, beam splitter, mirrors, and detector) affecting the spectrum are eliminated, and the resulting spectrum only displays the spectral features originating from the sample itself. Note that the true reflectance of our sample from 0.4 to 0.7 μm can be up to 64% lower because we use a gold mirror, which is not calibrated, as a reference, and the reflectance of the gold mirror drops significantly below 0.7 μm (0.97 at 0.7 μm, 0.93 at 0.65 μm, 0.9 at 0.6 μm, 0.78 at 0.55 μm, 0.45 at 0.5 μm, and 0.36 at 0.4 μm; Bennett and Ashley 1965; Beran 1985). We discuss how the uncertainty of the reflectance spectrum affects the derived optical constants in Section 3.1.
2.3. Spectroscopy Data Analysis
To calculate n and k from the transmittance (T) and reflectance (R) of the film sample, we need to know the film thickness. For a thin film, light waves reflected from upper and lower surfaces will interfere with one another, either enhancing or reducing the reflected light. The film thickness (t) can be calculated from the appearance of the interference fringe in the spectrum by Equation (1) (Rancourt 1996; Stenzel 2005),

where n is the refractive index of the film material, i is the angle of incidence, and x is the number of fringes between two wavenumbers (v1 and v2 ).
Figure 2 shows the transmittance and reflectance spectra of our film sample. Interference fringes are observed in both spectra. From the observed interference fringes in the reflectance spectrum, we can get x, v1, and v2 for Equation (1); the angle of incidence (i) is 11° in our experiments. The refractive index of our tholin sample is unknown at this point. However, several studies have reported that the refractive indices of tholin samples are about 1.5–1.7 in the wavelength range from 0.4 to 1.2 μm. So, we first estimated the film thickness by using an average reported value (no = 1.55) of the refractive index. The estimated film thickness (t1) is 1.5 μm. We recalculated the film thickness after we constrained the refractive index of our tholin sample. As the choice of the initial n value, we tried different values (no = 1.50, 1.55, 1.60, and 1.70) for the calculation and found that the initial choice of the n value only increases or decreases the times of the calculation cycle but does not affect the final result.

Figure 2. Transmittance (top) and reflectance (bottom) spectra of our Titan tholin film sample in the visible and near-IR region (25,000 to 2850 cm−1, or 0.4 to 3.5 μm). The spectra in red (2850–9000 cm−1) were acquired with the DLaTGS detector and KBr beam splitter, the spectra in blue (8000–12,000 cm−1) with the DLaTGS detector and quartz beam splitter, and the spectra in purple (9000–25,000 cm−1) with the silicon diode detector and quartz beam splitter. The interference fringes are observed in the original spectra, and the spectra after removing the interference fringes are shown by the black dashed lines.
Download figure:
Standard image High-resolution imageThe interference fringes were removed following the method described in Neri et al. (1987) to eliminate their effect on optical constant calculation. The transmittance and reflectance spectra after the interference fringe removal are shown in Figure 2 (dashed lines). The correction was given in Neri et al. (1987) as

where xn is the nth abscissa, F(xn ) is the fringe-removed spectrum value at xn , G(xn ) is the original spectrum value at xn , G(xn+m ) and G(xn–m ) are the original spectrum values at shifted abscissae, and 2m is the maximum integer number of points contained in the interval d, which is the average fringe spacing. For our transmittance and reflectance spectra, the average fringe spacing (d) is about 2800 cm−1, and there are 1448 points (m = 724) contained in the interval d.
The reflectance and transmittance spectra after the interference fringe removal are plotted separately in Figure 3 as a function of wavelength, which shows the spectral features more obviously. As shown on the transmittance spectrum, there are a few absorptions features at 0.42, 3.0, 3.1, 3.36, 3.40, and 3.48 μm. The absorption at 0.42 μm is consistent with the yellow color of the film, likely caused by the presence of aromatic compounds and/or unsaturated species with conjugated pi bonds (Rao 1975; van Krevelen and te Nijenhuis 2009). The peaks at 3.0, 3.1, 3.36, 3.40, and 3.48 μm are caused by absorption of organic functional groups in the sample. The absorptions at 3.0 (∼3330 cm−1) and 3.1 (∼3230 cm−1) μm are characteristic of the stretching of the N–H bonds, while the features at 3.36–3.48 μm (2870–2980 cm−1) are due to C–H bond stretching (Lin-Vien et al. 1991; Socrates 2001). The absorption features of the N–H and C–H bonds indicate the presence of amines and hydrocarbons in the sample, which is consistent with our previous result with nuclear magnetic resonance spectroscopy on the sample produced under identical conditions (He et al. 2017). Other functional groups, such as nitriles, imines, and aromatics (e.g., Coll et al. 1999; Imanaka et al. 2004; Gautier et al. 2012; He et al. 2012; Sciamma-O'Brien et al. 2017), are likely present in the sample, but their absorption features are beyond the wavelengths we measured.
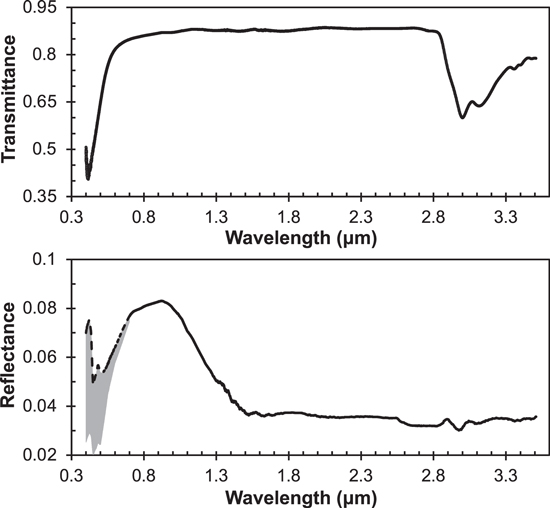
Figure 3. Transmittance (top) and reflectance (bottom) spectra of our Titan tholin film sample as a function of wavelength after removing the interference fringes. The reflectance from 0.4 to 0.7 μm is shown as a dashed line with a shaded gray area for the uncertainty due to the uncalibrated gold mirror.
Download figure:
Standard image High-resolution imageWe calculated the optical constants (N = n+ik, where N is the complex refractive index, i is the square root of −1, n is the refractive index, and k is the extinction coefficient) of the film following the method described in Khare et al. (1984). Because the quartz substrate is transparent in the studied wavelength range (0.4–3.5 μm), the transmittance (T) can be expressed as in Equation (3),

where R is the reflectance, t is the film thickness, and k is the extinction coefficient. Then, the extinction coefficient (k1) can be calculated with the estimated thickness and measured transmittance and reflectance spectra (Equation (4)):

According to the Fresnel equation for the reflection coefficient (r) from an absorbing medium, the reflectance (R) can be expressed as (Jahoda 1957; Khare et al. 1984; Mistrik et al. 2017)

Then, the refractive index (n) can be determined from the reflectance data (R) and calculated extinction coefficient (k) using the following relation:

Note that Equation (5) is only an approximation of the reflectance measured in this study, because it does not take the properties of the substrate or the film thickness into account; this simplified equation allows an analytical solution for the value of n with Equation (6). Using the new calculated refractive index (n1) of our sample, we calculated a new set of the film thickness (t2), extinction coefficient (k2), and refractive index (n2) with Equations (1), (4), and (6). We continued the calculation cycle until the change of the refractive index was less than 0.2% [(nm−1 − nm )/nm < 0.002]. This procedure was done at all wavelengths. Based on Equation (6), the n value is not sensitive to the change of k when k is very small. In our last calculation cycle, the change of the n values is very subtle (<0.01%) from 0.4 to 2.8 μm and slightly larger (0.01%–0.2%) from 2.8 to 3.5 μm. The largest change (0.2%) occurs at 3.0 μm. The final thickness was determined to be 1.219 μm, while the final extinction coefficient (km ) and refractive index (nm ) are shown in Figure 4. Note that we used the reflectance measured at a near-normal incidence angle (11°) instead of a normal incidence angle because the values should be very close to each other. According to the Fresnel equations and Schlick's model (Schlick 1994), the specular reflection coefficient R can be approximated by

where R0 is the reflection coefficient at normal incidence, and θ is the incidence angle. For our case, the incidence angle is 11°, and (1 − cos θ)5 is about 2 × 10⁻⁹. So, the last term in the equation can be neglected, and the reflection coefficient at near-normal incidence (11°) is very close to the reflection coefficient at normal incidence, i.e., R = R0.
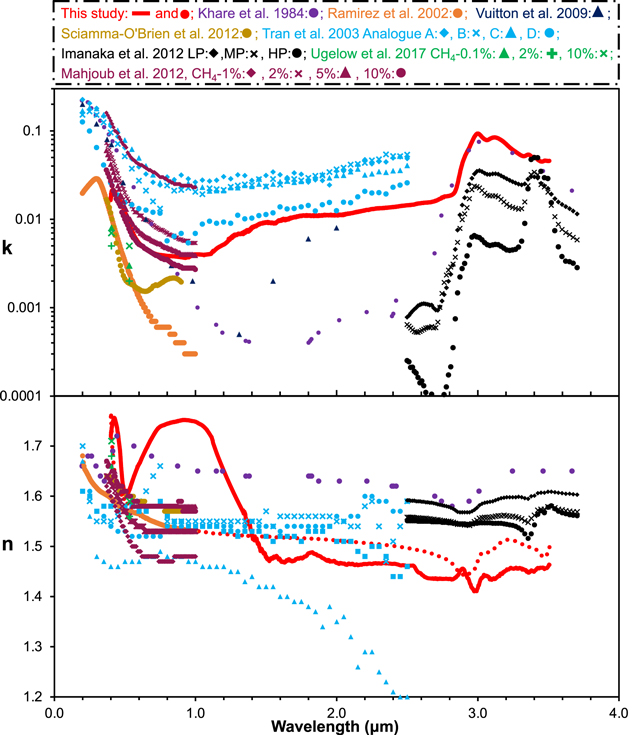
Figure 4. Optical constants of our Titan tholin sample (red) from 0.4 to 3.5 μm. Top: extinction coefficient (k). Bottom: refractive index (n) obtained from two independent methods (solid red line from Equation (6) and dotted red line from Equation (9)). Our optical constants are available as the data behind the figure. The optical constants of the Titan tholins in this wavelength range from previous studies are also plotted for comparison (colors and symbols are labeled at the top).(The data used to create this figure are available.)
Download figure:
Standard image High-resolution imageRamirez et al. (2002) showed that light scattering could affect the calculation of optical constants. When light scattering is significant, the calculations performed with specular measurements would lead to an underestimation of the extinction coefficient (k). The scattering loss (Is ) on a surface is related to surface roughness (Rq ) and light wavelength (λ) following Equation (8) (Bennett and Porteus 1961), where R0 is the reflectance of a perfectly smooth surface:

The scattering loss (Is ) decreases toward longer wavelengths. The surface of our tholin films is very smooth, with a surface roughness (Rq ) of less than 3 nm, as demonstrated with atomic force microscopy (He et al. 2018a). Therefore, the scattering loss (Is ) on our tholin film is less than 0.8% in the wavelength range we measured, which has a negligible effect (within the measurement error) on the optical constant calculations with the specular measurements.
Besides using Equation (6), we obtained another set of n values independently by performing the Kramers–Kronig analysis. The Kramers–Kronig relation between n and k is given by the dispersion relation (see, e.g., Wood and Roux 1982; Toon et al. 1994; Imanaka et al. 2012),
where ν represents wavenumber (cm−1), P indicates the Cauchy principal value, and n0 is the real refraction index at ν0. The principal value should be integrated for the entire wavelength range. We used our derived k values from 2850 to 25,000 cm−1 in the integrand and assumed that the k value outside the measured wavelength range is a constant. The assumption for the integral in the Kramers–Kronig relation (Equation (9)) is generally valid unless a large local absorption peak exists just outside our measurement range. As discussed in previous studies (see, e.g., Toon et al. 1994; Imanaka et al. 2012), using an anchor point (n0 ) can reduce the uncertainty from the above numerical integration. Here we used the n value determined from Equation (6) at 2.91281 μm (ν0 = 3333.11 cm−1) as the anchor point because its uncertainty is relatively small (∼2.7%). By employing the same calculation cycle procedure, we calculated a new set of n, k, and film thickness (t) with Equations (1), (4), and (9). The iterative process stops when the termination criterion is met [(nm−1 − nm )/nm < 0.002]. We also calculated using a different anchor point (the n value at 1.36802 μm determined from Equation (6)) and found that the calculations using two different anchor points (1.36802 versus 2.91281 μm) yield similar results (the differences are within the range of uncertainties). We present the results from the calculation using the anchor at 2.91281 μm because the uncertainties are smaller (Figure 4 and the data behind the figure). From this method, the thickness is determined to be 1.293 μm. Due to the small thickness difference, the derived k values are ∼6% lower than those derived from Equations (1), (4), and (6). However, the k values are not plotted separately in Figure 4 because the change is uniform and small. The derived n values from the Kramers–Kronig analysis (Equation (9)) are shown in Figure 4 for comparison with those derived from Equation (6).
3. Results and Discussions
3.1. Optical Constants of Our Titan Tholins Compared with Other Titan Tholins
Figure 4 shows the optical constants of our Titan tholin sample in the wavelength range from 0.4 to 3.5 μm, along with previously reported optical constants of Titan tholins in this wavelength range (Khare et al. 1984; Ramirez et al. 2002; Tran et al. 2003; Vuitton et al. 2009; Imanaka et al. 2012; Mahjoub et al. 2012; Sciamma-O'Brien et al. 2012; Ugelow et al. 2017). In the measured wavelength range, the extinction coefficient, k, varies greatly from 0.0037 to 0.093. The two sets of refractive indices (n) obtained from two independent methods (Equations (6) and (9)) are close. The n values are in the range between 1.41 and 1.76, and the value differences from two methods are up to 14% at short wavelengths (0.4–1.5 μm) but less than 5% at longer wavelengths (>1.5 μm).
There are several factors that introduce uncertainties to the derived optical constants, including the systematic measurement uncertainty from the spectrometer, the large uncertainty of the measured reflectance below 0.7 μm due to the gold mirror, the interference fringe removal, and the film thickness calculation. In addition, the uncertainties of the derived k values propagate to the derived n values in both methods (Equations (6) and (9)), and the uncertainty of the anchor n value (from Equation (6)) also propagates to the n values derived from Equation (9). We evaluated all of the factors and estimated the overall uncertainties for the two sets of k and n (provided as the data behind Figure 4 along with the n and k values). The two sets of k values obtained from the two methods have similar uncertainties. The uncertainties for the k values are about 3%–6% at longer wavelengths (>1.5 μm) but increase to 10% at short wavelengths (0.4–1.5 μm). The two sets of n values also have small uncertainties (less than 4%) at longer wavelengths (>1.5 μm). At short wavelengths (0.4–1.5 μm), the n values derived from the first method (Equations (1), (4), and (6)) have larger uncertainties (5%–14%), while the n values calculated from the Kramers–Kronig method (Equations (1), (4), and (9)) have smaller uncertainties (3%–6%) for two reasons. First, the k values are integrated over the entire wavelength range in Equation (9), so the larger uncertainties of the small k values in this range carry less weight when calculating n values with Equation (9); second, Equation (9) does not use the measured reflectance directly, so the large uncertainty of the measured reflectance below 0.7 μm has little impact on the calculated n value. Therefore, we believe the n values obtained from the Kramers–Kronig analysis (Equation (9)) are closer to the real n values at short wavelengths (0.4–1.5 μm). The comparison with prior studies in Figure 4 confirms that the value and trend of the n values obtained from the Kramers–Kronig analysis (Equation (9)) are more similar to the values reported previously. Nonetheless, the similarity between two sets of n values indicates that both methods provide relatively accurate n values, with the Kramers–Kronig analysis being more accurate at short wavelengths (0.4–1.5 μm).
The optical constants of Titan tholins in the range 2.5–3.5 μm are reported in two other studies (Khare et al. 1984 and Imanaka et al. 2012). In this range, the extinction coefficient (k) of our sample is comparable to that in Khare et al. (1984) from 2.8 to 3.3 μm but higher at other wavelengths (2.5–2.7 and 3.3–3.5 μm). Compared to the data from Imanaka et al. (2012), our k values are always higher in the range of 2.5 to 3.5 μm. The N–H absorption features (3.0 and 3.1 μm) in our sample are comparable to those of Khare et al. (1984) but stronger than those of Imanaka et al. (2012), while the C–H features (3.36–3.48 μm) in our sample are comparable to those in the low-pressure sample of Imanaka et al. (2012) but stronger than all other samples in both studies. In shorter wavelengths (0.4–2.5 μm), our k values fall within the range of the reported values in previous studies (Khare et al. 1984; Ramirez et al. 2002; Tran et al. 2003; Vuitton et al. 2009; Mahjoub et al. 2012; Sciamma-O'Brien et al. 2012; Ugelow et al. 2017). As we discussed earlier, we think the n values obtained from the Kramers–Kronig analysis (Equation (9)) are closer to the real n values at short wavelengths (0.4–1.5 μm). Our n values from both methods fall within the range of the reported values from 1.5 to 2.5 μm but are at the lower end from 2.5 to 3.5 μm. We should note that the optical constants compared here were determined using different techniques, such as spectrophotometry (Khare et al. 1984; Ramirez et al. 2002; Tran et al. 2003; Imanaka et al. 2012), ellipsometry (Mahjoub et al. 2012; Sciamma-O'Brien et al. 2012), Brewster angle spectroscopy (Khare et al. 1984), CRDS (Hasenkopf et al. 2010; Ugelow et al. 2017), photodeflection spectroscopy (Vuitton et al. 2009), etc. In those studies, the tholin samples were also produced under different conditions using different setups.
The different experimental conditions and the techniques used to determine the optical constants can be found in Tables 1 and 2 in Brasseé et al. (2015), except for a recent study by Ugelow et al. (2017). They produced tholins with 0.1%, 2%, or 10% of CH4 in N2 using spark discharge at room temperature and determined the optical constants at 0.405 and 0.532 μm with the CRDS technique. The gas mixtures used in the previous studies (Khare et al. 1984; Ramirez et al. 2002; Tran et al. 2003; Vuitton et al. 2009; Mahjoub et al. 2012; Sciamma-O'Brien et al. 2012; Ugelow et al. 2017) are primarily N2 (>90%) and CH4, with one study adding trace species (Tran et al. 2003). Two kinds of energy sources, UV photons and plasma discharges, are used to induce the chemical processes. The tholin samples produced with electrical discharges usually have a higher nitrogen content than those with UV photons because the electrical discharges are energetic enough to dissociate N2 directly (e.g., Imanaka et al. 2004; He et al. 2017).
Among the tholin samples compared here, our tholin sample is the only one that was produced at low temperature (∼100 K), simulating the cold environment in Titan's atmosphere (He et al. 2017). We have also been extremely careful with sample collection (in the N2 glove box) and measurements (under vacuum) to avoid contamination and eliminate the spectral features from Earth's atmosphere. Measurements in previous studies were usually done under ambient conditions or in a purged system. Among the optical constants compared here, only Khare et al. (1984) and our study have continuous data in this wavelength range (0.4–3.5 μm). However, the optical constants in this range from Khare et al. (1984) were calculated based on two measurements (0.4–2.5 and >2.5 μm) on different instruments with different samples; furthermore, these measurements were done with very low resolution. Our measurements here used one film sample on a single vacuum FTIR spectrometer. We will extend the measurement to the mid-IR range (up to 28.5 μm) with the same spectrometer in the near future.
3.2. Implication for Titan and Beyond
The optical constants of the Titan tholin samples have been used for atmospheric modeling and observation data analysis for Titan (e.g., Rages & Pollack 1980; Tomasko et al. 2008; Bellucci et al. 2009; Lavvas et al. 2010; Rannou et al. 2010; Vinatier et al. 2012); in particular, the data from Khare et al. (1984) have been widely used because of their extensive spectral coverage, from 0.025 to 1000 μm. We need to acknowledge that Khare et al.'s work provided fundamental optical data for many theoretical models and helped us gain valuable information on Titan's haze and atmosphere. Indeed, the optical data from Khare et al. (1984) could approximately fit the observations in visible wavelengths. However, we should also realize that Khare et al.'s optical data may not fit well with Cassini VIMS and CIRS observations in certain wavelengths (Bellucci et al. 2009; Rannou et al. 2010; Vinatier et al. 2012).
As shown in Figure 5, the optical constants from our current study and others can provide a better fit to the observations in a certain wavelength range than Khare et al.'s data (Brasseé et al. 2015). For example, the extinction coefficients (k) of sample D from Tran et al. (2003) are similar to the retrieved extinction coefficients (k) from the Cassini–Huygens observations in the 0.8–1.2 μm range, and our k values are closer to the retrieved ones from 1.2 to 1.6 μm (Lavvas et al. 2010; Rannou et al. 2010). Also, the 23 mbar sample from Imanaka et al. (2012) captures the broad absorption feature at 3.4 μm, in agreement with observational data (Bellucci et al. 2009; Rannou et al. 2010). None of the lab-measured optical constants can match the retrieved values from observations in the entire wavelength range. The discrepancy may reflect the compositional difference of Titan hazes at different altitudes, because various instruments on the Cassini–Huygens spacecraft were sensitive to and probed different altitudes of Titan's atmosphere (Hörst 2017). Experiments with different setups and conditions simulate diverse chemical processes and result in tholins with distinct compositions, which may be representative of Titan hazes at different altitudes. Therefore, it is necessary to produce tholin samples under a variety of conditions (CH4/N2 ratios, pressures, and energy sources/densities) and determine their optical constants in a wide wavelength range. Doing so can help one understand the formation and properties of Titan hazes. The measured optical constants will be useful not only for reanalyzing the observational data of Titan from past missions but also for interpreting future Titan observations with the James Webb Space Telescope and the Dragonfly mission.

Figure 5. Extinction coefficients (k) retrieved from observational data (Lavvas et al. 2010; Rannou et al. 2010) and derived from laboratory-measured data (this study; Khare et al. 1984; Tran et al. 2003; Imanaka et al. 2012).
Download figure:
Standard image High-resolution image
With developments in space exploration, proper optical constants of haze analogs for other planetary bodies are required. Due to the lack of relevant data, the optical data of Titan tholins from Khare et al. (1984) have been used for modeling Pluto (e.g., Zhang et al. 2017), Triton (e.g., Ohno et al. 2020), and even exoplanets (e.g., Arney et al. 2017; Adams et al. 2019; Gao and Zhang 2020). As we discussed earlier, the tholin sample in Khare et al. (1984) was prepared under specific conditions for simulating Titan's atmospheric chemistry, and their data do not adequately fit the Titan observations. We should be cautious when applying the Khare et al. data to other bodies, especially exoplanets. This study demonstrates an avenue for our future work to determine the optical constants of haze analogs to other planetary bodies, such as Pluto, Triton, and various exoplanets (He et al. 2018a, 2018b, 2020a, 2020b; Hörst et al. 2018a).
4. Conclusions
In this study, we prepared a Titan tholin film by exposing a CH4/N2 (5%/95%) gas mixture to a cold plasma energy source at ∼100 K with the PHAZER chamber and determined the optical constants in the wavelength range from 0.4 to 3.5 μm using a vacuum FTIR. Due to the differences in experimental techniques, experimental conditions, and measurement methods among different groups, it is difficult to strictly compare the optical constants of those tholins. In general, the optical constants of our tholin sample fall within the range of the reported values in shorter wavelengths (0.4–2.5 μm). In the range of 2.5–3.5 μm, our n values are the lowest, while our k values are the highest. The k values of our tholin sample are very close to the retrieved k values from the observational data (DISR and VIMS) in the 1.2–1.6 μm range. None of the tholin samples can meet the observational constraints of the Titan haze materials in the entire observed wavelength range, but tholins produced under different conditions may represent hazes formed at different altitudes in Titan's atmosphere. More detailed investigation is needed to understand the effect of the experimental conditions on the chemistry and the connection between the chemical compositions and the optical properties of the laboratory haze analogs. Such study will provide better constraints to Titan's haze materials and help interpret future Titan observations.
This work was supported by NASA Astrophysics Research and Analysis Program NNX17AI87G and NASA Exoplanets Research Program 80NSSC20K0271.