


Abstract
The Early Release Observations (EROs) of JWST beautifully demonstrate the promise of JWST in characterizing the universe at Cosmic Dawn. We analyze the Near Infrared Spectrograph ERO spectra of three z ∼ 8 galaxies to determine their metallicities, gas temperatures, and ionization. These galaxies offer the first opportunity to understand the physical properties of Epoch-of-Reionization galaxies through detailed rest-optical emission-line spectroscopy. We show that these objects have metal abundances ![$12+\mathrm{log}[{\rm{O}}/{\rm{H}}]\,\approx $](https://content.cld.iop.org/journals/2041-8205/942/1/L14/revision1/apjlacaaafieqn1.gif) 6.9–8.3, based on both the Te method and on a recent calibration of the R23 metallicity indicator. Since the spectra are some of the earliest science data from JWST, we compare several line ratios with values expected from robust physics, to validate our measurement procedures. We compare the abundances and emission-line ratios to a nearby sample of Green Pea galaxies—a population of nearby emission-line galaxies whose UV properties resemble Epoch-of-Reionization galaxies, and which often have large Lyman continuum escape fractions. The JWST data show striking further similarities between these high-redshift galaxies and nearby Green Peas. The z ∼ 8 galaxies span the metallicity range covered by Green Peas. They also show the compact morphology that is typical of emission-line-dominated galaxies at all redshifts. Based on these similarities with Green Peas, it is likely that these are the first rest-optical spectra of galaxies that are actively driving cosmological reionization.
6.9–8.3, based on both the Te method and on a recent calibration of the R23 metallicity indicator. Since the spectra are some of the earliest science data from JWST, we compare several line ratios with values expected from robust physics, to validate our measurement procedures. We compare the abundances and emission-line ratios to a nearby sample of Green Pea galaxies—a population of nearby emission-line galaxies whose UV properties resemble Epoch-of-Reionization galaxies, and which often have large Lyman continuum escape fractions. The JWST data show striking further similarities between these high-redshift galaxies and nearby Green Peas. The z ∼ 8 galaxies span the metallicity range covered by Green Peas. They also show the compact morphology that is typical of emission-line-dominated galaxies at all redshifts. Based on these similarities with Green Peas, it is likely that these are the first rest-optical spectra of galaxies that are actively driving cosmological reionization.
Export citation and abstract BibTeX RIS

Original content from this work may be used under the terms of the Creative Commons Attribution 4.0 licence. Any further distribution of this work must maintain attribution to the author(s) and the title of the work, journal citation and DOI.
1. Introduction
JWST was built to visit a time when galaxies were young. In its first public release of scientific data, it has done exactly that, with rest-frame optical spectroscopy of three galaxies in the epoch of Cosmic Dawn (at redshifts z > 7), as well as deep imaging of a cluster field, which provides extra magnification due to gravitational lensing. In one sense, these are automatically young galaxies, for they are observed when the universe itself was ≲700 Myr old, or about 5% of its current age.
There are more specific markers of youth that derive directly from the properties of individual galaxies. These include low stellar mass, active star formation, and low abundances of the heavy elements produced by nuclear fusion in stars. We will show that the most distant galaxy in the JWST early-release Near Infrared Spectrograph (NIRSpec) observations is young by all of these criteria. The other two Epoch-of-Reionization galaxies in the same data set are still young objects by most criteria, albeit somewhat higher in both mass and metal abundance.
Detailed studies of galaxies at these redshifts will shed light on the reionization of intergalactic hydrogen, which was the landmark event of Cosmic Dawn—the first time when bound objects had a global impact on the universe. Combined constraints from the quasar spectroscopy (Fan et al. 2006; Yang et al. 2020), Lyα statistics from both line-selected (Malhotra & Rhoads 2004) and continuum-selected (Stark et al. 2010) galaxies, the cosmic microwave background (Planck Collaboration et al. 2016), and ionizing photon production models (Bouwens et al. 2015; Robertson et al. 2015; Finkelstein et al. 2019; Naidu et al. 2020) now suggest that the transition from neutral to ionized gas began before z ≈ 8.5 and was largely finished by z = 6.5. Despite the expected obscuration of Lyα by neutral gas (Miralda-Escude & Rees 1998), Lyα galaxies have been identified at redshifts up to z ≈ 8.6 (Zitrin et al. 2015), and clusters or groups of Lyα galaxies (indicating ionized bubbles) as far back as z = 7 (Castellano et al. 2016; Hu et al. 2021) to 7.7 (Tilvi et al. 2020). Wide-area surveys for Lyα emitters at z ≈ 7 suggest that the intergalactic medium (IGM) was in fact highly ionized by z = 7 (Itoh et al. 2018; Zheng et al. 2017; Hu et al. 2019; Goto et al. 2021; Wold et al. 2022). Observational constraints become much poorer at higher redshifts, due largely to the difficulty of IR observations through Earth's atmosphere, and it is here that JWST is poised to drive rapid observational progress.
To place these JWST Cosmic Dawn galaxies in context, we have measured their rest-frame optical emission-line ratios. We have used the measurements to derive key physical parameters of the galaxies, notably including the gas-phase oxygen abundance.
Despite the extreme properties seen in these objects, they are not without close analogs in the nearby universe. We compare the JWST line ratios to those of local emission-line galaxy samples, primarily Green Pea galaxies at z ≲ 0.3 (Cardamone et al. 2009; Jaskot & Oey 2013; Henry et al. 2015; Izotov et al. 2016, 2018; Yang et al. 2016, 2017; Jiang et al. 2019; Brunker et al. 2020; Kim et al. 2020, 2021). We find that the most extreme of the JWST sources has a metal abundance ![$12+\mathrm{log}[{\rm{O}}/{\rm{H}}]\sim 7.0$](https://content.cld.iop.org/journals/2041-8205/942/1/L14/revision1/apjlacaaafieqn2.gif) (≈1.8% solar). Within present uncertainties, it may or may not be the most metal-poor galaxy known. It is clear that galaxies of comparably low metallicity do exist in the nearby universe, and also among extreme emission-line galaxy samples at 0.2 ≲ z ≲ 0.9 (Kakazu et al. 2007; Ly et al. 2016). But, it is equally clear that such objects are exceedingly rare at low redshift. They account for ≲1% of Green Pea galaxies despite preselection using criteria, e.g., the presence of strong nebular emission lines, that should enhance their representation in that sample.
(≈1.8% solar). Within present uncertainties, it may or may not be the most metal-poor galaxy known. It is clear that galaxies of comparably low metallicity do exist in the nearby universe, and also among extreme emission-line galaxy samples at 0.2 ≲ z ≲ 0.9 (Kakazu et al. 2007; Ly et al. 2016). But, it is equally clear that such objects are exceedingly rare at low redshift. They account for ≲1% of Green Pea galaxies despite preselection using criteria, e.g., the presence of strong nebular emission lines, that should enhance their representation in that sample.
Regardless of what future data sets tell, this is a huge step forward. The first release of scientific data from JWST has enabled us to apply powerful tools that could previously be used only with great difficulty beyond z ∼ 1, and even then only up to z ∼ 3.
In this paper, we discuss the JWST observations (Section 2.1), line ratio measurements (Section 2.2), and consistency checks applied to the measurements (Section 2.3), and also the selection of comparison objects from Sloan Digital Sky Survey (SDSS) Green Pea galaxies (Section 2.4). We then present our analysis of the physical conditions drawn from the line ratio measurements (Section 3). Finally, we discuss the implications of the results (Section 4), and summarize our conclusions (Section 5). Throughout the paper, where relevant, we use a flat concordance cosmology with H0 = 69.6 km s−1 Mpc−1, Ωtot = 1, Ωm
= 0.286, and ΩΛ = 0.714. We report our metallicity results as gas-phase oxygen abundances in units of ![$12+\mathrm{log}[{\rm{O}}/{\rm{H}}]$](https://content.cld.iop.org/journals/2041-8205/942/1/L14/revision1/apjlacaaafieqn3.gif) ; in these units, the Sun has abundance
; in these units, the Sun has abundance ![${Z}_{\odot }=12+\mathrm{log}[{\rm{O}}/{\rm{H}}]=8.75\pm 0.03$](https://content.cld.iop.org/journals/2041-8205/942/1/L14/revision1/apjlacaaafieqn4.gif) (Bergemann et al. 2021, and references therein).
(Bergemann et al. 2021, and references therein).
There is a rapidly growing body of work on the JWST Early Release Observations (EROs), including papers that examine the spectroscopic properties of the same three galaxies (J072326–732656 (04590), J072322–732606 (06355), and J072320–732604 (10612)) that are our focus here (e.g., Curti et al. 2023; Schaerer et al. 2022; Trump et al. 2022; Taylor et al. 2022). While most of our analysis was carried out before those works became available, we will compare our conclusions to theirs in Section 4.
2. Observations and Data Analysis
2.1. JWST Observations
We used the JWST EROs of the galaxy cluster SMACS 0723.3–7327 (hereafter, SMACS 0723), and especially the NIRSpec multiobject spectroscopy (program JW02736; observations 007 and 008). The observations are discussed fully in Pontoppidan et al. (2022) and the data can be found in MAST. 8 The spectroscopy consisted of a single configuration of the NIRSpec multishutter array, observed with a range of blocking filters and gratings. The most critical instrumental setup for this paper was with the F290LP blocking filter and G395M grism, which covers λb ≈ 2.9 to λr ≈ 5.2μm with a resolving power R ∼ 1000. The NRSIRS2 detector readout pattern was used with 20 groups, two integrations, and a three-shutter slitlet nod pattern. For our targets of interest (J072326–732656 (04590), J072322–732606 (06355), and J072320–732604 (10612)) this configuration resulted in on-target exposures of 8.8 ks for each observation (o007 and o008).
2.2. Emission-line Ratio Measurements
We downloaded the Level 3 (L3) spectra for the SMACS J0723.3–7327 program from the STScI MAST server on 2022 July 13. These are data products from calibration software version 1.5.3, using a mixture of ground and on-orbit calibration data (Rigby et al. 2022). We base our analysis on the one-dimensional (1D) spectra for each of two long exposures (o007 and o008). We measured the fluxes for several detected emission lines in each spectrum, notably including [O iii]4959, 5007, [O iii]4363, and [O ii]3726, 3729, and the Balmer series lines of hydrogen from Hβ through H .
.
To measure the line fluxes, we fitted Gaussian profiles to the 1D spectrum. To obtain robust fitting results on both strong and weaker lines, we performed simultaneous fits of nearby line sets, so that the wavelength and line width were effectively fixed by well-detected lines, allowing more confident extraction of the weak lines. Finally, we formed line ratios separately for each of the two exposures and combined the two line ratio estimates using an inverse variance weighting. The [O iii]4959 line of J072326–732656 (04590) in exposure o008 appears to have some corrupted pixels, which result in a strongly negative flux measurement. We chose to replace the [O iii]4959 line flux in this instance with the value expected from the theoretical [O iii]4959/[O iii]5007 ratio, given that the [O iii]5007 line is well measured and the [O iii]4959/[O iii]5007 observed in exposure o007 is consistent with the theoretical value.
To estimate errors on line flux ratios, we first noted that the rms of the continuum flux in the L3 1D spectra exceeded the noise reported in the L3 spectra, by a factor of ∼1.5–2. We therefore applied a 2× correction to the noise levels input to the line-fitting software (MPFITFUN in IDL), and thereafter used the reported uncertainties in fitted line parameters to determine random line flux errors. Finally, we applied a noise floor of 5% to the measured line fluxes (added in quadrature with the random flux errors reported by MPFITFUN), to allow for low-level wavelength-dependent calibration errors or similar systematic problems.
The line flux ratios measured through this procedure are summarized in Table 1, along with derived quantities including electron temperature and gas-phase oxygen abundances (see Section 3 below).
Table 1. Observed and Derived Properties of the JWST Spectroscopic Sample and of Two Local Analogs
| ID | Spec. ID | Redshift | 4363/[O iii] a | [O iii]/Hβa | [O ii]/Hβa | R23 a | O32 a | Z(R23) b | Te(O iii) | Z(Te) b |
|---|---|---|---|---|---|---|---|---|---|---|
| 104 K | ||||||||||
| J072326–732656 | 04590 | 8.495 | 0.058 ± 0.014 | 3.92 ± 0.33 | 0.30 ± 0.11 | 4.18 ± 0.38 | 12.26 ± 4.25 | 7.27 ± 0.05 | 3.72 ± 0.99 | 6.88 ± 0.15 |
| J072322–732606 | 06355 | 7.664 | 0.011 ± 0.003 | 9.46 ± 0.63 | 1.19 ± 0.12 | 10.72 ± 0.70 | 7.89 ± 0.61 | 8.30 ± 0.08 | 1.34 ± 0.16 | 8.09 ± 0.16 |
| J072320–732604 | 10612 | 7.659 | 0.029 ± 0.011 | 11.92 ± 2.06 | 0.71 ± 0.28 | 12.67 ± 2.23 | 17.29 ± 4.49 | 8.36 ± 0.20 | 2.19 ± 0.54 | 7.68 ± 0.24 |
| J082701 + 342951 | SDSS | 0.0854 | 0.033 ± 0.003 | 8.03 ± 0.60 | 0.38 ± 0.04 | 8.41 ± 0.61 | 20.85 ± 1.64 | 7.72 ± 0.06 | 2.40 ± 0.14 | 7.44 ± 0.05 |
| J122051 + 491555 | SDSS | 0.0123 | 0.028 ± 0.003 | 4.02 ± 0.28 | 0.25 ± 0.05 | 4.27 ± 0.30 | 16.23 ± 3.40 | 7.28 ± 0.04 | 2.12 ± 0.15 | 7.24 ± 0.06 |
Notes.
a Columns 4–8 present line flux ratios (in energy units). "4363" refers to the λ = 4363Å line of O iii. "[O iii]" refers to the total flux of the 4959, 5007 Å doublet of [O iii]. "[O ii]" refers to the total flux of the 3726, 3729 Å doublet of O ii. "Hβ" refers to the Balmer beta line of hydrogen. "R23" denotes the ratio ([O iii]+[O ii])/Hβ. Finally, "O32" denotes [O iii]/[O ii]. b Gas-phase oxygen abundances are given in units of . Solar oxygen abundance in these units is approximately 8.75 (Bergemann et al. 2021).
Download table as: ASCIITypeset image
2.3. Consistency Checks and Robustness
Given that we are doing science with pipeline-processed early-release data, it is likely that there will be future refinements to the data processing and possible that these may have impact on relevant measurements. We have taken several steps to test for robustness and mitigate the impact of possible issues in data processing.
First, as discussed above, we renormalized the stated flux errors in the L3 spectra to bring them into line with the observed rms continuum flux in the 1D spectra.
Second, we treated each exposure separately in measuring fluxes and forming flux ratios, and combined results statistically thereafter. This means that any overall flux normalization issue between the two exposures on each object will not impact the results. Moreover, we used only line fluxes, after subtracting a locally determined continuum level, so that our results are insensitive to any slowly varying additive component in the spectra.
We checked our measured ratios against theoretical expectations for those line ratios with values largely determined by atomic physics, namely [O iii]4959/[O iii]5007, where theory predicts 0.335 (Dimitrijević et al. 2007); Hγ/Hβ, where theory predicts 0.474 (Osterbrock & Ferland 2006); and Hδ/Hβ, where theory predicts 0.262 (Osterbrock & Ferland 2006). The results of these checks are given in Table 2. The measured ratios are generally within 1σ–2σ of their theoretical values.
Table 2. Table of Line Flux Ratio Consistency Checks
| Object | Exposure | 4959/5007 | Deviation | Hγ/Hβ | Deviation | Hδ/Hβ | Deviation |
|---|---|---|---|---|---|---|---|
| Theory | ⋯ | 0.3356 | 0 | 0.474 | 0 | 0.262 | 0 |
| 04590 | o007 | 0.306 ± 0.050 | −0.6σ | 0.679 ± 0.149 | 1.4σ | 0.431 ± 0.155 | 1.1σ |
| 04590 | o008 | - corrupted - | ⋯ | 0.552 ± 0.101 | 0.7σ | 0.348 ± 0.338 | 0.2σ |
| 04590 | Combined | 0.306 ± 0.050 | −0.6σ | 0.592 ± 0.084 | 1.4σ | 0.417 ± 0.141 | 1.1σ |
| 06355 | o007 | 0.382 ± 0.030 | 1.5σ | 0.523 ± 0.082 | 0.6σ | 0.310 ± 0.318 | 0.2σ |
| 06355 | o008 | 0.371 ± 0.031 | 1.2σ | 0.464 ± 0.077 | −0.2σ | 0.258 ± 0.256 | 0.0σ |
| 06355 | Combined | 0.377 ± 0.022 | 1.9σ | 0.490 ± 0.056 | 0.3σ | 0.278 ± 0.198 | 0.1σ |
| 10612 | o007 | 0.313 ± 0.039 | −0.6σ | 0.842 ± 0.391 | 0.9σ | 0.194 ± 0.351 | −0.2σ |
| 10612 | o008 | 0.385 ± 0.053 | 0.9σ | 0.726 ± 0.361 | 0.7σ | 2.04 ± 2.40 | 0.8σ |
| 10612 | Combined | 0.338 ± 0.031 | 0.04σ | 0.779 ± 0.264 | 1.1σ | 0.232 ± 0.230 | −0.1σ |
Note. "Deviation" indicates the discrepancy between the observed and theoretical ratio, in σ units.
Download table as: ASCIITypeset image
In addition to calibration effects, these ratios could be altered by dust absorption. Given that all tested ratios are statistically consistent with their theoretical values, we conclude that the dust optical depth is low enough to be unimportant. In our further analysis, we do not correct observed line ratios for dust.
Finally, we note that our key physical conclusions (Section 3) depend primarily on pairs of lines that are relatively close together in wavelength. Because [O ii]3726, 3729 is comparatively weak in all of the objects studied here, its impact on the inferred metallicity is modest. Therefore, the widest wavelength range that strongly affects results is the span from [O iii]4363 to [O iii]5007, a factor of ∼1.15 in wavelength. This range is covered by a single NIRSpec configuration (although the two lines fall on different detectors in object J072326–732656 (04590)). The consistency checks above include the ratios Hγ/Hβ and Hδ/Hβ, which span a similar wavelength interval. This modest wavelength range, combined with the small angular sizes of these galaxies (θ50 < 0 08), also means that differential slit losses between emission lines at shorter and longer wavelengths will not be large enough to substantially affect our physical conclusions.
2.4. Sloan Digital Sky Survey Green Pea Comparison
The spectrum of J072326–732656 (04590) in particular is reminiscent of some of the most extreme emission-line galaxies in the nearby universe. To explore this, we searched the database of Green Pea galaxies from Yang et al. (2019) and Jiang et al. (2019) to find galaxies with similar line ratios. Specifically, we required a signal-to-noise ratio (S/N) ([O iii]4363) > 2.5, f([O iii]4363)/f([O iii]4959, 5007) > 0.035, f([O iii]4363)/f([O ii]3726, 3729) > 0.5, R23 < 8, and O32 > 10. This yielded two objects, J082701+342951 and J122051+491555, from a parent database of about 1000 sources (which had been previously selected on a minimum equivalent-width threshold in [O iii]4959, 5007 and/or Hβ). We compare the rest-frame spectra of these two Green Peas and the three JWST sources in Figure 1, and show both these Green Peas in the upper-right panel of Figure 2. Spectral data are taken from SDSS Data Release DR12 (Alam et al. 2015).

Figure 1. Comparison of the rest-optical spectra of the Green Pea galaxies J1220 + 4915 (z = 0.012) and J0827 + 3429 (z = 0.085), and the Epoch-of-Reionization galaxies J072326–732656 (04590), J072322–732606 (06355), and J072320–732604 (10612). The Green Pea galaxies shown are selected as the two best analogs to the line ratios of J072326–732656 (04590) among the Green Pea sample from Yang et al. (2019) and Jiang et al. (2019; see Section 2.4). For display purposes we have masked a few spurious features in these early-release JWST spectra that did not match any known spectral line, after confirming that these features were not consistently present in both exposures.
Download figure:
Standard image High-resolution image
Figure 2. The emission lines and fits to these lines for objects in our analysis are shown here. The four panels correspond to J072326–732656 (04590) (top left), J072322–732606 (06355) (bottom left), J072320–732604 (10612) (bottom right), and two SDSS Green Pea spectra (top right). All spectra display rest wavelength and flux density fλ
(scaled to render lines easily visible). Within each of the JWST panels, the upper and lower rows of subpanels correspond to the two distinct NIRSpec exposures. For the Green Pea panel, the upper and lower subpanels correspond to two distinct objects. Within each row, four distinct wavelength segments are plotted. Each segment shows a linked line set, where we performed a joint fit to two to four emission lines. Each fit included three parameters to describe the redshift, line width, and continuum level, plus one parameter per emission line to measure line amplitudes. The four fitted line sets are (from blue to red) [O ii] 3727, 3729 + [Ne iii] 3869 + Hζ 3890; [Ne iii] 3968 + H 3971 + Hδ 4102; Hγ 4341 + [O iii] 4364; and Hβ 4862 + [O iii] 4960 + [O iii] 5008.
Download figure:
Standard image High-resolution imageThe similarities in most line ratios are quite striking, especially between J072326–732656 (04590) and GP J122051 + 491555, where all ratios apart from [O iii]4363/[O iii]4959, 5007 are within 1σ (see Table 1). This similarity gives new confidence to the conclusion that Green Peas are good analogs for Epoch-of-Reionization galaxies.
3. Analysis
We measured gas-phase oxygen abundances using multiple approaches as described in the following sections.
3.1. R23 Method
First, we apply the R23 metallicity method (Pagel et al. 1979) using the calibration by Jiang et al. (2019). R23 ≡ (f([O ii]3726, 3729)+f([O iii]4959, 5007))/f(H
β) is a useful metallicity indicator because it relies on bright lines that are easily detected. However, because the oxygen line strengths depend on both abundances and the balance of gas heating and cooling, the mapping from R23 to ![$12+\mathrm{log}[{\rm{O}}/{\rm{H}}]$](https://content.cld.iop.org/journals/2041-8205/942/1/L14/revision1/apjlacaaafieqn6.gif) is in general double-valued, and moreover depends on the ionization parameter, which in turn is observationally constrained by the ratio O32 ≡ f([O iii]4959, 5007)/f([O ii]3726, 3729). The Jiang et al. (2019) calibration is based on a sample of Green Pea galaxies whose spectra have notable similarities to the spectrum of J072326–732656 (04590) (see Figure 1). Applying Equation (7) of Jiang et al. (2019) yields a metallicity estimate
is in general double-valued, and moreover depends on the ionization parameter, which in turn is observationally constrained by the ratio O32 ≡ f([O iii]4959, 5007)/f([O ii]3726, 3729). The Jiang et al. (2019) calibration is based on a sample of Green Pea galaxies whose spectra have notable similarities to the spectrum of J072326–732656 (04590) (see Figure 1). Applying Equation (7) of Jiang et al. (2019) yields a metallicity estimate ![$12+{\rm{log}}[{\rm{O}}/{\rm{H}}]\approx 7.27\pm 0.05\approx 0.033\,{Z}_{\odot }$](https://content.cld.iop.org/journals/2041-8205/942/1/L14/revision1/apjlacaaafieqn7.gif) for J072326–732656 (04590), 8.30 ± 0.08 ≈ 0.35 Z⊙ for J072322–732606 (06355), and 8.36 ± 0.20 ≈ 0.4 Z⊙ for J072320–732604 (10612) (see Figure 3).
for J072326–732656 (04590), 8.30 ± 0.08 ≈ 0.35 Z⊙ for J072322–732606 (06355), and 8.36 ± 0.20 ≈ 0.4 Z⊙ for J072320–732604 (10612) (see Figure 3).
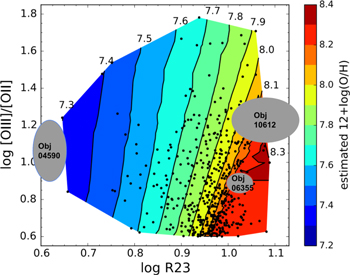
Figure 3. This figure, based on Figure 8 of Jiang et al. (2019), shows the relation between R23, O32, and gas-phase metallicity. Black points mark the Green Pea galaxies used to derive the plotted contours, which are labeled with corresponding values of ![$12+\mathrm{log}[{\rm{O}}/{\rm{H}}]$](https://content.cld.iop.org/journals/2041-8205/942/1/L14/revision1/apjlacaaafieqn8.gif) . Gray ovals mark 1σ uncertainty regions for the three z > 7 objects, which have inferred R23 metallicities of ∼7.3 (J072326–732656 (04590)), ∼8.3 (J072322–732606 (06355)), and ∼8.3 (J072320–732604 (10612)). The first two measurements are in good agreement with the Te
method results, while J072320–732604 (10612) appears to be an outlier in this relation. Together, this trio of sources spans the range of R23 seen in the comparison sample of Green Pea galaxies.
. Gray ovals mark 1σ uncertainty regions for the three z > 7 objects, which have inferred R23 metallicities of ∼7.3 (J072326–732656 (04590)), ∼8.3 (J072322–732606 (06355)), and ∼8.3 (J072320–732604 (10612)). The first two measurements are in good agreement with the Te
method results, while J072320–732604 (10612) appears to be an outlier in this relation. Together, this trio of sources spans the range of R23 seen in the comparison sample of Green Pea galaxies.
Download figure:
Standard image High-resolution image3.2. Direct Method
Second, we use the well-detected [O iii]4363 Å line to apply the Te
("direct") method. Here we follow the method described in Jiang et al. (2019), which follows prior work by Izotov et al. (2006). The method uses the ratio f([O iii]4363)/f([O iii]4959, 5007) to measure the electron temperature in the [O iii]4959, 5007-emitting gas. Combining this temperature with the line flux ratio f([O iii]4959, 5007)/f(Hβ) furnishes an estimate of the O++/H ratio. A similar methodology yields the O+/H ratio. Figure 4 shows the relation between the observed f([O iii]4363)/f([O iii]4959, 5007) ratio and temperature, which is inverted numerically. The resulting value of Te
(O
III) ≈ (3.7 ± 1) × 104K for J072326–732656 (04590) is extreme, though not without precedent among lower-redshift samples in the literature (e.g., Kakazu et al. 2007). The mass ratios of O+/H and O++/H are determined using fitting formulas presented by Izotov et al. (2006). Because the temperature of the [O ii]3726, 3729-emitting gas is not directly constrained, we estimate it using a fitting formula t2 = −0.577 + t3 × (2.065 − 0.498t3) for t3 < 2.07, and t2 = 1.562 for t3 > 2.07, where t2 ≡ T(O ii)/104 K and t3 ≡ T(O III)/104. This is based on fits to photoionization model grids (Stasińska 1990) performed by Izotov et al. (2006), but modified to avoid an unphysical decrease of t2 with increasing t3 at the highest temperatures. Results (both Te
and ![$12\,+\mathrm{log}[{\rm{O}}/{\rm{H}}]$](https://content.cld.iop.org/journals/2041-8205/942/1/L14/revision1/apjlacaaafieqn9.gif) ) for all three JWST targets and the two Green Pea comparison objects are reported in Table 1, and span a range
) for all three JWST targets and the two Green Pea comparison objects are reported in Table 1, and span a range ![$6.9\lesssim 12+\mathrm{log}[{\rm{O}}/{\rm{H}}]\lesssim 8.1$](https://content.cld.iop.org/journals/2041-8205/942/1/L14/revision1/apjlacaaafieqn10.gif) (0.014 ≲ Z/Z⊙ ≲ 0.23) that is similar to the range seen in ∼1000 Green Peas (Jiang et al. 2019).
(0.014 ≲ Z/Z⊙ ≲ 0.23) that is similar to the range seen in ∼1000 Green Peas (Jiang et al. 2019).

Figure 4. The electron temperature of [O iii]-line-emitting gas is plotted as a function of the f(O iii 4363)/f(O iii 4959, 5007) ratio, following the treatment in Osterbrock & Ferland (2006). The solid curve shows the relation in the low-density limit, approximately ne < 103 cm−3. The dashed curve shows the relation for ne = 104 cm−3, and the dotted curve the relation for ne = 105 cm−3. Vertical dashed lines show the measured values of this ratio for the three z ∼ 8 galaxies. The corresponding electron temperatures are given in Table 1, and for J072326–732656 (04590) in particular exceed 30,000K in the [O iii]-emitting gas. Histograms of comparison samples show that the f(O iii 4363)/f(O iii 4959, 5007) ratio and the electron temperature in J072326–732656 (04590) are extreme but not unprecedented in lower-redshift samples. The green histogram marks the z ≲ 0.3 Green Pea galaxy sample of Yang et al. (2019) and Jiang et al. (2019). The blue and red histograms show emission-line-selected samples at intermediate redshifts (0.2 ≲ z ≲ 0.9) from Kakazu et al. (2007) and Ly et al. (2016; with numbers multiplied by 10 and 3, respectively, to display on the same y-axis as the Green Pea sample). All comparison samples have been restricted to objects with S/N ≥ 2.5 in the [O iii]4363 line.
Download figure:
Standard image High-resolution imageAny systematic effects due to flux calibration are likely to manifest as multiplicative errors in line fluxes and in line flux ratios. The largest deviation from theoretical line flux ratios among our consistency checks in Table 2 is a 1.9σ difference between observation and theory in the 4959/5007 ratio of J072322–732606 (06355), and corresponds to a factor of 1.12 in the line ratio. There is no case where a 12% change in the f([O iii]4363)/f([O iii]4959, 5007) ratio would approach the 1σ statistical uncertainties in Table 1, and the Te temperatures and metallicity uncertainties are unlikely to be substantially increased by flux calibration issues.
3.3. CLOUDY Modeling for J072326–732656 (04590)
To explore the physical conditions in the most extreme of the JWST sources, J072326–732656 (04590), we have used the CLOUDY photoionization code 9 (Ferland et al. 2017) and the pyCLOUDY package (Morisset 2013) to calculate expected emission-line ratios for a young, low-metallicity starburst. This package takes an input incident radiation spectrum and computes the full radiative transfer through a surrounding gas cloud, thereby predicting the resultant nebular emission spectrum. We adapt the model prescriptions used in Byler et al. (2020), an analysis of UV and optical emission-line diagnostics of metallicity and star formation in young star-forming galaxies. Given the extreme observed line ratios, we adopt the minimum inner radius (Rinner ∼ 0.1 pc) and maximum ionizing photon production (QH ∼ 1051 s−1, comparable to a young star cluster) from the Byler grids, such that the model will have a high ionization parameter, U. U is also dependent on the hydrogen density, nH, and the photoionization also depends on the shape of the incident spectrum. To quickly approximate the spectrum of a young burst of low-metallicity stars, we use a blackbody spectrum with Teff = 60,000 K. Steidel et al. (2014) and Sanders et al. (2016) have shown that such a spectrum provides a good approximation to hard ionizing stellar population models from BPASS or Starburst99, and have used it in modeling starbursts at z ∼ 2–3, where typical metallicities are expected to be appreciably lower than solar.
We then run CLOUDY with these settings with grids of gas-phase metallicity ( ) and electron density (
 ). As the line ratios suggest low oxygen abundances in the nebular gas, in addition to scaling the oxygen abundance we reduce other heavy elements in the model, as well, scaling their values with the oxygen abundance and following an H ii region abundance pattern (Baldwin et al. 1991; Rubin et al. 1991; Osterbrock et al. 1992). The predicted oxygen line ratios from this model grid are shown in Figure 5. Each "column" of model points represents a given density, with the left column most closely matching the density predicted from the observed O ii ratio (∼0.7, corresponding to lower densities). The color of the points gives the gas-phase metallicity.
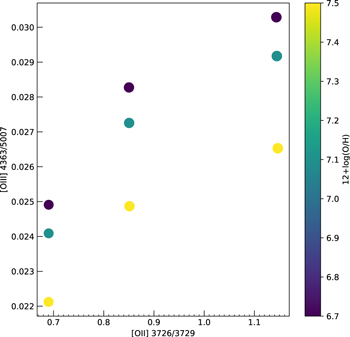
Figure 5. CLOUDY model results, showing the line ratios of [O iii]4363 to [O iii]4959, 5007 and [O ii]3726 to [O ii]3729 for a grid of models with electron densities of 101.5, 102.5, and 103 cm−3 (from left to right), and gas-phase oxygen abundances ![$12+\mathrm{log}[{\rm{O}}/{\rm{H}}]=7.5$](https://content.cld.iop.org/journals/2041-8205/942/1/L14/revision1/apjlacaaafieqn13.gif) , 7.1, and 6.7 (from bottom to top). Despite examining intense and low-metallicity conditions, none of the models tested reproduce the [O iii]4363/[O iii]4959, 5007 ratio observed in J072326–732656 (04590) (although they match the value for J072320–732604 (10612) and easily exceed that for J072322–732606 (06355), which could be matched with less extreme models). More detail on the models is presented in Section 3.3, and discussion of the implications is in Section 4.
, 7.1, and 6.7 (from bottom to top). Despite examining intense and low-metallicity conditions, none of the models tested reproduce the [O iii]4363/[O iii]4959, 5007 ratio observed in J072326–732656 (04590) (although they match the value for J072320–732604 (10612) and easily exceed that for J072322–732606 (06355), which could be matched with less extreme models). More detail on the models is presented in Section 3.3, and discussion of the implications is in Section 4.
Download figure:
Standard image High-resolution imageFor the model to get close to the observed [Oiii]4363/[Oiii]5007 ratio, some combination of extremely low metallicity, high electron density, harder incident ionizing spectrum (as from e.g., particularly low stellar metallicity in the starburst), and compact cloud morphology is necessary. However, none of the models tested actually reproduces the f([O iii]4363)/f([O iii]4959, 5007) ratio observed in J072326–732656 (04590). We consider possible explanations in Section 4 below.
3.4. Size and Surface Brightness Comparisons
Another characteristic of the local and low-redshift emission-line galaxies is their compact size and high star formation rate per unit area (hereinafter the star formation surface density ΣSFR, and also sometimes called star formation intensity, SFI). This could be due to the dominance of one compact star-forming region (or cluster) in the galaxy. We thus examined the sizes and ΣSFR for these galaxies. In Figure 6, we show how the sizes of the three high-redshift sources compare with low-redshift Green Peas (Kim et al. 2021). The sizes plotted are half-light radii as derived in Source Extractor (Bertin & Arnouts 1996). The directly measured circularized half-light radii (i.e., corrected for the galaxy ellipticity) range from 0.28 to 0.42 kpc (see Table 3). If we apply a rough correction for lensing amplification due to the foreground galaxy cluster, using the reported magnification values from Carnall et al. (2023) that were obtained from the lens model provided by the RELICS team (Coe et al. 2019), the sizes drop to 0.1–0.26 kpc. These lensing corrections are modest for two of the sources, with the exception being a magnification ∼10 and a corresponding reduction in circularized radius of ∼1/3× for J072326–732656 (04590) (04590). These sizes are typical of Green Peas (∼0.33 kpc) at low redshifts, where we have measured them from well-resolved near-UV images (Kim et al. 2021).

Figure 6. Blue star-shaped symbols mark the sizes and magnitudes of the JWST z ∼ 8 galaxies compared to local analogs. Left: histogram of Green Pea sizes (based on Kim et al. 2021). All three JWST sources lie in the 2nd or 3rd quartile of Green Pea sizes. Right: absolute magnitude vs. size, with contours of constant star formation intensity (i.e., orange dashed lines) marked. Gray symbols mark Green Peas. Pale blue symbols mark known Lyman continuum leakers (Izotov et al. 2016). The UV size–luminosity relation for the Green Peas, as derived in Kim et al. (2021), is plotted as a solid black line. The JWST sources are consistent with the local Green Pea relation. They populate the region of parameter space with the highest star formation intensity, which is also the region where known Lyman continuum leakers occur.
Download figure:
Standard image High-resolution image
Table 3. Sizes and Surface Brightnesses of the JWST Spectroscopic Sample
| ID | Spec. ID | Redshift | Magnification a | Size rcir,50 (kpc) | Size rcir,50 (kpc) b | ΣSFR c | SFR (M☉ yr−1) | SFR (M☉ yr−1) |
|---|---|---|---|---|---|---|---|---|
| (uncorrected) | (lensing corrected) | (uncorrected) | (lensing corrected) | |||||
| J072326–732656 | 04590 | 8.495 | 10.1 | 0.31 ± 0.13 | ∼0.10 |

|

| ∼0.93 |
| J072322–732606 | 06355 | 7.664 | 2.7 | 0.43 ± 0.11 | ∼0.26 |

|

| ∼9.6 |
| J072320–732604 | 10612 | 7.659 | 1.6 | 0.29 ± 0.10 | ∼0.23 |

|

| ∼9.4 |
Notes.
a Gravitational lensing magnifications are taken from Carnall et al. (2023). b Lensing corrected sizes are approximated as (observed radius)/ .
c
Because gravitational lensing conserves surface brightness, ΣSFR is independent of the lensing model.
.
c
Because gravitational lensing conserves surface brightness, ΣSFR is independent of the lensing model.Download table as: ASCIITypeset image
We also calculate average star formation intensities ( , with units of M☉ yr−1 kpc−2) for these three sources. We calculated the star formation rate (SFR) using observed rest-frame UV-continuum in the JWST F150W image (file j202736-o001_t001_nircam_clear-f150w_i2d.fits). We apply no dust correction. If dust corrections are in fact required, we could be underestimating ΣSFR in these sources. We note that the Balmer line ratios in Table 2 do not require reddening, though this is not an especially strong constraint without a Hα measurement. To convert the measured UV luminosity to the corresponding SFR in a consistent manner with the compared Green Peas, we apply the same conversion method as in Kim et al. (2021). We adopt the solar bolometric magnitude of 4.74 (Bessell et al. 1998), and the UV-to-bolometric luminosity (Lbol) ratio (LUV/Lbol) of 0.33 and the scale factor Lbol/(4.5 × 109
L☉) = SFR/(1 M☉ yr−1) that are derived from the starburst population modeling by Meurer et al. (1997). The derived SFR is then combined with size measurements to calculate ΣSFR. Note that ΣSFR is conserved by lensing, since the luminosity increases by the same factor as the area. The observed ΣSFR values are consistent with those of low-redshift analogs, lying near the best-fit size–luminosity relation derived for a sample of 40 Green Peas (Kim et al. 2021). The z ∼ 8 ΣSFR measurements also approach the upper envelope of ∼45 M☉ yr−1 kpc−2 reported in both local and high-redshift sources (Meurer et al. 1997; Hathi et al. 2008).
, with units of M☉ yr−1 kpc−2) for these three sources. We calculated the star formation rate (SFR) using observed rest-frame UV-continuum in the JWST F150W image (file j202736-o001_t001_nircam_clear-f150w_i2d.fits). We apply no dust correction. If dust corrections are in fact required, we could be underestimating ΣSFR in these sources. We note that the Balmer line ratios in Table 2 do not require reddening, though this is not an especially strong constraint without a Hα measurement. To convert the measured UV luminosity to the corresponding SFR in a consistent manner with the compared Green Peas, we apply the same conversion method as in Kim et al. (2021). We adopt the solar bolometric magnitude of 4.74 (Bessell et al. 1998), and the UV-to-bolometric luminosity (Lbol) ratio (LUV/Lbol) of 0.33 and the scale factor Lbol/(4.5 × 109
L☉) = SFR/(1 M☉ yr−1) that are derived from the starburst population modeling by Meurer et al. (1997). The derived SFR is then combined with size measurements to calculate ΣSFR. Note that ΣSFR is conserved by lensing, since the luminosity increases by the same factor as the area. The observed ΣSFR values are consistent with those of low-redshift analogs, lying near the best-fit size–luminosity relation derived for a sample of 40 Green Peas (Kim et al. 2021). The z ∼ 8 ΣSFR measurements also approach the upper envelope of ∼45 M☉ yr−1 kpc−2 reported in both local and high-redshift sources (Meurer et al. 1997; Hathi et al. 2008).
4. Discussion
The difficulties in reproducing the observed line ratios of J072326–732656 (04590) using photoionization models deserves further attention. One reasonably likely explanation is that an additional heating source may be present, driving Te to higher values than photoionization by a starburst tends to achieve. Either photoheating by an active galactic nucleus or shock heating of the gas could contribute. Either of these may have spectroscopic signatures detectable with further JWST observations.
A second possible class of explanation is density. The critical density for collisional deexcitation of the [O iii]4363 line is much higher than for [O iii]4959, 5007, and for densities ne ≳ 105 cm−3 the observed line ratio can be achieved at considerably lower temperatures (Figure 4; Netzer 1990; Osterbrock & Ferland 2006). While the observed ratio f([O ii]3729)/f([O ii]3726) does not suggest such high densities, it is difficult to measure confidently given the resolving power of these spectra and the faintness of the [O ii]3726, 3729 lines; and, moreover, it is possible that [O iii]4959, 5007 emission takes place in denser regions of the galaxy than [O ii]3726, 3729 emission. Deeper [O ii]3726, 3729 spectra at NIRSpec's highest resolution, [S ii]6716, 6731 measurements using JWST Mid-Infrared Instrument (MIRI) spectroscopy, or rest-UV C iii]1906, 1908 measurements (Kewley et al. 2019) from JWST or ground-based near-IR spectrographs could shed further light on this.
An independent analysis of the line emission in these same galaxies and comparison to nearby analogs was recently published by Schaerer et al. (2022). While both their work and ours conclude that the JWST sources are of low metal abundance and are broadly similar to nearby analogs, there are substantial differences in some of our methodologies. In particular, they have applied a multiplicative correction (a power law of wavelength) to the spectra to bring the observed Balmer and oxygen line ratios into better agreement with theory, while we have analyzed those line ratios and concluded that, within the uncertainties, no correction is required. As a result, we find a more extreme ratio of [O iii]4363 to [O iii]4959, 5007, and consequently a somewhat lower metal abundance in J072326–732656 (04590).
Shortly after Schaerer et al. (2022), three additional spectroscopic studies of our three JWST objects were published (Curti et al. 2023; Taylor et al. 2022; Trump et al. 2022). While a diverse set of data-reduction procedures and line-fitting routines were used, we find general agreement with our metallicity results. A detailed comparison of all these spectroscopic studies is contained in the recent publication by Taylor et al. (2022).
We now return to the larger question of how closely Epoch-of-Reionization galaxies resemble their best local analogs. We have shown clear resemblances in their emission-line-dominated rest-frame optical spectra (Figure 1) and in their small sizes and high surface brightnesses (Figure 6). The strong emission lines in both sets of galaxies suggest that their luminosities are strongly dominated by young stellar populations, and indeed the hydrogen line equivalent widths in Green Peas require substantial star formation within the last ∼5 Myr.
On the other hand, low-redshift galaxies almost invariably show underlying, older stellar populations (age >1Gyr) when observed in sufficient detail to detect such populations in the presence of younger, brighter stars. Those underlying populations cannot be present in a universe that is only 0.7 Gyr old. Similarly, detailed abundance ratios in Cosmic Dawn galaxies may differ from those in older objects, given that entire classes of star may not have had the time to return products of their nuclear burning to the interstellar medium. Such abundance ratio differences may have an impact on the composition of interstellar dust in these early galaxies. It may be possible to probe gas-phase abundance ratios in some detail with future JWST NIRSpec and MIRI spectroscopy. Stellar continuum absorption features may be within reach in a few more years, using 30 m-class telescopes. Future progress in connecting the properties of Cosmic Dawn galaxies and their local analogs will be enabled by large samples of intermediate-redshift emission line galaxies expected from the Nancy Grace Roman Space Telescope.
We anticipate another important similarity between these galaxies and their local analogs: the likely presence of strong Lyα emission. Among Green Peas, strong Lyα is nearly ubiquitous (Henry et al. 2015; Yang et al. 2016, 2017). While the present JWST spectra do not cover Lyα for these sources, earlier surveys have found Lyα-emitting galaxies up to these same redshifts, based on Lyman break selection (Oesch et al. 2015; Zitrin et al. 2015), narrowband imaging (the DAWN survey; Tilvi et al. 2020), or direct slitless spectroscopy (the FIGS survey; Tilvi et al. 2016; Larson et al. 2018). Further, identification of probable Lyα emitters has been demonstrated not only at low-z (Henry et al. 2015; Yang et al. 2016) but also in the Epoch of Reionization using Spitzer photometry to identify the strongest [O iii]4959, 5007 emitters (Roberts-Borsani et al. 2016). The statistics of Lyα emission among these early galaxies will be a valuable probe of reionization history (Malhotra & Rhoads 2004). In particular, if Lyα is detected in these objects it will be possible to measure the Lyα escape fraction by comparison with the Balmer Hβ line, and to estimate what part of Lyα attenuation is due to the IGM and what part intrinsic to the galaxy using the Yang relation between velocity offset, dust reddening, and Lyα escape (Yang et al. 2017).
Finally, these JWST galaxies are likely giving us our first detailed look at the sources driving cosmological reionization. Green Peas include a high fraction of galaxies with substantial Lyman continuum escape (Izotov et al. 2016, 2018). The observable properties of these JWST targets closely resemble those of Green Peas. Beyond the spectroscopic similarity (Figure 1), their star formation intensities rank among the highest seen in the Green Pea sample, in a region of parameter space inhabited by the strongest known Lyman continuum leakers among the Green Peas (Figure 6).
5. Conclusions
We have analyzed the rest-frame optical spectra of three Epoch-of-Reionization galaxies from the JWST EROs on the SMACS 0723 field. These objects are all strong line emitters, with spectra reminiscent of nearby Green Pea galaxies. This result supports earlier conclusions that Green Peas are among the best nearby analogs to high-redshift galaxies.
The highest redshift and most extreme among these galaxies, J072326–732656 (04590) at z = 8.495, has a very low gas-phase metallicity, ![$12+\mathrm{log}[{\rm{O}}/{\rm{H}}]\approx 6.9\pm 0.15$](https://content.cld.iop.org/journals/2041-8205/942/1/L14/revision1/apjlacaaafieqn22.gif) (0.01 < Z/Z⊙ < 0.02) from the Te
method, and
(0.01 < Z/Z⊙ < 0.02) from the Te
method, and ![$12+\mathrm{log}[{\rm{O}}/{\rm{H}}]\approx 7.27$](https://content.cld.iop.org/journals/2041-8205/942/1/L14/revision1/apjlacaaafieqn23.gif) (Z ≈ 0.03 Z⊙) from the Jiang et al. (2019) calibration of the strong-line R23 method. Its [O iii]4363/[O iii]4959, 5007 ratio may demand the presence of a heating mechanism beyond photoheating by a young starburst. The other two galaxies, J072322–732606 (06355) at z = 7.664 and J072320–732604 (10612) at z = 7.659, have appreciably higher metallicities, in the range
(Z ≈ 0.03 Z⊙) from the Jiang et al. (2019) calibration of the strong-line R23 method. Its [O iii]4363/[O iii]4959, 5007 ratio may demand the presence of a heating mechanism beyond photoheating by a young starburst. The other two galaxies, J072322–732606 (06355) at z = 7.664 and J072320–732604 (10612) at z = 7.659, have appreciably higher metallicities, in the range ![$7.7\lesssim 12+\mathrm{log}[{\rm{O}}/{\rm{H}}]\lesssim 8.3$](https://content.cld.iop.org/journals/2041-8205/942/1/L14/revision1/apjlacaaafieqn24.gif) (0.09 ≲ Z/Z⊙ ≲ 0.35). They demonstrate empirically that galaxy formation and stellar nucleosynthesis can achieve an oxygen abundance comparable to the Magellanic Clouds (Russell & Dopita 1992) within just 700 Myr after the Big Bang.
(0.09 ≲ Z/Z⊙ ≲ 0.35). They demonstrate empirically that galaxy formation and stellar nucleosynthesis can achieve an oxygen abundance comparable to the Magellanic Clouds (Russell & Dopita 1992) within just 700 Myr after the Big Bang.
All three of these galaxies share the compact sizes and high surface brightnesses that characterize Lyα-emitting galaxies across a wide range of redshifts, from z ∼ 6.5 down to z ∼ 0 (Malhotra et al. 2012; Kim et al. 2020, 2021).
Low-redshift analogs for Epoch-of-Reionization galaxies have been of tremendous value in recent years, because they have allowed us to study in nearby objects properties that could not be directly studied in faint, redshifted galaxies at Cosmic Dawn. As we have demonstrated, JWST now enables direct measurements of the many physically interesting quantities that can be derived from rest-frame optical emission lines. These will ultimately include metallicity, temperature, ionization parameter, density, and gas pressure. Despite this, the importance of local analogs remains. Some properties remain beyond reach at high redshift due to sensitivity. For exmaple, radio emission from atomic gas in single galaxies can be studied in Green Peas (Kanekar et al. 2021; Purkayastha et al. 2022) but is far beyond reach in the early universe. Other important measurements are more fundamentally precluded at high redshift, notably including the escape fraction of ionizing radiation, which cannot be effectively observed at z ≳ 4 due to absorption by residual neutral gas in the IGM. The detection of Lyman continuum escape fractions of tens of percent, and even >50% in some Green Pea galaxies, is a key ingredient in understanding reionization sources (Izotov et al. 2018; Flury et al. 2022a, 2022b). Thus, JWST now equips us to establish the validity of local analog populations with unprecedented detail and confidence, opening the way for further progress using both the most distant and the closest young galaxies.
We thank the JWST team—all of you—for making this possible.
This work is based in part on observations made with the NASA/ESA/CSA James Webb Space Telescope. The data were obtained from the Mikulski Archive for Space Telescopes at the Space Telescope Science Institute, which is operated by the Association of Universities for Research in Astronomy, Inc., under NASA contract NAS 5–03127 for JWST. These observations are associated with program #2736. The authors acknowledge the JWST ERO team for developing their observing program with a zero-exclusive-access period.
This work has made use of public data from the Sloan Digital Sky Survey (SDSS). Funding for the SDSS and SDSS-II has been provided by the Alfred P. Sloan Foundation, the Participating Institutions, the National Science Foundation, the U.S. Department of Energy, the National Aeronautics and Space Administration, the Japanese Monbukagakusho, the Max Planck Society, and the Higher Education Funding Council for England. The SDSS Web Site can be accessed at http://www.sdss.org/.
The SDSS is managed by the Astrophysical Research Consortium for the Participating Institutions. The Participating Institutions are the American Museum of Natural History, Astrophysical Institute Potsdam, University of Basel, University of Cambridge, Case Western Reserve University, University of Chicago, Drexel University, Fermilab, the Institute for Advanced Study, the Japan Participation Group, Johns Hopkins University, the Joint Institute for Nuclear Astrophysics, the Kavli Institute for Particle Astrophysics and Cosmology, the Korean Scientist Group, the Chinese Academy of Sciences (LAMOST), Los Alamos National Laboratory, the Max-Planck-Institute for Astronomy (MPIA), the Max-Planck-Institute for Astrophysics (MPA), New Mexico State University, Ohio State University, University of Pittsburgh, University of Portsmouth, Princeton University, the United States Naval Observatory, and the University of Washington.
This work has been supported in part by NASA contract NNG16PJ33C, "Studying Cosmic Dawn with WFIRST."
Footnotes
- 8
- 9
CLOUDY v. 17.03.