


Abstract
Combining the Mars Atmosphere and Volatile Evolution (MAVEN) measurements of atmospheric neutral and ion densities, electron temperature, and energetic electron intensity, we perform the first quantitative evaluation of local ionization balance in the nightside Martian upper atmosphere, a condition with the electron impact ionization (EI) of CO2 exactly balanced by the dissociative recombination (DR) of ambient ions. The data accumulated during two MAVEN Deep Dip (DD) campaigns are included: DD6 on the deep nightside with a periapsis solar zenith angle (SZA) of 165°, and DD3 close to the dawn terminator with a periapsis SZA of 110°. With the electron temperatures at low altitudes corrected for an instrumental effect pertaining to the MAVEN Langmuir Probe and Waves, a statistical agreement between the EI and DR rates is suggested by the data below 140 km during DD6 and below 180 km during DD3, implying that electron precipitation is responsible for the nightside Martian ionosphere under these circumstances and extra sources are not required. In contrast, a substantial enhancement in EI over DR is observed at higher altitudes during both campaigns, which we interpret as a signature of plasma escape down the tail.
Export citation and abstract BibTeX RIS
1. Introduction
An ionosphere is the ionized portion of a planetary upper atmosphere where both solar photons and Solar Wind (SW) charged particles deposit significant energy (Witasse et al. 2008). For Mars, the dayside ionosphere contains a well-defined layer structure that is mainly produced by solar extreme ultraviolet (EUV)/X-ray ionization along with impact ionization by photoelectrons and their secondaries (Withers 2009, and references therein). In contrast, the nightside ionosphere of Mars is patchy and sporadic, with impact ionization by precipitating electrons generally thought to be the dominant source of ionization (Verigin et al. 1991; Safaeinili et al. 2007; Fowler et al. 2015; Girazian et al. 2017a; Adams et al. 2018; Lillis et al. 2018). These precipitating electrons could be either SW electrons or remnant dayside photoelectrons that survive into the optical shadow of the planet under favorable ambient magnetic field configurations (e.g., Xu et al. 2016, 2017; Weber et al. 2017). The occurrences of these two types of precipitating electrons were found to dominate below and above a solar zenith angle (SZA) of 110°, respectively (Shane et al. 2016). It has also been suggested that day-to-night transport serves as an additional source of the nightside plasma on Mars, especially not too far from the terminator (e.g., Němec et al. 2010; Withers et al. 2012; Cui et al. 2015; Girazian et al. 2017b; Adams et al. 2018).
Assuming steady state and no transport, production via photoionization or electron impact ionization (EI) is in exact balance with destruction via dissociative recombination (DR), hereafter denoted as local ionization balance (LIB; e.g., Mendillo et al. 2017). On the dayside, the available Mars Subsurface and Ionospheric Sounding measurements made on board the Mars Express indicate that LIB starts to fail at approximately 50 km above the ionospheric peak (Němec et al. 2011), but such a condition on the nightside has not been explored observationally. A thorough verification of LIB is complicated because the knowledge to a number of controlling factors is required, including solar EUV irradiance, differential energetic electron intensity, atmospheric neutral and ion densities, as well as electron temperature. The recent Mars Atmosphere and Volatile Evolution (MAVEN) mission (Jakosky et al. 2015) provides a unique opportunity to explore a wide parameter space of all the above controlling factors, allowing the condition of LIB to be assessed rigorously on both the dayside and nightside of Mars.
The present study focuses exclusively on the nightside with the aid of a multi-instrument data set accumulated from two specific MAVEN Deep Dip (DD) campaigns. We describe in Section 2 the methodology used for calculating the EI and DR rates. In Section 3, these rates are compared to evaluate quantitatively the role of electron precipitation. Regions of the nightside Martian upper atmosphere with clear departure from LIB are identified and the possible reasons are discussed. Finally, we end with concluding remarks in Section 4.
2. Calculation of Ion Production and Destruction Rates
Following Vigren et al. (2015), the ion production and destruction rates, hereafter denoted as PEI and LDR, in the nightside Martian upper atmosphere are calculated via

and

where E is the electron energy,  ,
,  ,
,  , and
, and  are the number densities of CO2,
  , NO+, and HCO+, Ne is the electron number density assumed to be everywhere identical to the total ion number density,
  ,
,  , and
, and  are the respective DR coefficients that depend on the electron temperature, σEI is the EI cross section for CO2 adapted from our previous compilation in Cui et al. (2011), Eth is the CO2 ionization threshold, and Ie is the mean differential electron intensity.
Existing works reveal that the nightside Martian ionosphere is primarily contributed by O2+, NO+, and HCO+, in decreasing order of importance below 200 km (Girazian et al. 2017a, 2017b). Therefore, a more accurate evaluation of LIB on the nightside should include not only  DR, but also NO+ and HCO+ DR, as demonstrated by Equation (2). The respective DR coefficients are taken from Sheehan & St.-Maurice (2004) for
  and NO+, and from LePadellec et al. (1997) for HCO+, respectively.
The data acquired by several instruments on board MAVEN are used to calculate the EI and DR rates according to Equations (1) and (2). The atmospheric neutral and ion densities are obtained from the Neutral Gas and Ion Mass Spectrometer (NGIMS) measurements in the Closed Source Neutral and Open Source Ion modes, respectively, both covering the mass range of 2–150 Da (Mahaffy et al. 2015b). The electron temperatures are based on the current-voltage characteristics obtained by the Langmuir Probe and Waves (LPW; Andersson et al. 2015). The energetic electron intensities are adopted from the Solar Wind Electron Analyzer (SWEA) measurements, covering the energy range of 3 eV to 4.6 keV (Mitchell et al. 2016).
In the subsequent analysis, the outbound data are excluded to reduce the uncertainty in the NGIMS neutral density due to possible wall contamination (e.g., Cui et al. 2018). To calculate the EI rate, each electron energy spectrum measured by the SWEA is corrected for spacecraft charging using the potential derived from the MAVEN Suprathermal and Thermal Ion Composition measurements (McFadden et al. 2015). The potential has to be less negative than −10.8 eV to ensure that the energy range for a corrected electron energy spectrum encompasses the nominal ionization potential of 13.8 eV for CO2 (e.g., Itikawa 2002).
The calculations of the EI and DR rates are subject to several sources of uncertainty. The uncertainty in the NGIMS ion density is typically 25% over the density range encountered here (Benna et al. 2015). The uncertainty in the LPW electron temperature is 20% as implied by the disagreement in temperature measurement between two independent sensors (Ergun et al. 2015). Meanwhile, the uncertainty in the experimentally determined DR coefficient is 15% (Sheehan & St.-Maurice 2004). The above uncertainties lead to a combined uncertainty of 35% in the calculated DR rate. Furthermore, the uncertainties in both the NGIMS CO2 density and the CO2 EI cross section are quite small, usually below 1% for the former (Mahaffy et al. 2015a) and around 5% for the latter (Itikawa 2002). The uncertainty in the derived EI rate is thus mainly contributed by the uncertainty in energetic electron intensity, which is roughly 10% at a characteristic energy of 100 eV, the location where the CO2 EI cross-section peaks (Itikawa 2002). Following the above discussion, we conclude that the combined uncertainty in the multi-instrument MAVEN data set allows a discrepancy as large as 40% between the computed EI and DR rates under LIB.
3. Evaluation of Local Ionization Balance
We consider here the relevant measurements made during two MAVEN DD campaigns on the nightside (Cui et al. 2018; Stone et al. 2018). The first one, DD6, conducted on 2016 July 26–31 with a periapsis SZA around 165°, covers the equatorial regions of Mars whereas the second one, DD3, conducted on 2015 July 8–15 with a periapsis SZA around 110° on the dawn side, covers the southern hemisphere of the planet. For both campaigns, the Martian upper atmosphere is completely in the optical shadow up to the nominal exobase at around 200 km (e.g., Chaffin et al. 2015).
Taking MAVEN orbits #3573 from DD6 and #1513 from DD3 as two examples, we show the characteristics of the nightside Martian upper atmosphere in Figures 1 and 2 in terms of the densities of CO2,  , NO+, and HCO+ in panel A, the neutral and electron temperatures in panel B, as well as the mean energetic electron intensity in panel C, all as a function of altitude. The neutral temperature profile, shown for illustrative purposes only, is obtained by downward integrating the CO2 distribution, assuming an upper boundary temperature of 120 K with the aid of the hydrostatic balance equation (e.g., Cui et al. 2018; Stone et al. 2018). The above parameters are used to determine the CO2 EI frequency, defined as the EI rate divided by the CO2 number density, in panel D, as well as the EI and DR rates in panel E.
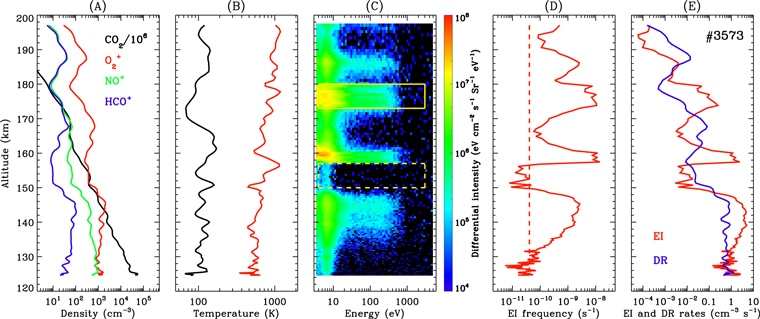
Figure 1. Status of the nightside Martian upper atmosphere for orbit #3573 during DD6, including the densities of CO2,  , NO+, and HCO+ in panel A, the neutral and electron temperatures in panel B, the mean energetic electron intensity in panel C, all as a function of altitude. The corresponding profiles of CO2 EI frequency, as well as the EI and DR rates, are presented in panels D and E, respectively. The solid and dashed boxes in panel C encompasses the regions where the median electron energy spectra shown in Figure 3 are extracted. The vertical dashed line in panel D represents the EI frequency contributed by a constant background level associated with penetrating cosmic galactic rays and solar energetic particles (Mitchell et al. 2016).
Download figure:
Standard image High-resolution image
Figure 2. Similar to Figure 1 but for orbit #1513 during DD3.
Download figure:
Standard image High-resolution imageFigures 1 and 2 demonstrate that electron precipitation on the nightside of Mars is patchy and irregular, with clear evidence for substantially reduced electron flux over isolated regions (Steckiewicz et al. 2017). For instance, the SWEA electron spectra at 150–157 km for orbit #3573 and at 125–150 km for orbit #1513, as encompassed by the dashed boxes in Figures 1 and 2, reveal a near-constant background level of several 103 eV cm−2 s−1 Sr−1 eV−1 above the CO2 ionization potential. The corresponding mean count rate spectra are displayed in Figure 3, superimposed on a typical spectrum reflecting significant electron precipitation at 173–180 km for orbit #3573, as encompassed by the solid box in Figure 1. The background level is manifest as a constant count rate of 0.3 s−1 above 10–20 eV, likely associated with penetrating galactic cosmic rays and solar energetic particles (Mitchell et al. 2016). Figure 3 essentially indicates negligible ionizing electron flux over certain regions of the nightside Martian upper atmosphere, and the corresponding EI rates computed from Equation (1) represent upper limits only.

Figure 3. Several representative SWEA electron energy spectra averaged over selected altitude ranges from orbit #3573 during DD6 and orbit #1513 during DD3, distinguishing between the cases with substantial and negligible electron precipitation above the CO2 ionization potential. The selected regions are indicated by solid or dashed boxes in Figures 1 and 2.
Download figure:
Standard image High-resolution imageFigures 1 and 2 reveal some interesting structures that coexist in both electron intensity and ion density at near-identical altitudes. For orbit #3573 in Figure 1, a density bump is seen for all ion species below 150 km, which coincides with significant electron intensity or EI frequency at similar altitudes. For orbit #1513 in Figure 2, similar coincidence is clearly seen near 160 km, despite the apparent shift by 3 km between the ion density peak and the electron intensity peak. These observations strongly suggest that electron precipitation is an important process maintaining the nightside ionosphere of Mars, both deep in darkness (DD6) and not too far from the terminator (DD3). However, exceptions do occur such as significant electron precipitation near 160 and 175 km for orbit #3573 with no simultaneous signature of ion density bump.
The role of electron precipitation in maintaining a nightside ionosphere on Mars has also been validated by the observed correlation between ionizing electron flux and ion density based on the MAVEN SWEA and NGIMS measurements (Girazian et al. 2017a). However, such a correlation does not necessarily exclude the contribution either from an additional source of ionization or from plasma transport, provided that its signature is not strong enough to mask the signature of electron precipitation. A more rigorous evaluation of electron precipitation relies on a quantitative comparison between the EI and DR rates, but Figures 1 and 2 reveal that these two rates are generally incompatible with a discrepancy that could exceed one order of magnitude under certain circumstances. The apparent agreement between EI and DR below 150 km for orbit #1531 is misleading because only upper limits of the EI rate are obtained at these altitudes.
The pattern of discrepancy between EI and DR shown in Figures 1 and 2 is instructive. For both orbits, EI is periodically enhanced and reduced relative to DR, implying regional plasma outflow and inflow interwoven over the altitude range examined here. Such a signature is indicative of plasma waves likely driven by gravity waves in the ambient neutral atmosphere (e.g., England et al. 2017; Terada et al. 2017), which we speculate to be responsible for the observed departure from LIB, especially at relatively low altitudes where plasma transport is suppressed and the condition of LIB should in principle be satisfied (e.g., Mendillo et al. 2017). The effect of plasma waves is undesirable within the context of the present study and could be circumvented by exploring the statistical relation between the EI and DR rates combining the data from a large number of MAVEN orbits.
Such a relation is displayed by the open circles in Figure 4 for DD6 (left panel) and DD3 (right panel), restricted to regions with the EI frequency above the background level by more than 3σ. The blue, green, orange, and red circles characterize regions at 120–140 km, 140–160 km, 160–180 km, and 180–200 km, respectively. Despite the large scattering, the figure reveals an apparent asymmetry about LIB in that EI tends to be enhanced over DR in a statistical sense for both campaigns. To examine the departure from LIB more rigorously, we calculate for each altitude bin and each campaign the median EI and DR rates, as displayed by the solid squares in Figure 4. Our calculations indicate a reasonable agreement between EI and DR at 140–180 km during DD3 only, with a median difference of no more than 20%, which is allowed by the combined instrument uncertainty of 40%.

Figure 4. Correlation between the EI and DR rates during DD6 (left panel) and DD3 (right panel), restricted to regions with the EI frequency above the background level by more than 3σ. The blue, green, orange, and red symbols characterize the correlations below 140 km, at 140–160 km, at 160–180 km, and above 180 km, respectively. The open circles represent the EI and DR rates for all individual measurements. The solid squares stand for the median rates for each altitude bin, and the five stars give the rates corrected for the MAVEN LPW instrumental effect (Ergun et al. 2015). The dashed line in each panel indicates the condition of LIB.
Download figure:
Standard image High-resolution image
The departure from LIB below 140 km observed during both campaigns is likely caused by an instrumental effect in that the electron temperatures derived from the LPW current-voltage characteristics are known to be overestimated at low altitudes due to surface resistance or capacitance on the instrument sensor (e.g., Ergun et al. 2015; Peterson et al. 2018). This implies that the DR rates are underestimated due to the temperature dependence of DR coefficient (e.g., Sheehan & St.-Maurice 2004). During both campaigns, the LPW electron temperature is around 700 K below 140 km, which is higher than the neutral temperature of 110 K by a factor of 6.4. This leads to an actual DR rate that is underestimated by a factor of 3.7 if we assume that the ionospheric electrons are fully thermalized with the ambient neutrals below 140 km (Matta et al. 2014, and references therein). The corrected DR rates, shown with the solid five stars in Figure 4, are different from the respective EI rates by only 20% for DD6 and 10% for DD3. Both are below the combined instrument uncertainty and indicate that the condition of LIB prevails at these altitudes.
For DD6 above 140 km and DD3 above 180 km, the LPW instrumental effect quoted above is not responsible for the departure from LIB, where the electron temperature measurements are fairly robust with an uncertainty of 20% only (Ergun et al. 2015). The apparent discrepancy between EI and DR at these altitudes, typically by a factor of more than 5, is too large to be interpreted by any known instrumental effect. This is likely indicative of an additional plasma loss channel viable on the nightside of Mars, which we propose to be plasma escape down the tail (e.g., Barabash et al. 2007; Edberg et al. 2010; Lundin et al. 2013; Ramstad et al. 2015; Dubinin et al. 2017a, 2017b). Wu et al. (2019) has demonstrated with a multi-instrument MAVEN data set that such plasma escape is driven primarily by the magnetic pressure force.
4. Concluding Remarks
LIB is an ideal condition in the upper portion of a planetary atmosphere with ionization exactly balanced by DR (e.g., Vigren et al. 2013, 2015; Mendillo et al. 2017). Combining the MAVEN measurements of ambient neutral and ion densities, electron temperature, and energetic electron intensity, we perform in this study the first evaluation of LIB in the nightside Martian upper atmosphere. The data accumulated from two MAVEN DD campaigns are considered: DD6 on the deep nightside with a periapsis SZA of 165°, and DD3 not too far from the dawn terminator with a periapsis SZA of 110°.
The calculation of the DR rate is subject to an instrumental effect pertaining to the MAVEN LPW that leads to overestimated electron temperatures and consequently underestimated DR rates (Ergun et al. 2015). When this effect is corrected, our analysis reveals that the condition of LIB prevails below 140 km during DD6 and below 180 km during DD3, implying that a nightside ionosphere is contributed by electron precipitation on Mars and any additional source of ionization is not required (Verigin et al. 1991; Safaeinili et al. 2007; Fowler et al. 2015; Girazian et al. 2017a; Adams et al. 2018). However, a substantial difference between EI and DR is present at higher altitudes during both campaigns, which is likely a signature of plasma escape down the tail (e.g., Barabash et al. 2007; Edberg et al. 2010; Lundin et al. 2013; Ramstad et al. 2015; Dubinin et al. 2017a, 2017b). There is no unambiguous evidence supporting day-to-night transport as an extra source of ionospheric plasma on the nightside of Mars, especially during DD3 not too far from the terminator (e.g., Němec et al. 2010; Withers et al. 2012; Cui et al. 2015; Girazian et al. 2017b; Adams et al. 2018). Finally, we caution that the above conclusions are reached in a statistical sense, whereas the EI rates computed along any individual orbit seldom agree with the respective DR rates due to the omnipresence of plasma waves. These waves frequently lead to a periodical pattern of interwoven enhancement and reduction in EI as compared to DR.
This work is supported by the Strategic Priority Research Program of the Chinese Academy of Sciences (XDA17010201). J.C. and Y.W. acknowledge support from the National Science Foundation of China (41525015, 41774186, and 41525016). S.S.X. thanks the National Aeronautics and Space Administration supporting the Mars Atmosphere and Volatile Evolution project through the Mars Exploration Program. E.V. is grateful for funding from the Swedish National Space Agency (166/14). N.J.T.E. acknowledges funding from the Swedish National Space Agency (135/13) and the Swedish Research Council (621-2013-4191). The data used in the present study are publicly available at https://pds-ppi.igpp.ucla.edu and https://lasp.colorado.edu/maven/sdc/public.