


Abstract
Atmospheric organic hazes are present on many planetary bodies, possibly including the ancient Earth and exoplanets, and can greatly influence surface and atmospheric properties. Here we examine the physical and optical properties of organic hazes produced with molecular nitrogen, methane, carbon dioxide, and increasing amounts of molecular oxygen, and compare them to hazes produced without added oxygen. As molecular oxygen is included in increasing amounts from 0 to 200 ppmv, the mass loading of haze produced decreases nonlinearly. With 200 ppmv molecular oxygen, the mass loading of particles produced is on the order of the amount of organic aerosol in modern Earth's atmosphere, suggesting that while not a thick organic haze, haze particles produced with 200 ppmv molecular oxygen could still influence planetary climates. Additionally, the hazes produced with increasing amounts of oxygen become increasingly oxidized and the densities increase. For hazes produced with 0, 2 and 20 ppmv oxygen, the densities were found to be 0.94, 1.03 and 1.12 g cm−3, respectively. Moreover, the hazes produced with 0, 2, and 20 ppmv oxygen are found to have real refractive indices of n = 1.58 ± 0.04, 1.53 ± 0.03 and 1.67 ± 0.03, respectively, and imaginary refractive indices of  , 0.002 ± 0.002 and
  , respectively. These k values demonstrate that the particles formed with oxygen have no absorption within our experimental error, and could result in a light scattering layer in an oxygen-containing atmosphere.
Export citation and abstract BibTeX RIS
1. Introduction
Life on Earth is thought to have arisen during the Archean Eon, with the oldest microfossils aged at 3.5 Ga (Schopf 1993). However, the atmospheric conditions during this time are quite uncertain. To maintain liquid water with a faint young Sun, models typically include methane and carbon dioxide as greenhouse gases. However, the estimated atmospheric methane and carbon dioxide concentrations needed to warm the planet could have led to the formation of a photochemical organic haze in the atmosphere of the ancient Earth (Sagan & Chyba 1997; Trainer et al. 2004, 2006; Domagal-Goldman et al. 2008; Haqq-Misra et al. 2008; DeWitt et al. 2009; Hasenkopf et al. 2010; Zerkle et al. 2012). While the amounts of these gases varied during the Archean Eon, previous laboratory studies have shown that haze can exist with CO2:CH4 ratios as high as 10:1 (DeWitt et al. 2009), supporting the possibility of a haze during much of Earth's ancient history. The presence of an atmospheric haze is important to consider when examining the evolution of life because haze can be composed of prebiotic molecules (Hörst et al. 2012) and can also modulate surface temperatures, and thus the presence of surface liquid water (Arney et al. 2016).
Laboratory studies have demonstrated that an Archean haze formed in a CO2/CH4/N2 atmosphere would be chemically distinct from a haze that formed in the absence of any major oxygenated species (Trainer et al. 2006; Hicks et al. 2015, 2016). In addition to CO2 influencing the chemistry during haze formation, it could also lead to the synthesis of molecular O2 when photolyzed. While the O2 levels during the Archean are uncertain, Kasting (1993) and Segura et al. (2007) have suggested that a planet with 0.2 bars CO2 could contain up to tenths of a percent of stratospheric O2 by CO2 photolysis. Additionally, Crowe et al. (2013) found that 63 ppm of atmospheric O2 may have existed at 3 Ga. The presence of molecular oxygen could alter haze formation as oxygen is believed to terminate haze production by initiating reactions that oxidize the gas-phase species before they polymerize into haze (Zahnle 1986).
While the hazes formed in oxygenated and non-oxygenated atmospheres are chemically distinct, many modeling studies use the optical properties, specifically the complex refractive index (m), of Titan tholins produced with CH4 in N2 to simulate haze that could have existed in the ancient Earth's atmosphere (Pavlov et al. 2001; Domagal-Goldman et al. 2008; Haqq-Misra et al. 2008; Wolf & Toon 2010). The complex refractive index, m = n + ki, describes scattering (n) and absorption (k) of light by the haze particles and depends on particle composition. Additionally, it is also common to use a particle density of 1 g cm−3 (see Arney et al. 2016) or values substantially >1 based on Titan-like organic solids (Sagan & Chyba 1997) for haze particles in early Earth models. Density depends on particle composition, in addition to particle shape and internal structure, and could be heavily influenced by oxygen content.
Because the complex refractive index and the density of haze particles are both common input parameters for modeling atmospheric hazes, using the values representative of the atmosphere in question is desirable. We present complex refractive indices at a wavelength of 405 nm and particle effective densities for organic hazes produced by the ultraviolet (UV) excitation of methane, carbon dioxide, and varying amounts of molecular oxygen in nitrogen. These values are compared to a methane-only haze as a baseline for hazes produced in the absence of oxygenated species.
2. Experimental
2.1. Haze Production
Hazes were produced with 0.1% CO2 (Airgas, 99.99%), 0.1% CH4 (Airgas, 99.99%), and 0, 2, 20, and 200 ppmv O2 (Airgas, 99.994%) in N2 (Airgas, 99.999%). These gas mixtures are an approximation for the early Earth's atmosphere. A CO2:CH4 ratio of 1:1 was chosen because it produces sufficient aerosol signal for the instrumentation used in this study (Trainer et al. 2006; Hasenkopf et al. 2010). Moreover, while Hicks et al. (2016) showed that most of the oxygen incorporation for CO2/CH4/N2 hazes comes from the oxygen in the precursor CO2, some of the oxygen in these particles could result from oxygen contamination in the precursor gases.
The photochemical haze generation system has been described in detail previously (Trainer et al. 2006; Hasenkopf et al. 2010; Hörst & Tolbert 2013). Briefly, CO2, CH4, O2, and N2 flow into a mixing chamber and mix for at least 8 hr. Then, a mass flow controller (MFC; Mykrolis, FC-2900) flows the gas mixture into the UV reaction cell at a rate between 60–100 standard cubic centimeters per minute (sccm). One side of the reaction cell has a deuterium continuum lamp (Hamamatsu, L1835) that outputs light between 115 and 400 nm. Chemistry is initiated at ambient conditions (∼620 Torr and 20°C), and the resulting haze particles flow to the instrumentation used for analysis: a quadrupole aerosol mass spectrometer (Q-AMS) and a scanning mobility particle sizer (SMPS) for particle effective density measurements, and a photoacoustic spectrometer and a cavity ring-down spectrometer (PASCaRD) for complex refractive index measurements. Due to flow rate constraints, particles were flowed alternately to these instruments. An additional 200–240 sccm of prepurified N2 dilution flow was added after the UV reaction cell for measurements with the SMPS and PASCaRD to satisfy instrument requirements.
2.2. Quadrupole Aerosol Mass Spectrometry
The Q-AMS alternates between particle time-of-flight (PToF) mode and mass spectrum (MS) mode to measure the size distribution by mass of selected ion fragments and particle composition, respectively. Aerosol mass spectrometry has been described in detail previously (Jayne et al. 2000; Jimenez et al. 2003). Briefly, as particles and gas enter the AMS, an aerodynamic lens focuses the particles into a beam while differential pumping removes the gas. The particles then travel through a high vacuum time-of-flight chamber where, in PToF mode, their vacuum aerodynamic diameter (Dva; the diameter of a unit density sphere that will reach the same terminal velocity in vacuum as the particle of interest) is calculated from their size-dependent velocity through the chamber (Jimenez et al. 2003). In MS mode, the particle beam is flash vaporized at 600° C and ionized by electron ionization (70 eV). Quadrupole mass spectrometry (QMA 410, Balzers, Liechtenstein) is used to analyze the ions with unit mass resolution.
2.3. Scanning Mobility Particle Sizer
The SMPS is a combination of two instruments: a differential mobility analyzer (DMA; TSI, 3081), and a condensation particle counter (CPC; TSI, 3022A). Briefly, polydisperse particles flow into the DMA, where a constant electric field is applied to the particles. The particles are then size-selected based on their electrical mobility against the drag force from the sheath flow. The diameter measured by the DMA is the electrical mobility diameter (Dm; the diameter of a unit density sphere with the same electrical mobility in an electric field as the particle of interest; Flagan 2001; DeCarlo et al. 2004). The size-selected particles then enter the CPC where the number density (N, particles cm−3) at each Dm is measured by light scattering. The sheath flow used was 3.0 liter per minute.
2.4. Photoacoustic Spectroscopy and Cavity Ring-down Spectroscopy
Before haze particles enter PASCaRD, the polydisperse particles flow to the DMA to be size-selected. The size-selected particles then flow to the cavity ring-down spectrometer (CaRD) where particle extinction (bext, Mm−1) is measured at 405 nm. The same particles then flow to the photoacoustic spectrometer (PAS) where particle absorption (babs, Mm−1) is measured at 405 nm. After the PAS, the particles flow into the CPC where particle number density (N, particles cm−3) is measured. Extinction and absorption measurements are made for five to six different mobility diameters between 175–350 nm. The best fit n and k are found by minimizing the merit function described in Zarzana et al. (2014), which compares the experimentally retrieved extinction and absorption measurements to extinction and absorption measurements calculated using Mie theory and correcting for doubly-charged particles that can result from the DMA size selection process. For details on the PASCaRD instrumentation and the refractive index calculation, see Ugelow et al. (2017).
3. Results and Discussion
3.1. Particle Effective Density and Mass Loading
Size distributions measured by the Q-AMS and SMPS for the particles produced in this study are shown in Figure 1. It was not possible to measure the Q-AMS size distribution for the particles produced with 200 ppmv O2 because of the particles' smaller diameters. The aerodynamic lens transmits particles with a dva between 20 and 1000 nm, but the collection efficiency drops off steeply for dva < 60 nm (Jayne et al. 2000). About 60% of the particles produced with 200 ppmv O2 have diameters less than 60 nm. Moreover, the AMS y-axis is normalized to the peak area because the AMS measures the size distribution for the most prominent organic peaks, not every peak in the mass spectrum.

Figure 1. SMPS and Q-AMS size distributions measured for haze particles produced in this study. The AMS signal is normalized to the total peak area because the size distributions measured by the AMS are for the most prominent organic peaks, which is not equal to the total number of peaks in the mass spectrum. The mode diameters were used to calculate particle effective density. Due to the low collection efficiency by the AMS for particles with diameters less than 60 nm, the size distribution for the particle population produced with 200 ppmv O2 could not be measured.
Download figure:
Standard image High-resolution imageUsing the mode Dva and Dm from the size distributions for each haze, the particle effective densities were calculated by the relationship shown in DeCarlo et al. (2004):

where ρ0 is unit density (1 g cm−3). The calculated effective densities are included in Table 1 and Figure 2(a) shows the particle effective densities as a function of precursor O2. Because the Q-AMS could not measure the size distribution for the particles produced with 200 ppmv O2, the particle effective density for this haze could not be calculated. For comparison to hazes synthesized without any oxygenated species present, the effective density of photochemical haze particles produced with 0.1% CH4 in N2 from Hörst & Tolbert (2013) is included (blue point).
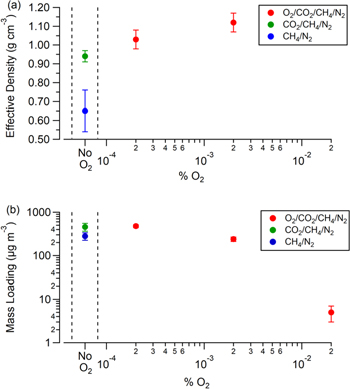
Figure 2. (a) Particle effective density and (b) particle mass loading calculated from the particle effective density as a function of precursor O2. The blue density value is the effective density measured by Hörst & Tolbert (2013) for particles produced with 0.1% CH4/N2, and the blue particle mass loading value is the particle mass loading calculated from the values reported in Hörst & Tolbert (2013) for particles produced with 0.1% CH4/N2 as well. To calculate the mass loading for particles produced with 200 ppmv O2, the effective density of the particles produced with 20 ppmv O2 was used. Because density increases with oxygen content, the calculated mass loading for the particles produced with 200 ppmv O2 is a lower limit.
Download figure:
Standard image High-resolution imageTable 1. Summary of Particle Effective Density, the Ratio of m/z 44 to Total Organics, and the Refractive Index at 405 nm
| λ = 405 nm | ||||
|---|---|---|---|---|
| Mixture | ρeff (g cm−3) | m/z 44/Total Organics | n | k |
| 0.1% CH4/N2 | 0.65 ± 0.11(1) | ⋯ | 1.40 ± 0.02 | 0.002 ± 0.001 |
| 0.1% CH4/0.1% CO2/N2 | 0.94 ± 0.03 | 0.081 ± 0.004 | 1.58 ± 0.04 |

|
| 2 ppmv O2/0.1% CH4/0.1% CO2/N2 | 1.03 ± 0.05 | 0.084 ± 0.005 | 1.53 ± 0.03 | 0.002 ± 0.002 |
| 20 ppmv O2/0.1% CH4/0.1%CO2/N2 | 1.12 ± 0.05 | 0.094 ± 0.001 | 1.67 ± 0.03 |

|
Note. Uncertainties in particle effective density and m/z 44 to total organics ratio are the 1σ standard deviation of the reproducibility of each experiment. Uncertainties in n and k result from 1σ standard deviations in the extinction, absorption, and particle number density measurements at each particle mobility diameter, along with the 1σ standard deviation of the reproducibility of each retrieval.
References. (1) Hörst & Tolbert (2013).
Download table as: ASCIITypeset image
As seen in Figure 2(a), as the oxygen content in the precursor gas mixture increases (by adding CO2 and then O2), the particle effective density increases. Increasing particle density with increasing particle O:C ratio has been observed for Earth aerosol (Pang et al. 2006) and planetary haze simulations (He et al. 2017; Hörst et al. 2018), suggesting that the oxygen content in the hazes produced in this study is increasing with precursor O2. To confirm this, a measure of oxygen content as a function of precursor O2 was made using the Q-AMS, where the peak at m/z = 44 (COO+) was compared to the total organic signal and is included in Table 1. As particles are produced with increasing amounts of precursor O2 from 0, 2, and then 20 ppmv, the ratio of m/z = 44 to the total organic signal increases as 0.081 ± 0.004, 0.084 ± 0.005, and 0.094 ±0.001, respectively, confirming that as precursor oxygen increases to 20 ppmv, oxygen incorporation into the particles increases as well. As the particles produced with 0 and 2 ppmv O2 have ratios that are not statistically different from each other, it is possible that these two hazes have similar oxygen contents. Due to possible particle morphology differences, these two hazes can be compositionally similar but still have statistically different effective densities.
Using the haze particles' calculated effective densities and the SMPS measured particle number densities, haze particle mass loadings (μg m−3) were calculated. Figure 2(b) displays the mass loading for each haze, including the mass loading of photochemical haze produced with 0.1% CH4 and N2 calculated using the reported values in Hörst & Tolbert (2013). The effective density measured for the 20 ppmv O2 haze particles (1.12 g cm−3) was used to calculate the mass loading for the 200 ppmv O2 haze. Because effective density increases with oxygen content, the 200 ppmv O2 haze mass loading represents a lower limit. As Figure 2(b) shows, haze mass loading decreases nonlinearly with precursor O2 concentration. Additionally, the mass loading of haze produced with 1:1 CO2:CH4 in N2 is slightly greater than without CO2, which Trainer et al. (2006) also observed. Moreover, the total mass loading of the haze produced with trace amounts of molecular oxygen is substantial. Even with the addition of 200 ppmv precursor O2, the mass loading of haze in our experiments is comparable to current mass loadings of organic aerosol in the Earth's atmosphere (Junker et al. 2004; Gupta et al. 2007; Jimenez et al. 2009; Levy et al. 2014; Wang et al. 2016). Therefore, while not being a thick atmospheric haze, this amount of aerosol could still impact the radiative budget and surface temperature of the early Earth, just as the current aerosol in Earth's atmosphere do today.
3.2. Particle Complex Refractive Indices
Figure 3 shows an example of the extinction and absorption efficiency (Qext and Qabs, respectively) as a function of particle size for the CO2/CH4/N2 haze. The points are experimentally retrieved data and the lines are fits of the data using the procedure in Zarzana et al. (2014) and Ugelow et al. (2017) to determine the real and imaginary refractive indices using Mie theory. The figure shows strong agreement between the measured and calculated extinction and absorption efficiencies, and is representative of the agreement between the calculated and experimental data for all of the hazes studied. Table 1 includes the complex refractive indices at 405 nm retrieved for the haze particles produced in this study, including a non-oxygen-containing CH4/N2 haze. Using the standard deviation for the error bars of the retrieved k values results in k < 0 for certain hazes. However, k cannot be negative so the lower bound error bar for these hazes ends at k = 0.
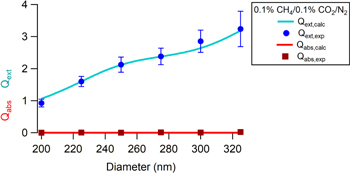
Figure 3. Representative plot of extinction efficiency (Qext) and absorption efficiency (Qabs) vs. particle mobility diameter for the CO2/CH4/N2 haze particles. The points represent the experimental data and the lines represent the calculated Qext and Qabs using the n and k that result in the minimization of the merit function. Ugelow et al. (2017) explained the fit further.
Download figure:
Standard image High-resolution imageAs oxygen is added via CO2 and O2, the real refractive index of the haze increases. This could mean that greater oxygen incorporation into haze particles results in increasing n values. The n values for the CO2-containing mixtures without O2 and with 2 ppmv O2 are similar within error bars, and, based on their relative oxygen content measured by the Q-AMS, we believe that these two hazes are compositionally similar.
Whereas haze particles produced with just CH4 and N2 have a slight absorption (k = 0.002), particles produced with oxygenated species are non-absorbing. Although the measured imaginary refractive indices of the oxygenated particles are slightly greater than zero, the large error in the retrieved values cannot exclude k = 0, especially when considering the raw PAS signals. The raw PAS signal for the haze produced with 0.1% CH4 in N2 is the only haze with a raw absorption signal greater than zero, whereas the other hazes' raw absorption signals average to about zero (or less). Hasenkopf et al. (2010) measured a larger k value (k = 0.055) for hazes produced with 0.1% CH4 and 0.1% CO2 in N2 at 532 nm and found that producing particles with CO2 enhances particle absorption at this wavelength. However, that experiment was done with CaRD alone and Zarzana et al. (2014) demonstrated that coupling extinction to absorption measurements, as in the present study, greatly improves the complex refractive index retrieval, particularly resulting in enhanced accuracy and precision in k. Gavilan et al. (2017) observed a similar trend to the present study where particles produced with CH4 and N2 absorb light more strongly than particles produced with a 1:1 CO2:CH4 ratio in N2. Additionally, for the portion of the visible light spectrum that they were able to obtain valid imaginary refractive indices, low k values (≤10−3) were reported.
The k value reported for the CH4/N2 haze at 405 nm is lower than the commonly applied value by Khare et al. (1984) where, using linear interpolation, at 405 nm k = 0.081. However, using lognormal interpolation Gavilan et al. (2017) reported a lower k value as well at 405 nm, where k = 0.0099. Possible reasons for differences in the observed k values include different energy sources, different initial CH4 concentrations used to make the hazes, and therefore different haze particle compositions.
To further confirm that the oxygen-containing hazes produced in this study are non-absorbing, extinction (bext, Mm−1) and scattering (bsca, Mm−1) were measured by a cavity-attenuated phase-shift spectrometer (CAPS-PMssa; Onasch et al. 2015; De Haan et al. 2017) at 450 nm for the total aerosol size distribution. The ratio of particle scattering to particle extinction describes the wavelength-dependent single-scattering albedo (ω), thus the particle's radiative impact, where ω = bsca/bext. Particles with ω < 1 are light absorbing, whereas particles with ω = 1 are non-absorbing. Figure 4 displays the single-scattering albedo calculated from the CAPS measured extinction and scattering by the CH4/N2 and CO2/CH4/N2 haze particles, with error bars reflecting the measurement reproducibility.

Figure 4. Single-scattering albedo measured by CAPS-ssa at 450 nm and calculated from the PASCaRD retrieved refractive index at 405 nm. The error bars represent the 1σ standard deviation of the reproducibility of both instrument retrievals. In both cases the particles produced with the addition of CO2 are less absorbing than the particles produced with only CH4 and N2.
Download figure:
Standard image High-resolution image
The CAPS single-scattering albedo at 450 nm rises from 0.947 ± 0.008 to 0.995 ± 0.007 when CO2 is added to the haze mixture, confirming that the particles produced without CO2 are light absorbing, whereas the particles produced with CO2 are essentially non-absorbing. Included in Figure 4 is the single-scattering albedo for the particles produced in this study at 405 nm calculated using the retrieved refractive index, mode mobility diameter, and Mie theory. Agreeing with what is observed at 450 nm, the particles produced with CO2 are non-absorbing, whereas the particles produced with only CH4 and N2 are light absorbing, and absorb more light at 405 nm than at 450 nm. This strong wavelength dependence is typical for "brown carbon" oligomerized aerosol, and is also observed by Gavilan et al. (2017). A haze that is non-absorbing would form a light-scattering layer in the atmosphere. This light-scattering haze would prevent certain wavelengths of sunlight from reaching a planet's surface. Sagan & Chyba (1997) and Wolf & Toon (2010) calculate that an Archean organic haze could act as an ultraviolet radiation shield to greenhouse gases below the haze. While these studies assume a light-absorbing haze, a light-scattering haze could act as a shield as well.
4. Conclusion
The particle effective density, particle mass loading, and complex refractive indices at 405 nm of photochemical organic hazes synthesized with CO2, CH4 and increasing amounts of O2 in N2 are reported. Large amounts of haze can form in the presence of up to 20 ppmv O2, with small amounts of haze particles still forming in the presence 200 ppmv O2. Additionally, as more oxygen is incorporated into the particles, the effective density and real refractive index increase. With the increase of oxygen in the particles, however, the imaginary refractive index decreases, resulting in non-absorbing hazes. A light-scattering haze would reduce certain wavelengths of light from reaching a planet's surface, possibly influencing its climate.
This material is based on work supported by NASA Earth and Space Science Fellowship NNX14AO32H and NSF grant AGS-1523178.