


Abstract
We present the largest publicly available catalog of interacting dwarf galaxies. It includes 177 nearby merging dwarf galaxies of stellar mass M* < 1010 M⊙ and redshifts z < 0.02. These galaxies are selected by visual inspection of publicly available archival imaging from two wide-field optical surveys (SDSS-III and the Legacy Survey), and they possess low-surface-brightness features that are likely the result of an interaction between dwarf galaxies. We list UV and optical photometric data that we use to estimate stellar masses and star formation rates. So far, the study of interacting dwarf galaxies has largely been done on an individual basis, and lacks a sufficiently large catalog to give statistics on the properties of interacting dwarf galaxies, and their role in the evolution of low-mass galaxies. We expect that this public catalog can be used as a reference sample to investigate the effects of the tidal interaction on the evolution of star formation, and the morphology/structure of dwarf galaxies. Our sample is overwhelmingly dominated by star-forming galaxies, and they are generally found significantly below the red sequence in the color–magnitude relation. The number of early-type galaxies is only 3 out of 177. We classify them, according to observed low-surface-brightness features, into various categories including shells, stellar streams, loops, antennae, or simply interacting. We find that dwarf–dwarf interactions tend to prefer the low-density environment. Only 41 out of the 177 candidate dwarf–dwarf interaction systems have giant neighbors within a sky-projected distance of 700 kpc and a line-of-sight radial velocity range ±700 km s−1, and compared to the LMC–SMC, they are generally located at much larger sky-projected distances from their nearest giant neighbors.
Export citation and abstract BibTeX RIS
1. Introduction
A plethora of observational studies now support the conclusion that mergers between galaxies are frequent phenomena. In the ΛCDM cosmology (Spergel et al. 2007), the assembly of large-scale structure happens in a hierarchical fashion, and mergers play a fundamental role in both the growth and evolution of galaxies (Conselice et al. 2009). Both observations and numerical simulations concur that massive elliptical galaxies were likely formed predominantly by the mergers of disk galaxies (Springel et al. 2005; Naab et al. 2007; Duc et al. 2011, 2015).
On the other hand, it is a common belief that the shallow potential well of low-mass galaxies causes them to be more sensitive to their surrounding environments than massive galaxies. Dwarf galaxies exhibit a strong morphological segregation: the most evolved/oldest dwarf galaxies (i.e., dwarf spheroidal (dSph) or dwarf early-type (dE)) are found exclusively in the group and cluster environments (Boselli & Gavazzi 2006; Kormendy et al. 2009; Lisker 2009). Meanwhile dwarfs with ongoing star formation activity (such as blue compact dwarf galaxies (BCDs, Papaderos et al. 1996; Gil de Paz et al. 2003) or dwarf irregulars (dIrs, Gallagher et al. 1984) are mainly found in less dense environments. Indeed, a study of the environmental dependence on the star formation activity in dwarf galaxies by Geha et al. (2012) concluded that early-type dwarf galaxies (106 < M* < 109) are extremely rare in the field. The origin of the different dwarf galaxy types and the possible evolutionary links between them are the subject of much research and debate (Lisker 2009).
The evolution of dwarf galaxies throughout the merging process has yet to be explored in detail. However, in the last few years the observational evidence for mergers between dwarf galaxies has been growing (e.g., Martínez-Delgado et al. 2012; Rich et al. 2012; Johnson 2013; Nidever et al. 2013; Amorisco et al. 2014; Crnojević et al. 2014; Paudel et al. 2017). The possibilities that certain low-mass early-type galaxies (or dEs) might also be formed through mergers, similar to massive ellipticals, has been speculated in order to explain peculiar observational properties such as kinematically decoupled cores and boxy shape isophotes (Geha et al. 2005; Graham et al. 2012; Toloba et al. 2014). If this is the case, one might expect the progenitors of some dEs to exhibit characteristic features that arise during mergers, such as tidal debris.
Much work has been done to understand the physical processes driving galaxy evolution in the mergers of massive galaxies. It has been shown by many observational and theoretical studies that during the intermediate phases of interactions, large-scale tidal interactions trigger the formation of peculiar features like shells, streams, bridges, and tails (Toomre & Toomre 1972; Eneev et al. 1973; Barnes & Hibbard 2009; Struck & Smith 2012; Duc & Renaud 2013). The presence of such structures, which is also predicted by numerical simulations, is now frequently observed in deep imaging surveys (Conselice & Gallagher 1999; Struck 1999; van Dokkum 2005; Smith et al. 2007; Tal et al. 2009; Duc et al. 2011, 2015; Kim et al. 2012).
In the low-mass regime, a detailed study of interacting systems has been exceptionally rare. This is likely because such systems are not as easy to observe as in massive systems. Part of the reason for this could perhaps be that the tidal features that are produced are not as spectacular as those in merging giant galaxies, due to the relatively weak tidal forces acting upon them. But certainly dwarf galaxies, by nature, are inherently low-surface-brightness systems and thus the tidal features emerging from them are often even more low-surface-brightness, making them challenging to detect. Only recently, with the advent of low-surface-brightness imaging techniques, and dedicated data reduction procedures, have we been able to better detect such features (Abraham & van Dokkum 2014; Duc et al. 2014; Mihos et al. 2017).
Dwarf–dwarf interactions might also be distinct from giant–giant interactions for another reason. In low-density environments, dwarfs are often much more gas-rich than giant galaxies. Furthermore, the dynamics of gas is not scalable in the same way that the dissipationless star and dark matter components are. For example, the neutral hydrogen in galaxies has a typical velocity dispersion of ∼10 km s−1. For giants, with rotation velocities of more than 100 km s−1, this internal velocity may have a minor contribution to the overall disk dynamics. However, for dwarf galaxies, a 10 km s−1 velocity dispersion can make a significant contribution to the internal dynamics. This may potentially lead to a difference in the star formation efficiency and overall evolutionary history of dwarf galaxies compared to giants.
A few detailed observational studies of some individual dwarf galaxies with merging features have been reported in recent years (Rich et al. 2012; Paudel et al. 2015; Annibali et al. 2016; Pearson et al. 2016). In our nearby vicinity, apart from the infamous interaction between the Magellanic clouds, there is also NGC 4449, an ongoing interaction between a Magellanic dwarf and its nearby dwarf companions (Putman et al. 2003; Martínez-Delgado et al. 2012; Rich et al. 2012; Besla et al. 2016) in which a small stretched stellar stream is observed at the edge of NGC 4449. The presence of a shell feature in the Fornax dwarf spheroidal has also been interpreted as a relic of a recent merger (Coleman et al. 2004; Yozin & Bekki 2012). In addition to this, Paudel et al. (2015) reported interactions between dwarf galaxies where the overall morphological appearance is similar to that of the well known giant system Arp 104. Also, there is UM 448, a merging BCD, which possesses a pronounced tidal tail that was studied in James et al. (2013).
Despite these detailed studies of a few intriguing examples, very little is known about whether these systems are representative of dwarf–dwarf interactions in general. Nevertheless, given that the majority of galaxies in the universe are dwarfs, it is clearly important to know how dwarf galaxies evolve through the merging process. Dwarf galaxies not only differ in mass from giant galaxies, but they also have higher gas mass fractions and lower star formation efficiencies. Low-mass galaxies are also typically dominated by exponential disks. How might these properties affect the interaction compared to their giant counterparts? Despite the very similar visual morphology of the UGC 6741 system to Arp 104, Paudel et al. (2015) reported a number of star-forming regions in the bridge connecting the two interacting galaxies, whereas such star formation is completely absent in Arp 104 (Gallagher & Parker 2010). Dwarf galaxies, by definition can exert lower tidal forces compared to their massive counterparts—does this result in differences in the tidal features compared to those produced by the much stronger tidal forces of giant galaxies? Antennae (NGC 4038/39), Mice (NGC 4676), Tadpole (UGC 10214), and Guitar (NGC 5291) are some spectacular examples of tidal features that we observe in the interactions between giant galaxies. In addition to this, prominent shell features (e.g., NGC 747 or NGC 7600) are also commonly observed in giant elliptical galaxies (Duc et al. 2015).
Recently, a systematic study, in the Sloan Digital Sky Survey (SDSS) database, of dwarf galaxy pairs that are likely to be interacting, was presented by Stierwalt et al. (2015), although the full catalog of 104 dwarf–dwarf pair galaxies with the names and positions of the galaxies has yet to be publicly released. They are mostly gas-rich and star-forming systems, located in low-density environments. A subset of this sample was studied in Pearson et al. (2016), where their H i morphology was analyzed. They found an extended H i morphology in their tidally interacting galaxy sample compared to non-paired analogs. In this work, we focus on the optical morphology of dwarf–dwarf galaxy interactions. For this, we first create a sample of interacting dwarf galaxies based on a visual analysis of color images from the SDSS. We have conducted a systematic search for dwarf galaxies possessing tidal features, such as stellar streams, shells, or filaments, through a careful examination of the SDSS images. Although these features could also be produced by interactions with other galaxies, in this work we try to focus on a sample of dwarf galaxies with tidal features that are likely produced by dwarf–dwarf mergers.
Rather than aiming to elaborate the detailed science of dwarf–dwarf mergers in this study, we instead seek to provide a sample of dwarf–dwarf merging systems that can later be used for more detailed science. Given the fairly good number statistics of our sample, we also attempt to understand their typical environments.
For this work, we adopt a standard cosmological model with the following parameters: H0 = 71 km s−1 Mpc−1, Ωm = 0.3, and ΩΛ = 0.7.
2. Sample Selection
2.1. Selection of Dwarf–Dwarf Interactions
Our main aim is to create a large catalog of merging dwarf galaxies. We are mostly interested in dwarf galaxies with tidal features that are likely to be produced by interacting/merging dwarf galaxies. We first search for such disrupted candidates in the large imaging database of the SDSS and the Legacy survey.5
For this, we use a visual inspection of the true color images from the SDSS-III (Aihara et al. 2011) and the Legacy survey (Blum et al. 2016). The parent sample of galaxies is drawn using a query in the NED where we select galaxies within a redshift range of z < 0.02 from the region of sky covered by the SDSS and Legacy survey. We start by selecting galaxies of magnitude Mr > −19 mag to ensure the parent sample of galaxies is predominantly composed of dwarf galaxies. However, note that this magnitude cutoff is only to select the parent sample and we apply a further stellar mass constrain to select the final sample. The stellar masses of candidate galaxies in this sample are measured from our own photometric measurements as described in Section 3. The total number of galaxies in this redshift range is ≈20,000.
We then extract a cutout color image from the SDSS sky-server and Legacy survey. As our prime goal is to find tidal debris around the dwarf galaxies, we first collect a sample of dwarf galaxies with observed tidal debris, without considering the origin of the debris at this stage. As might be expected, the majority of the tidal features are created by interactions with their neighboring giant galaxies. This large sample of disrupted galaxies or galaxies that exhibit tidal debris contains more than 700 candidates. However, for this particular work, we focus on dwarf–dwarf interactions. Another comprehensive catalog of tidally interacting dwarf galaxies with nearby giant galaxies, similar to those studied in Paudel et al. (2014), will be published later (S. Paudel et al. 2018, in preparation).
Our visual inspection process involves multiple steps. First, we look for any signature of tidal features in the true color images. If a hint is found, we then re-examine the coadded fits file of the multiple bands available in the archive. The coaddition provides higher signal-to-noise (S/N) than the single-band images. Additionally, we also search for the availability of deeper images in various publicly available archives. In this regard, the archival images of the CHFT6 were very helpful for visual confirmation of the presence of low-surface-brightness features around dwarf galaxies. From the CHFT archive, we use the Megapipe stack7 produced by The Elixir System (Gwyn 2008). Megapipe stack images are pipeline-reduced images of CHFT MegaCam observations.
Finally, we classify the dwarf galaxies with tidal features into two broad categories; dwarf–dwarf interaction/mergers and dwarf-giant interactions. We show examples of these two classes in Figure 1. The first row shows images of the tidal distortion of dwarf galaxies by nearby giant galaxies and the second row shows examples of merging dwarf galaxies. It is not always trivial to determine if the observed tidal features were created by merging dwarf galaxies, except when the interacting pairs have not completely merged yet—like, for example, in the Antennae-like dwarf galaxies (see the lower left panel of Figure 1) or simply interacting pairs (see the lower middle panel of Figure 1). However, because of our past experiences, we often suspect a particular origin according to the appearance of the observed low-surface-brightness tidal features. For example, we have shown that shell features about dwarf galaxies are reliably produced by mergers (Paudel et al. 2017). Meanwhile, an S-shaped elongated stellar envelope is likely to be produced by tidal stretching from a nearby giant galaxy (Paudel et al. 2013; Paudel & Ree 2014). These selection criteria are indeed subjective. But we are keen to avoid including dwarfs that are interacting with a giant galaxy in this catalog. This may create a bias against merged dwarfs near giants; see the discussion in Section 6.
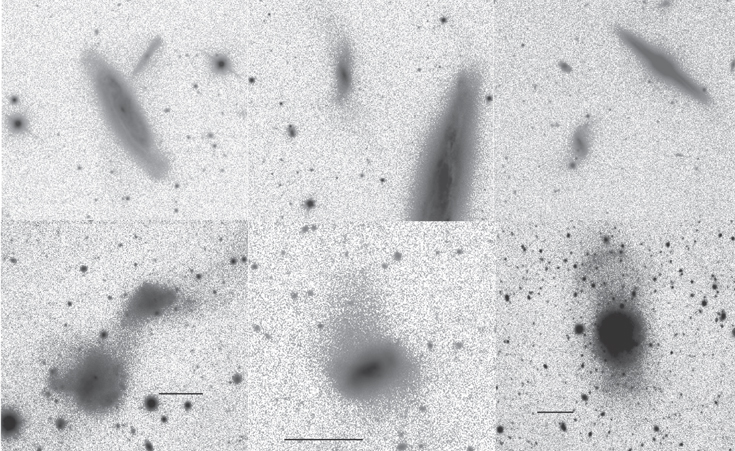
Figure 1. Representative examples of dwarf galaxies with tidal features. Top: examples where we conclude a dwarf galaxy is interacting with and being deformed by the tidal field of a nearby giant galaxy and they have been excluded from the catalog. Bottom: examples of dwarfs that we classify as having interacted with another dwarf, categorized into three different types of tidal features (i.e., from left to right; interacting, tidal tail, and shell features). For all images, the black horizontal bar represents a scale of 30''.
Download figure:
Standard image High-resolution image2.2. Sample Classification
The final sample consists of 177 systems with a limit in the combined stellar mass of the system of <1010 M⊙. We further classify these objects according to the morphologies of their tidal features, mainly grouping them into three categories: interacting, shell, and tidal tail features. In addition to this, in some cases, we further sub-classify them according to the details of their observed low-surface-brightness features; see below.
- 1.Interacting (I): in this class, we identify ongoing interactions between two dwarf galaxies. If the two interacting dwarf galaxies are visibly distinct, we simply designate them with an "I" (e.g., Id0217-0742), and if they are overlapping, or the progenitor galaxies are not distinct, we also give them an "M" (Merged, e.g., Id01250759). Additionally, if we see a bridge connecting the interacting galaxies we add "B" (for bridge, e.g., Id01482838). A dwarf analog of the famous Antennae system (NGC 4038/NGC 4039) is represented by "A" (for Antennae e.g., Id0202-0922).
- 2.Shell (Sh): the presence of shell features can be seen e.g., Id0155-0011.
- 3.Tidal tail (T): simply defined as the presence of amorphous tidal features, mostly tidal streams or plumes, which cannot be placed into the above classifications, e.g., Id08092137. We note that the majority of tidal tails are relatively redder than their galaxies' main bodies (likely a distinct stellar population). Thus, they might better be described as stellar streams, in which case we add an "S," e.g., Id0222-0830. Also, if we see a loop of a stellar stream around the galaxies, we identify this with an "L," e.g., Id09530702.
We show various examples of these classifications in Figure 2. It is worth noting that the above classification scheme is not mutually exclusive, and in a number of cases there are overlaps. For example, some interacting galaxies also posses multiple tidal features, like shells or stellar streams, even when the two parent dwarf galaxies are not yet fully merged. Id11253803 is the best example of this scenario. We show an example of these different morphological classes of merging dwarf galaxies in Figure 2.
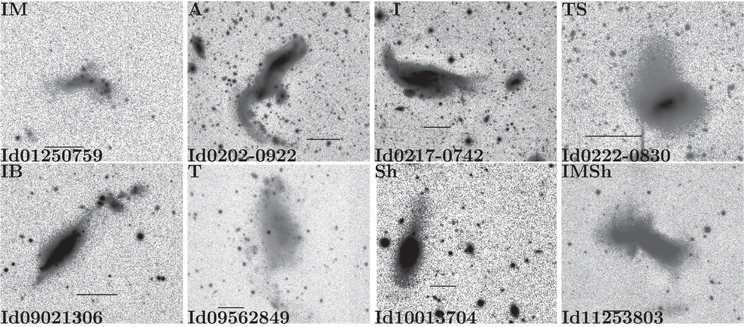
Figure 2. Representative examples of the different morphological classes by which we categorize our merging dwarf galaxies. The field of view and color stretching are arbitrarily chosen to make the best view of both interacting galaxies and low-surface brightness features. An image scale of 30'' is shown by the black horizontal bar. See Section 2.2 for further details. The complete list of images is shown in Figure 12.
Download figure:
Standard image High-resolution image3. Data Analysis
To perform the photometric analysis and measure the total luminosity, we exclusively use the SDSS image data, unless explicitly mentioned otherwise. This is because the SDSS provides the best homogeneous imaging data. We retrieved archival images from the SDSS-III database (Abazajian et al. 2009). Since the SDSS data archive provides well calibrated and sky-background subtracted images, no further effort has been made in this regard. We derive the g and r-band magnitudes. To do this, we measure the total flux using a large aperture that covers both interacting galaxies and the stellar streams around them. While doing so, unrelated background and foreground objects were masked manually. This procedure is quite straightforward if the interacting galaxies are not well separated or already merged. In the case of interacting systems, when the galaxies involved are well separated (class I), the apertures are chosen in two different ways. First, a large aperture covering both the interacting galaxies is used to measure the total flux of the system, as done for the other classes. Additionally, we also use smaller apertures to measure the flux of the individual galaxies. However, we emphasize that we only use the aperture photometry of the individual interacting galaxies to calculate their mass ratios. For the rest of the physical parameters that we present in this work, values are given for the total system (e.g., magnitudes, g − r colors, stellar masses, and star formation rates (SFRs)).
There are only six candidate galaxies that are located outside of the region of sky covered by SDSS. In these cases, we use images from the Legacy survey. For the aperture photometry, procedures similar to those applied for the SDSS images are used.
For many galaxies (146 out of 177), we found there were GALEX all-sky survey observations available (Martin et al. 2005). Since they are mostly star-forming, almost all are detected in FUV-band and NUV-band GALEX all-sky survey images. In these cases, we perform aperture photometry on the GALEX image, following the same procedure we used for the optical images. However, we only calculate the total UV flux of the systems, and not that for the individual galaxies, because the GALEX images have a spatial resolution of only 5'' and the individual galaxies are not well resolved.
The distances to the galaxies are taken from NED. For those where NED does not provide a redshift-independent distance, we calculate it based on Hubble flow, assuming the cosmological parameters defined in Section 1. We use the python code, cosmocalc, available in astropy, to calculate cosmological distances based on the radial velocities. The radial velocities are not corrected for Virgo-centric flow.
The derived magnitudes were corrected for the Galactic extinction using Schlafly & Finkbeiner (2011), but not for internal extinction. The SFRs are derived from the FUV fluxes applying a foreground Galactic extinction correction (AFUV =7.9 × E(B− V) Lee et al. 2009). We use the equation (SFR(M⊙ yr−1) = 1.4 × 10⁻²⁸ Lν(UV)(erg s−1 Hz−1) Kennicutt 1998). The stellar masses were derived from the SDSS−r band magnitude with a mass-to-light ratio tabulated by Bell et al. (2003) as appropriate to the observed g − r color.
4. Results
Our morphological classification reveals that there are 98 interacting dwarf galaxy systems. Among these, 22 are classified as "Interacting Merger" (IM), where the boundary between the interacting galaxies can no longer be clearly identified. Some 30 possess shell features and the rest (49) show tidal tails of different forms. The shell features are mainly found outside of the main body of the galaxies. Some of these resemble the dwarfs with the symmetrical-shaped shell features that were found in Paudel et al. (2017) (e.g., Id09381942, Id10354614, Id12464814). In Paudel et al. (2017), we studied three dwarf galaxies and, with help of idealized numerical simulation, found that they had suffered a very recent (in last few hundred Myr), near equal mass mergers that explained their symmetry. However, in some cases, the shell dwarfs do not show such symmetry in their shells (e.g., Id11253803) and in two we find that shell and tidal tails features coexist with each other (Id11253803 and Id11292034). In these cases, the shells have a generally higher surface brightness than the tidal tails.
There are three dwarf galaxy systems (Id0202-0922, Id1448-0342, Id14503534) that can be considered dwarf analogs to the Antennae system (NGC 4038/4039).
We present the result of aperture photometry in Table 1. We list the positions (R.A. and decl.) and redshifts of candidate dwarf galaxies in columns 2, 3, and 4, respectively. Optical g-band and r-band magnitudes are listed in columns 5 and 6, respectively. Next we list FUV-band and NUV-band magnitudes in columns 7 and 8, respectively. The classifications of morphological features are given in column 9.
Table 1. Physical Properties of Merging Dwarf Galaxies
| No. | ID | R.A. | Decl. | z | mg | mr | mFUV | mNUV | Feature | Galaxy |
|---|---|---|---|---|---|---|---|---|---|---|
| (deg) | (deg) | (mag) | (mag) | (mag) | (mag) | Name | ||||
| 001 | Id01130052 | 018.4138 | 00.8741 | 0.0039 | 15.87 | 15.76 | 16.79 | 16.96 | I | UGC 00772 |
| 002 | Id01250759 | 021.3957 | 07.9908 | 0.0097 | 15.18 | 15.14 | 15.89 | 15.89 | IM | UGC 00993 |
| 003 | Id01482838 | 027.1545 | 28.6427 | 0.0125 | 15.78 | 15.35 | 17.28 | 16.64 | IB | ⋯ |
| 004 | Id0155-0011 | 028.9989 | −0.1855 | 0.0121 | 16.47 | 16.01 | 17.76 | 16.55 | Sh | ⋯ |
| 005 | Id0202-0922 | 030.6615 | −9.3703 | 0.0180 | 15.43 | 15.13 | 17.38 | 17.18 | A | PGC 007782 |
| 006 | Id02032202 | 030.8279 | 22.0441 | 0.0088 | 13.86 | 13.55 | 14.15 | 14.64 | IM | UGC 01547 |
| 007 | Id0210-0124 | 032.5408 | −1.4013 | 0.0119 | 15.03 | 14.83 | 15.63 | 16.18 | E | KUG 0207-016A |
| 008 | Id0217-0742 | 034.3948 | −7.7040 | 0.0160 | 14.76 | 14.45 | 15.68 | 16.18 | I | PGC 008757 |
| 009 | Id0221-0928 | 035.4799 | −9.4766 | 0.0123 | 16.01 | 15.81 | 17.20 | 16.64 | I | ⋯ |
| 010 | Id0222-0830 | 035.5498 | −8.5101 | 0.0156 | 15.25 | 14.90 | 17.15 | 17.04 | TS | ⋯ |
| 011 | Id0227-0837 | 036.9460 | −8.6261 | 0.0167 | 16.41 | 16.09 | 17.03 | 17.70 | TS | ⋯ |
| 012 | Id02430338 | 40.82292 | 3.64472 | 0.0140 | 15.08 | 14.94 | ⋯ | ⋯ | I | PGC 010297 |
| 013 | Id07183123 | 109.6395 | 31.3866 | 0.0114 | 14.41 | 14.02 | ⋯ | ⋯ | I | ⋯ |
| 014 | Id07551505 | 118.8437 | 15.0938 | 0.0154 | 14.77 | 14.50 | 16.37 | 15.71 | IM | PGC 022184 |
| 015 | Id08012517 | 120.3283 | 25.2899 | 0.0155 | 15.40 | 15.18 | ⋯ | ⋯ | I | PGC 022495 |
| 016 | Id08092137 | 122.4474 | 21.6215 | 0.0111 | 15.98 | 15.75 | 16.42 | 15.34 | T | ⋯ |
| 017 | Id08114627 | 122.7846 | 46.4656 | 0.0074 | 13.87 | 13.69 | ⋯ | 14.63 | I | PGC 022955 |
| 018 | Id08213419 | 125.4696 | 34.3272 | 0.0077 | 16.49 | 16.31 | ⋯ | ⋯ | I | ⋯ |
| 019 | Id08291427 | 127.3861 | 14.4518 | 0.0197 | 16.02 | 15.72 | 16.86 | 16.42 | I | ⋯ |
| 020 | Id08331920 | 128.3229 | 19.3466 | 0.0193 | 14.97 | 14.68 | 16.54 | 16.00 | IM | ⋯ |
| 021 | Id08332932 | 128.3457 | 29.5386 | 0.0069 | 13.06 | 12.73 | 14.64 | 14.35 | I | ⋯ |
| 022 | Id08350340 | 128.8927 | 03.6717 | 0.0131 | 16.96 | 16.71 | ⋯ | ⋯ | T | ⋯ |
| 023 | Id08360509 | 129.1278 | 05.1659 | 0.0135 | 15.56 | 15.40 | 16.68 | 15.94 | I | ⋯ |
| 024 | Id0851-0221 | 132.9080 | −2.3660 | 0.0109 | 13.62 | 13.38 | 14.86 | 15.28 | I | UGC 04638 |
| 025 | Id08580619 | 134.6239 | 06.3213 | 0.0119 | 15.51 | 15.14 | 16.70 | 16.23 | IB | UGC 04703 |
| 026 | Id09003543 | 135.0654 | 35.7276 | 0.0101 | 13.47 | 13.26 | 15.04 | 14.71 | I | NGC 2719 |
| 027 | Id09002536 | 135.0999 | 25.6147 | 0.0060 | 14.24 | 14.14 | 15.82 | 15.49 | T | ⋯ |
| 028 | Id09021306 | 135.6726 | 13.1077 | 0.0164 | 14.78 | 14.48 | 16.55 | 16.00 | IB | PGC 025403 |
| 029 | Id09114239 | 137.7848 | 42.6562 | 0.0060 | 15.56 | 15.31 | 16.39 | 15.37 | I | ⋯ |
| 030 | Id09164259 | 139.1047 | 42.9916 | 0.0085 | 14.77 | 14.57 | ⋯ | ⋯ | I | PGC 026162 |
| 031 | Id09165946 | 139.1834 | 59.7746 | 0.0137 | 14.88 | 14.60 | 16.10 | 15.93 | I | MRK 0019 |
| 032 | Id09201920 | 140.1685 | 19.3374 | 0.0139 | 15.96 | 15.70 | 17.09 | 16.58 | I | ⋯ |
| 033 | Id09296627 | 142.2739 | 66.4579 | 0.0115 | 14.97 | 14.75 | 16.37 | 16.03 | I | UGC 05042 |
| 034 | Id09306026 | 142.5268 | 60.4481 | 0.0136 | 15.21 | 15.07 | 16.02 | 15.74 | I | ⋯ |
| 035 | Id09333336 | 143.4291 | 33.6002 | 0.0052 | 15.32 | 14.98 | 16.77 | 16.83 | Sh | KUG 0930+338 |
| 036 | Id09381942 | 144.5608 | 19.7111 | 0.0144 | 17.19 | 16.99 | ⋯ | ⋯ | Sh | ⋯ |
| 037 | Id09420929 | 145.7212 | 9.49164 | 0.0107 | 14.26 | 14.13 | 15.31 | 15.07 | I | UGC 05189 |
| 038 | Id0944-0039 | 146.0300 | −0.6598 | 0.0041 | 14.85 | 14.65 | 16.09 | 15.62 | I | UGC 05205 |
| 039 | Id09494402 | 147.2779 | 44.0477 | 0.0156 | 15.88 | 15.76 | 16.68 | 15.97 | I | ⋯ |
| 040 | Id09514419 | 147.9137 | 44.3190 | 0.0150 | 16.18 | 15.99 | 17.03 | 16.79 | I | ⋯ |
| 041 | Id09516853 | 147.9874 | 68.8841 | 0.0146 | 16.93 | 16.49 | 19.10 | 19.40 | I | ⋯ |
| 042 | Id09530702 | 148.4811 | 07.0465 | 0.0174 | 16.23 | 15.98 | 17.79 | 17.85 | L | ⋯ |
| 043 | Id09550823 | 148.8737 | 8.39062 | 0.0041 | 14.77 | 14.38 | 16.33 | 15.49 | Sh | UGCA 188 |
| 044 | Id09562849 | 149.1918 | 28.8288 | 0.0015 | 14.38 | 14.33 | 15.56 | 15.49 | T | ⋯ |
| 045 | Id10004531 | 150.0195 | 45.5198 | 0.0056 | 16.50 | 16.35 | ⋯ | ⋯ | I | KUG 0956+457 |
| 046 | Id10004311 | 150.0242 | 43.1919 | 0.0056 | 15.31 | 15.02 | ⋯ | ⋯ | Sh | ⋯ |
| 047 | Id10013704 | 150.3099 | 37.0709 | 0.0048 | 15.33 | 15.19 | 16.71 | 16.10 | Sh | PGC 029004 |
| 048 | Id1007-0631 | 151.8945 | −6.5232 | 0.0158 | 15.31 | 14.99 | 16.30 | 16.76 | IM | ⋯ |
| 049 | Id10080227 | 152.0430 | 02.4634 | 0.0068 | 14.96 | 14.24 | 17.93 | 16.82 | E | PGC 029471 |
| 050 | Id10100509 | 152.6575 | 05.1502 | 0.0137 | 14.85 | 14.48 | 16.38 | 17.18 | S | CGCG 036-048 |
| 051 | Id10170419 | 154.2989 | 04.3312 | 0.0045 | 15.63 | 15.35 | 17.40 | 17.22 | IB | UGC 05551 |
| 052 | Id10174308 | 154.3874 | 43.1448 | 0.0037 | 16.14 | 15.80 | ⋯ | ⋯ | Sh | KUG 1014+433 |
| 053 | Id10192117 | 154.7562 | 21.2836 | 0.0036 | 14.56 | 14.34 | 16.21 | 15.94 | TS | PGC 030133 |
| 054 | Id10251708 | 156.2691 | 17.1494 | 0.0025 | 11.54 | 11.30 | 12.29 | 12.87 | TS | NGC 3239 |
| 055 | Id10291610 | 157.4553 | 16.1809 | 0.0108 | 15.12 | 14.89 | 16.96 | 17.18 | SL | MRK 0631 |
| 056 | Id1034-0221 | 158.5039 | −2.3663 | 0.0067 | 15.15 | 15.13 | 15.63 | 15.95 | T | PGC 031246 |
| 057 | Id10345046 | 158.6911 | 50.7683 | 0.0020 | 14.14 | 13.78 | 15.53 | ⋯ | I | UGC 05740 |
| 058 | Id10354614 | 158.8002 | 46.2367 | 0.0016 | 16.68 | 16.41 | 18.44 | 17.51 | Sh | ⋯ |
| 059 | Id10531646 | 163.3549 | 16.7711 | 0.0035 | 12.58 | 12.33 | 13.69 | 14.18 | I | PGC 032694 |
| 060 | Id10535707 | 163.4561 | 57.1186 | 0.0064 | 13.75 | 13.45 | 15.46 | 14.77 | T | NGC 3440 |
| 061 | Id10545418 | 163.6635 | 54.3052 | 0.0045 | 11.99 | 11.63 | 13.94 | 13.30 | I | NGC 3448 |
| 062 | Id11011636 | 165.4623 | 16.6069 | 0.0098 | 14.27 | 13.94 | 16.26 | 15.72 | F | UGC 06104 |
| 063 | Id1109-0258 | 167.4654 | −2.9778 | 0.0172 | 15.19 | 14.89 | 17.05 | 17.64 | I | CGCG 011-014 |
| 064 | Id11132131 | 168.4562 | 21.5205 | 0.0048 | 14.66 | 14.26 | ⋯ | ⋯ | I | UGC 06258 |
| 065 | Id11200231 | 170.0612 | 2.52246 | 0.0054 | 13.48 | 13.21 | 14.98 | 14.42 | I | ⋯ |
| 066 | Id11221319 | 170.6666 | 13.3305 | 0.0137 | 15.13 | 14.88 | 16.27 | 15.59 | I | IC 2776 |
| 067 | Id11253803 | 171.3825 | 38.0605 | 0.0070 | 14.24 | 14.01 | 15.79 | 15.70 | IMSh | UGC 06433 |
| 068 | Id1125-0039 | 171.4670 | −0.6615 | 0.0187 | 16.44 | 16.17 | 17.76 | 17.20 | I | SHOC 324 |
| 069 | Id11292034 | 172.3137 | 20.5831 | 0.0047 | 14.02 | 13.72 | 15.70 | 15.53 | IMSh | IC 0700 |
| 070 | Id11350233 | 173.7706 | 02.5513 | 0.0174 | 15.05 | 14.81 | 16.70 | 16.46 | T | UGC 06558 |
| 071 | Id11351601 | 173.9550 | 16.0266 | 0.0172 | 16.89 | 16.62 | ⋯ | ⋯ | IB | ⋯ |
| 072 | Id11401924 | 175.1175 | 19.4097 | 0.0113 | 15.26 | 14.84 | ⋯ | ⋯ | Sh | KUG 1137+196 |
| 073 | Id11414623 | 175.3414 | 46.3932 | 0.0024 | 15.09 | 14.74 | 17.30 | 16.63 | E | PGC 036272 |
| 074 | Id11412457 | 175.3545 | 24.9516 | 0.0113 | 15.26 | 14.83 | 16.84 | 17.66 | TE | KUG 1138+252 |
| 075 | Id11451711 | 176.4793 | 17.1923 | 0.0110 | 15.82 | 15.71 | 17.54 | 17.41 | I | UGC 06741 |
| 076 | Id1148-0138 | 177.0757 | −1.6399 | 0.0130 | 15.88 | 15.66 | 16.94 | 16.92 | Sh | UM 454 |
| 077 | Id11501501 | 177.5113 | 15.0231 | 0.0024 | 14.81 | 14.72 | ⋯ | ⋯ | Sh | MRK 0750 |
| 078 | Id11502557 | 177.5840 | 25.9618 | 0.0125 | 13.90 | 13.57 | 15.89 | 15.40 | I | UGC 06806 |
| 079 | Id1152-0228 | 178.1549 | −2.4694 | 0.0034 | 14.18 | 14.10 | 15.13 | ⋯ | E | UGC 06850 |
| 080 | Id11563207 | 179.1355 | 32.1303 | 0.0102 | 15.89 | 15.82 | 16.79 | 16.51 | I | ⋯ |
| 081 | Id12002453 | 180.0115 | 24.8892 | 0.0112 | 16.86 | 16.53 | 18.22 | 17.29 | E | ⋯ |
| 082 | Id12032526 | 180.9725 | 25.4352 | 0.0107 | 14.00 | 13.72 | 14.82 | 15.25 | IM | UGC 07040 |
| 083 | Id12065858 | 181.5600 | 58.9711 | 0.0108 | 15.36 | 15.26 | 16.47 | 16.11 | I | PGC 038384 |
| 084 | Id12111929 | 182.9358 | 19.4906 | 0.0116 | 15.03 | 14.62 | ⋯ | ⋯ | T | PGC 038842 |
| 085 | Id12131705 | 183.2770 | 17.0988 | 0.0143 | 15.53 | 15.20 | 17.18 | 16.63 | TS | MRK 0762 |
| 086 | Id12242109 | 186.0920 | 21.1569 | 0.0031 | 14.81 | 14.36 | 16.69 | 17.49 | Sh | UGC 07485 |
| 087 | Id12241323 | 186.1191 | 13.3858 | 0.0199 | 16.47 | 16.28 | 17.64 | 16.87 | I | VIII Zw 186 |
| 088 | Id12250548 | 186.4687 | 05.8095 | 0.0050 | 14.83 | 14.54 | 16.63 | 16.18 | Sh | VCC 0848 |
| 089 | Id12284405 | 187.0463 | 44.0935 | 0.0006 | 9.24 | 9.55 | 10.86 | 10.81 | I | NGC 4449 |
| 090 | Id12304138 | 187.6515 | 41.6436 | 0.0018 | 9.68 | 9.35 | 12.00 | 11.44 | I | NGC 4490 |
| 091 | Id12324937 | 188.0033 | 49.6303 | 0.0145 | 15.11 | 14.89 | 16.65 | 16.25 | IM | PGC 041500 |
| 092 | Id12383805 | 189.7371 | 38.0902 | 0.0074 | 15.24 | 15.00 | 16.42 | 16.07 | I | UGC 07816 |
| 093 | Id1239-0348 | 189.8345 | −3.8083 | 0.0084 | 15.12 | 14.90 | 16.46 | 15.93 | IB | PGC 042338 |
| 094 | Id12394526 | 189.9053 | 45.4392 | 0.0125 | 15.85 | 15.48 | 16.94 | 16.52 | I | ⋯ |
| 095 | Id1241-0007 | 190.4004 | −0.1216 | 0.0158 | 15.45 | 15.07 | 16.40 | 17.25 | T | UM 512 |
| 096 | Id12444500 | 191.0289 | 45.0050 | 0.0123 | 14.37 | 14.19 | 15.78 | 15.45 | IB | PGC 042874 |
| 097 | Id12464814 | 191.5972 | 48.2352 | 0.0030 | 15.17 | 14.94 | 16.43 | 16.20 | Sh | UGCA 297 |
| 098 | Id12474709 | 191.8241 | 47.1616 | 0.0196 | 15.58 | 15.07 | 18.04 | 17.19 | TE | MRK 0225 |
| 099 | Id1249-0434 | 192.4243 | −4.5797 | 0.0047 | 13.84 | 13.64 | 14.77 | 15.10 | E | NGC 4678 |
| 100 | Id12530427 | 193.3083 | 04.4650 | 0.0024 | 12.92 | 12.62 | 14.19 | 14.61 | Sh | NGC 4765 |
| 101 | Id12540239 | 193.7166 | 02.6527 | 0.0031 | 13.30 | 13.11 | 14.14 | 14.38 | I | NGC 4809/ARP 2 |
| 102 | Id12561630 | 194.2144 | 16.5067 | 0.0041 | 15.72 | 15.09 | ⋯ | ⋯ | TE | ⋯ |
| 103 | Id1258-0423 | 194.6983 | −4.3861 | 0.0047 | 16.36 | 16.00 | 16.86 | 17.54 | T | ⋯ |
| 104 | Id13161232 | 199.2180 | 12.5482 | 0.0032 | 13.85 | 13.55 | 15.43 | 15.07 | Sh | NGC 5058 |
| 105 | Id13193015 | 199.9133 | 30.2566 | 0.0071 | 13.41 | 13.03 | 15.92 | 15.38 | T | NGC 5089 |
| 106 | Id1328-0202 | 202.1943 | −2.0380 | 0.0123 | 14.29 | 13.91 | 15.45 | 15.87 | TS | PGC 047278 |
| 107 | Id13303119 | 202.5723 | 31.3327 | 0.0161 | 14.46 | 14.29 | 15.82 | 15.47 | IM | UGC 08496 |
| 108 | Id13335449 | 203.2852 | 54.8275 | 0.0176 | 15.49 | 15.19 | ⋯ | ⋯ | E | PGC 047713 |
| 109 | Id13343125 | 203.5622 | 31.4250 | 0.0166 | 14.97 | 14.77 | 16.27 | 15.89 | I | UGC 08548 |
| 110 | Id13425241 | 205.7475 | 52.6883 | 0.0059 | 16.18 | 15.87 | ⋯ | ⋯ | I | MRK 1481 |
| 111 | Id13433644 | 205.8047 | 36.7493 | 0.0197 | 15.64 | 15.28 | 16.75 | 15.84 | TS | ⋯ |
| 112 | Id13434311 | 205.8624 | 43.1885 | 0.0083 | 16.18 | 15.98 | 17.82 | 17.17 | Sh | ⋯ |
| 113 | Id13493743 | 207.4594 | 37.7306 | 0.0081 | 16.01 | 15.70 | 17.09 | 17.36 | IB | ⋯ |
| 114 | Id13516422 | 207.9732 | 64.3728 | 0.0058 | 15.11 | 14.93 | 16.27 | 15.88 | IM | PGC 049221 |
| 115 | Id1355-0600 | 208.9394 | −6.0028 | 0.0066 | 14.48 | 14.21 | 15.25 | 15.68 | I | PGC 049521 |
| 116 | Id1356-0441 | 209.1966 | −4.6923 | 0.0098 | 16.99 | 16.81 | 17.00 | 17.78 | T | ⋯ |
| 117 | Id13563656 | 209.2236 | 36.9454 | 0.0197 | 17.59 | 17.45 | 17.07 | 16.06 | I | ⋯ |
| 118 | Id14005514 | 210.1351 | 55.2460 | 0.0127 | 16.04 | 15.91 | 16.83 | 16.59 | I | ⋯ |
| 119 | Id14010759 | 210.4178 | 07.9979 | 0.0179 | 16.93 | 16.59 | 18.53 | 17.48 | I | ⋯ |
| 120 | Id14041243 | 211.2216 | 12.7288 | 0.0136 | 13.81 | 13.60 | 14.20 | 14.35 | I | UGC 09002 |
| 121 | Id1410-0234 | 212.5531 | −2.5744 | 0.0051 | 13.44 | 13.15 | 15.34 | 15.18 | IM | UGC 09057 |
| 122 | Id14182530 | 214.6066 | 25.5018 | 0.0149 | 15.25 | 14.92 | ⋯ | ⋯ | LS | PGC 051103 |
| 123 | Id14182149 | 214.6805 | 21.8175 | 0.0085 | 14.66 | 14.71 | 15.79 | 15.53 | IM | PGC 051120 |
| 124 | Id1421-0345 | 215.3427 | −3.7588 | 0.0091 | 14.44 | 14.24 | ⋯ | 15.59 | LS | PGC 051291 |
| 125 | Id14294426 | 217.4622 | 44.4476 | 0.0092 | 14.46 | 14.24 | 16.37 | 16.00 | IM | PGC 051798 |
| 126 | Id14312714 | 217.7876 | 27.2373 | 0.0150 | 14.41 | 14.26 | ⋯ | ⋯ | I | MRK 0685 |
| 127 | Id14362827 | 219.0358 | 28.4505 | 0.0063 | 15.43 | 15.14 | 16.75 | 16.43 | Sh | HARO 43 |
| 128 | Id14365127 | 219.1908 | 51.4597 | 0.0078 | 15.56 | 15.13 | 17.38 | 16.87 | E | PGC 052226 |
| 129 | Id14392323 | 219.9387 | 23.3965 | 0.0150 | 15.73 | 15.60 | 17.38 | 16.74 | I | UGC 09450 |
| 130 | Id14453124 | 221.3852 | 31.4155 | 0.0049 | 14.65 | 14.56 | 15.38 | 14.97 | I | UGC 09506 |
| 131 | Id1448-0342 | 222.2000 | −3.7163 | 0.0031 | 14.24 | 13.98 | 14.96 | 15.26 | I | PGC 052893 |
| 132 | Id14493623 | 222.4531 | 36.3965 | 0.0062 | 16.33 | 16.22 | 17.16 | 16.90 | I | ⋯ |
| 133 | Id14503534 | 222.7356 | 35.5721 | 0.0039 | 14.41 | 14.29 | 15.12 | 15.00 | I | UGC 09560 |
| 134 | Id14543012 | 223.5488 | 30.2095 | 0.0094 | 14.72 | 14.60 | 15.87 | 15.65 | A | UGC 09588 |
| 135 | Id14572640 | 224.4108 | 26.6683 | 0.0042 | 15.41 | 15.15 | 16.88 | 17.21 | S | ⋯ |
| 136 | Id15052341 | 226.3632 | 23.6883 | 0.0162 | 15.35 | 15.09 | 17.45 | 16.81 | A | UGC 09698 |
| 137 | Id1507-0239 | 226.7837 | −2.6627 | 0.0068 | 16.21 | 15.96 | 17.33 | 17.27 | I | ⋯ |
| 138 | Id15075511 | 226.9514 | 55.1857 | 0.0111 | 13.99 | 13.63 | 21.70 | 19.67 | Sh | UGC 09737 |
| 139 | Id15091950 | 227.3164 | 19.8486 | 0.0158 | 16.99 | 16.58 | 18.42 | 17.69 | I | ⋯ |
| 140 | Id15174257 | 229.3553 | 42.9559 | 0.0178 | 15.60 | 15.23 | 17.15 | 16.65 | IM | PGC 054571 |
| 141 | Id15182205 | 229.6666 | 22.0863 | 0.0158 | 15.50 | 15.11 | 17.09 | 17.47 | T | PGC 054647 |
| 142 | Id15271117 | 231.8578 | 11.2842 | 0.0129 | 16.14 | 15.75 | ⋯ | ⋯ | TS | ⋯ |
| 143 | Id15271258 | 231.9358 | 12.9708 | 0.0128 | 18.63 | 18.40 | 17.74 | 18.54 | I | ⋯ |
| 144 | Id15292600 | 232.3709 | 26.0075 | 0.0067 | 14.97 | 14.86 | ⋯ | ⋯ | I | ⋯ |
| 145 | Id15354648 | 233.7504 | 46.8146 | 0.0188 | 15.58 | 15.39 | ⋯ | 16.54 | T | I Zw 116 |
| 146 | Id15353840 | 233.9737 | 38.6777 | 0.0186 | 14.14 | 13.95 | 15.96 | 15.53 | I | ⋯ |
| 147 | Id15363040 | 234.0806 | 30.6811 | 0.0058 | 14.84 | 14.59 | ⋯ | ⋯ | I | PGC 055576 |
| 148 | Id15480414 | 237.0172 | 04.2423 | 0.0131 | 16.73 | 16.47 | ⋯ | ⋯ | T | ⋯ |
| 149 | Id15511001 | 237.7562 | 10.0311 | 0.0146 | 15.88 | 15.62 | 16.28 | 17.02 | T | CGCG 078-083 |
| 150 | Id15541637 | 238.6718 | 16.6173 | 0.0079 | 14.57 | 14.14 | ⋯ | ⋯ | I | UGC 10086 |
| 151 | Id16055045 | 241.4178 | 50.7544 | 0.0128 | 15.66 | 15.51 | 16.97 | 16.49 | I | ⋯ |
| 152 | Id16054119 | 241.4459 | 41.3182 | 0.0066 | 13.14 | 12.94 | 14.60 | 14.29 | I | UGC 10200 |
| 153 | Id16060634 | 241.6708 | 06.5808 | 0.0058 | 14.69 | 14.33 | 16.10 | 15.57 | Sh | PGC 057169 |
| 154 | Id16212838 | 245.3675 | 28.6399 | 0.0029 | 14.40 | 14.05 | 16.01 | 16.31 | Sh | UGC 10351 |
| 155 | Id16274825 | 246.9728 | 48.4248 | 0.0134 | 16.47 | 16.19 | 17.95 | 17.29 | Sh | ⋯ |
| 156 | Id16312024 | 247.9531 | 20.4107 | 0.0171 | 14.54 | 14.36 | 15.97 | 15.44 | Sh | MRK 0884 |
| 157 | Id14503534 | 249.5121 | 26.4527 | 0.0144 | 15.41 | 15.36 | 16.44 | 16.07 | E | ⋯ |
| 158 | Id16472105 | 251.7956 | 21.0952 | 0.0090 | 15.42 | 15.35 | ⋯ | ⋯ | IM | ⋯ |
| 159 | Id17135919 | 258.2862 | 59.3277 | 0.0036 | 13.98 | 13.76 | 15.00 | 14.72 | IM | UGC10770 |
| 160 | Id2119-0733 | 319.9287 | −7.5523 | 0.0090 | 14.11 | 13.86 | 15.87 | 15.59 | I | PGC 066559 |
| 161 | Id21421518 | 325.6345 | 15.3000 | 0.0122 | 15.38 | 15.15 | 15.85 | 16.28 | T | AGC 748645 |
| 162 | Id22021945 | 330.6332 | 19.7501 | 0.0054 | 13.54 | 13.21 | 15.28 | 14.81 | IM | IC 1420 |
| 163 | Id22080441 | 332.0383 | 4.69000 | 0.0135 | 14.18 | 13.98 | 15.94 | 15.26 | I | PGC 068112 |
| 164 | Id22162255 | 334.0320 | 22.9333 | 0.0128 | 14.76 | 14.46 | 15.79 | 16.32 | Sh | KUG 2213+226 |
| 165 | Id22271205 | 336.8610 | 12.0944 | 0.0118 | 15.98 | 15.65 | 17.30 | 17.65 | Sh | ⋯ |
| 166 | Id22391352 | 339.8411 | 13.8822 | 0.0173 | 15.08 | 14.81 | 16.77 | 16.22 | Sh | ⋯ |
| 167 | Id23021636 | 345.7469 | 16.6052 | 0.0069 | 13.47 | 13.18 | ⋯ | ⋯ | T | NGC 7468 |
| 168 | Id2319-0059 | 349.9917 | −0.9855 | 0.0121 | 16.12 | 15.81 | 18.01 | 17.91 | TS | ⋯ |
| 169 | Id2320-0052 | 350.1466 | −0.8809 | 0.0145 | 16.41 | 16.20 | ⋯ | ⋯ | I | UM 158 |
| 170 | Id2324-0006 | 351.0990 | −0.1075 | 0.0090 | 14.22 | 14.05 | 15.49 | 15.30 | I | UGC 12578 |
| 171 | Id23260157 | 351.6245 | 01.9602 | 0.0172 | 15.37 | 15.08 | 16.58 | 17.27 | Sh | CGCG 380-056 |
| 172 | Id23261144 | 351.6595 | 11.7423 | 0.0125 | 14.76 | 14.45 | ⋯ | ⋯ | IM | KUG 2324+114 |
| 173 | Id23302531 | 352.5412 | 25.5327 | 0.0191 | 14.54 | 14.27 | ⋯ | 15.38 | IM | III Zw 107 |
| 174 | Id23312856 | 352.9928 | 28.9472 | 0.0182 | 14.74 | 14.77 | 15.79 | 15.33 | IM | MRK 0930 |
| 175 | Id23371759 | 354.3894 | 17.9962 | 0.0084 | 13.79 | 13.43 | ⋯ | ⋯ | IM | UGC12710 |
| 176 | Id2340-0053 | 355.1846 | −0.8874 | 0.0191 | 17.41 | 17.17 | 18.06 | 17.19 | IM | ⋯ |
| 177 | Id23591448 | 359.9042 | 14.8078 | 0.0058 | 13.21 | 12.82 | 14.53 | 14.05 | Sh | NGC 7800 |
Note. The first column is the galaxy number. We list the Interacting dwarf (Id), coordinates (R.A. and decl.) and redshift in columns 2, 3, 4, and 5, respectively. The Ids are in "hmdm" format. FUV, NUV, g, and r photometric data are listed in columns 6–9. We present the morphological classes of the merging dwarf systems, obtained according to Section 2.2, in column 10. In the last column we provide the names of galaxies that we found in NED.
Only a portion of this table is shown here to demonstrate its form and content. A machine-readable version of the full table is available.
We show the redshift distribution of our catalog of dwarf galaxies in Figure 3. The median redshift of this sample is 0.01. Next, we show the total stellar mass distribution of interacting/merging dwarf galaxies in Figure 4. It is not surprising that this sample is somewhat biased toward the brighter end of our stellar mass cut. Nevertheless, the range of stellar mass coverage is of the order of 3 mag, with a median value of log(M*/M⊙) = 9.1. The minimum mass galaxy, Id10354614, has a similar stellar mass to the local group Fornax dwarf galaxy or Virgo cluster dwarf galaxy VCC 1407; both are well known for their shell features and have been discussed as merger remnants (Coleman et al. 2004; Paudel et al. 2017).

Figure 3. Redshift distribution of the sample.
Download figure:
Standard image High-resolution image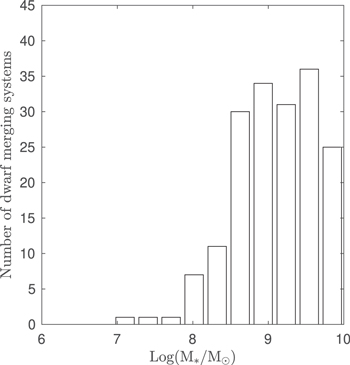
Figure 4. Distribution of the logarithm of the stellar mass of merging dwarf systems.
Download figure:
Standard image High-resolution imageThe g − r color distribution shown in the right panel of Figure 5 reveals that this sample is overwhelmingly dominated by star-forming galaxies with similar colors to BCDs (Meyer et al. 2014). Our sample has a median value of g − r color index = 0.32 mag. For comparison, we also show a sample of early-type galaxies from Janz & Lisker (2009), which clearly offsets from our sample galaxies, creating a red sequence above the star-forming galaxies in the color–magnitude relation. In fact, there are only three galaxies (Id10080227, Id12474709, and Id12561630) that have g − r color indices redder than 0.5 mag and they are also morphologically akin to the early-type galaxies.
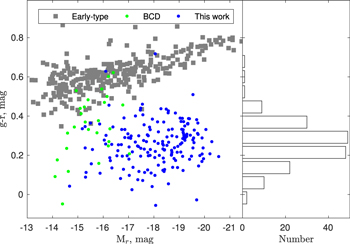
Figure 5. Optical color–magnitude relation. The blue dots represent interacting dwarfs. The comparison samples are early-type galaxies (gray square) and BCDs (green dots) taken from Janz & Lisker (2009) and Meyer et al. (2014), respectively.
Download figure:
Standard image High-resolution imageAs previously mentioned, the overwhelming majority of galaxies in this sample are blue and they are also detected in the GALEX all-sky survey FUV-band image, which further confirms ongoing active star formation. Figure 6 illustrates the relation between the B-band absolute magnitude and the SFR. The B-band magnitudes are derived from the SDSS g-band and r-band magnitudes using the equation  .8
For comparison, we also plot data from Lee et al. (2009; see the gray plots), who studied the FUV-derived SFRs of local-volume (<11 Mpc), star-forming galaxies. From this figure, it is clear that these interacting dwarfs galaxies do not differ from the trend established by local-volume, star-forming galaxies.
.8
For comparison, we also plot data from Lee et al. (2009; see the gray plots), who studied the FUV-derived SFRs of local-volume (<11 Mpc), star-forming galaxies. From this figure, it is clear that these interacting dwarfs galaxies do not differ from the trend established by local-volume, star-forming galaxies.
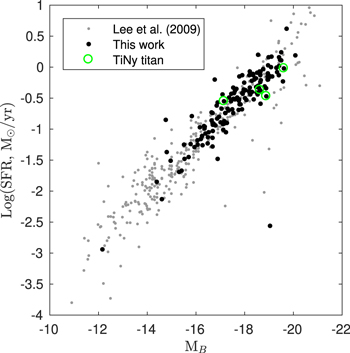
Figure 6. Star formation rate vs. blue-band absolute magnitude. The black plots represent merging dwarf systems and the gray plots are the Lee et al. (2009) galaxies. Interacting pairs that are found in both our sample and those of the Tiny titan sample are shown with green circles.
Download figure:
Standard image High-resolution imageAmong the interacting systems there are 76 for which we can clearly separate out the individual interacting members (only "I" class), which we will refer to as an "interacting dwarf pair." To measure the mass ratio of an interacting dwarf pair, we perform the aperture photometry in the SDSS r-band images on the individual interacting galaxies. Note that this is actually the flux ratio (larger flux/smaller flux), but under the assumption of similar stellar populations in both galaxies, we simply use the the term mass ratio. Among the interacting dwarf pairs, we find that both member galaxies share similar g − r colors, which also validates our assumption of similar stellar populations. We show the distribution of their mass ratios in Figure 7. It is clear that the majority of interactions are major interactions with a mass ratio of 5 or less, and the median is 4. The first bin of the histogram includes 13 systems (17% of the total) that can be considered equal mass mergers. In reverse, there are 15 systems (20% of the total) that have a mass ratio larger than 10, which can be considered a minor merger. The maximum mass ratio is 120 in the case of Id14392323. Among the 76 dwarf interacting pairs, we find that there are 38 systems where radial velocities are available for both members of the interacting pair dwarf galaxies. As the right panel of Figure 7 indicates, the relative line-of-sight velocity between the interacting dwarf pairs is relatively low, and only in two cases is it higher than 100 km s−1.
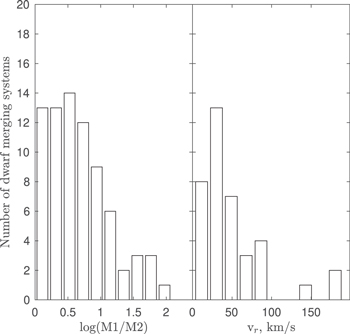
Figure 7. Distribution of mass ratio and relative line-of-sight velocity for interacting dwarf pairs. Each panel contains different numbers of galaxies; for the mass ratio there are 76 and for the velocity separation there are 38, for the reasons given in the text; see Section 4.
Download figure:
Standard image High-resolution imageFor our sample of merging dwarf galaxies, we also collected neutral hydrogen (H i) masses from the CDS server.9 Since these data are assembled from various sources in the literature, note the heterogeneity of the results. The various sources may use different beam sizes, and exposure times, depending on the aim and scope of their individual projects (Paturel et al. 2003; Meyer et al. 2004; Giovanelli et al. 2005; Courtois & Tully 2015). They are mostly from single-dish observations, and we expect that a typical beam size of 3', like the Arecibo telescope, would be sufficient to entirely cover the interacting dwarf galaxies; these observations therefore must be considered measurements for the total, combined system. We found H i masses for 109 merging dwarf galaxies, as listed in Table 2.
Table 2. Derived Properties of Merging Dwarf Galaxies
| Number | Distance | g− r | MB | M* | M1:M2 | SFR | MH i | Set | no. Neighbor |
|---|---|---|---|---|---|---|---|---|---|
| (Mpc) | (mag) | (mag) | log(M⊙) | log(M⊙ yr−1) | log(M⊙) | ||||
| (1) | (2) | (3) | (4) | (5) | (6) | (7) | (8) | (9) | (10) |
| 001 | 16.52 | 0.11 | −14.96 | 7.81 | 5 | −1.51 | 8.49 | 1 | 22 |
| 002 | 41.26 | 0.04 | −17.66 | 8.78 | 2 | −0.35 | 9.30 | 0 | 9 |
| 003 | 53.29 | 0.43 | −17.49 | 9.35 | 4 | −0.68 | 8.76 | 1 | 3 |
| 004 | 51.57 | 0.46 | −16.72 | 9.09 | ⋯ | −0.91 | 8.43 | 0 | 3 |
| 005 | 77.06 | 0.30 | −18.68 | 9.61 | ⋯ | −0.40 | ⋯ | 0 | 1 |
| ⋯ | ⋯ | ⋯ | ⋯ | ⋯ | ⋯ | ⋯ | ⋯ | ⋯ | ⋯ |
Note. Column (1): number. Column (2): adopted distance to the galaxy. Column (3):  color. Column (4): B-band absolute magnitude. Column (5): stellar mass. Column (6): mass ratio of interacting galaxies. Column (7): star formation rate. Column (8): H i mass. Column (9): satellite or not—1 for yes and 0 for no. Column (10): number of neighboring galaxies within our search criteria—see Section 3.
Only a portion of this table is shown here to demonstrate its form and content. A machine-readable version of the full table is available.
Download table as: DataTypeset image
Figure 8 reveals the relation between the H i mass fraction and stellar mass of the star-forming galaxies. It is clear from this figure that our interacting dwarf sample clearly follows the H i mass fraction and stellar mass relation of other star-forming galaxies in the local universe (Leroy et al. 2008). We show the distribution of H i mass fraction in the right panel. The median value of the gas mass fraction of our sample is MH i/M* = 1.09.

Figure 8. Relation between gas mass fraction and stellar mass. The comparison data are from Leroy et al. (2008).
Download figure:
Standard image High-resolution image5. Discussion
In this paper, we present a sample of interacting dwarf galaxy systems. Given the large heterogeneity in the data collection procedure, only part of the scientific discussion can be considered qualitative. However, merging/interacting dwarf galaxies are not thought to be a common phenomenon in the local universe. According to hierarchical cosmology, theory predicts that they are common in the early universe. To date, no systematic effort has been made to present a sample of interacting dwarf galaxies that is statistical enough to study the properties of interacting dwarf galaxies and their roles in the evolution of low-mass galaxies. This is the first publicly available catalog in this vein.
5.1. Comparison to Previous Studies
A previous study of interacting pairs of dwarf galaxies, (Stierwalt et al. 2015, hereafter S15), mainly focused on a statistical analysis of environmental effects on interacting pairs of dwarf galaxies (Patton et al. 2013). Like in this study, S15 also uses SDSS imaging to select their sample galaxies, therefore we expect both samples to cover the same areas of sky. But most likely, the main difference is their redshift coverage. Our sample's redshift range is <0.02, while the S15 sample galaxies have redshifts up to 0.07.
In addition to this, S15 performed a careful selection of a control sample and a working sample to remove biases due to the sample selection procedure, when comparing the samples. In contrast, in this work we first aim to present a large catalog of merging dwarf systems, which will be helpful for a detailed study of various properties of interacting/merging dwarf galaxies in the future. We provide basic properties, such as sky-position, redshift, stellar mass, and SFR. Furthermore, having these properties in hand we also try to assess the effect of environment on our sample galaxies, comparing the gas mass fractions and SFRs between merging dwarf systems and those of normal, local-volume galaxies. We mainly compile our comparison sample data from the literature, thus we caution that our comparative study may not be as statistically rigorous as that of the S15 comparative study between interacting dwarf and non-interacting dwarf galaxies. However, we include the comparison simply to give the properties of our sample some context in comparison to a sample of non-interacting dwarfs of similar mass.
In S15's sample, the pair galaxies needed to have a separation velocity of less than 300 km s−1, which means they required that there be a measured radial velocity for both galaxies. In contrast, we select interacting dwarf galaxies according to their observed tidal features, and it is not necessary to have a radial velocity for both interacting members. This means we are able to study merging dwarfs over a far greater range of merging stages, even when one dwarf has fully merged with another and the only indication of the event might be the remaining tidal features. A good example of this can be found in our shell feature dwarfs.
When comparing S15's sample with only interacting pairs (I class), we find a significant difference in mass ratio for the member dwarf galaxies of the interacting pairs. S15's sample is overwhelmingly dominated by low-mass ratio pairs, i.e., 93% of their sample has a mass ratio of less than 5 and in our case less than half, only 42%, of interacting pairs have mass ratios of less than 5. In addition, while comparing radial velocity separation between interacting pairs, although we find a relatively low number of systems that have radial velocity measurements for both the interacting member dwarf galaxies of our sample, we find a clear difference from S15—only 2 out of 36 (5%) have a relative line-of-sight velocity larger than 100 km s−1 and 15 out of 60 (25%) interacting dwarf pairs in the S15 sample have relative line-of-sight velocities larger than 100 km s−1.
Another interesting difference is that S15 found there is an enhanced SFR between dwarf galaxies at small separations from their partner, compared to a control sample of isolated dwarf galaxies. However, in Figure 6 we found no evidence for an enhanced SFR in our merging dwarf systems compared to a sample of local-volume, star-forming galaxies. One reason we see no clear enhancement in SFR could be because we do not attempt to control for separation distance. Also, S15 compared a homogeneously selected control sample with interacting dwarf pairs, while we simply use data compiled from the literature as a comparison sample. In fact, a small number of the S15 galaxies can be found in common with this sample, although they follow the same trend as our sample (see Figure 6.)
Another part of the difference could emerge from the way we derived SFR. S15 used catalog values of SFRs from Brinchmann et al. (2004), which were derived from a Hα emission line flux of the SDSS fiber spectroscopic data. On the other hand, we have used the FUV flux to derive the SFR where the FUV emission traces recent star formation over longer timescales compared to Hα. However, note that to derive SFR we have only used FUV flux that has been corrected for foreground Galactic extinction but not internal extinction; therefore, in many cases these values would be a lower limit. In the future, we will consider full SED fitting, including infrared wavelengths, in order to better constrain their SFRs.
5.2. Environment
We now turn to the surrounding environment of our merging dwarf systems. For this work we characterize the surrounding environment by searching for neighboring giant galaxies (MK < −20 mag, corresponding to a stellar mass of >1010), within a sky-projected distance of less than 700 kpc, and a relative line-of-sight radial velocity of less than ±700 km s−1. This is a similar criterion to what we previously used to search for isolated early-type dwarf galaxies (Paudel et al. 2014).
We find that only 41 dwarf galaxy merging systems have giant neighbors. The median stellar mass of the giant neighbors is 6 × 10¹⁰ M⊙. For convenience, we refer to them as satellite merging dwarf systems, and isolated merging dwarf systems, hereafter. Among 41 satellite merging systems, there are 19 "I" class systems (interacting dwarf pairs) where we identify ongoing interaction between dwarf galaxies. Shell features are found in 10 systems and the remaining 12 are a mixture of E/T/S classes.
Interestingly, all three early-type merging dwarfs are located at large sky-projected distances from the giant galaxies, beyond 700 kpc. In fact, Paudel et al. (2014) already pointed out that Id10080227 is a compact elliptical galaxy (cE Chilingarian 2009), located in isolation, that may have formed through the merging of dwarf galaxies.
In Figure 9, we show a phase-space diagram of the satellite merging dwarf systems. It is clear from this figure that our satellite merging dwarf systems are located comparatively farther than the distance of the LMC–SMC system is from the Milky Way (MW). We also highlight the position of UGC 4703, which we studied as an LMC–SMC–MW analog in Paudel et al. (2017), and lies in a similar region in phase-space. The dashed line represents the escape velocity as a function of radius for a MW-like galaxy, based on the best-matched model to the MW from Klypin et al. (2002). The two highlighted interacting dwarf pairs, LMC–SMC and UGC 4703, have a small radius and large velocity, near the escape velocity boundary, perhaps indicating they are recent infallers into their hosts (Rhee et al. 2017). It seems that only half of the satellite merging dwarf systems are clearly bound to their hosts, (assuming their hosts are MW-like), i.e., located below the escape velocity line. The rest are scattered well beyond the escape velocity boundary, and often at distances >400 kpc, which is at least twice the Virial radius of a MW-like galaxy. Thus, it is probable that many of these are not bound to their hosts, and in many cases our 700 kpc search radius and ±700 km s−1 velocity range search criteria are not robust enough to characterize whether our merging dwarfs are hosted by their nearest giant host. The phase-space diagram also reveals that there is no special difference between satellite interacting dwarf pairs (shown as empty circle symbols) and the rest of the sample, which have likely already merged (shown as a black dot), as indicated by their locations on their phase-space diagrams.
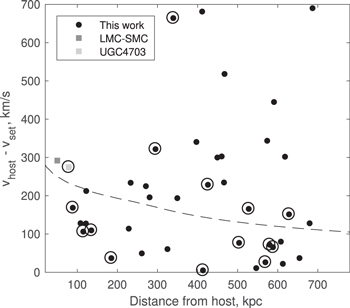
Figure 9. Phase-space diagram of merging satellites. The Y-axis is the relative line-of-sight velocity between dwarf merging systems and nearby giant galaxies and the X-axis is the sky-projected physical distance between them. The dashed line represents the escape velocity as a function of radius for a MW-like galaxy, derived from the best matched model in Klypin et al. (2002). We show dwarf interacting pairs with circles. We show the position of the LMC–SMC pair and UGC 4703 with gray squares.
Download figure:
Standard image High-resolution imageWe compare the SFRs of candidate satellites and isolated merging dwarf systems; see Figure 10. The black dot represents the satellite candidates and blue dots represent isolated candidates. From this figure, it is clear that both the isolated and satellite merging dwarf systems have similar star formation properties, compared with Lee et al. (2009). We also find only a marginal difference in the distribution of the gas mass fractions of satellite and isolated dwarf systems, with median values 1.04 and 1.09, respectively. This is slightly contradictory to the finding of S15, where they found that interacting dwarfs located near a giant galaxy are likely to have a lower gas mass fraction.
We also attempt to use number density to characterize the surrounding environments of merging dwarf systems. For this we simply checked the number of galaxies, both giant and dwarf, within the abovementioned search area (i.e., within a 700 kpc radius and ±700 km s−1 line-of-sight radial velocity). For this, we also removed those merging dwarf systems that have a line-of-sight radial velocity of less than 900 km s−1 to avoid distance uncertainties of nearby galaxies.
We find that a significant fraction, 30 out 177, of merging dwarf systems have no neighbors, not even another dwarf galaxy, within our search area. In contrast, more than 10 neighbors are found only for 32 cases, and they are mostly interacting satellites. We show a simple histogram of the number of galaxies (which include both giants and dwarfs) found in the search area in Figure 11. The last bin (the gray histogram) represents the number of merging dwarf systems that have more than 10 neighbors within our search area. From this figure, it is clear that the probability of finding a merging dwarf system increases in low-density environments. The median neighbor number of merging dwarf systems in this sample is 4.

Figure 10. Comparison of the star formation rates of satellite (star) and isolated (dot) merging dwarfs systems. We also show the local-volume (<11 Mpc), star-forming galaxy sample of Lee et al. (2009) in gray.
Download figure:
Standard image High-resolution image
Figure 11. Total number of galaxies, including both giants and dwarfs, within a coverage area of of 700 kpc radius and ±700 km s−1 line-of-sight radial velocity around merging dwarf systems. The last gray bar represents the number of merging dwarf systems that have more than 10 neighbor galaxies.
Download figure:
Standard image High-resolution image6. Conclusions and Remarks
We have collected a catalog of 177 merging dwarf systems, spanning the stellar mass range from 107 to 1010 M⊙ in a redshift range z < 0.02. The sample is overwhelmingly dominated by star-forming galaxies and they are located significantly below the red sequence in the observed color–magnitude relation. The fraction of early-type dwarf galaxies is only 3 out of 177. Star-forming objects may be preferentially selected because of the criterion to have a redshift, and it is easy to measure the redshifts from the emission lines of star-forming galaxies than from the absorption lines of non star-forming galaxies.
We classify the morphologies of the low-surface-brightness features into various categories: shells, stellar streams, loops, Antennae-like systems, or interacting. These different types of low-surface-brightness features may hint at the different stages objects undergo during their interactions. For example, the shell feature might be the product of a complete coalescence, while two well separated interacting dwarfs are probably in the earlier stages of their interaction. There are three dwarf galaxies (Id0202-0922, Id1448-0342, Id14503534) that can be considered dwarf analogs to the Antennae system (NGC 4038/4039).
A potential problem with these types of catalogs is that they are inherently inhomogeneous and incomplete. Because they are selected from visual inspection of low-surface-brightness features, this depends on the depth of the imaging survey, and on how well defined the tidal features are. As a result, this is in many ways very subjective. We encourage the completeness of the catalog to be viewed cautiously, as there may be many possible biases in our selection procedure. For example, dwarf galaxies with tidal features whose origins are unclear and are located near a giant (M* > 1010) host galaxy have been selectively removed. That may lead to an artificial reduction in the number of merging dwarf systems near giant galaxies.
However, more isolated dwarf interacting pairs do not suffer from this issue, as there is no uncertainty as to whether a giant galaxy is responsible for the observed fine structure (e.g., tidal streams, tails, shells, etc.). Therefore, we believe our sample will be more complete for these kinds of objects, as long as the interacting pairs show similar low-surface-brightness features as presented by our sample. We believe that it makes physical sense that dwarf systems struggle to merge in the presence of a nearby giant galaxy. Dwarf galaxies have small escape velocities, owing to their small masses. As a result, only small amounts of peculiar motions, due to the potential wells of giant galaxies, might be enough to make it nearly impossible for dwarfs to meet at low enough velocities to merge. Thus, we suspect that our selection criteria may be simply enhancing a real dependency on distance to the nearest giant galaxy. In any case, we find that there is no significant difference in the phase-space diagram of dwarf interacting pairs (I class) and the rest of the sample.
In conclusion, we present a large set of interacting and merging dwarf systems, including aperture photometry in UV and optical bands, as well as stellar masses, SFRs, gas masses ,and stellar mass ratios. These data might be useful for detailed studies of dwarf–dwarf interactions in the near future.
P.S. acknowledges the support by the Samsung Science & Technology Foundation under Project Number SSTF-BA1501-0. S.-J.Y. acknowledges support from the Center for Galaxy Evolution Research (No. 2010-0027910) through the NRF of Korea and from the Yonsei University Observatory—KASI Joint Research Program (2018). P.C.-C. was supported by CONICYT (Chile) through Programa Nacional de Becas de Doctorado 2014 folio 21140882.
This study is based on the archival images and spectra from the Sloan Digital Sky Survey and Legacy Survey Data. Full acknowledgments for these surveys can be found at https://www.sdss.org/collaboration/#acknowledgements and http://legacysurvey.org/acknowledgment/, respectively. Funding for the SDSS has been provided by the Alfred P. Sloan Foundation, the Participating Institutions, the National Science Foundation, the U.S. Department of Energy, the National Aeronautics and Space Administration, the Japanese Monbukagakusho, the Max Planck Society, and the Higher Education Funding Council for England. The SDSS website is http://www.sdss.org/. The Legacy Surveys imaging of the DESI footprint is supported by the Director, Office of Science, Office of High Energy Physics of the U.S. Department of Energy under Contract No. DE-AC02-05CH1123, by the National Energy Research Scientific Computing Center, a DOE Office of Science User Facility under the same contract; and by the U.S. National Science Foundation, Division of Astronomical Sciences under Contract No. AST-0950945 to NOAO. We also made use of the GALEX all-sky survey imaging data. The GALEX is operated for NASA by the California Institute of Technology under NASA contract NAS5-98034. We also acknowledge the use of NASA's Astrophysics Data System Bibliographic Services and the NASA/IPAC Extragalactic Database (NED). We also made use of archival data from the Canada–France–Hawaii Telescope (CFHT), which is operated by the National Research Council (NRC) of Canada, the Institute National des Sciences de lÚnivers of the Centre National de la Recherche Scientifique of France, and the University of Hawaii.
Appendix A: Notes on Selected Individual Systems
In this section, we provide a short list of previously published studies on individual objects in our sample. We note that the list is neither complete nor fully comprehensive, but we hope it provides a useful starting point for readers with an interest in a specific object or merging system.
- Id01130052. A gas-rich, low-metallicity dwarf galaxy ( Ekta et al. 2008) with a disturbed H i velocity field and suggestive of an ongoing merger.
- Id0202-0922. Dwarf antennae system produced by merging two gas-rich dwarf galaxies. A detailed study of the system from H i data has been submitted (S. Paudel et al., in preparation).
- Id02032202. This galaxy is located in isolation and Sengupta et al. (2012) reported an ongoing minor merger in this galaxy. They detected an asymmetrical feature in the H i map.
- Id0851-0221. ARP 257: from a catalog of interacting galaxies (Arp 1966).
- Id08580619. Interacting dwarf pair in the vicinity of an isolated spiral galaxy, NGC 2718. Paudel & Sengupta (2017) reported the system as an LMC–SMC–MW analog.
- Id09003543. Arp 202: from a catalog of interacting galaxies. A detailed study of the system was performed by Sengupta et al. (2014), who they reported the formation of tidal dwarf galaxies of stellar mass 2 × 10⁸ M⊙.
- Id09002536. An isolated galaxy. Chengalur et al. (2015) identified a disturbed H i morphology and argued that the galaxy has suffered a recent minor merger.
- Id09562849. A merging dwarf candidate (Annibali et al. 2016).
- Id10080227. A compact early-type galaxy with a merger origin (Paudel et al. 2014).
- Id10545418. Interacting pair studied in local-volume TiNy Titan (Pearson et al. 2016).
- Id11451711. Interacting dwarf galaxies on the outskirts of a group environment (Paudel et al. 2013).
- Id1148-0138. Lelli et al. (2014) studied this galaxy and concluded that SFR is enhanced due to merger/interactions in the recent past.
- Id12250548. VCC 848, a merging BCD in the Virgo cluster.
- Id12304138. Interacting pair studied in local-volume TiNy Titan (Pearson et al. 2016).
- Id12474709. ARP 277.
- Id14503534. Interacting pair studied in local-volume TiNy Titan (Pearson et al. 2016).
- Id14503534. Part of TiNy Titan, a dwarf interacting pair studied in Privon et al. (2017).
Appendix B: Figure Catalog
Figure 12 shows postage images prepared from fits images downloaded from various archives.
Download figure:
Standard image High-resolution image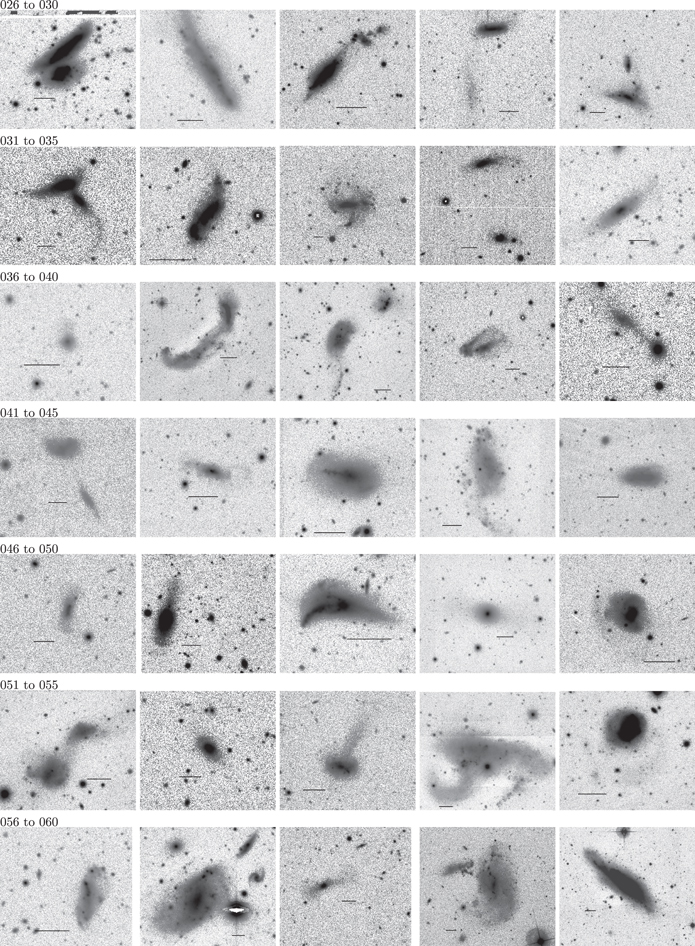
Download figure:
Standard image High-resolution image
Download figure:
Standard image High-resolution image
Download figure:
Standard image High-resolution image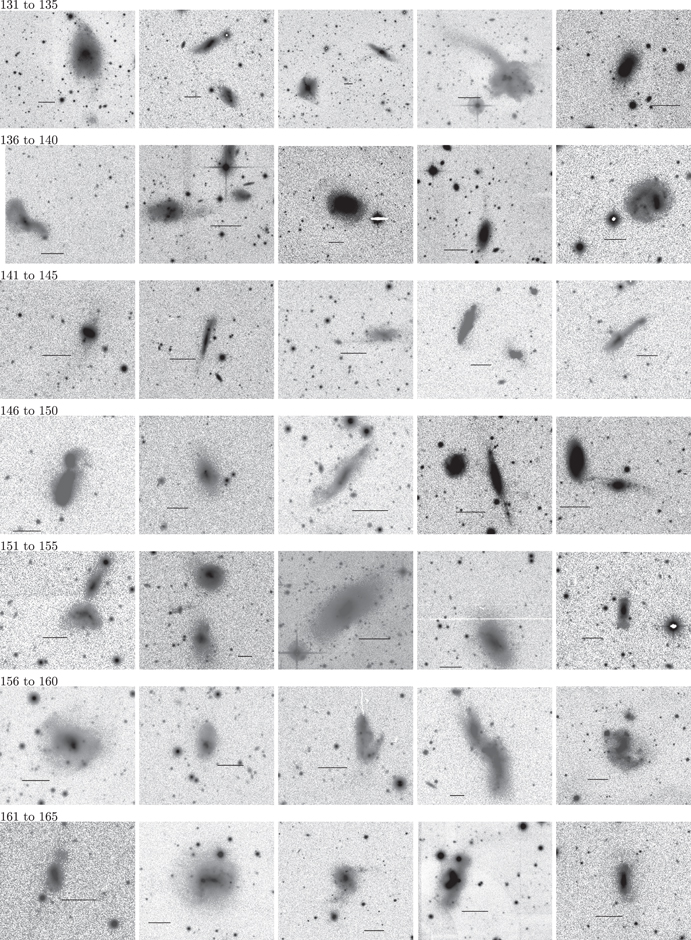
Download figure:
Standard image High-resolution image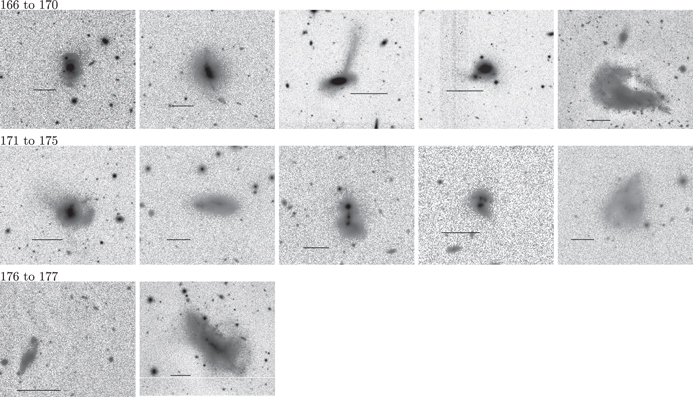
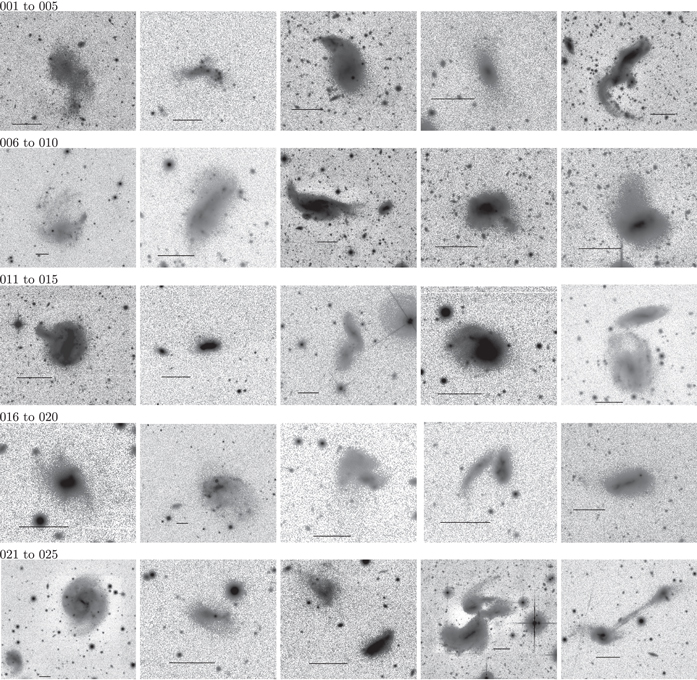
Figure 12. These postage images are prepared from fits images downloaded from various archives. At the top of each row, we list the identifications of these galaxies according to Table 1. The field of view and color stretching are arbitrarily chosen to yield the best view of both interacting galaxies and low-surface-brightness features. An image scale of 30'' is shown by the black horizontal bar.
Download figure:
Standard image High-resolution image
Footnotes
- 5
- 6
- 7
- 8
- 9