


Abstract
We present the first rest-frame optical spectrum of a high-redshift quasar observed with JWST/NIRCam in Wide Field Slitless mode. The observed quasar, J0100+2802, is the most luminous quasar known at z > 6. We measure the mass of the central supermassive black hole (SMBH) by means of the rest-frame optical H β emission line, and find consistent mass measurements of the quasar's SMBH of M• ≈ 1010M☉ when compared to the estimates based on the properties of rest-frame UV emission lines C iv and Mg ii, which are accessible from ground-based observatories. To this end, we also present a newly reduced rest-frame UV spectrum of the quasar observed with X-Shooter/Very Large Telescope (VLT) and FIRE/Magellan for a total of 16.8 hr. We readdress the question whether this ultraluminous quasar could be effected by strong gravitational lensing making use of the diffraction limited NIRCam images in three different wide band filters (F115W, F200W, F356W), which improves the achieved spatial resolution compared to previous images taken with the Hubble Space Telescope by a factor of 2. We do not find any evidence for a foreground deflecting galaxy, nor for multiple images of the quasar, and determine the probability for magnification due to strong gravitational lensing with image separations below the diffraction limit of Δθ ≲ 0 05 to be ≲2.2 × 10⁻³. Our observations therefore confirm that this quasar hosts a 10 billion solar mass black hole less than 1 Gyr after the Big Bang, which is challenging to explain with current black hole formation models.
Export citation and abstract BibTeX RIS

Original content from this work may be used under the terms of the Creative Commons Attribution 4.0 licence. Any further distribution of this work must maintain attribution to the author(s) and the title of the work, journal citation and DOI.
1. Introduction
Since the discovery of the first luminous quasars nearly six decades ago (Schmidt 1965) astronomers have detected and observed more than a million quasars in the universe up to redshifts of z ≳ 7.5 (e.g., Bañados et al. 2016; Lyke et al. 2020; Wang et al. 2021). Quasars are the most luminous, nontransient objects in the universe, powered by accretion onto a central supermassive black hole (SMBH) of millions to several billions of solar masses in size (e.g., Mazzucchelli et al. 2017; Yang et al. 2021; Wu & Shen 2022). The most luminous, high-redshift quasar (z > 6) known to date was discovered by Wu et al. (2015), i.e., J0100+2802 at a redshift of z = 6.3270 ± 0.0005 (Wang et al. 2019). Its extreme luminosity of Lbol ∼ 1048 erg s−1 implies that the quasar hosts a highly accreting SMBH in its center with a mass of M• ∼ 1010 M☉ (Wu et al. 2015).
Thus, J0100+2802 harbors the most-massive SMBH known at z ≳ 6—which is among the 0.2% of the most-massive SMBHs at all redshifts (Wu & Shen 2022)—at a time when the universe is only ∼800 Myr old. Its existence poses significant challenges to current models aiming to explain the rapid growth of SMBHs in the early universe (e.g., Bañados et al. 2018). Adding to the challenge, the quasar's rest-frame ultraviolet (UV) spectrum exhibits a very small proximity zone in the vicinity of the quasar, which indicates a short UV luminous quasar lifetime of tQ ∼ 105 yr, during which accretion onto the black hole is expected to occur (e.g., Eilers et al. 2017; Davies et al. 2020; Morey et al. 2021).
To explain the anomaly of J0100+2802's SMBH it has been suspected that this ultraluminous quasar could possibly be strongly gravitationally lensed. Arguments in favor of this hypothesis were largely based on the clumpy morphology of observations with the Atacama Large Millimeter/submillimeter Array (ALMA; Fujimoto et al. 2020). However, high-resolution images taken with the Hubble Space Telescope (HST) did not reveal any evidence for multiple images due to strong gravitational lensing (Fujimoto et al. 2020, Yue et al. 2023). Furthermore, detailed analyses of the flux transmission in the quasar's proximity zone (Davies et al. 2020), the expected ratios of X-ray luminosity to rest-frame UV and IR luminosities (Connor et al. 2021), as well as the implications for the bright-end slope of the quasar luminosity function (Pacucci & Loeb 2020) indicate that a significant magnification of the quasar's luminosity is unlikely.
The quasar's extremely massive SMBH has also called into question the accuracy of all black hole mass estimates of high-redshift quasars, which are obtained using scaling relations between the width of broad emission lines observed in single-epoch quasar spectra, the quasars' luminosities, and their black hole masses (e.g., Vestergaard & Osmer 2009). These scaling relations are calibrated based on a small sample of quasars at very low redshifts, i.e., z ≲ 0.2, for which black hole masses can be precisely determined by means of reverberation mapping (RM) measurements (e.g., Vestergaard & Peterson 2006). However, RM measurements require long monitoring campaigns and thus for most quasars—especially at higher redshifts where time delays are longer due to time dilation and their generally more massive black holes—this method is unfeasible. Thus, masses of SMBHs are inferred from single-epoch spectra using aforementioned scaling relations, most commonly calibrated to the, at low-redshift easily observable, rest-frame optical H β emission line (e.g., Vestergaard & Peterson 2006; Grier et al. 2017). Since the H β line is very challenging to observe for quasars at z > 4 with ground-based observatories, additional uncertainty and possibly biases in the black hole mass estimates for high-redshift quasars could be introduced by rescaling the H β emission line properties to properties of rest-frame UV emission lines, such as C iv and Mg ii (e.g., Vestergaard & Osmer 2009; Coatman et al. 2017). These uncertainties have motivated recent efforts to avoid such scaling relations altogether and derive black hole mass estimates and other quasar properties from the spectra themselves by means of data-driven modeling of the quasars' spectral features (e.g., Eilers et al. 2022).
In this article we present the first spectrum of the ultraluminous quasar J0100+2802 at rest-frame optical wavelengths observed with the NIRCam grism on JWST, as well as a newly reduced high signal-to-noise (S/N) spectrum at rest-frame UV wavelengths taken with ground-based facilities (Section 2). This spectrum covers the wavelength region between 0.6 μm ≤ λ ≤ 4 μm (with a gap between 2.3 μm ≤ λ ≤ 3.1 μm), which enables us to obtain measurements of the quasar's black hole mass based on the rest-frame UV C iv and Mg ii broad emission lines, as well as the rest-frame optical H β emission (Section 3). Furthermore, we will show NIRCam Imaging observations that set constraints on the possibility of strong gravitational lensing of the quasar (Section 4), before summarizing our results (Section 5). Throughout this work, we adopt a flat ΛCDM cosmology with Ωm = 0.31 and H0 = 67.7 km s−1 Mpc−1 (Planck Collaboration et al. 2020).
2. Data
2.1. Ground-based Spectroscopy
The ground-based optical and NIR spectroscopic data for J0100+2802 (R.A.: 01h00m13 020; decl.:
  ) have been obtained using both the X-Shooter spectrograph(Vernet et al. 2011) on the Very Large Telescope (VLT) as well as the Folded-port InfraRed Echellette instrument (FIRE; Simcoe et al. 2013) on the Magellan Telescope in the years of 2015 and 2016. The target was observed for a total of 16.8 hr, of which 11 hr were observed with VLT/X-Shooter (program ID: 096.A-0095; PI: Pettini) and 5.8 hr observed with Magellan/FIRE (PI: Simcoe).
The ground-based optical and NIR data are reduced consistently with the open-source python-based spectroscopic data reduction pipeline PypeIt 7 version 1.7.1 (Prochaska et al. 2020). We derive the wavelength solution from the night sky OH lines, in order to have on-sky wavelength calibrations and to reduce the overheads of our observations. The sky subtraction is performed on the 2D images by differencing exposures dithered along the slit in the standard A-B mode and fitting a b-spline to further eliminate sky line residuals following Bochanski et al. (2009). We then perform an optimal extraction (Horne 1986) to obtain the 1D spectra. The spectra are flux calibrated using sensitivity functions of standard stars observed during the same observing run. For a few runs no standard stars were observed and hence a sensitivity function is created from an A0 star with known magnitude.
We coadd the flux-calibrated 1D spectra from each night and correct for telluric absorption features by jointly fitting an atmospheric model and a quasar model. The telluric model grids are produced using the Line-By-Line Radiative Transfer Model (Clough et al. 2005), while we fit a third-order polynomial as the quasar model for this very featureless spectrum. The individual telluric-corrected 1D spectra observed in different observing runs or with different telescopes and instruments are then coadded weighted by the average square S/N of the exposure, and stacked on a common wavelength grid. Note that this steps avoids any interpolation of the data in order to prevent correlated noise properties.
In order to combine the optical and NIR part of the quasar spectrum observed with X-Shooter, the two parts are stitched together by matching the median flux at the intersection between 9900 and 10100 Å. As a last step we apply an absolute flux calibration to the fully reduced and coadded quasar spectrum by requiring their integrated flux within the UKIRT-J filter to match the observed J-band magnitude of the quasar, i.e., JAB = 17.64 ± 0.02.
Finally, the spectrum is rebinned to a wavelength grid sampled linearly in velocity space with a chosen step size of Δv ≈ 50 km s−1 per pixel. We then divide all native pixels into the respective wavelength bins, and determine the stacked flux in each bin as the mean from all native pixels. Note that the final wavelength grid is the weighted average of the individual wavelengths used for each exposure that fall into a given wavelength bin in the input wavelength grid, and hence not necessarily linearly sampled anymore.
The resulting ground-based spectrum shown in the top panel of Figure 1 has an S/N ≈ 205 per Δv ≈ 50 km s−1 pixel measured at a rest-frame wavelength of λrest = 1280 ± 20 Å.

Figure 1. Quasar spectrum of J0100+2802 observed with ground-based facilities (top) and NIRCam WFSS on JWST (bottom) with the filter F356W shown as the orange shaded region. Gray shaded areas show masked wavelengths affected by foreground absorption systems, regions of significant telluric absorption, regions with strong sky line residuals, as well as regions at the very edge of the filter transmission. The red curve shows the best fit to the quasar spectrum, while the colored curves in the insets show the individual components of the spectral fit (power-law continuum: blue dashed; Balmer continuum: dark green dotted; iron template: green; Gaussian line components: yellow, gray, or purple).
Download figure:
Standard image High-resolution image2.2. Observations with JWST/NIRCam WFSS
The quasar field of J0100+2802 was observed with JWST/NIRCam in Imaging and WFSS mode on 2022 August 22, as part of the Emission-line galaxies and Intergalactic Gas in the Epoch of Reionization (EIGER) Guaranteed Time Observations program (program ID: 1243, PI: S. Lilly). The quasar field is observed in a mosaic containing four individual visits such that the final field of view spans approximately  corresponding to 7.6 cMpc × 15.3 cMpc at z ≈ 6. The central 40'' × 40'' area around the quasar is part of every visit and thus this region has the deepest observations with a total exposure time of 8760 s per visit, i.e., approximately 9.7 hr in total on source. The NIRCam WFSS observations of the J0100+2802 field use the grism "R" in the F356W filter. Simultaneously, we obtain direct imaging observations in two short wavelengths filters, i.e., F115W and F200W (see Section 2.3). The observational setup as well as the data reduction process are described in detail Kashino et al. (2023) and Matthee et al. (2023). We will summarize the main steps briefly below.
The data are reduced using the jwst pipeline 8 version 1.8.0 provided by STScI. We first run the Detector1Pipeline step to obtain the uncalibrated NIRCam exposures (*_rate.fits). We then apply two additional reduction steps from the Spec2Pipeline to transfer the pixel coordinates to astronomical coordinates (AssignWcsStep) and afterwards apply the flat-fielding to the exposures (FlatFieldStep). We then extract the 2D spectrum of the quasar from each of the flat-fielded exposures using customized scripts, which are making use of the grismconf 9 module using the latest (V4) trace models. The spectra are normalized by the filter's sensitivity curve and rectified to a common observed wavelength grid, ranging from 3.0 μm ≤ λobs ≤ 4.2 μm in bins of Δλ = 9.75 Å. We correct the trace of the quasar in each exposure for small curvatures and then perform an optimal extraction of the quasar spectrum from each 2D exposure. This results in 96 individual 1D spectra, which are coadded using the average square S/N of each exposure as weights to a combined 1D spectrum. We estimate the uncertainty on each pixel flux via bootstrapping: to this end we resample the 96 individual spectra with replacement to create 1000 coadded 1D spectra from which we take the 16th and 84th percentile at each pixel as the uncertainty. The final spectrum is shown in the bottom panel of Figure 1 and has an S/N ≈ 235 per 9.75 Å pixel (Δv ∼ 80 km s−1) measured at a rest-frame wavelength of λrest = 5100 ± 20 Å.
The spectrum of the quasar from both the ground-based observatories as well as JWST/NIRCam WFSS will be made publicly available upon publication.
2.3. Imaging Data from JWST/NIRCam
The NIRCam imaging data were reduced using the jwst pipeline version 1.8.2. In order to avoid saturation in the central pixels of bright sources in the quasar field, we run the Detector1Pipeline without suppressing the computations for saturated ramps with only one good, unsaturated sample in the ramp-fitting step. We then run the Image2Pipeline to obtain calibrated images (*_cal.fits), and apply the 1/f noise reduction, remove any snowballs and other artifacts from the data, and subtract the sky and any wisp artifacts. We use tweakwcs 10 to align all exposures relative to each other, and then stack all exposure with a global alignment calibrated to Gaia stars. Any offsets are applied to the calibrated images directly, before all exposures are ultimately combined to a final mosaic by the Image3Pipeline. The exposure time of the images in the two short-wavelength filters F115W and F200W add up to 4380 s per visit, i.e., approximately 4.9 hr in total, while the direct images with the F356W filter sum up to 1578 s per visit, i.e., 1.8 hr total. Individual exposures are stacked weighted by their inverse variance.
The final images (for one of the four visits) in the three broadband NIRCam filters F115W, F200W, and F356W of a 5'' × 5'' region around the quasar are shown in the left column of Figure 3. Note that we do not take the quasar images from the full mosaic for modeling the point-spread function (PSF) (see Section 4), but only the images from one visit (i.e., visit 1), since it results in a better PSF subtraction.
Since the noise properties in the short-wavelength filters that are reported by the jwst pipeline seem to overestimate the pixel-to-pixel variance in the science image, we rescale the inverse variance in the science images by a factor of 2.0 in F115W and 1.8 in F200W. We do not apply any rescaling in the long-wavelength filter F356W.
3. Mass Estimates of the Quasar's Supermassive Black Hole
Under the assumption that the dynamics in the quasar's broad-line region (BLR) are dominated by the gravitational pull of the black hole and the system is in virial equilibrium, we can estimate the mass of the SMBH using the FWHM of broad emission lines, which gives an estimate for the velocity of the gas clouds in the BLR orbiting the black hole, and the quasar's luminosity, which acts as a proxy for the radius of the BLR, i.e.,

Traditionally, these scaling relations are calibrated based on a relatively small sample of low-redshift quasars using the properties of the H β emission line. However, as H β is not observable with ground-based observatories for quasars at z > 4, these scaling relations have been recalibrated using properties of the rest-frame UV broad emission lines, such as Mg ii and C iv instead. The best-fit values for the scaling parameters α, β, and γ dependent on the respective emission lines and monochromatic luminosity Lλ , and are listed in Table 1.
Table 1. Parameters of the Black Hole Mass Scaling Relations
| Emission Line | α | β | γ | λ (Å) | Reference |
|---|---|---|---|---|---|
| C iv (corrected) | 6.71 | 2 | 0.53 | 1350 | Coatman et al. (2017) |
| Mg ii | 6.86 | 2 | 0.50 | 3000 | Vestergaard & Osmer (2009) |
| H β | 6.91 | 2 | 0.50 | 5100 | Vestergaard & Peterson (2006) |
Download table as: ASCIITypeset image
3.1. Spectral Fitting
To estimate the mass of the SMBH in J0100+2802, we fit the ground-based and NIRCam/WFSS quasar spectrum in the wavelength regions between 0.95 and 2.25 μm, as well as 3.15 and 3.99 μm, respectively. We mask all wavelengths that are affected by foreground metal absorption systems, regions affected by significant telluric absorption (at λ ≈ 14,000 Å and λ ≈ 19,000 Å), regions with strong sky line residuals (at λ ≈ 20,000 Å), as well as regions at the very edge of the filter transmission (at λ < 31,500 Å and λ > 40,000 Å). We fit the observed ground- and space-based spectrum separately, with a combination of (A) a power-law continuum, (B) an iron template (provided by Vestergaard & Wilkes (2001) for the rest-frame UV iron emission and by Park et al. (2022) in the rest-frame optical) that is broadened to match the widths of the broad emission lines through a convolution of the template with a corresponding Gaussian kernel, (C) a Balmer continuum below the Balmer edge (which only applies to the ground-based spectrum; see De Rosa et al. 2014; Schindler et al. 2020, for details), and (D) one or multiple Gaussian components for the broad emission lines.
We use a single Gaussian component to fit the Si iv λ1304, the unresolved Si ii λ λ1393, 1402 doublet, Mg ii λ2799, H γ λ4341, [O iii] λ4363, and He ii λ4868 emission lines, while we use two Gaussian components to capture the more complex line profile of the C iv λ λ1548, 1550, and H β λ4861 emission lines, as well as the [O iii] λ λ4959, 5007 doublet. This results in 19 and 32 free parameters of the spectral fit for the ground-based and NIRCam/WFSS spectrum, respectively, which we estimate using the Markov Chain Monte Carlo (MCMC) algorithm emcee (Foreman-Mackey et al. 2013). We apply flat priors for each parameter and take the median of the posterior probability distribution as the best parameter estimate. The final spectral fits are shown in red in Figure 1.
3.2. Black Hole Mass Estimates
In order to estimate the mass of the quasar's SMBH using scaling relations, we need to estimate the FWHM of the broad emission lines as well as the monochromatic luminosity Lλ (see Equation (1)). In order to derive the FWHM of the emission lines with multiple Gaussian components, we first combine both profiles to form a joint line profile and measure the width of this joint profile at the half maximum. The estimates for the monochromatic luminosities Lλ are determined from the continuum flux fλ , for which we evaluate the power-law continuum fit at the respective wavelength λ (we evaluate f1350 and f3000 from the power-law fit to the ground-based spectrum, i.e., fλ ∝ λ−1.6, and f5100 based on the power-law fit to the grism spectrum, i.e., fλ ∝ λ−2.4). The uncertainties on both the FWHM and Lλ are estimated from the 16th and 84th percentile of 10,000 random draws from the MCMC posterior.
In order to estimate the black hole mass based on the C iv emission line, we follow the procedure suggested in Coatman et al. (2017). It is well known that the C iv emission line in high-redshift quasars is often blueshifted due to strong winds and outflows in the BLR (e.g., Meyer et al. 2019; Schindler et al. 2020), and thus Coatman et al. (2017) report better consistency in their black hole mass estimates once they "correct" the FWHM of the C iv line by its velocity shift from the systemic redshift of 6.3270 ± 0.0005, which was determined from the submillimeter [C ii] emission using observations from ALMA (Wang et al. 2019). However, determining the velocity shift of the C iv emission line is challenging for for J0100+2802 since it is affected by significant foreground and telluric absorption. Thus, to reduce the impact of narrow absorption systems or telluric effects on the emission line profile we define a "pseudo continuum" within the wavelength interval 1450–1600 Å by applying a median filter to the quasar spectrum, as suggested by Coatman et al. (2016). Pixels within the wavelength range around the C iv emission line profile that lie more than 2σ below the pseudo continuum are deemed to be affected by absorption and are additionally masked. All measured spectral properties are listed in Table 2.
Table 2. Spectral Properties of the Quasar J0100+2802
| Spectral Property | Measurement |
|---|---|
| FWHMC IV (km s−1) (corrected) | 3190±2070 |
| FWHMMg II (km s−1) | 3890±40 |
| FWHMHβ (km s−1) | 6730±170 |
| ΔvC IV (km s−1) | −8850±2970 |
| ΔvMg II (km s−1) | −980±20 |
| ΔvHβ (km s−1) | −30±130 |
| 1350Å L1350Å (1046 erg s−1) | 40.9±0.1 |
| 3000Å L3000Å (1046 erg s−1) | 25.7±0.1 |
| 5100Å L5100Å (1046 erg s−1) | 20.1±0.1 |
 (C iv) (C iv) | 9.6±0.9 |
 (Mg ii) (Mg ii) | 9.7±0.1 |
 (H β ) (H β ) | 10.2±0.1 |
Download table as: ASCIITypeset image
These spectral properties allow us to obtain three different estimates of the black hole mass based on the C iv, Mg ii, and Hβ emission using Equation (1). Reassuringly, we find consistent results between the black hole mass measurements derived from the rest-frame UV as well as the rest-frame optical emission lines. All estimates point to an SMBH mass of J0100+2802 of  (see Table 2). The observational uncertainties on these measurements are obtained using again the 16th and 84th percentile of black hole mass estimates from 10,000 random draws for the spectral fit parameters from their MCMC posteriors. While the statistical errors on these measurements are small, there are large systematic uncertainties in the applied scaling relations of approximately 0.4–0.5 dex (e.g., Vestergaard & Peterson 2006), and thus all estimates of the SMBHs are consistent within the expected uncertainties. The measurements show that this quasar indeed hosts a 10 billion solar mass black hole at z = 6.3270, which is the most-massive SMBH known in the early universe.
3.3. Equivalent Width of the Quasar's [O iii] Emission
We will now take a closer look at the spectral shape of the quasar around the H β +[O iii] emission line complex. We estimate an equivalent width (EW) in the observed wavelength frame for the [O iii] doublet emission of EW([O iii]) ≈ 86 ± 1 Å. Interestingly, nearly all of this emission arises from the broad [O iii] components, since we do not find any narrow [O iii] emission (i.e., EW([O iii]narrow) < 1 Å) in the spectrum of J0100+2802 (see inset in Figure 1). It is not unusual to observe weaker narrow [O iii] emission lines with increasing bolometric luminosity (e.g., Baldwin 1977) and decreasing EW of the H β emission in low-redshift quasar spectra from the Sloan Digital Sky Survey (SDSS; Lyke et al. 2020; Ahumada et al. 2020), as shown in the median low-redshift SDSS quasar spectra in Figure 2. However, these low-redshift quasars at 0 ≤ z ≤ 1 clearly exhibit narrow [O iii] emission lines even if the quasars are bright (i.e., Lbol ≳ 1047erg s−1), and have a H β EW comparable to J0100+2802 (i.e., EW(H β ) =215 ± 2 Å). At higher redshifts, however, this situation changes. Vietri et al. (2018) study the rest-frame UV and optical spectra of 18 hyperluminous quasars at 2 ≲ z ≲ 4 and show that weak [O iii] emission is common in about 70% of their sample and is strongly correlated with large blueshifts in the C iv emission line, as also seen here for J0100+2802. In a similar study using 330 luminous quasars at 1.5 ≤ z ≤ 4.0 Coatman et al. (2019) confirm the observed anticorrelation between the [O iii] EW and C iv blueshifts, and find that a significant fraction of approximately 10% of their quasars exhibit very weak narrow [O iii] emission (i.e., EW <1 Å) as seen in J0100+2802, which is 10 times higher than among the lower-redshift and lower-luminosity SDSS quasars. Thus, the absence of narrow [O iii] emission in the hyperluminous quasar J0100+2802 could point toward evolutionary effects in the quasar spectra and might be a sign that the narrow-line region (NLR) around the quasar has already been cleared by strong quasar-driven winds on a relatively short timescale (Vietri et al. 2018; Coatman et al. 2019). Alternatively, it has been suggested recently that underluminous [O iii] emission in quasar spectra might be linked to a low gas content in the NLR of the quasar (Agostino et al. 2023). Upcoming additional rest-frame optical spectra of high-redshift quasars observed with JWST will be required to shed more light on the evolution of the NLR at high redshifts.

Figure 2. Median rest-frame optical quasar spectra from low-redshift (0 ≤ z ≤ 1) SDSS quasars, binned by the quasars' bolometric luminosity (left) or EW(H β ) (right). All spectra are normalized to unity at 5100 Å. The spectra show a clear decrease in the strength of the narrow [O iii] emission lines with increasing Lbol and decreasing EW. The quasar J0100+2802 is with a bolometric luminosity of  more luminous than any of the low-redshift SDSS quasars. However, low-redshift SDSS quasars with a similar EW(H β ) compared to J0100+2802 (i.e., EW(H β ) =215 ± 2 Å) exhibit clearly narrow [O iii] emission, which is not present in the spectrum of J0100+2802.
Download figure:
Standard image High-resolution image4. No Evidence for Strong Gravitational Lensing
All estimates of the SMBH mass rely on the assumption that the observed luminosity of the quasar is intrinsic to the quasar itself. If the quasar's luminosity was, however, magnified by a factor of μ due to strong gravitational lensing, the black hole masses would be overestimated by a factor of μγ (with γ ≈ 0.5; see Table 1).
Previous studies searched for multiple images of the quasar or deviations from a single PSF due to strong gravitational lensing effects based on high-spatial-resolution HST imaging, but have been unsuccessful. The observed quasar images are consistent with a single PSF indicating no evidence for multiple images or arcs with a spatial separation of the diffraction limit of θ ≈ 010, using the F850LP filter at a central wavelength of λ = 0.914 μm on HST's Advanced Camera for Surveys (Fujimoto et al. 2020; Yue et al. 2023).
The diameter of JWST's mirror is, at 6.5 m, nearly 3 times larger compared to the 2.4 m mirror of HST, which reduces the diffraction limit by a factor of 2 to θ ≈ 005 in the F115W filter at a central wavelength of λ = 1.154 μm. In the F200W (F356W) filter with a longer central wavelength λ = 1.989 μm (λ = 3.568 μm) the diffraction limit approaches θ ≈ 008 (θ ≈ 014). With the improved spatial resolution of JWST we will now readdress the question, whether we can find any evidence for strong gravitational lensing in this ultraluminous quasar by detailed modeling of the quasar's PSF.
4.1. PSF Modeling and Subtraction
Making use of the photutils package (Bradley et al. 2020), we build an effective PSF by means of the brightest stars in the quasar field in the respective filter. To this end, we first select stars by searching for peaks (≥30 MJy sr−1) in the stacked images, while excluding all peaks that belong to any extended sources rather than stars as well as stars too close (≤25) to the edge of our field of view. This results in five (three, four) stars for the F155W (F200W, F356W) filter from which we build an effective PSF model (Anderson & King 2000).
Note that since the spectral energy distribution (SED) of the quasar is much redder than the SED of stars, we expect small differences in the shape of the PSFs. However, we nevertheless obtain better results when modeling the PSF when building an effective PSF using stars in the field than when applying webbpsf, 11 which allows the user to input a quasar SED to construct a PSF model.
Leveraging the capabilities of psfMC, which performs 2D surface brightness modeling on astronomical images using an MCMC algorithm (Mechtley 2014; Marshall et al. 2021), we model the quasar as a single point source and find the best-fit PSF model to the quasar images. Note that psfMC requires a noise model for the effective PSF. To this end, we assume an S/N =100 of the effective PSF at each pixel with a fixed noise floor for all pixels below the 20th percentile of pixel values.
The results of the PSF modeling and subtraction are shown in Figure 3 for the three different NIRCam filters F115W, F200W, and F356W. The first column shows the quasar images, the second column shows our best-fit model, i.e., a single point source convolved with the PSF model, while the last column shows the residuals of the quasar after subtracting the PSF model. We do not find any evidence from deviations of a single PSF in any of the three filters.
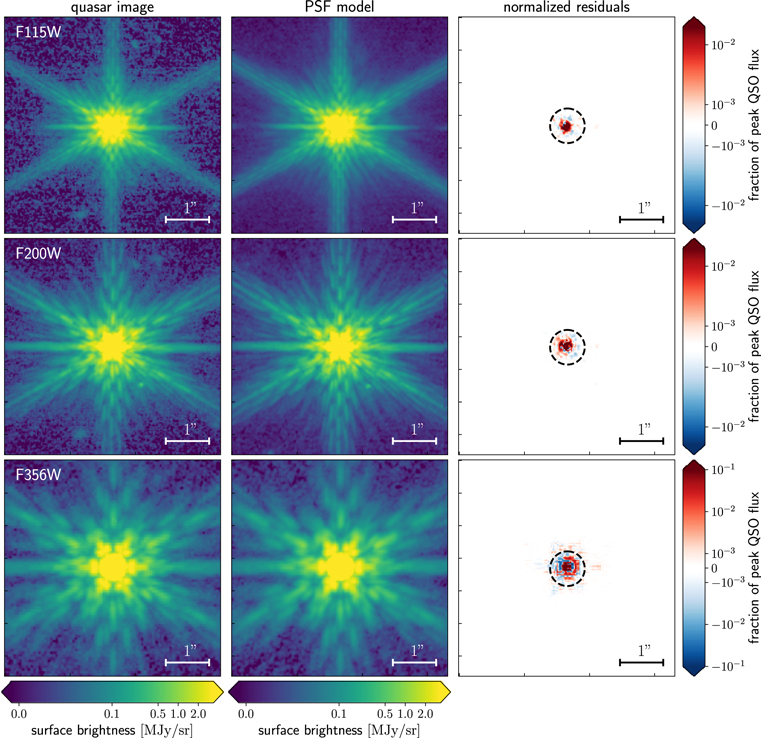
Figure 3. PSF modeling of the quasar images in the NIRCam filters F115W (top), F200W (middle), and F356W (bottom). The left columns show 5'' × 5'' cutouts of the quasars, the middle columns show the quasar model, i.e., a single point source convolved with the PSF model, while the right columns show the residuals of the quasar after subtracting the model, normalized by the peak pixel value of the quasar. The black dashed circle indicates the most probable image separation of Δθ ≈ 08 for a lensed source at the quasar's redshift (see Figure 4).
Download figure:
Standard image High-resolution imageIn order to further test whether we can find any evidence for a second quasar image, we repeat the modeling procedure and fit the quasar images with two PSFs instead of a single one. The best-fit parameters for the central pixels of the two models are less than 1 pixel (i.e., 003) apart, when the magnitudes of both images are approximately equal. Thus we do not find any evidence for two quasar images and conclude that any possible effects due to strong gravitational lensing of the source have to result in image separations of less than a couple of pixels, i.e., below the diffraction limit of θ ≈ 005.
4.2. Searching for a Foreground Deflector Galaxy
We also search for a possible deflector galaxy in the foreground of the quasar, which could cause the quasar to be gravitationally lensed. To this end, we search for any extended emission close to the quasar sightline, since we expect any low-redshift deflector galaxy to be spatially extended given the size distribution of low-redshift galaxies. In van der Wel et al. (2014), the authors report a median effective radius of R ≈ 1–4 kpc (R ≈ 3–6 kpc) for early-type (late-type) galaxies with a stellar mass of M⋆ ∼ 5 × 10¹⁰
M⊙ at redshifts 0 < z < 3, which corresponds to spatial extents of ∼01–0 (∼04–08).
We do not see any extended sources close to the quasar sight line in the NIRCam filters F115W, F200W, and F356W down to the 5σ maximum sensitivity of 28.7, 29.2, and 29.0 mag, respectively, in the deepest area of the mosaic around the quasar (Kashino et al. 2023). Furthermore, HST imaging in the filter F606W at an effective wavelength of λeff = 5776.43 Å, where the quasar's emission is heavily suppressed thanks to the intervening intergalactic medium acting as a natural bandpass filter, does not reveal any extended sources around the quasar sightline (Yue et al. 2023).
If a deflecting object would be right along our line-of-sight to the quasar, we would only be able to see the object in the images after subtracting the quasar's PSF, since the quasar would outshine all foreground objects. However, we do not see any significant extended emission around the quasar or nearby, even in the PSF subtracted residual images (right panels of Figure 3).
4.3. Probability for Strong Gravitational Lensing
We will now estimate the likelihood that the quasar is affected by strong gravitational lensing given the aforementioned constraints on the Einstein radius. We will use two models to describe the population of low-redshift deflector galaxies described in detail in Oguri & Marshall (2010) and Yue et al. (2022). Both models use singular isothermal spheres to describe the mass profile of the low-redshift deflector galaxies and parameterize the velocity dispersion function (VDF) of the deflectors with a Schechter function (Schechter 1976). However, the VDF applied in Oguri & Marshall (2010) is based on early-type galaxies derived from SDSS data (Choi et al. 2007), while the VDF in Yue et al. (2022) is based on both late- and early-type galaxies in the local universe (Hasan & Crocker 2019) and assumes a redshift evolution in the parameters of the Schechter function as suggested by Geng et al. (2021). Note that the model by Oguri & Marshall (2010) predicts a lower number of less massive galaxies compared to Yue et al. (2022), since the VDF is based on early-type galaxies only (see Figure 1 in Yue et al. 2022 for a comparison between the VDFs).
Making use of these VDFs of the low-redshift deflector galaxy population, we can built an analytic lensing model of the high-redshift lensed quasar population (Yue et al. 2022). We show the distribution of image separations of all lensed objects at the quasar's redshift of z = 6.327 in Figure 4. Both deflector models peak at approximately Δθ ≈ 08 indicating the most probable image separation. Based on the PSF modeling of the quasar in the JWST/NIRCam images described in the previous section we can constrain the maximum image separation to be below the diffraction limit. Thus, the fraction of lensed objects with image separation Δθ < 005 among all lensed objects at z = 6.327—which constitutes the probability that J0100+2802 is gravitationally lensed with an image separation below the diffraction limit—is P(Δθ < 005) ≈ 2.2 × 10⁻³ for the model by Yue et al. (2022), and P(Δθ < 005) ≈ 6.4 × 10⁻⁴ for the model by Oguri & Marshall (2010).

Figure 4. Distribution of the lensing separation Δθ for sources at the quasar's redshift zs = 6.327, predicted by the analytical model described in Yue et al. (2022) and Oguri & Marshall (2010, OM10). The diffraction limit obtained from the JWST/NIRCam F115W quasar image is shown as the dashed line.
Download figure:
Standard image High-resolution image
5. Summary and Discussion
In this article we present the rest-frame UV as well as the rest-frame optical spectrum at observed wavelengths between 0.6 μm ≤ λobs ≤ 2.3 μm and 3.1 μm ≤ λobs ≤ 4.0 μm, respectively, of the ultraluminous quasar J0100+2802 at a redshift of z = 6.327. The ground-based data consist of a total of 16.8 hr observed with the VLT/X-Shooter spectrograph and Magellan/FIRE, while the rest-frame optical data are observed with JWST/NIRCam in WFSS mode for a total of 9.7 hr on source.
We measure the mass of the quasar's SMBH based on the C iv, Mg ii, and H β emission line properties and find estimates that are consistent between the different line estimators within their systematic uncertainties of 0.5 dex, indicating an SMBH mass of M• ∼ 1010 M⊙. In the near future, larger samples of rest-frame optical spectra of high-redshift quasars will be able to confirm this long-questioned consistency in black hole mass measurements based on rest-frame UV and rest-frame optical emission line properties for a wider range of black hole masses and quasar properties.
We revisit the question whether the luminosity of this ultraluminous quasar is magnified due to strong gravitational lensing with the increased spatial resolution of the JWST/NIRCam images compared to previous HST images, and thus search for evidence for multiple images of the quasars or arcs in three different NIRCam filters, i.e., F115W, F200W, and F356W. We do not find any evidence from deviations of a single point source at the diffraction limit, nor do we find any evidence for a foreground deflector galaxy. We thus estimate the probability of J0100+2802 being affected by strong gravitational lensing with image separations below the diffraction limit to be ≲2.2 × 10⁻³ using two different models for the foreground galaxy population (Oguri & Marshall 2010; Yue et al. 2022).
Our results confirm that J0100+2802 indeed hosts an SMBH with M• ≈ 1010 M⊙ at z = 6.327, when the universe is only about 800 Myr old, which challenges our current understanding of black hole growth. It requires us to explore models beyond the standard black hole formation paradigm, such as for instance massive initial black hole seeds in excess of stellar remnants (e.g., Oh & Haiman 2002; Begelman et al. 2006), or radiatively inefficient black hole accretion episodes (e.g., Begelman & Volonteri 2017; Davies et al. 2019). JWST has ushered us into a new era for exploring the early universe. Future observations of high-redshift quasars will enable us to study the black hole masses for ensembles of quasars, understand their large-scale environments, and measure their luminosity functions to gain new insights onto the properties and origins of SMBH seeds, and their rapid growth at early cosmic times.
The authors would like to thank Paul Schechter for insightful discussions about gravitational lensing. Furthermore, we would like to Madeline Marshall for helpful discussions on the PSF modeling, and Gisella De Rosa for interesting discussions on quasar evolution.
This work is based on observations collected at the European Organisation for Astronomical Research in the Southern Hemisphere under ESO program 096.A-0095.
This paper includes data gathered with the 6.5 m Magellan Telescopes located at Las Campanas Observatory, Chile.
This work is based in part on observations made with the NASA/ESA/CSA James Webb Space Telescope. The data were obtained from the Mikulski Archive for Space Telescopes at the Space Telescope Science Institute, which is operated by the Association of Universities for Research in Astronomy, Inc., under NASA contract NAS 5-03127 for JWST. These observations are associated with program ID #1243. The specific observations analyzed can be accessed via doi:10.17909/xbs2-v060.
D.K. has been supported by JSPS KAKENHI grant No. JP21K13956.
Software: numpy (Harris et al. 2020), scipy (Virtanen et al. 2020), matplotlib (Hunter 2007), astropy (Astropy Collaboration et al. 2018), PypeIt (Prochaska et al. 2020), photutils (Bradley et al. 2020), psfMC (Mechtley 2014).
Footnotes
- 7
- 8
- 9
- 10
- 11