


Abstract
Visible light observations from the Wide-field Imager for Solar PRobe (WISPR) aboard the Parker Solar Probe (PSP) mission offer a unique opportunity to study the dust environment near the Sun. The existence of a dust-free zone (DFZ) around stars was postulated almost a century ago. Despite numerous attempts to detect it from as close as 0.3 au, observational evidence of a circumsolar DFZ has remained elusive. Analysis of WISPR images obtained from heliocentric distances between 13.3–53.7 R⊙ over multiple PSP orbits shows a gradually decreasing brightness gradient along the symmetry axis of the F-corona for coronal heights between 19 and 9 R⊙. Below 9 R⊙, the gradient reverses its trend, approaching the radial dependence exhibited at heights above 19 R⊙. After taking into account the effects of both the electron corona background and the nonresolved starlight, the WISPR observations down to 4 R⊙ are consistent with forward-modeling simulations of the F-corona brightness within [−6, 5]% if a circumsolar region of depleted dust density between 19 and 5 R⊙ enclosing a DFZ is considered. In addition, we show, for the first time, that the F-corona brightness inward of about 15 R⊙ depends on the observer's location for observing distances below 35 R⊙.
Export citation and abstract BibTeX RIS

Original content from this work may be used under the terms of the Creative Commons Attribution 4.0 licence. Any further distribution of this work must maintain attribution to the author(s) and the title of the work, journal citation and DOI.
1. Introduction
The zodiacal dust particles in orbit around the Sun scatter photospheric sunlight, forming the zodiacal light/F-corona. Although the particles are continually in motion and constantly evolving, the brightness produced by the scattered light is very stable (Leinert et al. 1981) as observed from the two Helios (Porsche 1981) spacecraft (S/C), which were in orbit about the Sun from 0.3 to 1 au, from 1974–1986 for Helios-A and from 1976–1980 for Helios B. Both the brightness stability and radial evolution of the brightness gradient were later confirmed by Stenborg et al. (2018a) using observations from the Sun-Earth-Connection Heliospheric Investigation Heliospheric Imagers (Howard et al. 2008; Eyles et al. 2009) during the first 6+ yr of the STEREO mission (Kaiser et al. 2008).
As a consequence of the drifting of particles toward the Sun due to the Poynting–Robertson forces and the consequent eventual sublimation that would remove all of the dust, a dust-free zone (DFZ) was postulated to exist around all stars by Russell (1929). In an analysis of the properties of quartz-like particles, Over (1958) calculated the outer limit of the DFZ at about 5 R⊙. Mukai & Schwehm (1981) showed that the heating of dust grains by collision with solar energetic particles, and the subsequent erosion by sputtering ejection, constitute another mechanism for mass erosion, which could then sublimate by thermal radiation inside of about 20 R⊙. A number of other different plausible mechanisms for the destruction of dust particles (under the generic term of rotational bursting) is discussed in Misconi (1993).
Searches for the existence of the DFZ at infrared wavelengths have been inconclusive. Mann et al. (2004) give a summary of the nearly 41 attempts to observe a signature of the DFZ in the 0.83–3.3 μm wavelength range. They grouped the attempts by wavelength, but no consistent conclusions could be drawn. The first comprehensive search for a DFZ in the visible range has been initiated with the advent of the observations from the Wide-field Imager for Solar Probe (WISPR; Vourlidas et al. 2016) on board the Parker Solar Probe (PSP; Fox et al. 2016) mission. Using WISPR observations from the first two solar encounters, Howard et al. (2019) reported the first observational evidence for a dust depletion zone (DDZ) starting at about 19 R⊙ and extending to at least 10 R⊙ (i.e., the inner limit of the WISPR field-of-view, FOV, during the first two orbits). The DDZ is a region where the radial dust density profile departs from its expected power-law behavior: R−n with n ≈ 2.3 (Leinert et al. 1981; Stenborg et al. 2018a). Stenborg et al. (2021b, hereafter Paper I) extended these results to shorter heliocentric distances with a comprehensive analysis of WISPR data from the first five PSP orbits. Their results verified that the brightness decrease did indeed depart from the established power law at about 19 R⊙ and showed that the decrease smoothly continued down to at least 7.5 R⊙—the WISPR inner FOV limit in the last orbit analyzed (Orbit 5). They modeled the DDZ brightness by imposing a linear multiplier to the expected extrapolated dust density profile, R−2.3, over the distance range from 19 to 3 R⊙. The DFZ was, however, not detected. We note that the above analyses, as well as the one here, were performed along the symmetry axis of the dust cloud.
In other PSP-based dust studies, Szalay et al. (2021) recently showed that the trajectory of PSP around its perihelion is passing through regions of variable dust density. In addition to the orbiting zodiacal dust particles, there are some regions of increased dust density, as for example, in the trails of short-period comets or asteroids (e.g., Stenborg et al. 2018b; Battams et al. 2020, and references therein), or in circumsolar rings nearby the orbits of Venus (Leinert & Moster 2007; Jones et al. 2013, 2017; Stenborg et al. 2021a) or Earth (e.g., Reach et al. 1995). Thus, the dust in the inner heliosphere exhibits inhomogeneities, which WISPR is able to detect.
The perihelia of the PSP orbits have decreased after successive Venus fly-bys, from the initial perihelion of ∼0.17 au (∼36 R⊙) in Orbit 1 to ∼0.062 au (∼13.3 R⊙) in Orbit 10. The evolution of the PSP orbit has allowed WISPR to image the F-corona at increasingly closer heliocentric distances, resulting in a unique set of measurements of the F-corona brightness profile, and by extension, of the circumsolar dust cloud. In this paper, we synthesize the observations from Orbits 7 through 10 to extend our earlier findings and hence reveal the structure of the dust cloud within the solar corona. The paper is organized as follows: we describe the observations in Section 2, and methodology and results in Section 3. Then, we present our interpretations of the results in Section 4 and discuss them in Section 5. We conclude in Section 6.
2. Observations
WISPR is the sole imaging instrument suite aboard the PSP S/C. WISPR consists of two telescopes (hereafter, WISPR-I and WISPR-O), with fixed angular FOVs of about 40° and 58°, and filter passbands of 490–740 nm and 475–725 nm, respectively. The imaging data is recorded with an Active Pixel Sensor (APS) detector (1920 × 2048 pixel2) on each telescope (Korendyke et al. 2013; Vourlidas et al. 2016).
In this work, we examine WISPR calibrated images from Orbits 6 through 10 (Table 1) acquired while PSP was within 0.25 au from the Sun (i.e., during the so-called PSP science solar encounters) to study the properties of the F-corona at short heliocentric distances, and hence shed light onto the dust density distribution near the Sun. The images were down-linked to Earth 2 × 2 binned (i.e., with a size of 960 × 1024 pixel2, which corresponds to a plate scale of 2 54 for WISPR-I and 339 for WISPR-O). The WISPR calibration procedures are described in Hess et al. (2021).
Table 1. Perihelion of PSP orbits
| Orbit | Perihelion | Perihelion | Perihelion | |
|---|---|---|---|---|
| (au) | (R⊙) | S/C Long. (°) | Date | |
| 6 | 0.0946 | [20.35] | 147.028 | 2020/09/27 |
| 7 | 0.0946 | [20.35] | 147.030 | 2021/01/17. |
| 8 | 0.0743 | [15.98] | 142.670 | 2021/04/29 |
| 9 | 0.0743 | [15.98] | 142.671 | 2021/08/09 |
| 10 | 0.0617 | [13.28] | 145.630 | 2021/11/21 |
Download table as: ASCIITypeset image
When the S/C is rolled to ecliptic north and pointed at Sun center (i.e., its nominal attitude during solar encounters), the WISPR-I (WISPR-O) FOV along the symmetry axis of the background scene
3
extends from about 13 5–535 (50°–108°) in solar elongation. Due to the high eccentricity of the PSP orbit, the apparent angular size of the solar disk varies with PSP heliocentric distance. Therefore, a particular elongation angle corresponds to different heliocentric distances as PSP orbits the Sun. To allow for easier comparison of brightness profiles taken from different distances, we normalize the elongation (in degrees) by the apparent angular solar radius at the time of the observation.
4
For illustrative purposes, Figure 1 shows a "normalized elongation"–time map of the brightness along the symmetry axis of the WISPR-I calibrated images obtained from PSP heliocentric distances between 0.25 au and perihelion in Orbit 9. The map clearly shows the change of the radial distances covered as the S/C moves along its orbit. For reference, the nominal FOV of WISPR-I at the location of the symmetry axis is reported for the perihelion distances of the first 10 PSP orbits and 0.25 au in Table 2.
5–535 (50°–108°) in solar elongation. Due to the high eccentricity of the PSP orbit, the apparent angular size of the solar disk varies with PSP heliocentric distance. Therefore, a particular elongation angle corresponds to different heliocentric distances as PSP orbits the Sun. To allow for easier comparison of brightness profiles taken from different distances, we normalize the elongation (in degrees) by the apparent angular solar radius at the time of the observation.
4
For illustrative purposes, Figure 1 shows a "normalized elongation"–time map of the brightness along the symmetry axis of the WISPR-I calibrated images obtained from PSP heliocentric distances between 0.25 au and perihelion in Orbit 9. The map clearly shows the change of the radial distances covered as the S/C moves along its orbit. For reference, the nominal FOV of WISPR-I at the location of the symmetry axis is reported for the perihelion distances of the first 10 PSP orbits and 0.25 au in Table 2.

Figure 1. Variation of the radial FOV along the symmetry axis of WISPR-I images obtained during the PSP solar Encounter 9; S/C within 0.25 au (∼53.7 R⊙) from the Sun. Perihelion at 0.074 au (15.93 R⊙) on 2021 August 9 at 19:22 UT. The map is displayed in logarithmic (base 10) brightness scale.
Download figure:
Standard image High-resolution imageTable 2. WISPR-I Nominal FOV (Elongation Range between 135 and 530) for PSP S/C at Perihelion of Each Orbital Group and at the End of the Nominal Science Encounters
| Orbits | Observer at | Inner Edge | Outer Edge | |
|---|---|---|---|---|
| R⊙ [au] | R⊙ | R⊙ | ||
| 10 | 13.28 | [0.0617] | 3.12 | 12.26 |
| 8,9 | 15.98 | [0.0743] | 3.76 | 14.77 |
| 6,7 | 20.35 | [0.0946] | 4.79 | 18.81 |
| 4,5 | 27.87 | [0.1296] | 6.57 | 25.78 |
| 1,2,3 | 35.68 | [0.1659] | 8.41 | 33.00 |
| 53.77 | [0.2500] | 12.67 | 49.74 | |
Download table as: ASCIITypeset image
The brightness, B, in a WISPR image is B = BF +BK +BG +BS , where BF , BK , BG , BS represent the F-corona, K-corona, diffuse galactic sources, and stray-light contributions, respectively. The latter includes the instrumental stray-light, and the star field. According to Hess et al. (2021), WISPR-I stray-light is negligible up to the S/C heliocentric distances covered in Orbits 1 through 5. We have reassessed the stray-light level of WISPR-I images obtained during Encounters 7 through 10 following the same approach detailed in Paper I and found that it remains negligible. The contribution of the variable galactic sources and the star field is localized (i.e., affects a limited number of pixels only), which makes them easily identifiable as outliers. Therefore, the modeling of the measurements of the brightness along the symmetry axis of the F-corona (Section 3) will simply reflect the sum of the F- and K-corona contributions; namely, B = BF +BK .
For most of the orbit, the F-corona signal dominates the scene across the WISPR images. However, the F- to K-corona ratio is reduced with decreasing PSP perihelion distances, as the WISPR-I FOV accesses lower heliocentric distances in the solar corona. Therefore, even with the F-corona signal dominating the scene at short heliocentric distances, there remains a noticeable, localized image-to-image brightness variation (see, e.g., Paper I). The variation arises from bright large-scale K-corona structures (e.g., streamers) that pass through the WISPR-I FOV as PSP moves in its orbit. This requires a careful analysis before interpreting the results (see Section 3.1.2).
Interestingly, the images from both WISPR telescopes exhibited an anomalous excess brightness in the inbound segments of the PSP solar Encounters 6 and 8, when the S/C was between about 90° and 140° ecliptic longitude. This is illustrated in Figure 2, where we show the median brightness of the calibrated images for the inner (continuous lines) and outer (dashed lines) WISPR telescopes as a function S/C longitude (left panel) and S/C radial distance (right panel) during the respective encounters. The excess brightness is extremely high in the inbound segment of Encounter 6 compared to Encounter 7, less intense in Encounter 8 compared to Encounter 9, and nondiscernible in Encounters 7 and 9. Note that Encounter 10 also seems to have also a very subtle brightness enhancement during the inbound segment, close to perihelion. Due to the detrimental effect that this anomalous brightness can have in our analysis, we opted to exclude all of Orbit 6 (Orbit 7 has the same orbital parameters as Orbit 6) and the inbound segment of Encounter 8. Presently, we are evaluating two alternative plausible explanations (not necessarily mutually exclusive) to explain the phenomenon (see the Appendix).

Figure 2. Median brightness of WISPR images acquired during the nominal science windows in Orbits 6 through 10 as a function of S/C longitude (left panel) and S/C heliocentric distance (right panel). The continuous (dashed) lines depict the values for the WISPR-I (WISPR-O) telescope.
Download figure:
Standard image High-resolution imageFigure 3 (left panel) shows the radial evolution of the aggregated measurements of the brightness B (K + F components) along the symmetry axis for all WISPR-I and -O images taken within 0.25 au for the orbits under analysis in a log–log representation. A zoomed-in view, restricted to distances below 15 R⊙, is shown in the right panel (the colors indicate the different orbits as shown in the inset label). At first glance, the brightness profiles from the individual images align well, regardless of the observer's distance. There is, however, a dependence when the observer gets below 15 R⊙ (this is indiscernible in the plot; see Section 3.1.1). There is also a noticeable discrepancy at the shortest heliocentric distances among the different encounters (see Section 3.1). The latter is due to the presence of discrete K-corona features (e.g., streamers or coronal holes) and/or the progression of K-corona transients in or across the symmetry axis of the images (see Section 3.1.2). The outlier measurements result from the passage of bright stars, planets, or extended galactic sources across the symmetry axis. Their effect is more noticeable toward the end of the FOV of the respective telescopes, where the relative contribution of the contaminating signal becomes more significant. The red and black lines, which appear practically superposed onto each other, delineate empirical models fitted to the measurements (details in Section 3).

Figure 3. Brightness measurements along the F-corona symmetry axis in WISPR images (both telescopes) during the solar encounters of PSP Orbits 7 through 10 (green dots, left panel). The right panel displays a zoomed-in view (x-axis restricted to heliocentric distances below 15 R⊙) with the measurements differentiated by encounter as indicated in the inset. An empirical modeling (Equation (1)) of the aggregated measurements of Orbits 1 through 5 (Paper I), and 7 through 10 is delineated with the black and red continuous lines, respectively. Both models are extrapolated down to 3.3 R⊙. The dashed lines delineate the extrapolation of the linear portion of the respective models.
Download figure:
Standard image High-resolution image3. Methods and Results
In Paper I, we determined the location of the symmetry axis of WISPR images from the first five orbits and robust-fitted 5 the corresponding aggregated brightness measurements in log–log space with a two-component model consisting of a linear and an exponential function (Equation (1)):

In this model, the linear term accounts for the linear behavior observed beyond about 20 R⊙ while the exponential term accounts for the change in the brightness gradient at shorter distances (see Figure 3).
For a proper comparison, we follow a similar approach and use Equation (1) to robust-fit the aggregated brightness measurements from the solar Encounters 7 through 10 (hereafter Model I). 6 To avoid border effects due to vignetting, we cropped the innermost elongation distance reached on each orbit by about 0.5 R⊙. The coefficients of Model I along with the coefficients from Orbits 1–5 are given in Table 3. The numbers in brackets indicate the 1σ error of the coefficients. Both models are overplotted in Figure 3 (continuous black—Paper I, and red—this paper, lines). The extrapolation to shorter heliocentric distances of the linear part of the models is depicted with the dashed colored lines.
Table 3. Coefficients of the Empirical Brightness Models BM of the Symmetry Axis of the F-corona (Equation (1))
| Orbits | Brightness | A0 | A1 | A2 | A3 | A4 |
|---|---|---|---|---|---|---|
| 1,2,3,4 | (F+K) | −0.256 | 1.071 | 6.143 | −7.413 | −2.286 |
| 7,81,9,10 | (F+K) | −0.282 [1.0e-4] | 1.026 [5e-4] | 6.503 [4.0e-3] | −7.420 [7e-5] | −2.286 [4e-5] |
Note. The numbers in brackets indicate the 1σ error of the coefficients. 1. Only outbound segment.
Download table as: ASCIITypeset image
Figure 3 shows that the brightness measurements as empirically modeled with data from Encounters 7 through 10 (red line) slightly deviate from the Paper I prediction (black line) as elongations shorten, a signature of a shallower brightness increase. (The blue dashed line is intended to guide the eye to better discern the effect.) The deviation can be quantified by computing the relative difference (in percent) between the empirically modeled brightness data sets (i.e., [BM (paper I)/BM (this paper) − 1] ∗ 100), which is displayed, up to to 60 R⊙, in the left panel of Figure 4. Beyond about 15 R⊙, the modeled measurements from Paper I are about 1.5% higher than the corresponding portion of the measurements in this work. A more noticeable, abrupt departure starts below about 15 R⊙. The ratio increases to about 7.5% at 7.65 R⊙ (indicated with the dashed vertical line), the shortest common height of all orbits. The addition of measurements at ever decreasing coronal distances gives more confidence to the modeling of the brightness measurements closer to the Sun (note in Table 3 the small 1σ error of the coefficients). A careful, naked-eye inspection of the modeled data from Encounters 7 through 10 in the log–log representation shown in the left panel of Figure 3 shows that the aggregated brightness measurements seem to flatten out for a short distance inward of 10 R⊙. This can be appreciated better when displaying the gradient of Model I (right panel of Figure 4, red curve). The gradient exhibits a relative maximum (i.e., a signature of an inflection point or "kink" in the modeled measurements) at about 9.5 R⊙. For comparison, the gradient of the modeled data as derived in Paper I is shown in black in Figure 4. Uncovering of the origin of this kink (i.e., the inflection point) in the modeled brightness data is an essential objective of this paper.

Figure 4. Left panel: relative difference between the empirical models obtained in Paper I (Encounters 1 through 5) and in this paper (Model I, Encounters 7 through 10), i.e., [BM (paper I)/BM (this paper) − 1] ∗ 100. Right panel: brightness gradient of the two empirical models. The dashed, black line delineates the extrapolation of the model from Paper I. In both panels, the vertical, dashed line indicates the closest distance covered in Orbit 5.
Download figure:
Standard image High-resolution image3.1. Residuals
To evaluate the goodness of Model I and elaborate on the causes of the differences between the measurements from different encounters, we first analyze the residuals, ρ, of the brightness measurements with respect to this empirical model. Each residual is expressed as a percentage, and computed as ρi = [Bi /BM (i) − 1] ∗ 100, where i makes reference to the individual residual, brightness measurement, and the value of the model evaluated at the time instance of the measurement, respectively.
As was seen from Helios (Leinert et al. 1981), the F-corona brightness is very stable, with no apparent solar cycle dependence among other possibilities. Stars and galactic sources are transitory in the pixels of the object and do not affect the entire radial profile (they are outlier measurements; see Figure 3). However, Figure 3 (right panel) does show that closer to the Sun, there is considerable variation from encounter to encounter. The K-corona component is one likely source for the observed differences. As seen from 1 au, the F- and K- brightness are equal between about 2 and 2.5 R⊙, with the K-corona brightness decreasing faster than the F-corona brightness at larger solar distances (e.g., van de Hulst 1947; Koutchmy & Lamy 1985). Recently, Boe et al. (2021) applied a novel inversion technique to 2019 solar eclipse data to disentangle the contribution of the K- and F-corona components and showed that during solar minimum, the F-corona might still be slightly brighter than the K-corona as low as 1.2 R⊙. In Paper I, we showed that the dust density profile increases at a lower rate below about 19 R⊙. Therefore, we expect an increasing contribution of the K-corona to the background signal as PSP perihelia are reduced and the WISPR-I instrument observes the corona closer to the Sun (e.g., Figure 1). The combined effect of a more intense K-corona signal and smaller dust density will affect the gradient of the brightness profile.
The effect of the K-corona variability, expected to be more noticeable at shorter heliocentric distances, and different among the encounters, can be visualized by looking at the residuals, ρ. Figure 5 shows these residuals, separated by solar encounter, with the brightness measurements from WISPR-I (WISPR-O) in light green (black). We note that:
- 1.Beyond about 20 R⊙, the residuals exhibit a 3σ resistant-mean that is slightly different from orbit to orbit (continuous red line), namely 2.16%, −0.36%, 0.56%, and −0.32% in Encounters 7, 8, 9, and 10, respectively. The dashed red lines delimit the ±3σ range (7%, 5%, 8%, and 6%, respectively). This reflects the slightly different average level of the K-corona signal at each orbit, which is primarily due to the relative location of the coronal streamers with respect to the symmetry axis of the F-corona. The higher residuals observed in all four encounters beyond about 50 R⊙ are coincident with the passage of the Milky Way throughout the largest elongations covered by the FOV of WISPR-O, where the contaminant effect is larger due to the lower F-corona signal. (The effect is also noticeable in WISPR-I during Encounter 10 starting at about 30 R⊙).
- 2.The residuals of WISPR-O measurements in Encounter 10 (bottom right panel, black dots) show (a) a strong excursion at the shortest distances (between about 17 and 23 R⊙), and (b) a deviation larger than −3σ below about 50 R⊙ (as in the other three encounters). The former is due to an overcorrection of the stray-light level of the outer detector when the S/C was below the closest distances reached in Orbits 8 and 9. 7 Since here we are interested in the brightness profile at the shortest elongations distances (WISPR-I), this overcorrection does not affect our results and hence is ignored.
- 3.Below about 15 R⊙, the WISPR-I measurements show a variability larger than 5% in all four cases, which becomes more pronounced at the shortest solar distances. This reflects the increasing influence of K-corona features as, e.g., streamers or coronal transients (this is addressed in more detail in Section 3.1.2).

Figure 5. Residuals of the brightness measurements along the symmetry axis of the F-corona (separated by solar encounter) with respect to Model I.
Download figure:
Standard image High-resolution image3.1.1. Effect of the Observing Location
The white-light observations from Helios (see, e.g., Leinert et al. 1981) showed that the brightness of the F-corona is independent of observing location, at least outward from 0.3 au. The WISPR observations from the first five PSP encounters allowed us to extend those findings down to 0.13 au in Paper I. Here, we extend the study to smaller observer distances.
Unlike all previous missions, the highly elliptical PSP orbit and progressively closer perihelia result in rapidly varying observing locations by a factor of four or more (e.g., from 0.3 au to 0.062 au in Orbit 10) within a week. The resulting WISPR-I brightness profile in Figure 3 represents the aggregation of measurements from a variety of distances and lines of sight. To investigate the effect of the observing location, we first minimize the effects of the transient sources (K-corona structures, extended galactic sources, and star field) and noise by applying a running 5th percentile smoothing filter to the aggregated measurements of Encounter 8 (outbound segment), restricted to heights >4.5 R⊙. We choose this encounter's segment as the baseline because the aggregated brightness profiles exhibit the lowest median brightness and hence the least K-corona influence of all four encounters (a more detailed description is provided in Section 3.1.2). We restrict the smoothing to heights >4.5 R⊙ to avoid bias by the scarcity of measurements below that height. The 5th percentile running filter removes the variability induced by noise or transient sources and hence establishes the baseline of nonvarying brightness, where the F-corona is the dominant component. Next, we robust-fit this baseline with the model defined by Equation (2):

which is just a modified version of the model defined by Equation (1) and is better suited for extrapolation to the closer distances reached in Encounter 10. Figure 6 displays the aggregated measurements from WISPR-I (green dots) during Encounters 8, 9, and 10 (here Encounter 7 is excluded because its perihelion was above 20 R⊙) and the modeled 5th percentile brightness level (in red). For Encounter 8, we include the measurements for the inbound segment to help understand the differences.

Figure 6. Baseline of nonvarying brightness as determined with WISPR-I Encounter 8 (outbound segment) measurements (in red). The green dots represent the brightness measurements along the symmetry axis of the F-corona in WISPR-I images during the respective encounters.
Download figure:
Standard image High-resolution imageThen, we compute the relative difference, Δ, expressed as a percentage (![${{\rm{\Delta }}}_{i}=[{B}_{i}/{B}_{5{p}_{i}}-1]\,\ast \,100)$](https://content.cld.iop.org/journals/0004-637X/932/2/75/revision1/apjac6b36ieqn2.gif) between the aggregated brightness measurements and the empirically modeled baseline of nonvarying brightness, B5p
, separately for the inbound and outbound segments of the three encounters shown in Figure 6 when the observer is below 35 R⊙. The distributions of the Δi
values from WISPR-I measurements are shown in Figure 7 for each encounter, and are grouped by the observer's distance range with different color labels as indicated in the insets. The left (right) panel shows the residuals for the inbound (outbound) segment. As mentioned in Section 2, the inbound segment of Encounter 8 was excluded from the analysis of the observed brightness due to the presence of an anomalous brightness excess that affected both telescopes simultaneously for observing locations between 90° and 140° longitude (see the Appendix). The effect is clearly noticed in the top-left panel by both the distribution of the residuals when the observer is below 18 R⊙ (black dots) and larger value in general—up to 20% compared to only 10% in the inbound segment.
between the aggregated brightness measurements and the empirically modeled baseline of nonvarying brightness, B5p
, separately for the inbound and outbound segments of the three encounters shown in Figure 6 when the observer is below 35 R⊙. The distributions of the Δi
values from WISPR-I measurements are shown in Figure 7 for each encounter, and are grouped by the observer's distance range with different color labels as indicated in the insets. The left (right) panel shows the residuals for the inbound (outbound) segment. As mentioned in Section 2, the inbound segment of Encounter 8 was excluded from the analysis of the observed brightness due to the presence of an anomalous brightness excess that affected both telescopes simultaneously for observing locations between 90° and 140° longitude (see the Appendix). The effect is clearly noticed in the top-left panel by both the distribution of the residuals when the observer is below 18 R⊙ (black dots) and larger value in general—up to 20% compared to only 10% in the inbound segment.

Figure 7. Relative difference of the brightness measurements, Bi
, with respect to a 5th percentile model, B5p
, assembled by orbital segment (i.e., ![${{\rm{\Delta }}}_{i}=[{B}_{i}/{B}_{5{p}_{i}}-1]\,\ast \,100$](https://content.cld.iop.org/journals/0004-637X/932/2/75/revision1/apjac6b36ieqn3.gif) ). The color labels indicate the measurements grouped by observing distance range, as indicated in the insets.
). The color labels indicate the measurements grouped by observing distance range, as indicated in the insets.
Download figure:
Standard image High-resolution imageA progressive increase of the relative differences Δi at shorter distances, regardless of the observer's location, is clearly noticed on all plots in Figure 7, save for Orbit 10, which exhibits a decreasing trend starting at about 10 R⊙ (this is addressed in Section 3.1.2). Moreover, the relative differences for distances below 15 R⊙ (Encounter 8, inbound segment excluded) decreases as PSP approaches the Sun (i.e., at the shortest elongation distances, the 5th percentile model is dominated by the observations obtained from the closest observing distances), the effect being less clear in Encounter 9. In other words, the farther WISPR-I is from the Sun, the more emission it records within 15 R⊙. Since the K-coronal brightness (Thomson scattering) does not have a strong dependence with the observer's location and does exhibit an increasing brightness gradient closer to the Sun (see Section 4.2), the drop-off of the residuals is simply due to the diminishing F-corona brightness. This rather expected but never observed before behavior and its interpretation are further pursued in Section 4. At larger distances (beyond about 20 R⊙), the relative differences do not exhibit any trend and remain below 5%. In brief, these plots demonstrate the first observational evidence that the white-light F-corona brightness below ∼15 R⊙ is not independent of the observer's location, when the observer is below about 35 R⊙ (0.16 au).
3.1.2. Effect of the Variability of K-corona Structures
The larger variability of the residuals observed in Figure 5 for distances below about 15 R⊙ can be better understood with the help of the plots in Figure 7. The 5th percentile model represents the baseline brightness of the F-corona plus the stationary, diffuse component of the K-corona. The increasing trend of the relative differences in Figure 7 at short elongations (i.e., below 15 R⊙) for all observer's locations ranges (save Encounter 10) is a signature of the increasing contribution of discrete K-corona structures (e.g., streamers) at shorter heliocentric distances. Unlike the previous encounters, Encounter 10 shows a decreasing trend below 10 R⊙. This is also the result of discrete K-corona structures, although not of pseudo-static features (coronal streamers) but of transients, such as coronal mass ejections (CMEs). Next, we address the particular situations for each orbit.
Encounter 8 (outbound segment) exhibits a uniform increase (no larger than 10%) for all observer's location ranges. This is likely due to the coincidence of the symmetry axis of the F-corona with a region depleted of coronal streamers during the time of the observations. In Figure 8 we display a couple of snapshots from the COR2 coronagraph on board the STEREO-A S/C, which, at the time, was observing along the same direction as WISPR-I. The dashed white line marks the symmetry axis of the F-corona as determined in WISPR-I images. The two images show the slow evolution of the large-scale structure in the patterns of the streamers. The symmetry axis of the F-corona happens to lie in the background region between them.

Figure 8. Snapshots of STEREO-A/COR2 observations during the PSP solar Encounter 8. The white dashed line delineates the location of the symmetry axis of the F-corona as determined on cotemporal WISPR-I images. For details see Section 3.1.2.
Download figure:
Standard image High-resolution imageAnother way to check for the presence or absence of K-corona structures is by inspecting a distance–time map of the residual signal after removing the 5th percentile model (i.e., the relative differences Δi ) for a slit at the location of the symmetry axis of the F-corona (as shown in Figure 1). Figure 9 shows these maps for Encounters 8, 9, and 10. Encounter 8 is shown in the left panel. We see that: (1) the inbound residuals are higher than in the outbound segment (the effect of the anomalous brightening), and (2) the outbound residuals are very low (and homogeneous) right after perihelion with no signatures of discrete structures (in contrast to the situation in Encounters 9 and 10; compare also the green and blue curves in the left panel of Figure 3).

Figure 9. "Normalized elongation"-time maps of the excess K-corona brightness (in percent) along the symmetry axis of the F-corona for Encounters 8, 9, and 10. For details, see Section 3.1.2.
Download figure:
Standard image High-resolution imageEncounter 9 measurements exhibit a more mixed pattern and larger relative difference than those in Encounter 8, in particular for the observer below 20 R⊙ (Figure 7, panels in middle row; and Figure 9, middle panel). Coronal streamers coincided with the symmetry axis of the F-corona during the encounter. The overlap obscures the effect of the dependence of the observer's distance on the F-corona brightness.
As revealed in Figure 7, Encounter 10, unlike the previous encounters, exhibits a marked decreasing trend of the brightness level in the outbound segment below 15 R⊙ for the observer beyond 18 R⊙. The inbound segment also shows a trend reversal, although not as marked as in the outbound segment. This is reflected in the corresponding distance–time map in Figure 9 (right panel). The region inside 19 R⊙ is characterized by low brightness measurements (region in purple), which occur right after the passage of a pair of CMEs (their signature is pointed out by the two pairs of arrows), which left a depleted coronal region behind them. Figure 10 shows snapshots of these CMEs in the FOV of WISPR-I.

Figure 10. Snapshots of a couple of CMEs in the FOV of WISPR-I during the PSP solar Encounter 10.
Download figure:
Standard image High-resolution imageIn summary, the observational analysis carried out with the help of the 5th percentile model allows us to conclude that the increased dispersion and encounter dependence of the brightness measurements below 20 R⊙ that we noticed in Figure 3 (left panel; see also Figure 5) reflects (1) the increased contribution of discrete K-corona structures in the region where the dust density has become depleted (Figure 7); (2) a slight brightness asymmetry between the inbound and outbound parts of the orbits due to the variability of K-coronal structures, in particular close to perihelion, where the K-corona signal is much stronger compared to the background F-corona (Figure 9); and (3) the effect of the observer's location on the brightness of the F-corona component (see also Figure 7). Beyond about 20 R⊙, the relative differences lie below 5% because of the negligible influence of the K-coronal brightness on the F-coronal signal at these larger distances.
4. Physical Interpretation
The analysis of WISPR images obtained during the PSP Encounters 7 through 10 confirms the initial findings of Paper I: the brightness profile of the combined K+F brightness along the symmetry axis of the F-corona departs, within 19 R⊙ of the Sun, from the expected trend measured between 1 and 0.3 au. In addition, we identify (1) a kink in the log–log representation of the brightness profile just below 10 R⊙ (Figures 3 and 4, right panel), and (2) an observer's dependence of the brightness level observed (Figure 7). In this section we offer a likely physical interpretation for these observational findings.
At small heliocentric distances (<5 R⊙), the brightness from coronal electron scattering is expected to be comparable to that from the dust scattering (e.g., Figure 5 in Hayes et al. 2001). Therefore, to properly account for the brightness contribution of the electron corona to the observed brightness and shed light into the observational findings, we model the expected F- and nonvarying K-corona brightness profiles in Sections 4.1 and 4.2, respectively, and compare them against the WISPR observations in Section 4.3.
4.1. Forward Modeling of the F-corona Brightness
We follow the forward-modeling approach detailed in Section 3.2 of Paper I. Briefly, we forward-model the brightness measurements along the symmetry axis of the F-corona as resulting from scattering by dust particles with a density profile Nd (r) given by

where C0 is a constant, r denotes the heliocentric distance of the dust particles along the line of sight (LOS), and λ(r, m)
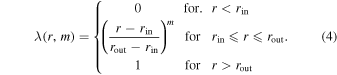
The multiplier λ(r, m) is an ad hoc factor to characterize the dust density decrease in the DDZ, with a rate of m (0.5 ≤ m ≤ 1.5). In Paper 1, we used a linear rate, i.e., λ(r, m = 1), with rin = 3 and rout = 19 to match the brightness measurements down to 7.65 R⊙. In this work, we vary m to study the effect of different density decrease rates within the DDZ.
For an observer at Robs solar radii from the Sun, the LOS F-corona brightness BF at any given elongation angle, ε, is

where Φ(Robs, θ(x)) represents the volume scattering function (VSF)
8
as defined in Lamy & Perrin (1986), which depends on the scattering angle, θ, and includes the observer's position, Robs, dependence. Nd
is the particle density along the LOS at the heliocentric distance, r. The integration is performed over the LOS, dx, from the observer's location up to infinity. As in our previous work, the simulation is carried out with the Raytrace package (e.g., Thernisien & Howard 2006, and references therein).
9
Φ(Robs, θ(x)) includes an empirical factor ( ) to account for the varying observer's distance, only validated between 0.3 and 1 au, which lies beyond the distances considered here. In spite of this hindrance, we assume the Φ(Robs, θ(x)) as valid to understand the effect of the different free parameters of the ad hoc functional form of the multiplier, λ.
As discussed previously, the FOV of the WISPR telescopes varies considerably during a PSP encounter. Hence, the empirically fitted brightness profiles reflect the cumulative effect of observing dust scattering from different distances. To help decouple the effects of the observer's location, the DDZ extent, and density depletion rate on these profiles, we turn to Equation (5) to simulate brightness profiles for various cases. Namely, we derive profiles for the LOS between 10° and 50° elongation for an observer at [16, 18, 20, 25, 30, 35, 40, 50, 60] R⊙ assuming:
- 1.DDZ from 19 R⊙ (the value determined in Paper I) to [5,6,7] R⊙ (i.e., inside the region delimited by the location of the inflection point in the right panel of Figure 4), and
- 2.dust density profile given by Equation (3) with a linear density decrease within the DDZ, λ(r, m = 1).
The resulting simulated F-corona brightness profiles for the case of a DDZ zone ending at 7 R⊙ are shown in the left panel of Figure 11 to highlight the dependence of the F-corona brightness on the observer's location. Each profile is limited to the WISPR-I FOV coverage at each observer's distance instance, and truncated to 30 R⊙ for clarity. Note that all profiles tend to match (profiles in blue) when the observer is beyond 35 R⊙.

Figure 11. Left panel: simulated brightness profiles of the F-corona along its symmetry axis (Equation (5)) for an observer at various heliocentric distances (see inset) considering a dust density profile given by Equation (3) with a DDZ between 7 and 19 R⊙ (Equation (4)). Right panel: same as left panel for a DDZ between between 7 and 19 R⊙ (in black) and 5 and 19 R⊙ (in red); the observing distance is unmarked to highlight the effect of the DFZ size.
Download figure:
Standard image High-resolution imageTo show the effect of the DDZ size, we compare the simulated brightness profiles for DDZ inner boundaries, 5 R⊙ (red) and 7 R⊙ (black), in the right panel of Figure 11. We limit the plot to within 20 R⊙ to highlight the differences in the profiles. We notice that, below about 15 R⊙ the overall brightness decreases as the DDZ gets smaller. We also see that the profiles exhibit a kink where the inner limit of the DDZ is imposed. Beyond 15 R⊙, the profiles tend to match (the effect of the innermost limit of the DDZ becomes less relevant).
Next, we examine the effect of the dust depletion rate by modifying the functional form of the multiplier λ(r, 0.5 < m < 1.5). Three illustrative density profiles (m = [0.9, 1.0, 1.1]) are shown in the left panel of Figure 12, normalized to the intensity at Rout = 19 R⊙ (the beginning of the DDZ). For each rate, we consider three DFZ sizes, Rin = [5, 6, 7] R⊙ (solid, dashed, and dotted–dashed lines, respectively). On the right panel, we plot the simulated profiles for m = 0.9 (red) and m = 1.1 (blue) for the DFZ at 5 R⊙ and the observer at [16, 20, 25, 30, 35] R⊙. The plot shows the expected overall brightness decrease with sharper depletion rates (larger m). It also shows that the effect becomes more pronounced at smaller distances and for observers closer to the Sun. In other words, the effects of the dust depletion on the brightness profiles are noticeable only from small elongations and small distances to the Sun (Figures 11 and 12).

Figure 12. Left panel: effect in the dust density profile of (1) the dust depletion rate (exponent m in Equation (4), color label as indicated in the inset) and (2) DDZ extent (continuous, dashed, and dotted–dashed lines). Right panel: simulated brightness profiles for m = 0.9 (in red) and m = 1.1 (in blue) assuming a DDZ between 19 and 5 R⊙ for an observer at [16, 20, 25, 30, 35] R⊙.
Download figure:
Standard image High-resolution image4.2. Forward Modeling of the K-corona Brightness
The K-corona brightness results from the LOS integration of the photospheric light scattered by the free electrons in the corona. The physical mechanism is Thomson scattering (e.g., Billings 1966). Therefore, the brightness, BK , at each elongation angle, ε, recorded from a given observing distance, Robs, is given by

where Ck is a constant, Ne (r(x)) is the electron density at a point in the corona, P( r ) (r being the heliocentric distance of the point), and ϕ(θ(x), r(x)) is a geometric function of the point at r and of the angle θ. The latter is the angle subtended between LOS and the line joining the Sun center to a point along the LOS. Similarly to the F-corona case (Section 4.1), the integration is performed along the LOS, dx, from the observers location up to infinity, and is computed with the Raytrace package. Raytrace allows us to simulate different coronal structures at different locations along the LOS by considering a variety of density profiles. By choosing a particular electron density distribution, one can model the K-corona brightness originating from various coronal structures along the LOS. For instance, Thernisien & Howard (2006) used Raytrace to model the three-dimensional nature of a coronal streamer as observed with the SOHO/LASCO coronagraphs.
Here, we are interested in modeling the nonvarying K-corona background across a large range of heliocentric distances. To that aim, we choose the electron density model from Leblanc et al. (1998). The model provides the electron density between 1.8 R⊙ and 1 au scaled to the electron density at 1 au. Therefore, to examine the effect of the observer's distance on the brightness of the nonvarying K-corona, we simulate the K-corona brightness profiles, hereafter  ), for the same set of observer distances as in the left panel of Figure 11, each profile restricted to the normalized elongation range covered by WISPR-I at the corresponding S/C distance instance. The resulting profiles are plotted in the left panel of Figure 13 in log–log scale. We notice a very subtle drift of the K-corona brightness level of each profile as the observer's gets closer to the Sun. This can be better seen between 10–20 R⊙, where the majority of observer distance instances contribute to the brightness (right panel of Figure 13). We notice that the brightness variation is smaller than in the F-corona case (compare to Figure 11).

Figure 13. Right panel: simulated brightness profiles of the nonvarying K-corona along the symmetry axis of the F-corona (Equation (6)) for an observer at various heliocentric distances (see inset) considering an electron density profile as given by Leblanc et al. (1998). Left panel: zoomed-in version in semi–log scale to better appreciate the subtle drift of the brightness level of each profile as a function of observer's distance.
Download figure:
Standard image High-resolution image4.3. Real versus Simulated Observations
The brightness simulations were performed for a discrete set of Sun-observer distances to help understand the effects of (1) the extent of the DDZ zone and depletion rate, and (2) the observer's heliocentric distance (Section 4.1), and hence interpret the brightness of the F-corona signal. They are also an item to examine the effect of the nonvarying K-corona signal on the observed brightness as the observer gets closer to the Sun (Section 4.2).
The actual WISPR-I measurements cover a much denser distance space (Figures 3, 5, and 7). Therefore, for a proper comparison, we ran the simulations for both the F- and K-corona brightness for an observer at the heliocentric distances of the PSP S/C at the time of each WISPR-I image in Encounter 10 (as representative of the full set of measurements) for each set of parameters used in the analyses above.
As an example, Figure 14 (left panel) shows the simulated F-corona brightness measurements (black dots) for a DDZ zone between 19 and 5 R⊙ and m = 1. The set of measurements corresponding to each observing distance (i.e., each brightness profile) is restricted to the corresponding normalized elongation covered by the WISPR-I FOV. As in Figure 11, the simulated profiles show a much larger spread than the observations at any given distance 10 (compare to Figure 3). To reduce the spread, we apply a running median filter to the simulated measurements extended up to 80% of the innermost distance covered in Encounter 10 (green dots) to reduce the bias that might arise from the scarcity of data at small distances, and robust-fit them with Equation (1) (red continuous curve; hereafter, the simulated F-corona brightness, BF ). The dashed, red line in Figure 14 delineates the trend of BF from beyond 20 R⊙.

Figure 14. Raytrace simulated brightness measurements along the symmetry axis of WISPR-I images for an observer at the heliocentric distances of the PSP S/C at the time of each image in Encounter #10. Left panel: F-corona (Equation (5)), considering a DDZ region between 19 and 5 R⊙ and m = 1 (black dots). The green dots depict the simulated F-corona measurements extended to 0.8 of the nominal inner limit of the FOV, and the red, dashed line depicts the trend of the measurements beyond 20 R⊙ to lower heights. Right panel: K-corona (Equation (6)), considering an electron density model as given by Leblanc et al. (1998; green dots). The red and black continuous curves in the respective panels delineate the fit of the simulated measurements with Equation (1), and the black, dashed lines depict the innermost coronal heights observed during Encounter 10.
Download figure:
Standard image High-resolution imageCorrespondingly, Figure 14 (right panel) shows the simulated K-corona brightness profiles,  (green dots). Each profile is restricted to the normalized elongation range that is covered by the FOV of WISPR-I images at the location of the symmetry axis of the F-corona at each time instance in Encounter 10. The black line is the fit to the simulated points with Equation (1), hereafter
  . For comparison, we also plot the coronal brightness estimated with the Saito-Poland-Munro model (Saito et al. 1977), which was determined near solar minimum in the equatorial region for an observer at 1 au and is only valid up to 6 R⊙ (hereafter
  red dashed line).
In Figure 15 (left panel), we compare BF (in red) against the observed F+K nonvarying brightness, B5p (in black). We notice that the simulated brightness profile lies below the observed one beyond 20 R⊙, and below 10 R⊙. B5p includes (1) the contribution of the circumsolar dust near Venus' orbit (Leinert & Moster 2007; Jones et al. 2013, 2017; Stenborg et al. 2021a), whose projection on WISPR-I images happens to lie along the symmetry axis of the F-corona, 11 and (2) the diffuse galactic background and integrated, nonresolved starlight. We compute an estimate of the brightness deficiency Bd in BF compared to B5p by minimizing the standard deviation of the difference of the two models. The value we obtain, Bd = 7 × 10⁻¹³ MSB, is of the order of the galactic background and nonresolved starlight estimate by Jackson et al. (2010). In Figure 15 (middle panel), we show in red the BF profile corrected with the additive term Bd to account for the effect of these two plausible sources and hence align both profiles beyond 20 R⊙.

Figure 15. Empirically modeled, F+K nonvarying brightness along the symmetry axis of WISPR-I images (B5p
, in black) compared to (1) the empirical model of the Raytrace simulated F-corona brightness profiles assuming a DDZ between [5,19] R⊙ and m = 1, BF
(left panel); (2) BF
corrected by the starlight level, Bd
(middle panel); and (3) BF
further corrected by the empirical model of K-corona brightness profiles as computed with Raytrace simulations considering the electron density model in Leblanc et al. (1998),  (right panel).
Download figure:
Standard image High-resolution imageThe brightness deficiency below 10 R⊙ is due to the absence of a K-corona component in the simulations. To account for that, we add the simulated nonvarying K-coronal brightness profile,  , to the corrected BF
. We, thus, obtain a model of the nonvarying K+F signal, which is displayed in red in Figure 15 (right panel). At the resolution of the plot, we notice a good agreement down to about 4 R⊙. Below those distances,
, to the corrected BF
. We, thus, obtain a model of the nonvarying K+F signal, which is displayed in red in Figure 15 (right panel). At the resolution of the plot, we notice a good agreement down to about 4 R⊙. Below those distances,  takes over.
We use the Pearson correlation coefficient, CP
, and the relative difference (in percent), between B5p
and  (hereafter BFdK
) to assess the discrepancy between them. We calculate CP
for two cases: (1) for the full distance distance range displayed in Figure 15 (right panel): CP
= 0.977, and (2) for the distance range ≥4.0 R⊙: CP
= 0.999. Figure 16 (left panel) plots B5p
against BFdK
along with the line where CP
= 1 (red dashed line). Furthermore, in Figure 16 (right panel), we display the relative difference between them (i.e., [BFdK
/B5p
− 1] ∗ 100). The plot shows that the deviation from one another is within [−6, 5]% beyond about 4 R⊙. All other simulation runs carried out with a different inner boundary of the DDZ (i.e., 3, 4, 6, and 7 R⊙) resulted in a discrepancy to the 5th percentile model that exceeds ±6%.
(hereafter BFdK
) to assess the discrepancy between them. We calculate CP
for two cases: (1) for the full distance distance range displayed in Figure 15 (right panel): CP
= 0.977, and (2) for the distance range ≥4.0 R⊙: CP
= 0.999. Figure 16 (left panel) plots B5p
against BFdK
along with the line where CP
= 1 (red dashed line). Furthermore, in Figure 16 (right panel), we display the relative difference between them (i.e., [BFdK
/B5p
− 1] ∗ 100). The plot shows that the deviation from one another is within [−6, 5]% beyond about 4 R⊙. All other simulation runs carried out with a different inner boundary of the DDZ (i.e., 3, 4, 6, and 7 R⊙) resulted in a discrepancy to the 5th percentile model that exceeds ±6%.

Figure 16. Left panel: correlation plot (in blue) between B5p
(i.e., the nonvarying K+F brightness level as modeled from WISPR observations) and BFdK
(i.e., the simulated F-corona brightness model, BF
, corrected by both starlight, Bd
, and the modeled nonvarying K-corona brightness,  ). The dashed red line depicts the line where the Pearson correlation coefficient equals 1. Right panel: relative difference (in percent) between BFdK
and B5p
, i.e., [BFdK
/B5p
− 1] ∗ 100.
). The dashed red line depicts the line where the Pearson correlation coefficient equals 1. Right panel: relative difference (in percent) between BFdK
and B5p
, i.e., [BFdK
/B5p
− 1] ∗ 100.
Download figure:
Standard image High-resolution image4.3.1. On the Presence of a "Kink" in the Empirically Modeled Brightness Measurements
In Figure 17 (left panel), we show the profile of the gradients of BF
(dashed red line), BFdK
=  (continuous red line), and B5p
(black line). The inflection point that is present at about 9 R⊙ in the empirically modeled K+F nonvarying profile (see also Section 3 and Figure 4) is manifested at 5 R⊙ for BF
(red, dashed–dotted vertical line). This corresponds to the inner edge imposed for the DDZ in that simulation. To examine the influence of the K-corona signal on the B5p
brightness profile, we display in Figure 17 (right panel) the gradient of
(continuous red line), and B5p
(black line). The inflection point that is present at about 9 R⊙ in the empirically modeled K+F nonvarying profile (see also Section 3 and Figure 4) is manifested at 5 R⊙ for BF
(red, dashed–dotted vertical line). This corresponds to the inner edge imposed for the DDZ in that simulation. To examine the influence of the K-corona signal on the B5p
brightness profile, we display in Figure 17 (right panel) the gradient of  , which exhibits a monotonic decrease toward the Sun (i.e., the signature of a steeper brightness increase as the LOS covers closer solar distances). Since the nonvarying K-corona brightness increase does not show an inflection point, adding a K-coronal component simply shifts the inflection point toward larger distances (at about 8 R⊙, as indicated with the vertical, dashed red line in the left panel of Figure 17) and makes the slope of the gradient more similar to that of B5p
.
, which exhibits a monotonic decrease toward the Sun (i.e., the signature of a steeper brightness increase as the LOS covers closer solar distances). Since the nonvarying K-corona brightness increase does not show an inflection point, adding a K-coronal component simply shifts the inflection point toward larger distances (at about 8 R⊙, as indicated with the vertical, dashed red line in the left panel of Figure 17) and makes the slope of the gradient more similar to that of B5p
.

Figure 17. Left panel: brightness gradient of (1) BF
(dashed red line), (2) BFdK
(continuous red line), and (3) B5p
(black line). The three vertical dashed lines in green point out the relative maximum of each gradient (i.e., the location of the inflection point in the respective model). Right panel: brightness gradient of  . The vertical dashed line in blue (both panels) marks the inner limit of the distance range where the error between B5p
and BFdK
is bounded between −6% and 5% (see the right panel of Figure 16).
. The vertical dashed line in blue (both panels) marks the inner limit of the distance range where the error between B5p
and BFdK
is bounded between −6% and 5% (see the right panel of Figure 16).
Download figure:
Standard image High-resolution imageAs demonstrated by the forward-model simulations, the F-corona brightness profile exhibits a kink at the inner boundary of the DDZ when the observer is sufficiently close to the Sun. The contribution of the K-corona to the LOS integrals, however, smooths and raises this inherent property of the F-corona brightness profile to higher distances.
4.3.2. On the Effect of the Observing Location
In Section 3.1.1, we showed that the aggregated K+F WISPR brightness depends on the distance from which the observations are taken (Figure 7). The analysis in Section 4.1 revealed that the observed F-corona brightness manifests a clear dependence on the observing distance for elongation distances within the DDZ (i.e., <19 R⊙) when the observer is within 35 R⊙ from the Sun.
We were amazed that the observations showed such a clear dependence on the observer's distance. As seen in Figure 7, different orbits show slightly different distributions of the relative differences, which we attribute to contamination from various sources with different behavior in either or both the inbound and outbound portions of the perihelion pass. These contaminants were mainly associated with discrete K-coronal structures. Here, we show the same types of analyses for the F- and the nonvarying K-corona brightness models, which demonstrate their pristine nature without the contamination from discrete structures. This pristine nature was rather clear in the observations taken during the outbound segment of Encounter 8 (i.e., the one with the smallest presence of discrete K-corona structures; Section 3.1.2). In the following, we briefly explore the dependence of the forward-modeled brightness measurements with and without the nonvarying K-corona component (i.e., BF + Bd and BFdK , respectively) similarly to Section 3.1.1.
Figure 18 (left panel) shows the relative difference (in percent) between the simulated F-corona brightness measurements corrected for starlight (i.e., BF + Bd ) and the nonvarying K+F brightness level as modeled with WISPR observations (i.e., B5p ). We note that for elongation distances within the DDZ (<19 R⊙), the brightness level depends on the observer's location and exhibits a clear trend. The large brightness deficiency observed at short elongations is due to the dust depletion as the LOS approaches the end of the DDZ (and the beginning of the DFZ). This would be the brightness profile if there were no electron corona.

Figure 18. Relative differences of the brightness simulations with respect to the observational 5th percentile model, B5 p, assembled by orbit segment. The color labels indicate the measurements grouped by observing distance range, as indicated in the insets. Left panel: for the F-corona modeled brightness corrected by starlight. Right panel: for the F-corona modeled brightness corrected by starlight and the nonvarying K-corona background as estimated with the density model defined in Leblanc et al. (1998).
Download figure:
Standard image High-resolution imageThere is, however, an electron corona. When we add a background electron density profile as given by Leblanc et al. (1998), we obtain the results displayed in Figure 18 (right panel). Note that the trend due to the observing distance remains, but the extreme drop-off shown in the left panel is no longer present. Indeed, this pristine pattern resembles the pattern of the WISPR observations shown in Figure 7. The one difference is the variable levels of increasing brightness among the different encounters below 15 R⊙ in Figure 7, which we attributed to the effect of K-corona structures like streamers (a full simulation of the three-dimensional K-corona is beyond the scope of this study). From the comparison between the two panels in Figure 18, we note that that the nonvarying K-corona background is too small to completely account for the large signal increase at the elongations closest to the Sun, as shown in the right panel of Figure 7 (our simulated nonvarying K-corona brightness does not include discrete K-coronal structures structures).
5. Discussion
Thanks to the PSP orbit design and the progressive imaging of the F-corona from varying viewpoints, with an inner FOV dipping deeper into the solar corona, we were able to accumulate hundreds of thousands of data points across a large swath of heliocentric heights starting at about ∼3.5 R⊙. The F-corona brightness profile along its symmetry axis from early PSP orbits (Orbits 1–5) was inconsistent with inward extrapolations of the brightness (and therefore, dust density) profiles established with Helios data. The WISPR-I measurements indicated that noticeable dust depletion starts at about 19 R⊙ (Howard et al. 2019; Stenborg et al. 2021b), a necessary condition for a DFZ to exist, as predicted theoretically by Russell (1929), but never definitively confirmed (see, e.g., Mann et al. 2004). The inconsistency continued in the data from Orbits 7 through 10, to the point that a DDZ with a well-defined DFZ boundary is required to account for both the turnover of the brightness at smaller coronal heights and the trends seen from varying observing distances. By taking into account the brightness of the nonvarying K-corona background, we were able to estimate the boundaries of the DDZ assuming an ad hoc model for the density depletion inside this region, as follows.
The low perihelia of Orbits 7 through 10 allowed WISPR to access the region of space where the effects of dust grains getting very close to the Sun become observable. In general, the imaging LOSs are long and one should always be wary of "contamination" by contributions of structures unrelated to the dust. We identified two such "contaminants": the K-corona and nonresolved starlight. K-corona structures, both streamers and CMEs, are responsible for the increased brightness and short-term variability at low coronal heights. The effect of the short-term variability was minimized by empirically modeling the nonvarying brightness background. For a proper comparison of the observed and simulated brightness profiles, we added to the simulated F-corona brightness (1) a proxy of the stationary, background K-corona signal (estimated using the model defined in Leblanc et al. 1998), and (2) an empirical estimate of the excess brightness most likely attributed to the diffuse galactic background and nonresolved starlight (hereafter, we refer to the last two sources, generically, as nonresolved starlight).
The interpretation of the WISPR-I brightness relies on brightness simulations of photospheric light scattered by dust particles orbiting around the Sun (Section 4.1) and by the free electrons in the corona (Section 4.2). The former relies on a VSF (Lamy & Perrin 1986), empirically determined from >0.3 au observations, and on a given dust density distribution along the symmetry axis of the dust cloud (Leinert et al. 1981); the K-corona brightness arises from Thomson scattering. The DDZ is modeled with a dust density radial profile assumed to evolve according to Equations (3) and (4). The upper limit of the DDZ was defined as the distance where the measurements departed from the expected power law R−2.3 (see Paper I and references therein), and the inner limit was determined empirically to match the observations within [−6, 5]%. As noticed, the rate of depletion of the dust beginning at the outer limit of the DDZ is one of the areas of uncertainty. The PSP solar Encounters 8 through 10 have occurred over about only 1 yr. In our analyses, we have found that the observed brightness can be explained by this very simple, steady-state model of dust depletion. But that is very empirical (based on an ad hoc model), and could certainly change with time. The determination of the final distance where the last grains of dust disappear could very well change from year to year if not from month to month. Therefore, the estimation of the boundaries of the extent of the DFZ is subject to the above assumptions.
To first order, the good agreement of the empirical modeling of the median-filtered brightness simulations including the additions of a nonvarying K-corona background and nonresolved starlight brightness with the WISPR observations down to 4 R⊙ provide confidence in our estimation of the boundaries of the DDZ (and hence extent of the DFZ). It is still conceivable, however, that variations in the dust composition and/or dust scattering properties close to the Sun could explain the observed profiles. Therefore, further theoretical work on the dust chemistry would be welcomed. Below 4 R⊙, the K-corona dominates, which makes it difficult to disentangle it from the F-corona. As PSP gets closer to the Sun in future orbits, we may be able to improve the constraints on the dust depletion model and hence determine more precisely the inner boundary of the DDZ. At the moment, an inner boundary at ∼5 R⊙ (rather than 3, 4, 6, or 7 R⊙) resulted in the least relative difference to the WISPR empirically modeled brightness measurements of the nonvarying signal.
We should point out that the effect of the diffuse K-corona background in WISPR-I observations below 4 R⊙ is unsurprising. The K-corona becomes comparable to the F-corona at around 2.5 R⊙, based on 1 au observations (e.g., van de Hulst 1947; Koutchmy & Lamy 1985). Its effect should manifest itself at larger distances if a DFZ is present, as we postulated during the formulation of the WISPR investigation (Figure 7 Vourlidas et al. 2016). Indeed, we notice its effect at about 4 R⊙ (see Figure 15, right panel).
These results can perhaps explain (in hindsight) the slight gradient changes in various observations from 1 au of the visible brightness of the F-corona/zodiacal light summarized in Figure 1 of Kimura & Mann (1998). At about 20 R⊙, a slight decrease in the slope of the intensity profile versus elongation is evident. This corresponds approximately to the outer boundary of the DDZ. Then at about 4–6 R⊙, a slight increase in the slope is seen, which corresponds to the inner boundary of the DDZ (and hence beginning of the DFZ). These subtle changes in slope were easy to be ignored and not recognized as significant observations of the DFZ. They could easily have been explained as a calibration problem.
Finally, in an analysis of the dynamics of sublimating dust particles that radially drift toward the Sun, Kobayashi et al. (2009) suggested that a circumsolar dust ring of enhanced density would occur just outside the sublimation zone. Our measurements did not reveal any signature that could be related to such a circumsolar ring of enhanced dust density.
6. Conclusions
We explain the nonvarying component of the WISPR-I brightness profiles along the symmetry axis of the F-corona during the solar Encounters 7 though 10 as resulting from the sum of (1) a K-corona contribution estimated by forward-modeling simulations considering an empirical electron density model as defined in Leblanc et al. (1998); (2) excess brightness due to nonresolved starlight; and (3) F-corona brightness obtained by forward-modeling simulations of a dust cloud with a dust depletion zone between ∼19 and ∼5 R⊙, and a dust-free zone below 5 R⊙. The modeling based on these assumptions accounts for the measurements as close as 4 R⊙ with an uncertainty between −6% and +5% for observer distances between 13.3 and 53.7 R⊙ (0.062–0.25 au).
In a nutshell, our investigation allowed us to unveil some of the brightness properties of the white-light F-corona and associated dust density distribution below coronal heights of about 20 R⊙ as follows:
- 1.The F-corona brightness depends on the observer's location. The observer's location is important for interpreting white-light F-corona observations when taken from within ∼35 R⊙. This is the first time that such an effect is demonstrated.
- 2.A finite region of depleted dust density (i.e., the DDZ) exists, where a continuous process gradually reduces the dust density.
- 3.We find no evidence for circumsolar dust sublimation rings, which suggests that the majority of the F-corona emission from within ∼19 R⊙ might originate from grains of similar type. We conjecture that the dust density depletion occurs when the thermal radiation is sufficient to sublimate particles of the appropriate size, with larger particles sublimating at lower heights.
- 4.The DFZ is the final result of the gradual depletion of dust in the DDZ. It is not the result of some action at the boundary.
- 5.A "kink" in the distribution of the aggregated WISPR measurements is the observational signature that indicates the existence of a boundary between the two zones.
- 6.The kink observed in the empirically modeled nonvarying brightness profile (K+F components) lies at a larger solar distance than in the simulated F-corona brightness profile (∼9.5 R⊙ compared to ∼5 R⊙) because of the influence of the K-corona signal at these short solar distances. Adding a nonvarying K-corona contribution to the F-corona simulated measurements shifts the kink to larger distances (∼8 R⊙).
In summary, our results indicate that the DDZ inner boundary occurs near 5 R⊙, and the outer boundary at about 19 R⊙ (thus confirming the estimates of the outer boundary of Stenborg et al. 2021b). The next six PSP orbits will have the same perihelion as Orbit 10. This will give many more observations under the same geometrical conditions but with a lot of variable K-corona and possible F-corona conditions. The additional observations might enable a better determination of the inner boundary.
The unprecedented WISPR imaging of the solar corona from "within" is revolutionizing our understanding of the dust distribution close to the Sun, confirming long-held hypotheses and upturning long-standing assumptions and models based on observations from 0.3 au outward. It is very likely that further discoveries will be forthcoming from observations with ever decreasing PSP perihelia.
Parker Solar Probe was designed, built, and is now operated by the Johns Hopkins Applied Physics Laboratory as part of NASA's Living with a Star (LWS) program (contract NNN06AA01C). Support from the LWS management and technical team has played a critical role in the success of the Parker Solar Probe mission. The Wide-Field Imager for Parker Solar Probe (WISPR) instrument was designed, built, and is now operated by the US Naval Research Laboratory in collaboration with Johns Hopkins University/Applied Physics Laboratory, California Institute of Technology/Jet Propulsion Laboratory, University of Gottingen, Germany, Centre Spatiale de Liege, Belgium and University of Toulouse/Research Institute in Astrophysics and Planetology. G.S. and A.V. were supported by WISPR Phase-E funds. R.H. was supported by NASA grant 80NSSC19K1261. B.G. was supported by the NASA Parker Solar Probe Program Office for the WISPR program (contract NNG11EK11I).
Facilities: PSP(WISPR).
Appendix
Presently, we are evaluating the plausibility of two alternative (although not necessarily mutually exclusive) explanations for the source of the anomalous brightness enhancement observed simultaneously in the images from both WISPR telescopes during the inbound segments of the PSP solar Encounters 6, 8, and to a much lesser extent, 10. Briefly, the first of them involves the plausible presence of an ephemeral and discrete dust density enhancement near the S/C (hereafter Option 1), while the other explanation considers a change of the S/C environment due to outgassing from the thermal protection shield or TPS (hereafter Option 2). The details are under investigation. Here we only show some evidence in favor of Option 1, and a succinct explanation of the plausibility of Option 2.
A.1. Option 1: Cometary Dust
Our first hypothesis is that during the times involved, PSP might be transiting a region of enhanced dust density nearby the orbit of 96P/Machholz (e.g., Abedin et al. 2018; Eisner et al. 2019, and references therein; see Figure 19, left panel). Comet 96P/Machholz is a periodic, short-period comet (5.29 yr) with a high orbital inclination (58138) and high eccentricity (0.959), aphelion at 5.947 au, and perihelion at 0.124 au. The comet itself is far away from the Sun at the time of the encounters (next perihelion on 2023 January 31). In the right panel of Figure 19 we show the distance between the PSP S/C and the orbital path of the comet while the S/C is between 90° and 140° ecliptic longitude (i.e., the time period while the enhancement is observed).

Figure 19. Left panel: projection onto the ecliptic plane of the orbits of comet 96P/Machholz and PSP near perihelion of Orbits 6, 8, and 10. The dashed line in 96P orbit indicates the portion of the orbit below the ecliptic plane. Right panel: distance between PSP and Machholz orbital path.
Download figure:
Standard image High-resolution imageThe time correlation is purely circumstantial, with the strength of the enhancement being in a direct relationship with the closeness of the S/C to the comet's orbit. This correlation might be supported by the fact that 96P is known to be a highly fragmented comet and hence with a lot of debris following it. Poynting–Robertson forces might reduce the orbit of these debris, but replenishment is expected after each perihelion passage. Likewise, radiation pressure might push small fragments farther out, so the debris trail, if any, and hence the trail might comprise a relatively large radial extent. Moreover, since the fragmentation occurs mostly close to perihelion, the debris trail might not be fully homogeneously populated (i.e., the trail might be populated with clumps of dust debris). This could explain why the enhancement is seen in one orbit and not in the next.
A.2. Option 2: Spacecraft Outgassing
PSP recorded higher torques on the spacecraft during the inbound segment compared to the outbound segments in Orbits 6, 8, and 10. It also recorded higher temperatures on blankets behind the front assembly containing the protective heat shield on inbound versus outbound. Interestingly, the higher temperatures only occurred on those orbits when the S/C achieved a lower distance for the first time. Then, on the outbound segment, the temperature profile would be slightly cooler than inbound and would have the same profile as the next inbound segment. Although the cause of the anomalies is still under investigation, the most likely cause is thought to be outgassing of materials (D. Mehoke 2022, private communication). Although this is a less likely source for the increase in the WISPR brightness anomaly, the coincidence of the timing of these anomalies with the passage of the orbit of Comet Machholz makes it worthy of consideration.
Footnotes
- 3
The determination of the symmetry axis of the background scene of WISPR images was carried out with the procedures described in Stenborg et al. (2021b).
- 4
The apparent radius of the Sun in degrees is given by
 ), where d is the PSP heliocentric distance at the time of the observation and R⊙ = 695,508 km. For instance, at the Orbit 10 perihelion distance (13.3 R⊙), the solar radius has an angular size of 431.
 - 5
In Paper I, the coefficients of the fitting were obtained by using the "least_square" function of the "scipy.optimize" package in Python 3.8.8.
- 6
Here, the coefficients of the fitting were obtained by using the "curve_fit" function of the "scipy.optimize" package in Python 3.8.8., as a wrapper to the Python "least_square" function, to allow for the estimation of the 1σ error of the coefficients.
- 7
The reassessment of the stray-light model for WISPR-O will be ready before the public release of Orbit 10 data.
- 8
The VSF incorporates an ensemble of scattering processes, particle sizes, and indices of refraction into a single empirical function.
- 9
The Raytrace package is available in IDL SolarSoft and in Github (Thernisien et al. 2021). The dust density profile must be supplied by the user.
- 10
As mentioned at the beginning of Section 4, the VSF has been validated to reproduce the white-light observations only up to observer distances >0.3 au. A preliminary analysis indicates that by adding a small additive term δ(Robs) to the exponent of the empirical factor (i.e.,
), the spread is reduced (this topic is beyond the scope of the present paper and will be explored in more detail in a future work). - 11
The PSP Orbits 6 through 10 were in the plane defined by Venus' orbital plane (inclination of 3
4, ascending node at 76°).

