


Abstract
Observations of the solar wind plasma and interplanetary magnetic field in the ecliptic plane by the Voyager 1 and 2 spacecraft are utilized to study the variation of the interplanetary shocks (with magnetosonic Mach number >1) encountered in the inner heliosphere, between ∼1 and ∼15 au from the Sun. The overwhelming majority (∼76%) of the shocks are fast forward (FF) moving at an average shock speed (Vsh) of ∼458 km s−1 away from the Sun, and only ∼24% are fast reverse (FR) shocks with an average Vsh of ∼323 km s−1 toward the Sun. About ∼89% of the shocks are quasi-perpendicular with an average shock angle (θBn) of ∼72° relative to the ambient magnetic field, and only ∼11% are quasi-parallel with an average θBn of ∼32°. While the interplanetary coronal mass ejections are the major (∼89%) driver of the FF shocks, a significant part (∼41%) of the FR shocks are associated with the corotating interaction regions. The shock occurrence rate, with a peak at the heliocentric distance (Rh) of ∼5 au, exhibits a clear decrease with the increasing Rh. While the shock strength and propagation angle do not exhibit any systematic change with Rh, Vsh increases with the increasing Rh at a rate of ∼11 km s−1 au−1.
Export citation and abstract BibTeX RIS
1. Introduction
Interplanetary shocks are discontinuous spatial changes in the solar wind plasma and interplanetary magnetic field (IMF), involving both mass flow and magnetic field penetration across their surfaces (Landau & Lifshitz 1960; Kennel et al. 1985; Tsurutani et al. 2011). Fast interplanetary shocks are formed by the nonlinear steepening of the fast-mode magnetohydrodynamic (MHD) waves, and they propagate through the interplanetary medium at speeds greater than the ambient upstream magnetosonic wave speed (Vms). These can be fast forward (FF) or fast reverse (FR) shocks depending on their propagation in the same or opposite directions of their drivers, respectively. However, as the propagation speeds are less than the ambient solar wind speed, both the FF and FR shocks are convected by the solar wind flow.
While interplanetary shocks are thin/small-scale transient disturbances, these are driven by the large-scale transient disturbances like coronal mass ejections (CMEs), solar wind high-speed streams (HSSs) or corotating interaction regions (CIRs), which propagate from the Sun to the interplanetary medium. Fast interplanetary CMEs (ICMEs) propagating (with speed from ∼500 to >2000 km s−1) faster than the local upstream Vms (typically ∼70–100 km s−1) in the plasma frame, can generate upstream FF shocks followed by sheaths of compressed, heated, and turbulent solar wind plasma and large-amplitude IMF variations (e.g., Kennel et al. 1985; Tsurutani et al. 1988). Thus, the plasma temperature, density, and IMF intensity increase in the sheath downstream of the FF shocks. In contrast, these parameters decrease in the sheath following the FR shocks owing to sunward propagation of the FR shocks for which the sunward side is in the upstream unshocked region. On the other hand, coronal hole emanated HSSs (with speed of ∼500–850 km s−1) can compress the ambient slow (∼300–400 km s−1) solar wind. The compressed plasma region corotates with the Sun, and is called a CIR (Siscoe 1972; Smith & Wolfe 1976; Balogh et al. 1999). At large heliocentric distances (Rh ), where the relative speed between a HSS and the background solar wind is higher than the characteristic speed of the local medium, the CIR is bounded by a pair of FF and FR shocks at the leading and trailing edges, respectively (Sonett & Colburn 1965; Smith & Wolfe 1976; Burlaga et al. 1990; Tsurutani et al. 1995; Echer et al. 2010; Hajra et al. 2018).
Thus, the interplanetary shocks can be useful for monitoring the large-scale space weather events (e.g., ICMEs, CIRs, and HSSs) and their evolution in the heliosphere. This is the main aim of the present work. Several works have reported the evolution of the shocks with Rh due to evolution of the solar wind (see Behannon 1978; Balogh et al. 1993; Hoang et al. 1995; Luhmann 1995; Gazis 1996; González-Esparza et al. 1998; Burlaga et al. 2002; Richardson & Wang 2005; Neugebauer 2013; Richardson 2014; Echer 2019a, 2019b, and references therein). While the majority of the shocks at ∼1 au are shown to be driven by ICMEs (Cane 1985; Sheeley et al. 1985; Kilpua et al. 2015), CIRs are fully developed with the FF–FR shock pair at >1.5–2 au and drive a significant part of the shocks at ≥3 au (Hundhausen & Gosling 1976; Smith & Wolfe 1976; Hajra et al. 2018). The cited works greatly contributed to our understanding of the shock evolution in the interplanetary space. However, there is no detailed study on the shock characteristic parameters and their variation in the inner heliosphere. In particular, we would like to refer to the work by Richardson & Wang (2005) that surveyed all the solar wind/interplanetary discontinuities observed by Voyager 2 out to 75 au. However, the solar wind plasma discontinuities were simply identified as shocks, and no proper shock analysis was performed. It should be noted that the plasma discontinuities could be shocks or waves depending on the magnetosonic Mach number (Mms) greater or less than unity, which was not verified. The shock normal, angle of propagation, and Mach number are important characteristic parameters to understand the dynamics and morphology, which were not explored in Richardson & Wang (2005). In addition, they did not identify the interplanetary drivers of the individual shocks, and how their relative importance vary with Rh . In other words, there is ample scope for a deeper exploration of the shocks encountered by Voyager. In the present work, we will utilize the solar wind plasma and IMF measurements by the twin spacecraft Voyager 1 and 2 from Rh ∼ 1 to ∼15 au (beyond which the shock detection in the ecliptic plane decreased significantly) to identify all the shocks encountered by them in the ecliptic plane of the Sun, to classify the shocks, to identify their interplanetary drivers, and to characterize the shocks in terms of their speed, propagation angle, Mach number, and plasma density and magnetic field compression strength. Variation of the shocks and their characteristic parameters with Rh will be explored in detail. This study will hopefully augment our understanding of the space weather events and their evolution.
2. Data Analysis and Results
2.1. Detection of Interplanetary Shocks and Their Drivers: Examples
Figure 1 shows examples of the interplanetary shocks and associated interplanetary drivers as detected by the Voyager 1 spacecraft. From top to bottom, the panels are the solar wind plasma speed (Vsw), density (Nsw), temperature (Tsw), IMF magnitude (B0), and IMF components BR
, BT
, and BN
, respectively. The IMF data are in the spacecraft-centered radial tangential normal (RTN) coordinate system, where  is the unit vector directed from the Sun to the spacecraft, and
  , where Ω is the Sun's spin axis. The right-hand system is completed by
  . The high-resolution data are obtained from NASA's COHOWeb (https://omniweb.gsfc.nasa.gov/coho/), which provides access to the heliospheric magnetic field, plasma, and spacecraft position data for several spacecraft.
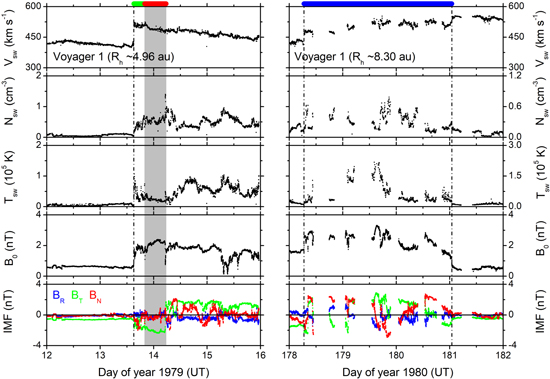
Figure 1. Examples of the interplanetary shocks and their drivers. From top to bottom, the panels show the solar wind plasma speed (Vsw), density (Nsw), temperature (Tsw), IMF magnitude (B0), and components BR , BT , and BN , respectively. The left and right panels show the Voyager 1 observations during 1979 January 12–15, and 1980 June 26–29, respectively. Interplanetary shocks are shown by the vertical dashed–dotted lines. Horizontal bars at the top panel show the interplanetary sheath (green), MC (red), and CIR (blue). MC is also marked by a gray shading.
Download figure:
Standard image High-resolution imageDuring 1979 January 12–15 (days 12 through 15 of the year), when Voyager 1 was at Rh
∼ 4.96 au, it encountered an ICME (Figure 1, left panels). The fast (Vsw ∼ 524 km s−1) ICME, propagating faster than the upstream plasma by more than the local magnetosonic speed (Vms ∼ 61 km s−1), generated an interplanetary shock at ∼15:07 UT on day 13 (shown by the vertical dashed–dotted line), identified by sudden increases in the solar wind plasma parameters. Vms is estimated as  , where VA is the Alfvén speed (
 ), and Vs
is the sound speed (
), and Vs
is the sound speed ( ), μ0 is the free space permeability, ρ denotes the solar wind mass density, kB is the Boltzmann constant, Tp
and Te
are the proton and electron temperatures, respectively, and mp
is the proton mass. Considering the upstream and downstream intervals of ∼10 minutes around the shock, the shock is characterized by sharp increases in Vsw from ∼399 to ∼524 km s−1, in Nsw from ∼0.1 to ∼0.3 cm−3, in Tsw from ∼0.1 × 10⁵ to ∼1.1 × 10⁵ K, and in B0 from ∼0.6 to ∼1.8 nT. The magnetic field ratio (rB
∼ 3.0) and plasma density ratio (rN
∼ 3.0) between the downstream and upstream solar wind are defined as the shock compression. Due to the simultaneous increases in Vsw, Nsw, Tsw, and B0 across the shock, it is classified as a FF shock.
), μ0 is the free space permeability, ρ denotes the solar wind mass density, kB is the Boltzmann constant, Tp
and Te
are the proton and electron temperatures, respectively, and mp
is the proton mass. Considering the upstream and downstream intervals of ∼10 minutes around the shock, the shock is characterized by sharp increases in Vsw from ∼399 to ∼524 km s−1, in Nsw from ∼0.1 to ∼0.3 cm−3, in Tsw from ∼0.1 × 10⁵ to ∼1.1 × 10⁵ K, and in B0 from ∼0.6 to ∼1.8 nT. The magnetic field ratio (rB
∼ 3.0) and plasma density ratio (rN
∼ 3.0) between the downstream and upstream solar wind are defined as the shock compression. Due to the simultaneous increases in Vsw, Nsw, Tsw, and B0 across the shock, it is classified as a FF shock.
The upstream and downstream plasma (speed) and IMF vectors are utilized to determine the shock normal  using the mixed-mode technique (Abraham-Shrauner & Yun 1976):

where Δ B ( = B d − B u ) and Δ V sw ( = V d − V u ) are the IMF and Vsw jumps, respectively, subscripts u and d denote the upstream and downstream values across the shocks. The shock normal is found to be [0.92, 0.29, −0.26].
Assuming the conservation of mass flux in the shock rest frame, the shock speed Vsh is estimated as
Vsh along the shock normal is determined to be ∼531 km s−1. The shock angle (θBn) between the shock normal  and the upstream IMF vector is determined to be ∼82.8°, implying this to be a quasi-perpendicular shock. The magnetosonic Mach number Mms, defined as the ratio of Vsh (relative to the upstream Vsw) to the upstream Vms, is computed to be ∼2.2 (confirming it to be a shock, not a wave). Thus, the FF shock at ∼15:07 UT on day 13 detected at ∼4.96 au is found to be a quasi-perpendicular shock propagating at a relative speed ∼2.2 times of the ambient magnetosonic speed at an angle of ∼82.8° relative to the ambient magnetic field. Detail description of the shock analysis method by solving the Rankine–Hugoniot conservation equations (Rankine 1870; Hugoniot 1887, 1889) can be found in literature (e.g., Smith 1985; Tsurutani & Lin 1985; Tsurutani et al. 2011; Hajra et al. 2016, 2020; Hajra & Tsurutani 2018a).
The FF shock on day 13 is followed by a downstream interplanetary sheath from ∼15:07 to ∼20:00 UT on day 13 (shown by a green bar on the top, Figure 1, left panel). Following the sheath, the shaded region (marked by a red bar on the top, Figure 1, left panel), from ∼20:00 UT on day 13 to ∼05:36 UT on day 14, is characterized by an enhanced IMF B0, smooth and slow rotation in BT , and reduced Tsw. These are the typical signatures of a flux rope magnetic cloud (MC; Burlaga et al. 1981; Klein & Burlaga 1982; Tsurutani & Gonzalez 1997) in the interplanetary space.
A CIR was encountered by Voyager 1 when it was at Rh ∼ 8.30 au during 1980 June 26–29 (between days 178 and 181 of the year). The CIR (marked by a blue bar on the top, Figure 1, right panel) can be identified between a slow-speed stream with Vsw ∼ 419 km s−1 on day 178 and a coronal hole emanated HSS with Vsw ∼ 552 km s−1 on day 181. The CIR is a compressed plasma characterized by high plasma density (Nsw ∼ 0.7 cm−3), temperature (Tsw ∼ 2.2 × 10⁵ K), and magnetic field (B0 ∼ 3.0 nT) compared to the ambient plasma. Most interestingly, the CIR is bounded by two shocks at its leading and trailing ends.
At ∼06:33 UT on day 178 (at the CIR leading edge), a sharp increase in Vsw from ∼427 to ∼484 km s−1 is accompanied by increases in Nsw from ∼0.2 to ∼0.3 cm−3, in Tsw from ∼0.1 × 10⁵ to ∼0.2 × 10⁵ K, and in B0 from ∼1.7 to ∼2.5 nT. By definition, this is an FF shock with the compression ratios of rB ∼ 1.5 and rN ∼ 1.5. Following the above-mentioned techniques, the FF is found to be propagating with a speed Vsh ∼ 557 km s−1 at an angle θBn ∼ 87.2° relative to the ambient IMF. The estimated Mms is ∼1.3. The result implies that the FF shock detected at ∼8.30 au was quasi-perpendicular, propagating at a relative speed of ∼1.3 times the magnetosonic speed at an angle ∼87.2° relative to the ambient magnetic field.
The shock at the trailing edge of the CIR, at ∼00:59 UT on day 181, is characterized by a sharp increase in Vsw from ∼507 to ∼532 km s−1, accompanied by simultaneous sharp decreases in Nsw from ∼0.3 to ∼0.2 cm−3, in Tsw from ∼0.3 × 10⁵ to ∼0.1 × 10⁵ K, and in B0 from ∼1.1 to ∼0.6 nT. This is defined as an FR shock. The FR shock propagates toward the Sun, but because the solar wind carrying the shock has a higher speed, the FR shock is also convected in the anti-sunward direction. The FR has the compression ratios of rB ∼ 1.8 and rN ∼ 1.5. The FR shock is estimated to be propagating with a speed Vsh ∼ 476 km s−1 at an angle θBn ∼ 58.3° relative to the ambient IMF. The estimated Mms is ∼1.3. Thus, the FR shock at the CIR trailing edge, detected at ∼8.30 au, was a quasi-perpendicular shock propagating at a speed ∼1.3 times of the local magnetosonic speed at a comparatively smaller angle of ∼58.3° relative to the ambient magnetic field.
2.2. Heliocentric Variation of the Shock Parameters
Using the method discussed above (Section 2.1), all the interplanetary shocks encountered by the Voyager 1 and 2 spacecraft in the ecliptic plane (in the heliolatitude range of ±10°) were identified. The method can be summarized as follows. First, from the temporal variations of the solar wind plasma and IMF, the abrupt increases in Vsw with simultaneous increases/decreases in Nsw, Tsw, and B0 were identified as potential shocks. Second, values of the solar wind plasma and IMF across the potential shocks were used to estimate VA, VS , Vms, and Mms as defined in Section 2.1. The discontinuities with only Mms > 1 were confirmed as shocks. Voyager 1 encountered 44 shocks from 1977 September to 1980 June in the Rh range of ∼1–8.3 au. Voyager 2 identified 76 shocks from 1977 September to 1984 October between Rh of ∼1 and ∼15.2 au. Beyond theses periods, Voyager 1 did not encounter any shock, Voyager 2 encountered only two shocks, at ∼29 au on 1989 February 25 and at ∼32 au on 1990 March 16, with Mms of ∼4.5 and ∼4.8, respectively. Thus, these were not included in the statistical analysis. While the spacecraft data coverage did not change much beyond ∼15 au, several causes, like movement of the spacecraft to the off-ecliptic plane, data quality, change in the solar wind character etc., might be responsible for the drastic decrease in the shock detection in the ecliptic plane beyond ∼15 au. It may be mentioned that with much relaxed criteria, Richardson & Wang (2005) identified quite a significant number of discontinuities (encountered by Voyager 2) beyond ∼15 au; however, they also confirm a large decrease in the number.
The heliocentric and solar cycle dependencies of the 120 shocks (with Mms > 1) identified between ∼1 and ∼15 au are explored in Figure 2. According to the monthly mean smoothed sunspot numbers, the solar cycle 21 started during 1976 March, attained the maximum during 1979 December, and ended during 1986 September. Thus, the period under study (1977 September through 1984 October) covers the ascending, maximum, and descending phases of the solar cycle. This is also reflected in the F10.7 solar flux variation (Figure 2(a)).
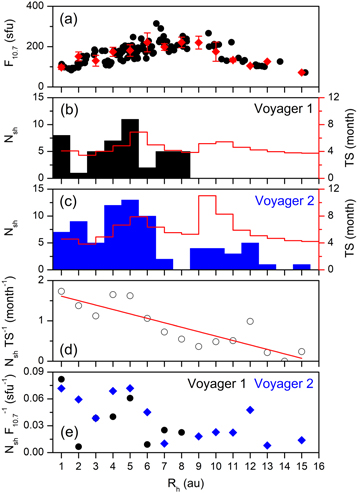
Figure 2. Variation of the interplanetary shocks with the heliocentric distance (Rh ). (a) The F10.7 solar flux daily values (black circles), means (red diamonds) and standard deviations (vertical bars), (b) number of the shocks (Nsh) observed by Voyager 1 (black histograms, legend on the left) and time spent (TS) by the spacecraft in each Rh bin (red horizontal steps, legend on the right), (c) Nsh observed by Voyager 2 (blue histograms, legend on the left) and TS by the spacecraft in each Rh bin (red horizontal steps, legend on the right), (d) Nsh normalized by TS (empty circles) along with linear regression line (red line), and (e) Nsh normalized by F10.7. In panel (e), black circles and blue diamonds correspond to the observations made by Voyager 1 and 2, respectively. F10.7 is expressed in the solar flux unit (sfu), where the sfu is 10−22 W m−2 Hz−1.
Download figure:
Standard image High-resolution imageThe shock occurrence (Nsh) shows a clear peak around 5 au, after which the occurrence decreases with the increasing Rh (Figure 2(b), (c)). However, owing to varying speed of the spacecraft at different Rh , the observation period (or the spacecraft time spent TS in each Rh bin) varied largely at different locations (Figure 2(b), (c), red horizontal steps, legend on the right). To account for this varying observation period, Nsh at each Rh bin was normalized by the observation period at that bin (Nsh TS−1). The result is shown in Figure 2(d). This shows the peak occurrence at ∼1 au, a second and comparable peak around 5 au, followed by a sharp fall in the shock occurrence rate. However, on the average, normalized Nsh exhibits a linear decrease with the increasing Rh (Table 1). Normalized Nsh and Rh are strongly anticorrelated (correlation coefficient r = −0.86) at a confidence level of >99% (Student's t-test; Student 1908).
Table 1. Relationships of the Shock Parameters with Rh
| Parameter | Relationship with Rh | Correlation Coefficient (r) | Significance Level |
|---|---|---|---|
| Normalized Nsh | Nsh TS−1 = 1.72 − 0.11Rh | −0.86 | >99% |
| Vsh | Vsh = 380.71 + 10.57Rh | 0.67 | >99% |
| Mms | Mms = 1.39 + 0.10Rh | 0.58 | >95% |
| rN | rN = 2.14 –0.03Rh | −0.47 | >90% |
Download table as: ASCIITypeset image
As the solar activity (F10.7) largely varied during the study interval, the shock occurrence was also normalized by the F10.7 solar flux (Figure 2(e)) to separate the solar activity contribution from the radial variation of the shocks. The solar flux normalized Nsh (Nsh F10.7 −1) also exhibits a similar shock occurrence pattern as above: the peak occurrences at ∼1 and ∼5 au, followed by a sharp fall in the shock occurrence at the larger Rh .
The occurrence peak of the shocks at ∼5 au from the Sun, and decrease at the larger distances are consistent with previous results (e.g., Hoang et al. 1995; Luhmann 1995; González-Esparza et al. 1996, 1998; Richardson & Wang 2005; Neugebauer 2013; Echer 2019a, 2019b, and references therein). However, most of the previous reports are obtained from compilation of different spacecraft observations at different heliocentric distances, and during varying solar activity condition. However, the present work separates the solar activity contribution from the radial variation of the shocks.
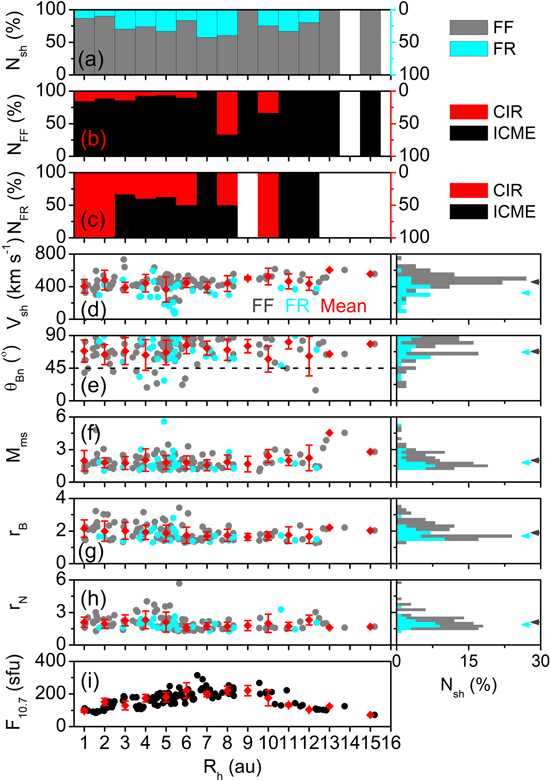
The shocks identified above are classified into two groups: (1) the FF shocks characterized by the sharp increases in Vsw, Nsw, Tsw, and IMF B0, and (2) the FR shocks characterized by a sharp increase in Vsw with simultaneous decreases in Nsw, Tsw, and B0. The interplanetary drivers are identified for each of the shocks as ICME or CIR following the method described in Section 2.1. From the temporal variations of the solar wind plasma and IMF, a CIR is identified as the region of the compressed (high) plasma density Nsw and IMF magnitude B0 between a slow stream and an HSS (Smith & Wolfe 1976). The shock driver is classified as an ICME when the shock is followed by a sheath characterized by the downstream high Tsw, Nsw and B0 (Kennel et al. 1985; Tsurutani et al. 1988). This is sometimes followed by an MC characterized by a high B0, a smooth and slow rotation in the IMF component(s), and a reduced Tsw (Burlaga et al. 1981). The shock characteristic parameters Vsh, θBn, Mms, rB , and rN , as shown in Section 2.1, are determined for each of the shocks. Figure 3 shows the variations of the shock types (FF and FR, Figure 3(a)), their interplanetary drivers (ICME and CIR, Figure 3(b), (c)), shock parameters Vsh (Figure 3(d)), θBn (Figure 3(e)), Mms (Figure 3(f)), rB (Figure 3(g)), and rN (Figure 3(h)), and the F10.7 solar flux (Figure 3(i)) with Rh .
Figure 3. Variations of the interplanetary shocks and shock parameters with (Rh ). (a) Distribution of the FF (gray) and FR (cyan) shocks, (b) distribution of the FF shocks caused by ICMEs (black) and CIRs (red), (c) distribution of the FR shocks caused by ICMEs (black) and CIRs (red), variations of (d) the shock speed Vsh, (e) shock angle θBn, (f) magnetosonic Mach number Mms, (g) compression ratio of the magnetic field rB , (h) compression ratio of the plasma density rN across the shocks, (i) F10.7 solar flux. In panels (d)–(h), the gray and cyan circles represent the values for the FF and FR shocks, respectively, while the red diamonds with vertical bars show the mean and standard deviations for all shocks. Histograms on the right (panels (d)–(h)) show the distribution of the shocks for different ranges of the parameters. The mean values are indicated by horizontal arrows. The panel (i) is in the same format as Figure 2(a).
Download figure:
Standard image High-resolution image
Among all 120 shocks, ∼76% are FF and only ∼24% are FR type. The relative occurrence of the FF and FR shocks at different Rh is shown in Figure 3(a). While a larger percent of the shocks are of the FF type at any Rh , the FR percent increases gradually from ∼1 au and attains a peak around 7–8 au, after which it decreases again. The relative occurrence of the FF and FR shocks, and their heliocentric variation shown in Figure 3(a) are also consistent with previous reports. For example, at ∼1 au, ∼66%–88% of the shocks are reported to be FF depending on the solar cycle phase (Echer et al. 2003; Kilpua et al. 2015). At ∼5 and ∼10 au, the FF shocks are ∼69%–72% (Echer et al. 2010; Echer 2019a) and ∼75% (Echer 2019b) of all shocks, respectively.
The relative role of the interplanetary drivers (ICMEs and CIRs) is shown in Figures 3(b) and (c). As the ICMEs and CIRs exhibit the distinguished solar cycle variations (Sheeley et al. 1976; Burlaga et al. 1981; Gosling et al. 1990; Tsurutani et al. 1995, 2020; Gopalswamy et al. 2004; Obridko et al. 2012; Hajra et al. 2013, 2014; Hajra & Tsurutani 2018b; Hajra 2021), results in Figures 3(b) and (c) should be discussed with reference to the solar activity (F10.7, Figure 3(i)) variation. The solar maximum (and a few years around the maximum) is dominated by sunspots, active regions, solar flares, CMEs, or ICMEs. The occurrence rate of ICMEs decreases with the decreasing F10.7. On the contrary, the interplanetary space (in the ecliptic plane) is dominated by HSSs and CIRs during the descending and solar minimum phases when coronal holes extend to the lower solar latitudes and expand in size. For the entire period of observation (irrespective of the solar activity variation), ICMEs are found to be the major driver of the FF shocks, driving ∼89% of the FF shocks, while only ∼11% of the FF shocks are driven by CIRs. However, ∼59% of the FR shocks are associated with ICMEs and ∼41% with CIRs. Thus, CIRs are a significant driver for the FR shocks. Interestingly, around 1–2 and 10 au, all FR shocks are driven by CIRs (Figure 3(d)). As can be found from the F10.7 variation (Figure 3(i)), these locations were traveled by the spacecraft during the solar minimum-to-ascending and the descending phases, respectively. In addition, around 8 au (after the solar maximum), CIRs are found to be the dominating driver of the FF (∼67%) and FR (∼50%) shocks, compared to ICMEs.
The above results clearly contradict the results of Echer (2019a), reporting ∼90% of the FR shocks being driven by CIRs, and more or less equal distribution of the FF shocks between ICMEs (∼55%) and CIRs (∼45%) at ∼5 au. While the FR shock formation in association with ICMEs is quite rare, they may result from the speed differences between the fast solar wind following slower stream (Gosling et al. 1988), or owing to an overexpansion of an ICME (Gosling et al. 1994). In addition, the present results are interesting, also because it was previously reported that only few CIRs are bounded by shocks at ∼1 au (e.g., Tsurutani et al. 1995; Jian et al. 2006). As shock formation through the nonlinear steepening of the large-amplitude magnetosonic waves theoretically requires several nonlinear steepening times, shocks typically form at the leading and trailing edges of CIRs only at the large Rh (>1.5–2.5 au).
In the entire Rh range of the study, the shock speed Vsh exhibits a large variation (Figure 3(d), right panel): from ∼226 to ∼733 km s−1 with an average Vsh of ∼458 km s−1 for the FF shocks, and from ∼68 to ∼593 km s−1 with an average Vsh of ∼323 km s−1 for the FR shocks. The statistical significance of this result is assessed by the Student's t-statistics and estimation of the corresponding probability factor p (Reiff 1990; Press et al. 1992). A p value of <0.0001 was estimated, implying that the higher speed of the FF shocks compared to the FR shocks is statistically significant. At any Rh , the FF shocks seem to have higher speed than the FR shocks. On the average, Vsh exhibits a slow increase at a rate of ∼10.57 km s−1 au−1 with the increasing Rh (Table 1). Vsh is correlated (correlation coefficient r = 0.67) to Rh at a high significance level (>99%).
The shock propagation angle θBn does not exhibit any clear dependence on Rh (Figure 3(e), left panel). The overwhelming majority, ∼88% of the FF shocks and ∼93% of the FR shocks, are found to be quasi-perpendicular (with θBn > 45°), and only ∼12% of the FF and ∼7% of the FR shocks are quasi-parallel (θBn ≤ 45°) (Figure 3(e), right panel). It is interesting to note that after ∼6 au, only two shocks are observed to be quasi-parallel. These results are consistent with previous results reporting dominance of the quasi-perpendicular shocks at Rh of ∼1 au (Bavassano-Cattaneo et al. 1986; Neugebauer 2013; Kilpua et al. 2015), ∼5 au (Echer 2019a), and ∼10 au (Echer 2019b). It can be noted that IMF, from an average orientation angle of ∼45° to the ecliptic plane at ∼1 au, becomes more and more tangential at the larger Rh (e.g., Parker 1965; Behannon 1978). This makes the shocks more likely to be quasi-perpendicular.
The heliocentric variations of the shock strength parameters (Mms, rB , and rN ) are shown in Figures 3(f)–(h). No clear distinction can be made between the FF and FR shocks. From the linear regression analysis, Mms is found to increase slowly with the increasing Rh at a rate of ∼0.10 au−1, while rN decreases with the increasing Rh at a rate of ∼−0.03 au−1 (Table 1). However, the corresponding correlation (r = 0.58) and anticorrelation (r = −0.47) coefficients, respectively, of the linear regression analysis are not high. It is interesting to note that Echer (2019a) compared the shock compression ratio and Mms at ∼1, ∼5, and ∼10 au based on data from several independent works, and concluded that the shock strength increases from ∼1 to ∼5 au, and then decreases from ∼5 to ∼10 au. However, the present work, with a much continuous and larger database, reveals no prominent systematic shock strength variation with Rh . This was also concluded by Richardson & Wang (2005) using the upstream to downstream density ratios across the interplanetary discontinuities.
3. Discussion and Conclusions
A detailed study on the radial distributions of shock occurrences in the ecliptic plane, shock characteristics, and their drivers in the inner heliosphere is presented. It reveals a complex dynamics related to the space weather events and their interplanetary evolution.
About 65% of all shocks identified between ∼1 and ∼15 au from the Sun were encountered at ≲5 au, beyond which the shock occurrence decreases very fast. When normalized by the spacecraft observation time in different heliocentric locations, the shock occurrence rate clearly exhibits a peak around 5 au, and an overall decrease with the increasing Rh . As shocks detected only in the ecliptic plane (±10° heliolatitudes) are considered in this work, this result largely depends on the morphology, orientation, and evolution of the shock drivers and their evolution with respect to the ecliptic plane and Rh . Another important factor is the change in the character of the solar wind beyond the hydrogen ionization cavity (Holzer 1972; Zank 1999) which is located within ∼5–8 au. Beyond this region, the solar wind is mediated by the interstellar pickup ions (H+, He+) that dominate the internal energy of the solar wind (e.g., Zank et al. 2018). As a result, temperature of the pickup ion mediated solar wind increases with Rh leading to a significant increase in the sound speed outside the cavity. This plays an important role in modulating the dynamics and morphology of the interplanetary shocks (e.g., Zank & Pauls 1997; Rice & Zank 1999; Rice et al. 2000), such as increase in the shock propagation speed, decay in the compression ratio, and formation of multiple forward–reverse shock pairs with the increasing Rh .
While only a few FF shocks are associated with CIRs, all of the FR shocks around 1–2 and 10 au are driven by CIRs. At other locations as well, CIRs are found to be a significant source of the FR shocks. This result may indicate that in the ecliptic plane probability of the FR shock formation at the trailing edge of a CIR is larger than that of the FF shock formation at a CIR leading edge in the inner heliosphere. This can be verified by a further study on the CIR evolution in the ecliptic plane.
On the average, the FF shock speed is significantly higher than the FR shock speed. However, no clear distinction can be made in the shock propagation angle, and the shock strength between the FF and FR shocks. In addition, the shock strength and propagation angle essentially do not exhibit any systematic change with Rh . However, the average shock speed is found to increase slowly at a rate of ∼11 km s−1 au−1. Wang et al. (2001), using the MHD numerical modeling, predicted a decrease in the radial solar wind velocity with Rh . The decrease in the background solar wind speed is conducive and consistent with an increase in the shock speed. This result is also consistent with the increase in the pickup ion mediated solar wind temperature leading to the sound speed increase beyond the ionization cavity (Zank & Pauls 1997; Rice & Zank 1999; Rice et al. 2000).
This work is funded by the Science and Engineering Research Board (SERB, grant No. SB/S2/RJN-080/2018), a statutory body of the Department of Science and Technology (DST), Government of India through a Ramanujan Fellowship. The high-resolution Voyager spacecraft observations analyzed in this work are obtained from NASA's COHOWeb (https://omniweb.gsfc.nasa.gov/coho/). The daily F10.7 solar flux are obtained from the Laboratory for Atmospheric and Space Physics (LASP) Interactive Solar Irradiance Data Center (https://lasp.colorado.edu/lisird/). I would like to thank the reviewer and editor Dr. Gary Zank for extremely valuable suggestions that substantially improved the manuscript.