


Abstract
In this study, we identified and characterized the hot and luminous UV-bright stars in the globular cluster NGC 2808. We combined data from the Ultra Violet Imaging Telescope (UVIT) on board the Indian space satellite AstroSat with the Hubble Space Telescope UV Globular Cluster Survey data for the central region (within  ) and Gaia and ground-based optical photometry for the outer parts of the cluster. We constructed the UV and UV-optical color–magnitude diagrams, compared the horizontal branch (HB) members with the theoretical zero- and terminal-age HB models, and identified 34 UV-bright stars. The spectral energy distributions of the UV-bright stars were fitted with theoretical models to estimate their effective temperatures (12,500–100,000 K), radii (0.13–2.2 R⊙), and luminosities (∼40–3000 L⊙) for the first time. These stars were then placed on the Hertzsprung–Russell diagram, along with theoretical post-HB evolutionary tracks, to assess their evolutionary status. The models suggest that most of these stars are in the asymptotic giant branch (AGB)-manqué phase, and all except three have evolutionary masses <0.53 M⊙. We also calculated the theoretically expected number of hot post-(early)-AGB stars in this cluster and found the range to match our observations. Seven UV-bright stars located in the outer region of the cluster, identified from the AstroSat/UVIT images, are ideal candidates for detailed follow-up spectroscopic studies.
Export citation and abstract BibTeX RIS
1. Introduction
Globular clusters (GCs) are ideal astrophysical laboratories to test the theories of stellar evolution, especially the late evolutionary stages of low-mass stars. According to canonical stellar evolution models, the post-helium-core-burning (pHeCB) or post-horizontal branch (pHB) evolution of a star depends strongly on its envelope mass (Dorman et al. 1993, 1995). After the depletion of helium (He) in the core, horizontal branch (HB) stars with the highest envelope masses enter the asymptotic giant branch (AGB) phase, undergo thermal pulsations, and end up losing their envelopes to become extremely hot stars with constant luminosity. Known as post-AGB (pAGB) stars, these are short-lived (lifetime < 105 yr) with luminosity  . The HB stars with slightly lower envelope masses (>0.02 M⊙) ascend the AGB but do not undergo thermal pulsations in this phase. They eventually lose their envelopes and evolve toward higher temperatures with slightly lower luminosities (
 2.65–3.1) than the pAGB stars. These are known as post-(early)-AGB (p(e)AGB) stars (Brocato et al. 1990) and have a lifetime of ≃105 yr. After core He exhaustion, HB stars with the lowest envelope masses cannot ascend the AGB and hence directly evolve toward the white dwarf cooling curve with a slight enhancement in luminosity and are referred to as AGB-manqué stars (Greggio & Renzini 1990). The range of their luminosities is
  1.8–2.65, with lifetimes of 20–40 Myr (Moehler et al. 2019). These late phases of low-mass stellar evolution are the least understood owing to uncertainties in the C/O core size (Charpinet et al. 2011; Constantino et al. 2015) and stellar winds in the red giant branch (RGB) phase that determine the envelope mass of HB stars (McDonald & Zijlstra 2015; Salaris et al. 2016). Due to the lack of detections of stars in these quickly evolving stages, the existing pHB models have not been tested extensively and have room for improvement.
A few pHeCB stars in various evolutionary stages are found in the ultraviolet (UV) images of GCs as highly prominent, luminous stars. Referred to as UV-bright stars (Zinn et al. 1972), these are observed to be brighter than the HB stars by 1 mag or more in the far-UV (FUV) with FUV–near-UV (NUV) color <0.7 mag (Schiavon et al. 2012). Originally, these were defined as stars brighter than the HB and bluer than the RGB. They were looked for as stars whose U-band magnitudes were brighter than those of any other star in the GC (e.g., Zinn et al. 1972). Since these searches were based on optical observations, they were biased toward the most luminous pAGB stars and unable to detect the less luminous p(e)AGB and AGB-manqué stars (Moehler 2001). Moreover, most of the stars detected were cooler than 30,000 K, although there were theoretical predictions of even hotter pAGB stars. The crowded cores of GCs posed yet another difficulty for ground-based optical observations.
The space missions, with the capability to obtain images in the UV, opened a whole new arena for the study of hot stars in GCs. The cooler stellar populations, such as main-sequence (MS) and RGB stars, are suppressed in the UV wavelengths, which helps to produce images with reduced stellar crowding in the central regions. The UV-bright stars, along with the hot extreme-HB (EHB) stars, contribute significantly to the UV luminosity of old stellar systems like GCs (Greggio & Renzini 1990, 1999; O'Connell 1999). Hence, these stars are speculated to be the reason for the UV-upturn phenomenon in elliptical galaxies (Greggio & Renzini 1990, 1999; Dorman et al. 1995; Brown et al. 1997, 2000). Thus, UV study rather than optical is critical to perform an accurate evaluation of the contribution of hot stars in late evolutionary stages to the UV luminosity of old systems. For a detailed review of hot stars in GCs, see Moehler (2001, 2010). Schiavon et al. (2012) presented a catalog of candidate pAGB, p(e)AGB, and AGB-manqué stars in 44 Galactic GCs, including NGC 2808, using Galaxy Evolution Explorer (GALEX) FUV and NUV observations. However, this study was limited by the spatial resolution (∼5'') of GALEX. Also, the membership information for these stars was not available then.
Moehler et al. (2019) combined photometric observations from various missions, such as the Ultraviolet Imaging Telescope (UIT; Stecher et al. 1997), GALEX, Swift Ultraviolet-Optical Telescope (UVOT), and Hubble Space Telescope (HST), to obtain a census of UV-bright stars in 78 GCs. The atmospheric parameters of the brightest pHB stars in the sample (including three stars from NGC 2808), derived from optical spectroscopic observations, were used to assess their evolutionary status. The numbers of theoretically predicted and observed hot pAGB stars for 17 GCs (excluding NGC 2808) were found to be comparable, though affected by poor statistics. The catalog of such stars in their list of clusters is yet to be published. Several optical spectroscopic studies of previously identified bright pHB stars have been performed to shed light on their chemistry and evolutionary status (Thompson et al. 2007; Chayer et al. 2015; Dixon et al. 2017, 2019).
Jain et al. (2019) studied NGC 2808 using the data obtained from the Ultra Violet Imaging Telescope (UVIT) aboard the Indian space satellite, AstroSat. They reported the detection of hot stars belonging to different classes, such as EHB, blue HB (BHB), red HB (RHB), blue hook (BHk), pAGB, and blue straggler stars (BSSs), from UV color–magnitude diagrams (CMDs), albeit without membership analysis. They focused on the photometric gaps in the UV CMDs and the multiple stellar populations in the cluster. The hot stellar populations of this cluster have also been explored using the UV and optical data from HST in the works of Brown et al. (2001, 2010, 2012), Dieball et al. (2005), Castellani et al. (2006), Dalessandro et al. (2011) and so on.
In this work, we study the unexplored UV-bright member stars in NGC 2808. This is one of the massive and dense GCs with an age = 10.9 ± 0.7 Gyr (Massari et al. 2016), [Fe/H] = −1.14 dex, and located at a distance of 9.6 kpc (Harris 1996, 2010 edition, hereafter H96). We combine the archival UV data from the UVIT with the UV-optical observations from the HST (Brown et al. 2001; Piotto et al. 2015; Nardiello et al. 2018) and optical observations from Gaia (Gaia Collaboration et al. 2018) and ground-based telescopes (Stetson et al. 2019). The member stars in the inner (central region within  , covered by HST WFC3/UVIS) and outer (region outside the HST field of view, FOV) regions of the cluster are identified utilizing the proper motion–based membership information from the HST and Gaia catalogs, respectively. We present the catalog of UV-bright member stars in this cluster (from inner to outer regions) for the first time, along with their surface parameters derived through the analysis of their spectral energy distributions (SEDs). We also investigate the evolutionary status of these UV-bright stars and compare the observed number of hot p(e)AGB3
stars with the expected number derived from theoretical estimations. Though Jain et al. (2019) used the UVIT data to study the HB population, here we aim to focus on the UV-bright members of the cluster and parameterize them to shed light on the short-lived late evolutionary phases of low-mass stars.
, covered by HST WFC3/UVIS) and outer (region outside the HST field of view, FOV) regions of the cluster are identified utilizing the proper motion–based membership information from the HST and Gaia catalogs, respectively. We present the catalog of UV-bright member stars in this cluster (from inner to outer regions) for the first time, along with their surface parameters derived through the analysis of their spectral energy distributions (SEDs). We also investigate the evolutionary status of these UV-bright stars and compare the observed number of hot p(e)AGB3
stars with the expected number derived from theoretical estimations. Though Jain et al. (2019) used the UVIT data to study the HB population, here we aim to focus on the UV-bright members of the cluster and parameterize them to shed light on the short-lived late evolutionary phases of low-mass stars.
The layout of the paper is as follows. Section 2 gives an account of the observations and adopted data reduction procedure. The cross-match of the different data sets and the UV-optical CMDs are presented in Section 3. Sections 4–6 describe the observed UV-bright stars and their SEDs and evolutionary phases, respectively. The results are discussed in Section 7, and a summary is presented in Section 8.
2. Observations and Data Reduction
This work utilizes data from the UVIT on board AstroSat, India's first multiwavelength space observatory. The UVIT consists of twin telescopes, each of 38 cm diameter, one dedicated to FUV (λ = 1300–1800 Å) and the other to NUV (λ = 2000–3000 Å) and VIS (λ = 3200–5500 Å) passbands. The VIS data are used for drift-correcting the images. The UVIT has a circular FOV of  diameter and consists of multiple filters in each passband. The FUV and NUV detectors operate in photon-counting mode, and the VIS detector operates in integration mode. Further details regarding the instrument and calibration can be found in Tandon et al. (2017).
We used the archival UVIT data for NGC 2808 in two FUV (F154W and F169M) and four NUV (N242W, N245M, N263M, and N279N) filters. The images were created using the CCDLAB software package (Postma & Leahy 2017) by correcting for the spacecraft drift, geometrical distortions, and flat-fielding. The images created for each orbit were then aligned and merged to create the final science-ready image in each filter. The final exposure times for the science-ready image in various filters are tabulated in Table 1. The UVIT image of NGC 2808 is shown in Figure 1, with blue corresponding to F154W detections and green to those in N242W.
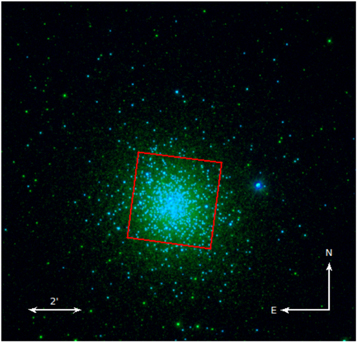
Figure 1. The UVIT image of NGC 2808 with F154W detections in blue and N242W in green. The HST WFC3/UVIS FOV that covers the inner  region of the cluster is marked in red.
Download figure:
Standard image High-resolution imageTable 1. The UVIT Observation and Photometry Details for NGC 2808
| Filter | λmean | Δλ | Zero-point | Exp. Time | No. of Stars | FWHM of Model PSF | Aλ |
|---|---|---|---|---|---|---|---|
| (Å) | (Å) | (mag) | (s) | (arcsec) | (mag) | ||
| F154W | 1541 | 380 | 17.77 | 4987.34 | 2692 | 1.47 | 1.79 |
| F169M | 1608 | 290 | 17.45 | 4220.36 | 3996 | 1.45 | 1.75 |
| N242W | 2418 | 785 | 19.81 | 1040.99 | 5056 | 1.41 | 1.70 |
| N245M | 2447 | 280 | 18.50 | 886.42 | 2686 | 1.64 | 1.65 |
| N263M | 2632 | 275 | 18.18 | 354.46 | 1309 | 1.58 | 1.43 |
| N279N | 2792 | 90 | 16.50 | 2629.94 | 2868 | 1.42 | 1.32 |
Download table as: ASCIITypeset image
2.1. Photometry
Crowded-field photometry was performed on the UVIT images using the DAOPHOT software package of IRAF/NOAO (Stetson 1987) through the following steps. Stars in the images were located using the DAOFIND task, and their aperture photometry magnitudes were computed using the PHOT task. The model point-spread function (PSF) was generated using a few bright isolated stars in the image. It was then fitted to all of the detected stars, and the PSF-fitted magnitudes were obtained using the ALLSTAR task. The curve-of-growth technique was used to calculate the aperture correction value, which was then applied to the magnitudes. To get the final magnitudes in each filter, saturation correction was applied according to the method described in Tandon et al. (2017). The number of detected stars in various filters is presented in Table 1. The plots of magnitude versus PSF fit error for different filters are shown in Figure 2.
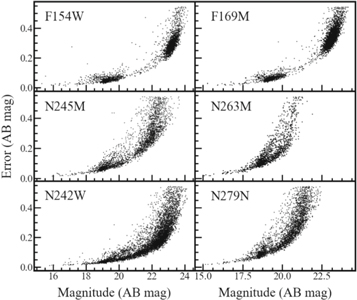
Figure 2. Magnitude (without extinction correction) vs. PSF fit errors for the UVIT observations of NGC 2808 in six filters. The filter names are indicated in the top left corner of each panel.
Download figure:
Standard image High-resolution imageThe magnitudes in all filters were corrected for extinction by adopting a reddening value, E(B − V) = 0.22 mag (H96), and the ratio of total to selective extinction, RV = 3.1. The corresponding extinction coefficient in the V band is AV = 0.682 mag. The extinction coefficients presented in Table 1 were calculated using the reddening law of Cardelli et al. (1989).
3. UV-optical and UV CMDs
3.1. Cross-match of the UVIT Data with the HST Data
In order to identify various stars detected in the UVIT images, we cross-matched them with the HST UV Globular Cluster Survey (HUGS) catalog (Piotto et al. 2015; Nardiello et al. 2018) in the inner region of the cluster (within  ). The HUGS astrophotometric catalog consists of data in the WFC3/UVIS F275W (NUV), F336W (U), and F438W (B) filters, along with the ACS/WFC F606W (V) and F814W (I) filters. The catalog also provides cluster membership probabilities estimated based on stellar proper motions. We selected stars with membership probabilities greater than 90% as cluster members. As we are interested in the UV-bright population of this cluster, we chose stars that are expected to be bright in the UV, such as the pHB and HB stars and BSSs from the HST CMD, and identified their unique counterparts in the UVIT images as explained below.
The CMDs and color–color plane (CCP) using the HST data for the inner region of the cluster are shown in Figure 3, where the stars are color-coded according to their classification. The top right panel shows the 28 identified pHB member stars. The bottom right panel shows the 176 identified BSS members as per the procedure described in Raso et al. (2017). The division of HB into RHB, BHB, EHB, and B gap objects and BHk was done using the mF275W − mF438W versus CF275W,F336W,F438W plane (Brown et al. 2016), as shown in the left panels. The classification adopted here is similar to that of Brown et al. (2016). The RR Lyrae stars were identified by cross-matching with the data from Kunder et al. (2013). Since the HST images have a much better spatial resolution, a simple cross-match with the UVIT data may yield wrong identifications due to crowding in the innermost region of the cluster. A case of multiple HST stars for a single UVIT detection is demonstrated in Figure 4, where we have overlaid the HST F275W and UVIT F154W images. The gray patch is the UVIT detection, whereas in black are the stars from the HST in a region of about 5'' × 5''. In order to avoid such wrong/multiple identifications, we used a python code that returns only those HST stars among the pHB, HB, and BSS stars, which have no neighbors within a 1 8 radius (maximum UVIT PSF) of them. As the crowding is maximum near the cluster center, no HST–UVIT cross-match was performed for the innermost region (radius < 30''). Finally, 491 stars were selected from the HST catalog, and these were then cross-matched with the UVIT-detected stars with a maximum match radius of 1''. All of the cross-matched stars were found to have a photometric error of <0.2 mag in all UVIT filters.

Figure 3. In the left panels are the CMD and CCP showing the categorization of HB stars into RHB, BHB, EHB, and BHk stars using HUGS data. The prominent photometric discontinuities, such as the Grundahl jump (G-jump; Grundahl et al. 1998, 1999), the Momany jump (M-jump; Momany et al. 2002, 2004), and the gap between EHB and BHk stars (B gap; Sweigart 1997; Brown et al. 2001), are shown in the CCP. The top and bottom right panels show the CMDs used to select the pHB stars and BSSs, respectively, with all other member stars shown in gray.
Download figure:
Standard image High-resolution image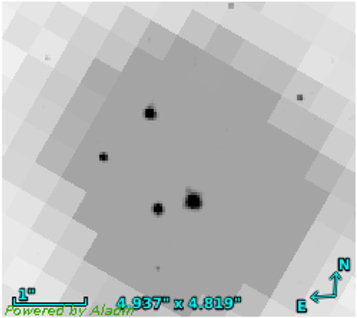
Figure 4. Example of a possible wrong cross-match between HST- and UVIT-detected stars due to the crowding in the inner region of the cluster. The UVIT detection in the F154W filter is shown in gray, overlaid with the HST F275W–detected stars in black.
Download figure:
Standard image High-resolution image3.2. Cross-match of the UVIT Data with the Gaia and Ground-based Optical Data
The UVIT FOV is much larger than the HST FOV, and it covers the outer region of the cluster as well. In order to effectively use the stars detected by UVIT in the outer region, the UVIT data were combined with other data for their identification and membership, as explained below. The list of possible member stars of the cluster in the outer region was obtained from the Gaia DR2 paper (Gaia Collaboration et al. 2018), and their UBVRI photometry is from Stetson et al. (2019). These data sets were first cross-matched to get the cluster members and their optical photometry. The resultant set was then cross-matched with the UVIT data, with a maximum match radius of 05. Then, only those stars with a UVIT magnitude error <0.2 mag were included in the analysis. The cross-matched stars were visually checked for wrong/multiple identifications. Further, the B, V, and I Johnson–Cousins magnitudes of all of these stars were transformed into the equivalent HST filter magnitudes (WFC3/UVIS F438W, ACS/WFC F606W, and ACS/WFC F814W) using the transformation equations of Sirianni et al. (2005) and Harris (2018) so that stars in the inner and outer regions could be shown in the same color and magnitude plane.
3.3. CMDs
We constructed the UV-optical and UV CMDs for the inner and outer regions with the cross-matched members. The updated Bag of Stellar Tracks and Isochrones (BaSTI) theoretical zero-age HB (ZAHB) and terminal-age HB (TAHB; end of He-burning phase) models from Hidalgo et al. (2018) were fitted to the HB sequence of the cluster CMD. These models were generated in the UVIT, HST/WFC3, and HST/ACS filters by choosing metallicity [Fe/H] = −0.9 dex, He abundance = 0.249, solar scaled [α/Fe] = 0.0, and no convective overshoot. These models take into account the effects due to atomic diffusion at the hotter end of the HB, as is evident from the close match with the CMDs.
Figure 5 shows the CMD of the cluster for the inner region using the HST data. Stars that are used for the cross-match with the UVIT data are shown, along with the ZAHB and TAHB models. The gray dots represent stars with more than 90% membership probability.
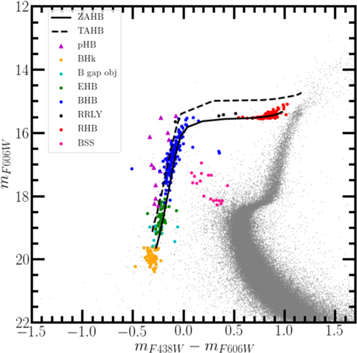
Figure 5. Optical CMD showing the 491 stars (colored symbols) selected from the HST catalog for cross-match with the UVIT data based on the selection criteria described in the text. All of the cluster members (membership probability more than 90%) in the HST FOV are shown with gray points, and the black solid and dashed lines represents the BaSTI ZAHB and TAHB models with [Fe/H] = −0.9 dex, respectively.
Download figure:
Standard image High-resolution imageFigure 6 shows the optical and FUV-optical CMDs for all of the members detected in the F154W UVIT filter. To plot these CMDs, we converted the F438W and F606W magnitudes from the VEGA system to the AB system.4 The filled and open symbols represent the stars located in the inner and outer regions of the cluster, respectively. In the FUV, we have mainly detected the hotter part of the HB (BHB and EHB), BHk, pHB, and a few BSSs. Three RR Lyrae variables are also identified. In the mF154W − mF606W versus mF154W plot (shown in the right panel), the BHB stars have a relatively tight distribution in magnitude, whereas the EHB, B gap, and BHk stars show a spread in the mF154W magnitude with respect to the ZAHB track. Many of them are also found to be fainter than the ZAHB model. One of the detected BSSs, located in the outer region, is very bright in the F154W filter. The RHB stars are hardly detected, as they are not hot enough to emit in FUV wavelengths. The detected pHB stars are found to be brighter than the TAHB with a spread of about 2 mag in the F154W filter and 4 mag in the FUV-optical color. We discuss these UV-bright stars in detail in the next section.
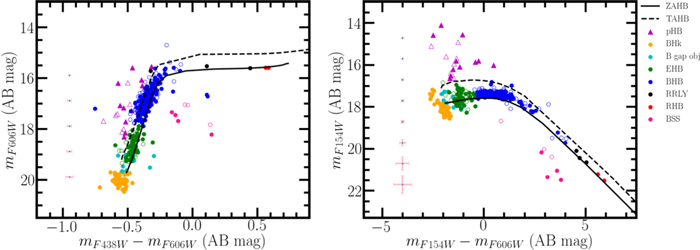
Figure 6. Optical and FUV-optical CMDs for all of the members in NGC 2808 common to the UVIT FUV F154W filter and other catalogs (HST, Gaia, and ground-based optical data). The stars detected within the inner  region of the cluster are marked with filled symbols and those in the outer region with open symbols. The black solid and dashed lines are the ZAHB and TAHB models, same as in Figure 5. The photometric errors in magnitude and color are also shown along the left side of each plot.
Download figure:
Standard image High-resolution imageSimilarly, Figure 7 shows the optical and NUV-optical CMDs for stars detected in the N245M UVIT filter. In the N245M filter, apart from the abovementioned sequences, we have detected the cooler RHB population as well. The RHB stars form a tight sequence when compared to the rest of the HB sequence and are located close to the ZAHB track. On the other hand, the other HB phases show a large spread, with many of them located above and below the ZAHB track. The BHk sequence has the largest statistically significant spread in the N245M magnitude, as is evident from the mN245M − mF606W versus mN245M CMD (right panel). The bright BSS is found to be slightly fainter than the faintest BHB star.

Figure 7. Optical and NUV-optical CMDs for all of the stars in NGC 2808 common to the UVIT NUV N245M filter and other catalogs (HST, Gaia, and ground-based optical data). The details are the same as in Figure 6.
Download figure:
Standard image High-resolution imageThe UV CMDs for all of the stars common in the UVIT filters F154W and N245M are shown in Figure 8. In the mF154W − mN245M versus mN245M CMD (left panel), the HB stars show a progressive reduction in the N245M magnitude as a function of mF154W − mN245M color. In the case of the mF154W − mN245M versus mF154W CMD, the HB stars with color <0.0 mag have a horizontal sequence. The hot BHB, EHB, B gap, and BHk stars get mixed up in these CMDs. The bright BSS is found to be slightly fainter than the BHB stars, with an mF154W − mN245M color of ∼0.0 mag.

Figure 8. The UV CMDs for the cluster member stars common in the F154W and N245M filters. The UV-bright stars (shown as purple triangles) are clearly brighter than the ZAHB by 1 mag or more in the FUV and have FUV−NUV < 0.7 mag.
Download figure:
Standard image High-resolution imageTable 2 tabulates the number of stars belonging to different categories detected in each UVIT filter. In the outer region, since cluster members were selected based on Gaia data with an approximate limiting magnitude of V ≃ 20.5 mag, we have zero stars belonging to the optically faint B gap and BHk categories. We plan to perform a separate detailed study of the HB stars and BSSs presented in this section in the near future.
Table 2. Number of pHB Stars, BSSs, and Different Categories of HB Stars in NGC 2808 Detected in Each UVIT Filter in the Region Covered by HST
| Filter | NpHB | NBHk | NBgap | NEHB | NBHB | NRR Lyrae | NRHB | NBSS |
|---|---|---|---|---|---|---|---|---|
| F154W | 11(7) | 53(0) | 12(0) | 48(21) | 147(65) | 3(0) | 2(0) | 4(3) |
| F169M | 11(7) | 52(0) | 12(0) | 49(21) | 146(64) | 2(1) | 1(0) | 3(1) |
| N242W | 11(7) | 49(0) | 11(0) | 45(21) | 146(66) | 4(1) | 119(124) | 9(28) |
| N245M | 11(7) | 48(0) | 12(0) | 45(20) | 146(66) | 2(1) | 65(23) | 5(10) |
| N263M | 11(7) | 23(0) | 8(0) | 29(17) | 140(66) | 3(1) | 38(4) | 4(1) |
| N279N | 11(7) | 40(0) | 10(0) | 40(17) | 147(64) | 5(1) | 103(49) | 8(2) |
Note. In parentheses are the numbers of these stars detected in the outer region of the cluster.
Download table as: ASCIITypeset image
4. Observed UV-bright Stars
The main aim of this study was to identify and characterize the pHB stars in the inner and outer regions of the cluster. Among the UVIT-detected stars in the outer regions, some bright stars were found to be nonmembers based on the list of possible members from Gaia Collaboration et al. (2018). We reassessed the membership of these stars in the outer region using methods presented in Singh et al. (2020), who also used the Gaia DR2 data. Two stars were found to have a membership probability of ∼90%. One star was found to have ∼40% membership probability, and this was studied by Moehler et al. (2019) using optical spectroscopy. We included these three stars along with the other pHB stars for further study.
From our analysis, we find a total of 34 UV-bright member stars in this cluster that could be classified as pHB stars. Of these, 18 stars have FUV and NUV flux measurements from the UVIT and are marked with purple triangles in the UV-optical and UV CMDs in Figures 6–8. All of these stars satisfy the observational criteria for them to be classified as UV-bright stars as laid out in Schiavon et al. (2012); i.e., they are brighter than the ZAHB by more than 1 mag in the FUV, and the FUV−NUV color is less than 0.7 mag. The UVIT magnitudes and magnitude errors for these stars are presented in the Appendix. Figure 9 shows the spatial locations of all 34 observed UV-bright stars marked over the UVIT F154W image. Here 11 out of the 18 UVIT-detected pHB stars (shown by red circles) lie in the HST FOV, and they have been uniquely cross-matched. This can be seen in Figure 10, where we have overlaid the HST F275W and UVIT F154W images for these stars. We also note that similar unique cross-matches are achieved for all stars shown in the CMDs. The remaining 16 UV-bright stars (marked with blue circles in Figure 9) are located in the crowded innermost region of the cluster and hence could not be resolved by the UVIT. Among these, only four stars have FUV and NUV photometric measurements from the HST Space Telescope Imaging Spectrograph (STIS) instrument (Brown et al. 2001), whereas all 16 have NUV-optical data from the HUGS catalog.
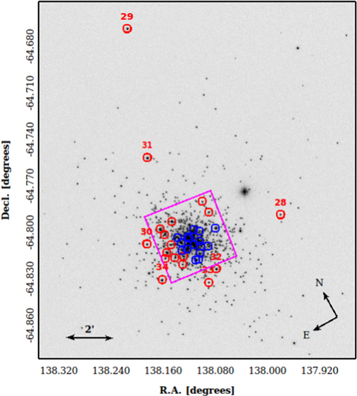
Figure 9. The 34 UV-bright stars in NGC 2808 marked over the UVIT F154W filter image of the GC. The magenta region marks the HST FOV. The star IDs are indicated near each star in the region outside the HST FOV. The 18 UV-bright stars with UVIT photometry are marked with red circles, and the rest are marked with blue circles.
Download figure:
Standard image High-resolution image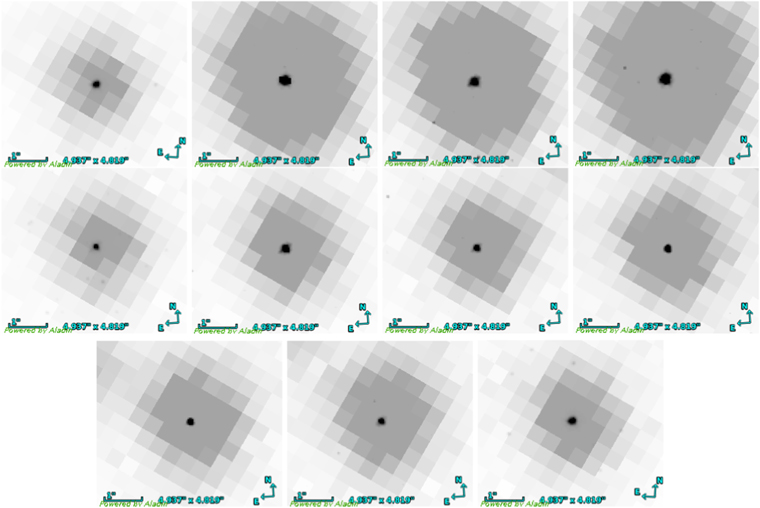
Figure 10. The UVIT F154W images of all 11 UV-bright stars in the inner  region of the cluster that are uniquely cross-matched with stars in the HUGS catalog. Here the UVIT F154W image of each star is shown in gray and overlaid with the corresponding HST F275W detection in black.
Download figure:
Standard image High-resolution imageThese multiwavelength photometric data for the UV-bright stars were used to determine their evolutionary status by estimating various parameters.
5. Spectral Energy Distributions
In order to estimate the parameters such as effective temperature (Teff), luminosity (L), and radius (R) of the UV-bright stars, their SEDs were constructed with the available photometric data points. For this purpose, a virtual observatory functionality, the VO SED Analyser (VOSA; Bayo et al. 2008), was used. VOSA generates synthetic photometry for the chosen theoretical models using the transmission curves of the required photometric filters. The best-fit parameters of the SEDs were estimated by comparing the observed and synthetic photometric points using a χ2 minimization method. The  value is calculated using the relation

where N is the number of photometric points, Nf is the number of fitted parameters for the model, Fo,i is the observed flux, Fm,i is the theoretical flux predicted by the model,  is the multiplicative dilution factor (where R is the radius of the star and D is the distance to the star), and σo,i is the error in the observed flux. We assumed a distance of D = 9.6 kpc and E(B − V) = 0.22 mag (H96) for all stars in the cluster. VOSA uses the Fitzpatrick reddening relation (Fitzpatrick 1999) to account for the extinction in the observed photometric points.
For all UV-bright stars except two, we used the Kurucz stellar atmospheric models (Castelli et al. 1997; Castelli & Kurucz 2003), and log g, [Fe/H], and Teff are the possible free parameters for fitting the SED. In these models, the ranges of admissible values for the free parameters are 0.0–5.0 for log g, −2.5–0.5 for [Fe/H], and 3500–50,000 K for Teff. For the remaining two stars, i.e., stars 3 and 32 in Table 3, the Tübingen NLTE Model Atmosphere Package (TMAP Tübingen; Werner & Dreizler 1999; Rauch & Deetjen 2003; Werner et al. 2003) was used, as the Kurucz model parameter space was inadequate to fit the SEDs of these stars. The free parameters in these models include Teff in the range 30,000–1,000,000 K, log g ranging from 3.8 to 9, and H, He mass fractions in the range 0–1.
Table 3. Results of the SED Analysis of UV-bright Stars in the Cluster
| ID | R.A. | Decl. | Model | Teff | ΔTeff |

|

|

|

|

|
Nfit | Phot. Used |
|---|---|---|---|---|---|---|---|---|---|---|---|---|
| (deg) | (deg) | (K) | (K) | |||||||||
| (1) | (2) | (3) | (4) | (5) | (6) | (7) | (8) | (9) | (10) | (11) | (12) | (13) |
| Star 1 | 137.96181 | −64.84165 | Kurucz | 27,000 | 500 | 50.80 | 0.27 | 0.33 | 0.01 | 7.58 | 11 | FUV, NUV, opt. |
| Star 2 | 138.02575 | −64.84307 | Kurucz | 21,000 | 500 | 352.95 | 1.53 | 1.42 | 0.07 | 8.21 | 10 | FUV, NUV, opt. |
| Star 3 | 138.06046 | −64.86146 | TMAP | 80,000 | 3750 | 2857.45 | 0.88 | 0.28 | 0.03 | 3.31 | 8 | FUV, NUV, opt. |
| Star 4 | 138.05040 | −64.84379 | Kurucz | 39,000 | 500 | 781.10 | 0.95 | 0.61 | 0.02 | 4.51 | 9 | FUV, NUV, opt. |
| Star 5 | 138.04719 | −64.87492 | Kurucz | 27,000 | 500 | 59.54 | 0.25 | 0.35 | 0.01 | 2.34 | 10 | FUV, NUV, opt. |
| Star 6 | 138.06813 | −64.86459 | Kurucz | 12,500 | 125 | 108.50 | 1.11 | 2.20 | 0.04 | 6.86 | 11 | FUV, NUV, opt. |
| Star 7 | 138.05264 | −64.86779 | Kurucz | 22,000 | 500 | 85.73 | 0.44 | 0.64 | 0.03 | 3.36 | 9 | FUV, NUV, opt. |
| Star 8 | 138.04842 | −64.84887 | Kurucz | 16,000 | 500 | 117.20 | 0.96 | 1.41 | 0.09 | 6.44 | 10 | FUV, NUV, opt. |
| Star 9 | 138.04760 | −64.85790 | Kurucz | 17,000 | 500 | 109.80 | 0.78 | 1.21 | 0.07 | 3.50 | 10 | FUV, NUV, opt. |
| Star 10 | 138.03820 | −64.87028 | Kurucz | 22,000 | 500 | 106.20 | 0.62 | 0.71 | 0.03 | 5.78 | 10 | FUV, NUV, opt. |
| Star 11 | 137.96088 | −64.85092 | Kurucz | 26,000 | 500 | 79.93 | 0.32 | 0.44 | 0.02 | 3.94 | 9 | FUV, NUV, opt. |
| Star 12 | 138.02716 | −64.86694 | Kurucz | 25,000 | 500 | 102.60 | 0.87 | 0.54 | 0.02 | 0.10 | 7 | FUV, NUV, opt. |
| Star 13 | 138.01470 | −64.85891 | Kurucz | 15,000 | 500 | 128.83 | 2.02 | 1.68 | 0.11 | 0.09 | 7 | FUV, NUV, opt. |
| Star 14 | 138.01349 | −64.86046 | Kurucz | 27,000 | 500 | 86.65 | 0.09 | 0.42 | 0.02 | 4.86 | 7 | FUV, NUV, opt. |
| Star 15 | 138.01173 | −64.86674 | Kurucz | 26,000 | 500 | 131.15 | 0.22 | 0.56 | 0.02 | 1.59 | 7 | FUV, NUV, opt. |
| Star 16 | 138.03578 | −64.86580 | Kurucz | 23,000 | 500 | 54.90 | 0.04 | 0.47 | 0.02 | 1.39 | 5 | NUV, opt. |
| Star 17 | 138.03122 | −64.85554 | Kurucz | 25,000 | 500 | 41.40 | 0.02 | 0.34 | 0.01 | 8.76 | 5 | NUV, opt. |
| Star 18 | 138.03010 | −64.86050 | Kurucz | 22,000 | 500 | 211.00 | 0.07 | 1.00 | 0.05 | 6.01 | 5 | NUV, opt. |
| Star 19 | 138.02244 | −64.87728 | Kurucz | 45,000 | 500 | 633.00 | 0.10 | 0.41 | 0.01 | 1.33 | 5 | NUV, opt. |
| Star 20 | 138.01776 | −64.87794 | Kurucz | 27,000 | 500 | 72.00 | 0.03 | 0.39 | 0.01 | 1.98 | 5 | NUV, opt. |
| Star 21 | 138.01103 | −64.87463 | Kurucz | 24,000 | 500 | 49.30 | 0.08 | 0.41 | 0.02 | 3.75 | 5 | NUV, opt. |
| Star 22 | 138.00244 | −64.87014 | Kurucz | 22,000 | 500 | 102.00 | 0.69 | 0.69 | 0.03 | 0.02 | 5 | NUV, opt. |
| Star 23 | 138.00133 | −64.86623 | Kurucz | 50,000 | 500 | 113.00 | 0.02 | 0.14 | 0.00 | 4.61 | 5 | NUV, opt. |
| Star 24 | 137.99932 | −64.85673 | Kurucz | 50,000 | 500 | 97.80 | 0.13 | 0.13 | 0.00 | 3.77 | 5 | NUV, opt. |
| Star 25 | 137.99187 | −64.87307 | Kurucz | 35,000 | 500 | 56.10 | 0.18 | 0.20 | 0.01 | 0.33 | 5 | NUV, opt. |
| Star 26 | 137.99182 | −64.85956 | Kurucz | 27,000 | 500 | 67.70 | 0.32 | 0.38 | 0.01 | 0.11 | 5 | NUV, opt. |
| Star 27 | 137.96443 | −64.86377 | Kurucz | 50,000 | 500 | 988.00 | 1.22 | 0.42 | 0.01 | 0.26 | 5 | NUV, opt. |
| Star 28 | 137.85352 | −64.87929 | Kurucz | 26,000 | 500 | 65.36 | 0.97 | 0.39 | 0.02 | 2.58 | 15 | FUV, NUV, opt. |
| Star 29 | 137.92453 | −64.70158 | Kurucz | 32,000 | 500 | 145.80 | 1.09 | 0.39 | 0.01 | 2.66 | 15 | FUV, NUV, opt. |
| Star 30 | 138.08369 | −64.84865 | Kurucz | 25,000 | 500 | 98.59 | 1.03 | 0.52 | 0.02 | 2.89 | 13 | FUV, NUV, opt. |
| Star 31 | 138.00728 | −64.79293 | Kurucz | 23,000 | 500 | 251.00 | 2.12 | 0.99 | 0.04 | 4.49 | 14 | FUV, NUV, opt. |
| Star 32 | 137.99974 | −64.89071 | TMAP | 100,000 | 5000 | 3010.25 | 1.20 | 0.18 | 0.02 | 9.06 | 12 | FUV, NUV, opt. |
| Star 33 | 138.02306 | −64.89646 | Kurucz | 26,000 | 500 | 53.26 | 0.51 | 0.36 | 0.01 | 2.39 | 11 | FUV, NUV, opt. |
| Star 34 | 138.09187 | −64.87727 | Kurucz | 24,000 | 500 | 119.91 | 0.75 | 0.63 | 0.03 | 4.40 | 11 | FUV, NUV, opt. |
Note. Columns (1)–(3) show the ID, R.A., and decl. of the objects, respectively. The model used for the SED fit is shown in column (4). The estimated parameters, such as temperature, luminosity, and radius (in solar units), of the stars and the errors in these parameters are tabulated in columns (5)–(10). The errors in the parameters are derived as half the grid step around the best-fit value. Columns (11)–(13), respectively, show the reduced χ2 value corresponding to the fit, the number of photometric points used for fitting, and the corresponding photometric bands. Stars 1–11 have photometry from the UVIT and HUGS. Stars 12–15 have data points from the HST STIS and HUGS. Stars 16–27 have photometry only from HUGS. Stars 28–34 have photometric points from UVIT, GALEX, Gaia, and ground-based optical data. In the last column, opt. stands for optical.
Download table as: ASCIITypeset image
To fit SEDs using Kurucz models, we fixed the [Fe/H] value at −1.0 dex, close to the value for the cluster. Additionally, we constrained the log g to range from 3 to 5 for the Kurucz models and 3.8 to 6 for the TMAP models. This is the observed range of log g values for stars in pHB evolutionary phases from previous studies (Moehler et al. 2019). The important parameters obtained from the SED analysis are tabulated in Table 3. For the two stars fitted with TMAP models, the best-fit values of the H and He mass fractions are 0.7383 and 0.2495 for star 3 and 0.8 and 0.2 for star 32. However, we note that SED fitting is not the optimal method to estimate the above parameters. We do not quote the log g values obtained from the SED fits, as the SED fitting technique does not provide accurate values of this parameter.
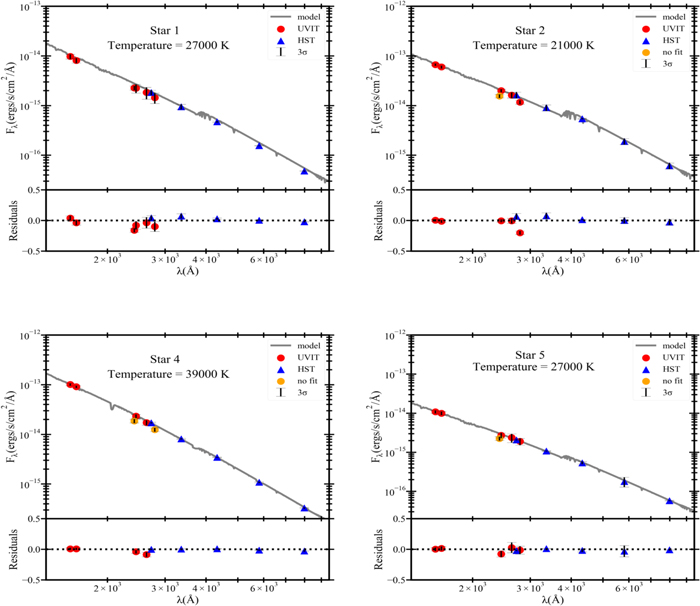
The SEDs for stars 1–11 contain the UVIT (FUV, NUV) and HST (NUV, optical) photometric data points. Stars 12–26, lying within the inner region of the cluster, could not be resolved by the UVIT. Hence, only the HST photometry was used to construct the SEDs of these stars. Four stars among these, namely, stars 12–15, have HST/STIS photometry (FUV, NUV) from Brown et al. (2001), apart from the NUV and optical HUGS data. For stars 27–34, which lie outside the HST FOV, we utilize the UVIT, GALEX (Schiavon et al. 2012), Gaia, and ground-based optical data for SED generation. Examples of SED fits for stars 3 and 28 are shown in Figure 11. The SEDs for the other UVIT-resolved stars are shown in the Appendix. The residuals shown in these plots were calculated for each data point as follows:

where Fo and Fm are the observed and model fluxes corresponding to the photometric points.
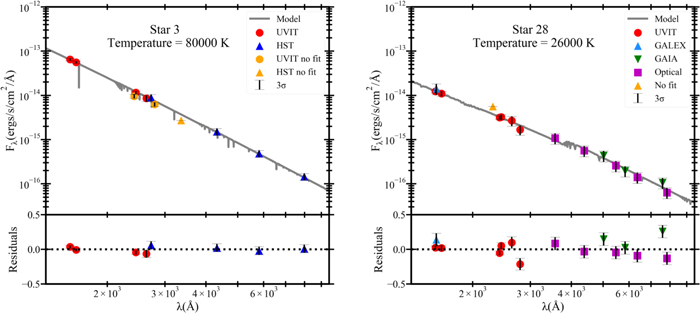
Figure 11. The SEDs for two of the observed UV-bright stars, namely stars 3 and 28, after correcting for extinction. Star 3 lies in the inner region of the cluster and has photometry from the HST and UVIT. Star 28 lies in the outer region and has photometric data from UVIT, GALEX, and Gaia and ground-based optical data from Stetson et al. (2019). In both plots, the photometric points excluded from the fitting procedure are shown with orange symbols. The gray line shows the model spectrum. The residuals of the SED fit are shown in the bottom panels of both plots.
Download figure:
Standard image High-resolution imageFigure 12 shows a histogram of the temperature distribution of the UV-bright stars in the cluster. The values range from 12,500 to 100,000 K with a maximum number of stars having a temperature between 20,000 and 30,000 K.
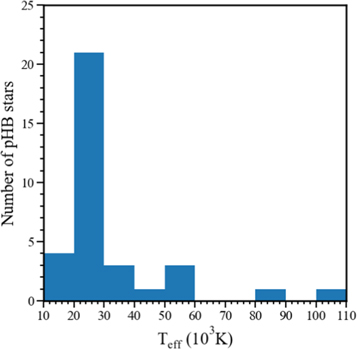
Figure 12. Histogram showing the temperature distribution of UV-bright stars in NGC 2808.
Download figure:
Standard image High-resolution imageFigure 13 shows the trends in the best-fit parameters of the 18 UV-bright stars with UVIT photometry in the mF154W − mN245M versus mF154W CMD. The left, middle, and right panels display the trends in Teff, luminosity, and radius, respectively. Among the five stars with the brightest mF154W magnitudes, the hottest stars are also the most luminous and have the smallest radii. The coolest among these five stars have  2.5 and R/R⊙ ∼ 1.0. The star with the brightest mF154W magnitude has log Teff ∼ 4.6, with a fairly high luminosity (
 3) and a smaller radius (R/R⊙ ∼ 0.5). Most of the remaining pHB stars with mF154W fainter than 15.5 mag have log Teff in the range 4.3–4.5, with
  2.2 and radii R/R⊙ ≲ 0.5. The three coolest stars with mF154W ∼ 16 mag have
  2.0 and are relatively larger in size with R/R⊙ ≳ 1.5.

Figure 13. Trends in the best-fit parameters (effective temperature, bolometric luminosity, and radius) of the 18 UV-bright stars having UVIT photometry shown in the mF154W − mN245M vs. mF154W CMD.
Download figure:
Standard image High-resolution imageIn order to evaluate the importance of FUV data points in the estimation of fundamental parameters, we fitted the SEDs of stars 1–15 and 28–34, excluding their available FUV photometric points. We found that the parameter values changed significantly for stars hotter than Teff = 40,000 K with the underestimation of Teff and L and the overestimation of R. This implied that FUV data are crucial to estimate the parameters of very hot stars. Hence, the results derived for hot stars without FUV data points are to be considered with lesser weight.
Since several previous studies (Bedin et al. 2000; Marino et al. 2017) adopted a reddening value of E(B − V) = 0.19 mag for this cluster, we also fitted the SEDs using this value to see by what amount the estimated parameter values change. With this reddening measure, we found that the effective temperature values decreased by 10% (e.g., in the case of the hottest star) to 20%, the bolometric luminosities decreased by about 20%–30%, and the radii increased by about 5%–10%.
6. Evolutionary Status of UV-bright Stars
The luminosities and temperatures derived from SED analysis were used to assess the evolutionary status of the observed UV-bright stars using the Hertzsprung–Russell (H-R) diagram. We used the pHB evolutionary tracks from Moehler et al. (2019), which are extended versions of the pAGB evolutionary models developed by Miller Bertolami (2016). The tracks correspond to [M/H] = −1 and a zero-age main-sequence (ZAMS) mass of MZAMS = 0.85 M⊙ (age = 12 Gyr) assuming scaled-solar metallicity with initial abundances ZZAMS = 0.00172, YZAMS = 0.24844, and XZAMS = 0.74984. In the models, the RHB, BHB, and EHB sequences were populated by regulating the mass loss on the RGB phase. Further details of the evolutionary tracks are presented in the Appendix.
Figure 14 shows the observed UV-bright stars in black (inner region) and magenta (outer region) inverted triangles plotted over the evolutionary tracks. It is evident from this figure that all of the UV-bright stars except the three most luminous ones have evolutionary masses <0.53 M⊙. Most of these stars are observed to lie along/near the sequence with MZAHB = 0.5 M⊙, which is a track evolving from the EHB phase. These are likely to be AGB-manqué stars, which directly descend the white dwarf cooling sequence after core He exhaustion. The hottest and most luminous UV-bright star (star 32 in Table 3) is located between the tracks with MZAHB = 0.75 and 0.85 M⊙. Star 3, with slightly lower luminosity and Teff, lies at the intersection of two post-RHB sequences with MZAHB = 0.65 and 0.75 M⊙. From the models, the mass of this star then ranges from 0.527 to 0.544 M⊙. Two stars (23 and 24) are found to be located outside the range of the model tracks.
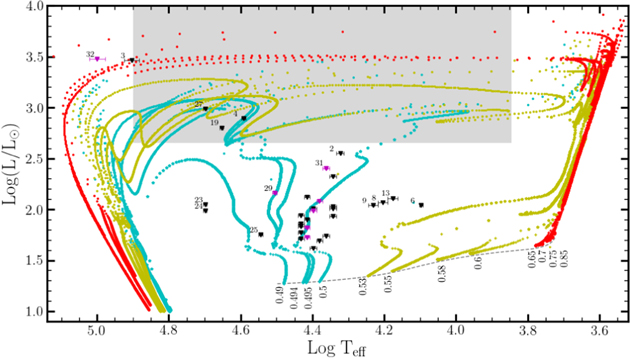
Figure 14. Stellar evolutionary tracks starting from the ZAHB (Moehler et al. 2019). Red, olive green, and cyan represent sequences evolving from the RHB, BHB, and EHB, respectively. The plus sign indicates HB location and is plotted after every megayear. The stars and circles represent pHB evolution and are plotted with time steps of 0.1 Myr and 1 kyr, respectively. The value indicated below each sequence represents the mass at the ZAHB for the particular sequence, MZAHB, in units of solar mass. The gray region marks the domain of hot p(e)AGB stars. The gray dashed line represents the BaSTI ZAHB model. The observed UV-bright stars are plotted with black (located within the inner region of the cluster) and magenta (outer region) symbols with error bars. The numbers marked close to some of the sparsely located stars indicate their IDs from Table 3.
Download figure:
Standard image High-resolution imageMoehler et al. (2019) considered the area defined by  and 4.9 > log Teff > 3.845 in the H-R diagram (region shaded in gray in Figure 14) to correspond to hot UV-bright p(e)AGB stars. Going by their definition, from Figure 14, we observe three stars lying inside this region and one star on the high-temperature boundary. Among the three stars that are inside the gray shaded region, two (stars 4 and 19) are quite unlikely to be p(e)AGB stars, as they are located close to the evolutionary track with MZAHB = 0.494 M⊙. The remaining star (star 27) occupies a position where post-EHB (cyan) and post-BHB (olive green) sequences overlap, making it difficult to distinguish. Hence, only the hot and luminous star (star 3) seen on the boundary of the shaded region can be confirmed as a hot p(e)AGB star. In other words, the cluster has a maximum of two and a minimum of one detected hot p(e)AGB candidate based on the above definition. We have detected one star (star 32) hotter than the hot boundary of the shaded region. This star might have crossed the p(e)AGB stage and is probably evolving toward the white dwarf stage.
6.1. Comparison of Theoretically Expected and Observed Numbers of Hot p(e)AGB Stars
We now make a comparison of the observed number of hot p(e)AGB stars with the number of such stars anticipated from theoretical predictions. For this, we make use of the evolutionary flux method described in detail in Greggio & Renzini (2011). The following suppositions are made in this calculation: (a) GCs are simple stellar populations (SSPs), (b) the rate at which stars end up as remnants is equal to the rate at which stars leave the MS, and (c) the lifetimes of later stages of stellar evolution are considerably shorter than that of MS evolution. Under this premise, the number of stars, Ni, in a particular stage of evolution, i, in an SSP is given by the relation

Here B(t) is the specific evolutionary flux, which is the number of stars entering (or exiting) a certain phase of stellar evolution per year per luminosity (L⊙) of the sampled population; Ltotal is the total luminosity of the stellar population; and ti is the duration of the evolutionary phase being analyzed. Assuming an age of ∼10 Gyr for the cluster and Salpeter's initial mass function, we can obtain an approximate value for the specific evolutionary flux of B ≃ 2 × 10⁻¹¹ stars yr–1 L–1⊙.
In this analysis, we consider stars in the hot p(e)AGB phase of evolution, which corresponds to the gray shaded region in Figure 14. Each evolutionary track spans a duration, t, in this region. In order to estimate the expected number of hot p(e)AGB stars from Equation (3), we use the parameters for NGC 2808 listed in Table 4. The anticipated number of p(e)AGB stars in a cluster depends on how frequently a particular evolutionary track is followed in that cluster, which in turn depends on the fraction of stars in various parts of the HB. We calculate the number of p(e)AGB stars evolving along all of the evolutionary tracks starting from each branch of the HB, i.e., NRHB, NBHB, and NEHB for stars evolving from the RHB, BHB, and EHB, respectively, using Equation (3) (Moehler et al. 2019). For this, we derive the fraction of RHB, BHB, and EHB stars with respect to the total number of HB stars in the cluster (fRHB, fBHB, and fEHB) by combining the members of the HUGS and Gaia catalogs for complete spatial coverage. The values thus obtained are fRHB = 0.47, fBHB = 0.35, and fEHB = 0.07. The final expected number of hot p(e)AGB stars in the cluster is then

We obtain a range for N, since NRHB, NBHB, and NEHB take a range of values depending on the duration in the p(e)AGB phase along each evolutionary track. Thus, for NGC 2808, we estimate the expected number of hot p(e)AGB stars in the gray shaded region of the H-R diagram as 1.27–3.80. The maximum observed number of p(e)AGB stars detected in this shaded region is two, which is in good agreement with the expected number of such stars.
Table 4. Parameters for NGC 2808
| Parameter | Value | Source |
|---|---|---|
| [Fe/H] | −1.14 dex | H96 |
| Age | 10.9 Gyr | Massari et al. (2016) |
| Integrated V magnitude, Vt | 6.20 mag | H96 |
Distance modulus, 
|
15.59 mag | H96 |
| Reddening, E(B − V) | 0.22 mag | H96 |
| Bolometric correction, BCV | −0.45 mag | Worthey (1994) |
Download table as: ASCIITypeset image
7. Discussion
We identify and characterize the sample of UV-bright member stars in NGC 2808 using the photometric data from the UVIT in combination with HST, Gaia, and ground-based observations. The detection of these stars is extremely important to build a statistically significant sample that can aid in understanding the late phases of evolution of low-mass stars and determining their contribution to the UV luminosity of old stellar systems. As highlighted earlier, observations in the UV wave bands are critical for this purpose. The UV-optical and UV CMDs constructed by combining the UVIT data with the HST (inner  region of the GC), Gaia, and ground-based optical data (outside the HST FOV) reveal the sequences of hot members in the cluster. We do not use the UVIT data for stars within the innermost
  diameter region because of the possible effects of crowding. In the FUV filters, we detect mainly the pHB, BHB, EHB, BHk, and BSS populations, whereas in the NUV filters, the cooler RHB stars can also be spotted. The identification of the HB location is supported by the overlaid ZAHB and TAHB models.
Brown et al. (2001) observed the central  region of NGC 2808 using HST/STIS FUV/F25QTZ and NUV/F25CN270 filters. Although a direct comparison cannot be made between their and our UV CMDs (due to the differences in the filter characteristics and the FOV covered), some general features of the CMDs can be examined in detail. In their FUV − NUV versus FUV CMD, a gap between the BHB and EHB was found at an FUV − NUV color of ∼–1 mag. They also found a sparse subluminous population of stars below the end of the canonical ZAHB and explained them by invoking the late-hot flasher (BHk) scenario having enhanced He and C abundances due to flash mixing. The spread in the magnitudes of these stars was accounted for by the evolution of BHk stars to higher luminosities as the He-core burning progressed. We find a similar spread in the BHk magnitudes in our mF154W − mN245M versus mF154W CMD shown in Figure 8. Brown et al. (2001, 2010) noted that some of these BHk stars are unusually redder, i.e., redder than expected from the models for normal BHk or EHB stars. A similar dispersion in the color of BHk stars is observed in our FUV − NUV versus FUV CMD. Brown et al. (2012) analyzed the UV spectra of two BHk stars with redder FUV − NUV colors and found that there is a large enhancement of Fe-peak elements in these stars that could serve as an explanation for their observed colors.
Brown et al. (2012) also discussed the results of UV spectral analysis of three unclassified objects, U1, U2, and U3, which are hotter than their canonical HB model. Based on their spectra and locations in the UV CMD, the possibilities of them being evolving pAGB stars or white dwarfs were disregarded. It was found that U1 and U2 have implausible effective temperatures (∼250,000 K), and U3 has Teff = 50,000 K. These objects did not have any X-ray counterparts. The authors were unable to conclusively explain these unusually hot objects, although propositions such as the presence of an accretion disk in the objects, a change in extinction along the line of sight to the cluster, a nonstellar source, etc., were put forth. These objects, located within 30'' of the cluster center, are not resolved in the UVIT images. However, two of these objects, namely, U1 and U3, could be cross-matched with stars in the HUGS catalog having membership a probability >90%. These are found in the BHk and EHB positions, respectively, in the mF275W − mF438W versus mF336W CMD shown in Figure 3. We detect similar objects in our UV CMDs in Figure 8 with bluer mF154W − mN245M colors (≲–1 mag) than the ZAHB model and roughly the same magnitudes as the HB. We plan to characterize the HB stars in our future study.
The study by Schiavon et al. (2012) did not include the full sample of pHB stars in NGC 2808 due to the limited spatial resolution of GALEX and the lack of membership analysis for these stars. There are 22 candidates in their list of UV-bright stars in NGC 2808. We find 15 stars to be in common between our sample and theirs.
The UV CMD presented in Brown et al. (2001) shows one pAGB candidate star with an FUV magnitude of 12.46 mag. This star is unresolved in the UVIT images and not included in the HUGS catalog, as it is saturated in the WFC3/UVIS filters. Hence, our analysis does not include this star. Brown et al. (2001) also found five pHB candidates from the UV CMD, of which four stars are common with our catalog. The fifth pHB candidate is not included in the HUGS catalog; hence, its membership cannot be assessed, even though it is detected in the UVIT images (R.A. = 138 0235, decl. = −6486531).
In Table 5, we compare our estimates of Teff with the values available in the literature for three UV-bright stars in the cluster. Brown et al. (2012) derived the Teff for the AGB-manqué star AGBM1 using the HST/STIS UV spectrum. Moehler et al. (2019) estimated the Teff values for the stars C4594 and C2946 using the medium-resolution optical spectra from the EFOSC2 instrument at the 2.2 m MPI/ESO telescope. From the table, it is evident that the Teff values derived through SED analysis are in close agreement with spectroscopic estimations.
Table 5. Comparison of Teff Values Derived by Us through SED Analysis with Those Available in the Literature for Three UV-bright Stars
| ID | ID in Literature | Teff from Literature | Teff from Our Analysis | Reference |
|---|---|---|---|---|
| (K) | (K) | |||
| Star 13 | AGBM1 | 14,500 | 15,500 ± 500 | Brown et al. (2012) |
| Star 31 | C4594 | 19,900 ± 1600 | 23,000 ± 500 | Moehler et al. (2019) |
| Star 34 | C2946 | 24,900 ± 1800 | 24,000 ± 500 | Moehler et al. (2019) |
Note. The errors quoted in our Teff values are estimated as half the model grid step, around the best-fit value, during the SED fit. The first column shows the ID of the stars from Table 3.
Download table as: ASCIITypeset image
Moehler et al. (2019) calculated the theoretically expected numbers of hot p(e)AGB stars in 17 galactic GCs (excluding NGC 2808) and compared them with the observed numbers. The numbers matched more or less in the case of 14 clusters. In the remaining three clusters, the observed numbers of p(e)AGB stars were larger than the predicted values. The massive and dense GC NGC 5139 (ω Cen) has the maximum number of observed p(e)AGB stars (five), with the expected number in the range 1.3–13.5. Here we find that the number of such stars is between one and three (including the saturated pAGB candidate from Brown et al. 2001), which agrees well with the expected number for NGC 2808.
The pHB stars identified in this study will provide a good sample to explore the stellar evolutionary properties in this phase. From Figure 9, we see that there are seven member stars located in the outer region of the cluster that are ideal candidates for further follow-up spectroscopic studies. These are identified from the AstroSat/UVIT images and are in relatively less crowded regions of the cluster. This GC is known to host populations with a wide range of MS He abundances (Piotto et al. 2007; Milone et al. 2015). In addition, many of the UV-bright stars with Teff > 25,000 K are likely to experience gravitational settling and/or weak winds that may alter their surface He (and metal) abundance (e.g., Dixon et al. 2017). These abundance uncertainties call for thorough spectroscopic investigation. Moreover, spectroscopy can provide accurate estimation of Teff, log g, and radial velocity and its variation (if any); detailed chemical abundance information on the signs of third dredge-up (which will help to clearly distinguish between p(e)AGB and pAGB phases); and so on.
8. Summary
- 1.We performed a comprehensive study of the UV-bright member stars in the GC NGC 2808 using the AstroSat/UVIT, HST, Gaia DR2, and ground-based optical data. The identification and detailed study of these stars are important to create a statistically significant sample for two main reasons: (i) to shed light on the rapid evolution of the late phases of low-mass stars, such as the pAGB, p(e)AGB, and AGB-manqué phases, and (ii) to assess the contribution of these stars to the total UV output of old stellar systems.
- 2.Member stars in the inner and outer parts of the cluster are identified to create optical, UV-optical, and UV CMDs. The stars in the HB sequence are identified and compared with the ZAHB and TAHB models. A large number of hot HB stars are detected along with an FUV-bright BSS. These will be studied in detail in the future.
- 3.We detected 34 UV-bright stars based on their locations in the UV CMDs. Among these, 27 stars are found to be located within the inner
 region of the cluster, and seven stars are in the outer region.
 - 4.We estimated parameters such as the Teff, R/R⊙, and L/L⊙ of these stars through the SED fitting technique. Their effective temperatures range from 12,500 to 100,000 K, luminosities from ∼40 to 3000 L⊙, and radii from 0.13 to 2.2 R⊙. Our Teff estimations from SED fitting are found to match well with the available spectroscopic estimations for a few stars from the literature.
- 5.By comparing the derived parameters with theoretical models available for evolved stellar populations, the evolutionary status of these stars is probed. We find that most UV-bright stars have evolved from EHB stars with MZAHB = 0.5 M⊙, and these are in the AGB-manqué phase. From the theoretical models, we observe that all except the three hottest and most luminous UV-bright stars have HB progenitors with MZAHB < 0.53 M⊙.
- 6.The expected number of hot p(e)AGB stars in NGC 2808 is estimated from stellar evolutionary models and found to agree well with the observed number.
- 7.Seven pHB stars identified in the outer region are ideal for further spectroscopic follow-up studies. These stars are identified from the AstroSat/UVIT images. This work thus demonstrates the capability of the UVIT in detecting and characterizing the UV-bright stars.

We thank the anonymous referee for the encouraging comments and suggestions. We are thankful to S. Moehler for her valuable comments that helped in improving the manuscript. We thank Gaurav Singh for providing us the catalog of Gaia proper motion–based cluster members. D.S.P. thanks Sharmila Rani and Vikrant Jadhav for useful discussions. This publication utilizes data from the AstroSat mission's UVIT, which is archived at the Indian Space Science Data Centre (ISSDC). The UVIT project is a result of collaboration between IIA, Bengaluru; IUCAA, Pune; TIFR, Mumbai; several centers of ISRO; and CSA. This research made use of VOSA, developed under the Spanish Virtual Observatory project supported by the Spanish MINECO through grant AyA2017-84089. This research also made use of Topcat (Taylor 2005); the Aladin sky atlas developed at CDS, Strasbourg Observatory, France (Bonnarel et al. 2000; Boch et al. 2014); Matplotlib; NumPy; SciPy; and pandas.
Appendix
The details of the pHB evolutionary sequences from Moehler et al. (2019) used in the main text are presented in Table 6. The UVIT photometric magnitudes and magnitude errors for the UVIT-resolved pHB members are presented in Table 7. The SEDs for the UVIT-resolved stars other than the ones shown in the main text (stars 3 and 28), are displayed in Figure 15.
Table 6. pHB Evolutionary Model Parameters from Moehler et al. (2019)
| MZAHB | Teff, ZAHB | log gZAHB | HB Location | pHB Behavior | Mfinal |
|---|---|---|---|---|---|
| (M⊙) | (K) | (cms−2) | (M⊙) | ||
| [M/H] = −1, Age = 12 Gyr, MZAMS = 0.85 M⊙ | |||||
| 0.490 | 30,138 | 5.74 | EHB | Post-EHB, no thermal pulses | 0.490 |
| 0.494 | 26,706 | 5.52 | EHB | One thermal pulse (like an LTP) | 0.493 |
| 0.495 | 26,152 | 5.49 | EHB | One thermal pulse (like an LTP) | 0.495 |
| 0.500 | 24,040 | 5.34 | EHB | Two thermal pulses (like an LTP) | 0.496 |
| 0.530 | 17,770 | 4.78 | BHB | Post-EAGB, two thermal pulses (like an LTP) | 0.499 |
| 0.550 | 15,264 | 4.48 | BHB | TP-AGB + LTP | 0.504 |
| 0.580 | 11,097 | 3.80 | BHB | TP-AGB + LTP | 0.513 |
| 0.600 | 8815 | 3.35 | BHB | TP-AGB | 0.518 |
| 0.650 | 5724 | 2.56 | RHB | TP-AGB + LTP | 0.528a |
| 0.700 | 5484 | 2.50 | RHB | TP-AGB | 0.537 |
| 0.750 | 5392 | 2.47 | RHB | TP-AGB | 0.545 |
| 0.850 | 5315 | 2.46 | RHB | TP-AGB | 0.555 |
Notes. Here TP-AGB stands for thermally pulsing AGB, and LTP stands for Late thermal pulse.
aThese sequences end up highly H-deficient due to burning or dilution of the H-rich envelope during the last He-shell flash.Download table as: ASCIITypeset image
Table 7. The UVIT Photometry of pHB Member Stars in the GC NGC 2808
| ID | R.A. | Decl. | F154W | err1 | F169M | err2 | N242W | err3 | N245M | err4 | N263M | err5 | N279N | err6 |
|---|---|---|---|---|---|---|---|---|---|---|---|---|---|---|
| (deg) | (deg) | |||||||||||||
| (1) | (2) | (3) | (4) | (5) | (6) | (7) | (8) | (9) | (10) | (11) | (12) | (13) | (14) | (15) |
| Star 1 | 137.96181 | −64.84165 | 18.437 | 0.039 | 18.514 | 0.041 | 19.017 | 0.033 | 18.924 | 0.070 | 18.757 | 0.093 | 18.783 | 0.083 |
| Star 2 | 138.02575 | −64.84307 | 16.349 | 0.018 | 16.346 | 0.023 | 16.923 | 0.029 | 16.549 | 0.023 | 16.389 | 0.045 | 16.515 | 0.031 |
| Star 3 | 138.06046 | −64.86146 | 16.376 | 0.020 | 16.417 | 0.018 | 17.450 | 0.038 | 17.135 | 0.027 | 17.077 | 0.056 | 17.190 | 0.037 |
| Star 4 | 138.05040 | −64.84379 | 15.899 | 0.018 | 15.891 | 0.018 | 16.724 | 0.031 | 16.380 | 0.028 | 16.325 | 0.040 | 16.444 | 0.032 |
| Star 5 | 138.04719 | −64.87492 | 18.313 | 0.030 | 18.289 | 0.034 | 19.015 | 0.039 | 18.710 | 0.052 | 18.476 | 0.088 | 18.483 | 0.068 |
| Star 6 | 138.06813 | −64.86459 | 17.817 | 0.025 | 17.727 | 0.031 | 17.826 | 0.024 | 17.680 | 0.039 | 17.419 | 0.053 | 17.439 | 0.055 |
| Star 7 | 138.05264 | −64.86779 | 17.888 | 0.028 | 17.825 | 0.029 | 18.629 | 0.045 | 18.274 | 0.052 | 18.105 | 0.094 | 18.224 | 0.060 |
| Star 8 | 138.04842 | −64.84887 | 17.597 | 0.025 | 17.559 | 0.029 | 18.087 | 0.031 | 17.702 | 0.046 | 17.473 | 0.064 | 17.525 | 0.049 |
| Star 9 | 138.04760 | −64.85790 | 17.657 | 0.025 | 17.611 | 0.034 | 18.208 | 0.055 | 17.799 | 0.041 | 17.588 | 0.051 | 17.524 | 0.056 |
| Star 10 | 138.03820 | −64.87028 | 17.613 | 0.023 | 17.579 | 0.030 | 18.743 | 0.061 | 18.031 | 0.042 | 17.930 | 0.075 | 17.856 | 0.059 |
| Star 11 | 137.96088 | −64.85092 | 18.006 | 0.032 | 18.004 | 0.035 | 18.540 | 0.032 | 18.277 | 0.044 | 17.995 | 0.071 | 18.403 | 0.065 |
| Star 28 | 137.85352 | −64.87929 | 18.184 | 0.029 | 18.178 | 0.044 | 18.652 | 0.030 | 18.525 | 0.048 | 18.342 | 0.087 | 18.623 | 0.087 |
| Star 29 | 137.92453 | −64.70158 | 17.404 | 0.025 | 17.465 | 0.025 | 17.807 | 0.022 | 17.749 | 0.034 | 17.675 | 0.048 | 17.814 | 0.054 |
| Star 30 | 138.08369 | −64.84865 | 17.747 | 0.025 | 17.738 | 0.031 | 18.173 | 0.026 | 18.010 | 0.041 | 17.975 | 0.071 | 17.932 | 0.053 |
| Star 31 | 138.00728 | −64.79293 | 16.723 | 0.020 | 16.748 | 0.020 | 17.058 | 0.019 | 16.917 | 0.020 | 16.855 | 0.042 | 16.950 | 0.039 |
| Star 32 | 137.99974 | −64.89071 | 16.906 | 0.025 | 16.953 | 0.024 | 17.844 | 0.035 | 17.583 | 0.038 | 17.515 | 0.044 | 17.712 | 0.066 |
| Star 33 | 138.02306 | −64.89646 | 18.447 | 0.034 | 18.477 | 0.036 | 18.759 | 0.025 | 18.569 | 0.055 | 18.339 | 0.082 | 18.651 | 0.093 |
| Star 34 | 138.09187 | −64.87727 | 17.489 | 0.025 | 17.493 | 0.027 | 18.003 | 0.035 | 17.779 | 0.042 | 17.745 | 0.064 | 17.704 | 0.063 |
Note. Column (1) lists the star ID; columns (2) and (3) correspond to the R.A. and decl. of the stars; and columns (4)–(15) give the magnitudes and errors (AB system) in different UVIT filters. Note that the magnitudes are not corrected for extinction. The stars with IDs 12–27 are not resolved by UVIT and hence not available in this table.
Download table as: ASCIITypeset image
Download figure:
Standard image High-resolution image
Download figure:
Standard image High-resolution image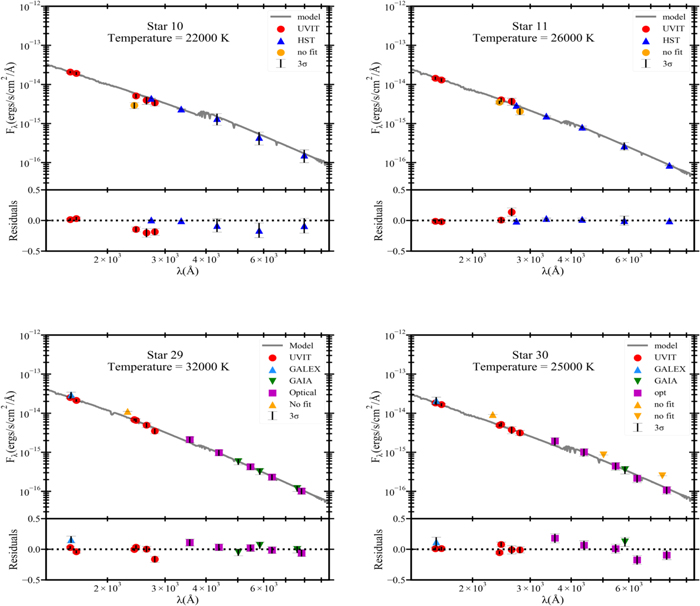
Download figure:
Standard image High-resolution image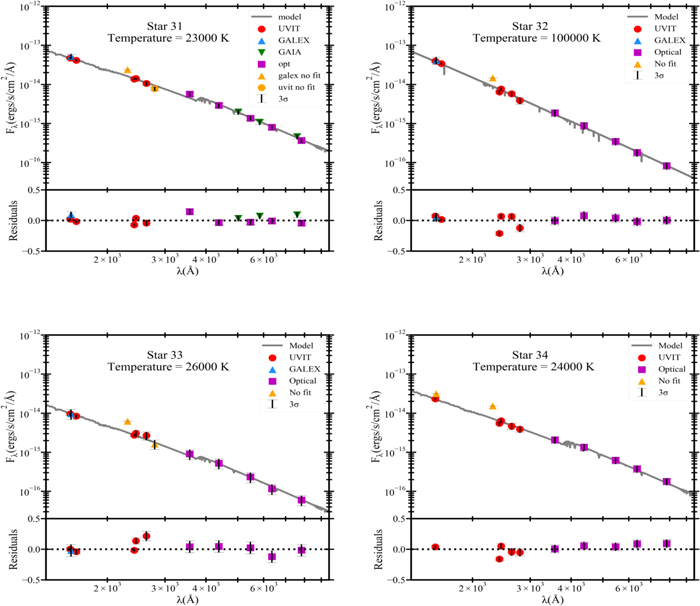
Figure 15. The SEDs for UV-bright stars listed in Table 7, except those of stars 3 and 28, which are already shown in Figure 11. For stars lying within the HST FOV, photometric data from UVIT and HST are used for fitting the SEDs. For those in the outer region, data from UVIT, GALEX, and Gaia and ground-based optical data from Stetson et al. (2019) are used. The photometric points excluded from the fitting procedure are shown with orange symbols. The gray line shows the model spectrum. The residuals of the SED fit are shown in the bottom panels of each plot.
Download figure:
Standard image High-resolution image
Footnotes
- 3
We use the notation p(e)AGB to indicate either pAGB or p(e)AGB stars.
- 4
We used the conversion factors from http://waps.cfa.harvard.edu/MIST/BC_tables/zeropoints.txt.