


ABSTRACT
In this paper, we analyze 1420 MHz continuum and H i observations of the supernova remnant (SNR) 3C 397 (G41.1-0.3). The H i absorption spectra show clear absorption up to the tangent point velocity and also the absence of absorption at 50–60 km s−1. This yields lower and upper limits to the distances of 6.3 ± 0.1 and 9.7 ± 0.3 kpc, which are better and more robust than previous estimates. We apply generalized SNR models to 3C 397, including the ejecta-dominated phase and the transition-to-Sedov phase. Using emission measures from the X-ray and mean gas density from the infrared, we show that the hard X-ray component has the dominant filling factor and the soft X-ray component has a very small filling factor. The models are required to be consistent with 3C 397's measured properties, including the observed shock temperatures and shock radii. Consistent models are found if 3C 397 has a distance in the range of ≃8–9.7 kpc. For an 8 kpc distance, the estimated age is ≃1350 years and the explosion energy is 1.0 × 1051 erg, while for 9.7 kpc, the the most probable age is ≃1750 years and the energy 1.5 × 1051 erg.
Export citation and abstract BibTeX RIS
1. INTRODUCTION
Supernova remnants (SNRs) remain an important area of study, providing valuable information for different fields of astrophysics, including stellar evolution, the evolution of the Galaxy, and its interstellar medium. For example, SNRs are the dominant source of kinetic energy input into the interstellar medium, but the details are not understood. The main component of an SNR is its hot-shocked gas, with a temperature ∼1 keV. This is detected and studied using its X-ray emission. Determining the distance to an SNR is crucial in determining its physical properties such as luminosity, size, and age. One can estimate the distance to a SNR using H i absorption spectra combined with a model of Galactic rotation. Only very few of the almost 300 SNRs in our Galaxy have been characterized well enough to determine their evolutionary state, including explosion type, explosion energy, and age. The characterization of many more Galactic SNRs is necessary before we can understand the population of SNRs and their effects on the interstellar medium. Here we present a new study of the SNR 3C 397, including its distance, physical properties, and evolutionary state.
3C 397 (G41.1-0.3) is one of the brightest Galactic radio SNRs and has an irregular shape. The nearby H ii region G41.1-0.2, ∼5' west, was first separated from the SNR 3C 397 by Caswell et al. (1975a). Early observations failed to resolve the two objects, yielding a combined spectral index of −0.3 and a distance of 5.3 kpc (Milne 1970). Radhakrishnan et al. (1972) found absorption up to the tangent point from an interferometric measurement, showing that 3C 397 is beyond the tangent point. Caswell et al. (1975b) obtained an absorption profile including negative velocities and found weak absorption (fractional absorption of 0.3) at −37 km s−1 but no absorption at −50 km s−1. Thus, the distance to the SNR was estimated to be 7.5–19 kpc, or 18–19 kpc if a −37 km s−1 feature is real, based on the Sun's distance to the Galactic center of 10 kpc. Milne (1979) applied the Σ–D relation to estimate the distance to be 12.8 kpc. A 20 cm image was published by Caswell et al. (1982), giving the angular diameter of the SNR as 3 6 and a radio spectral index of −0.49. Even though the H ii region is near the SNR 3C 397 on the sky, it is unknown whether they are physically near or if they are at greatly different distances along the line of sight. Cersosimo & Magnani (1990) detected H159α and H200β recombination lines from the H ii region G41.1-0.2 at a radial velocity of ∼58 km s−1, but not from 3C 397.
There have been some challenges in classifying the nature of the SNR 3C 397. The two scenarios initially discussed were a young, ejecta-dominated remnant of a core-collapse SN and a middle-aged remnant expanding in a dense medium (Safi-Harb et al. 2000). Using CHANDRA observations, Safi-Harb et al. (2005) showed that the central X-ray hot spot was not consistent with a pulsar wind nebula, and that the X-ray spectrum required both soft and hard components. They also suggested interaction with a molecular cloud at a radial velocity ∼40 km s−1, thus preferring the second scenario above. Yamaguchi et al. (2015) presented Suzaku X-ray spectroscopic observations of 3C 397 and detected high abundances of nickel and manganese. These abundances are strong evidence that the SNR resulted from the explosion of a white dwarf close to the Chandrasekhar mass. In addition, they used Spitzer infrared spectroscopy to show that the ambient density for 3C 397 is relatively low, confirming their classification of 3C 397 as a Type Ia SNR.
In this paper, we analyze 1420 MHz radio continuum, H i line observations, and CO line observations of 3C 397 to study the H i absorption spectrum. We adopt the improved method for the creation of H i absorption spectra developed by Leahy & Tian (2010). We study the physical conditions of 3C 397, then model its properties to determine the evolutionary state of the SNR. Section 2 describes the observations and data analysis, Section 3.1 discusses the H i absorption spectrum and distance, and Section 3.2 discusses the physical conditions and evolutionary state of 3C 397.
2. OBSERVATIONS AND DATA ANALYSIS
The 1420 MHz radio continuum data and H i line data were obtained from the VLA Galactic Plane Survey or VGPS (Stil et al. 2006). The 13CO(J = 1–0) data are from the Galactic Ring survey (Jackson et al. 2006). We present the 1420 MHz continuum image of the SNR 3C 397 in Figure 1. 3C 397 is the bright source just below the center of the image and the fainter source above it is the H ii region G41.1-0.2.

Figure 1. 1420 MHz VGPS continuum image (grayscale indicated on the bar on the right-hand side) with contours for 3C 397 (just below the center of the image) and the nearby H ii region (just above 3C 397). The contours are at 25, 40, 60, 150, and 200 K. The four rectangles (labeled 1, 2, 3, and 4) overlaying 3C 397 and the two rectangles (labeled A and B) overlaying the H ii region show the areas used for H i spectrum extraction.
Download figure:
Standard image High-resolution imageTo create H i absorption spectra for 3C 397, we chose four regions that include the brightest region of the SNR. Using the brightest continuum regions maximizes the H i absorption signal, which is proportional to the continuum intensity. We chose the background spectrum area to be adjacent to the area for the source spectrum, minimizing the difference in the Galactic H i distribution along the lines of sight to source and background areas (Leahy & Tian 2008; Tian & Leahy 2008; see Leahy & Tian 2010 for a review). The four regions, which include both source and background areas, differ in choice of background area and are shown in Figure 1 by the rectangular boxes overlapping 3C 397. The source and background spectra were extracted using the software program MEANLEV in the DRAO EXPORT package. This allows one to obtain spectra averaged over source and background areas defined by specified continuum brightness temperature (TB) levels. The threshold we used to separate the source and background areas within each rectangular area was TB = 22 K, i.e., all map pixels with the continuum TB above 22 K were used to obtain an average source spectrum from the H i data. Similarly, all map pixels with the continuum TB below 22 K were used to obtain an average background spectrum from the H i data.
The resulting source, background, and difference spectra are shown in the top panels of Figure 2 for regions 1 and 2 of 3C 397, the top panels of Figure 3 for regions 3 and 4 of 3C 397, and the top panels of Figure 4 for regions A and B of the H ii region G41.1-0.2. For each top panel, the top line is the background spectrum, the second line is the source spectrum, and the bottom line is the source spectrum minus the background spectrum. The resulting absorption spectra (e−τ where τ is the optical depth) are shown in the bottom panels (solid lines) of each figure. See Leahy & Tian (2010) for details of determining H i absorption spectra. Also plotted in the bottom panels (dotted lines) are the 13CO spectra extracted for the same regions as the H i spectra.

Figure 2. H i and CO spectra for regions 1 and 2 of the SNR 3C 397. The top panels show the source spectrum (middle line), background spectrum (top line), and difference spectrum (bottom line). The bottom panels show the resulting absorption spectrum (e−τ where τ is the optical depth, solid line) and the CO spectrum (dotted line).
Download figure:
Standard image High-resolution image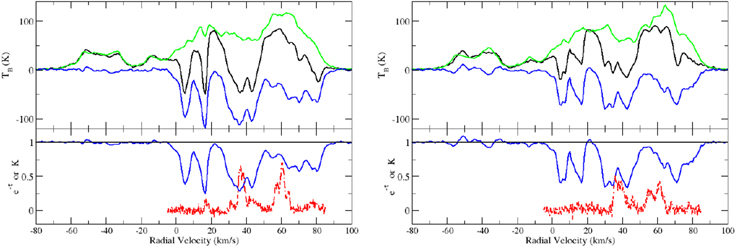
Figure 3. H i and CO spectra for regions 3 and 4 of the SNR 3C 397. The top panels show the source spectrum (middle line), background spectrum (top line), and difference spectrum (bottom line). The bottom panels show the resulting absorption spectrum (e−τ where τ is the optical depth, solid line) and the CO spectrum (dotted line).
Download figure:
Standard image High-resolution image
Figure 4. H i and CO spectra for regions A (top panel) and B (middle panel) of the H ii region G41.1-0.2. The top panels show the source spectrum (middle line), background spectrum (top line), and difference spectrum (bottom line). The bottom panels show the resulting absorption spectrum (e−τ where τ is the optical depth, solid line) and the CO spectrum (dotted line).
Download figure:
Standard image High-resolution imageThe absorption spectra for the four regions of SNR 3C 397 are quite consistent with each other. Generally, one expects differences mainly caused by the small-scale H i distribution along the lines of sight to the pixels of the source region compared to the distribution on pixels of the immediate background. This cannot be avoided, but we have minimized this effect by choosing source and background pixels to be as close together as possible. The magnitude of this H i noise can be estimated by the root-mean-square (rms) of each H i spectrum for velocities where there is no sign of absorption, but where there still is Galactic H i emission. Velocities −60 to ∼−5 km s−1 correspond to the outer Galaxy (outside the solar circle). We omit −5 to 0 km s−1 because it includes gas inside the solar circle which would have small positive velocities, but which has small negative velocities because of random velocities in the interstellar medium: H i absorption is generally measured out to 5 ± 7 km s−1 beyond the velocity of any continuum source (Shaver et al. 1982). In the direction of 3C 397, the rms of e−τ (and hence of τ, where τ is the optical depth, because τ is small) is 0.025. This rms applies to solid angle scales of ∼10 armin2 (the area of the extraction regions). The rms of τ for slightly larger areas (the ∼40 armin2 covering all four regions) is not much larger, 0.03. The latter rms (on scales ∼40 armin2) for velocities inside the solar circle (∼0–90 km s−1) can be estimated from the variance of the four spectra which is 0.06. This is small enough that we can reliably measure clear H i absorption from 0 to 15 km s−1 and from 25 to ∼85 km s−1 for 3C 397. These H i absorption spectra are of much higher quality than any previously published spectra for 3C 397, which have typical errors in τ of ∼0.2.
Similarly, we construct H i absorption spectra for regions A and B of the H ii region G41.1-0.2 and show them in Figure 4. Here we used the threshold TB = 22 K for region A and TB = 26 K for region B. The noise is considerably larger for the H ii region absorption spectra, primarily because it is not as bright in the 1420 MHz continuum as in 3C 397. The rms of τ in this case for outer Galaxy velocities (−60 to ∼−5 km s−1) is 0.2 for region A and 0.3 for region B. The background for region B has a significantly higher radio continuum intensity than for A (see Figure 1), so it is not surprising that the absorption spectrum from B is so noisy. Thus, we use region A as the H i absorption spectrum for the H ii region. Region A shows no sign of absorption for velocities near ∼20–25 km s−1 and no sign of absorption for velocities near ∼50–60 km s−1, similar to the higher quality spectra for 3C 397 (Figures 2 and 3).
3. RESULTS AND DISCUSSION
3.1. H i Absorption and Distance
3.1.1. SNR 3C 397
To interpret the radial velocities of absorption features in terms of distance, we adopt a kinematic model for the rotation of the Galaxy. We use a constant circular rotation speed model to relate radial velocities Vr to the Galacto-centric radius R. We adopt V0 = 218 km s−1 (218 ± 6 km s−1 from Bovy et al. 2012) and R0 = 8.33 kpc (8.33 ± 0.04 ± 0.14 kpc from Dékány et al. 2013). One can convert to distances for different choices of V0 and R0 and account for a circular rotation speed that varies with the Galacto-centric radius using the formula (e.g., see Sparke & Gallagher 2007):

Here, V(R) is the radius-dependent rotation curve. For constant or linear V(R), Equation (1) can be directly inverted to find R given Vr.
The tangent point is at R/R0 = sin(l), which gives a tangent point radius for l = 41 1 of Rtan = 5.48 ± 0.10 kpc, and a tangent point distance dtan = 6.28 ± 0.11 kpc. The adopted rotation curve model gives vtan = 74.7 ± 2.5 km s−1 at l = 411. However, the observed absorption extends to ∼90 km s−1. Allowing for ∼5 km s−1 nominal random velocities in the H i, the observed absorption from gas at the tangent point occurs over a range of velocities from vtan − 5 km s−1 to vtan + 5 km s−1. Because absorption is seen up to 90 km s−1, we infer that vtan is ≃85 km s−1. This discrepancy between the calculated vtan = 74.7 ± 2.5 km s−1 and observed vtan can be accounted for if V(R) is not constant. This requires V(Rtan) to be only slightly larger, e.g., with V(Rtan) = 230 km s−1, the model vtan is 86.7 km s−1, which is consistent with the observed vtan. This larger V(Rtan) = 230 km s−1 is consistent with the published rotation curves determined using the tangent point method (such as given in Figure 2.21 of Sparke & Gallagher 2007). Other authors have suggested a higher rotation velocity for longitudes inside the solar circle in the range of 40°–55°: Reid et al. (2007) give 242 km s−1; Levine et al. (2008) and Leahy et al. (2008) suggest similarly high rotation velocities. Below, we quote distances for two cases: (i) using a constant velocity rotation curve with V0 = 218 km s−1 (called "constant V(R)"), and (ii) using a linearly inward-increasing rotation curve with V0 = 218 km s−1 at R0 and V(Rtan) = 230 km s−1 (called "linear V(R)"). The latter is more complex, but is consistent with the observed tangent point velocity at l = 411, so we take it as the more realistic case. In reality, the fluctuations in measured rotation curves V(R) are probably complex and originate from velocity perturbations caused by the spiral arm structure of our Galaxy.
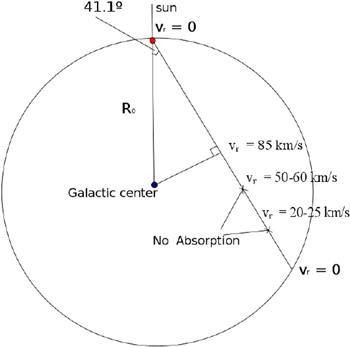
Figure 5 illustrates a top-down view of the Galactic plane showing the location of the Galactic center and the Sun, the solar circle, and the line of sight in the direction of 3C 397 (l = 41°). The positions and velocities are illustrated for the tangent point (radial velocity ∼85 km s−1), farside gas moving at 50–60 km s−1, and farside gas moving at 20–25 km s−1.
Figure 5. Schematic top-down view of the Galactic plane illustrating the solar circle, the line of sight in the direction of 3C 397 (l = 41°), the positions of the tangent point (radial velocity 85 km s−1), farside gas moving at 50–60 km s−1, and farside gas moving at 20–25 km s−1.
Download figure:
Standard image High-resolution image
The main features of the absorption spectra for 3C 397 are as follows. There is absorption at least to the tangent point velocity, which implies that the SNR is beyond the tangent point distance dtan. There is clearly no absorption at ≃20–25 km s−1, yet there is strong H i emission at those velocities (see the background H i spectra in Figures 2 and 3). The emission implies that the H i at those velocities is behind the SNR and beyond the tangent point. For radial velocity ≃20–25 km s−1, the H i is at a distance of 12.3–12.0 (±0.4) kpc (constant V(R)) or 11.3–11.1 (±0.3) kpc (linear V(R)). Thus, 3C 397 is in front of the H i at 25 km s−1 (which, in turn, is in front of the 20 km s−1 H i), i.e., the SNR is at a distance less than 12.0 ± 0.4 kpc (constant V(R)) or 11.1 ± 0.3 kpc (linear V(R)).
Weak (τ ≃ 0–0.2) or none H i absorption is observed for ≃50–60 km s−1. However, the H i emission at velocities near ≃50–60 km s−1 is very strong. In addition, the CO spectra in the bottom panels of Figures 2 and 3 show that there is molecular gas at 50–60 km s−1, which should be surrounded by a significant amount of H i. This leads to the conclusion that there is significant H i at ≃50–60 km s−1 and that most of this H i is behind the SNR because of the lack of strong absorption, i.e., the SNR is in front of the farside gas at 60 km s−1. A small amount of nearside gas at ≃50–60 km s−1, which is in front of the SNR, can account for the weak absorption. There is a secondary peak in the CO spectra at ≃65 km s−1, which is associated with H i absorption (see the lower panels in Figures 2 and 3). This gas is in front of 3C 397 but could be at the nearside distance (2.3 kpc, constant V(R), or 3.1 kpc, linear V(R)) or farside distance (10.2 kpc, constant V(R), or 9.5 kpc, linear V(R)). The farside gas at 60 km s−1 has a distance 10.4 ± 0.3 kpc (constant V(R)) or 9.7 ± 0.3 kpc (linear V(R)). This implies that the SNR is closer than 10.4 ± 0.3 kpc (constant V(R)) or 9.7 ± 0.3 kpc (linear V(R)). The SNR is beyond the tangent point (6.3 ± 0.1 kpc). If the 65 km s−1 absorbing gas is at the farside distance, the lower distance limit for 3C 397 becomes 9.5 ± 0.3 kpc (linear V(R)).
In summary, the absorption to the tangent velocity but absence at ∼50–60 km s−1 places 3C 397's distance between 6.3 ± 0.1 kpc and and 10.4 ± 0.3 kpc (constant V(R)) or 9.7 ± 0.3 kpc (linear V(R)). We use the result for the linear V(R) because it is consistent with the observed tangent point velocity.
3.1.2. H ii Region G41.1-0.2
The H ii region G41.1-0.2 has a recombination line velocity of 58 km s−1 (Downes et al. 1980), placing it either at the near point (d = 2.0 kpc, constant V(R), or d = 2.8 kpc, linear V(R)) or the far point (d = 10.5 kpc, constant V(R), or d = 9.8 kpc, linear V(R)). The far point distances have uncertainties of the order of 3 kpc. The region A H i spectrum (see Figure 4) for G41.1-0.2 shows absorption to the tangent point velocity. This places G41.1-0.2 at the far point distance of 10.5 ± 0.3 kpc (constant V(R)) or 9.8 ± 0.3 kpc (linear V(R)). No absorption at ∼20–25 km s−1 is consistent with the gas at ∼20–25 km s−1 located at the farside distance of 11–12 kpc (see the paragraph above for details of the distance determination), behind the H ii region. Next we address the absence of (or weak) absorption at ≃60 km s−1. The gas at ≃60 km s−1 in this direction must be mostly at the far side distance to explain the lack of absorption by the nearside gas in this velocity range. This is supported by the CO spectra, which show two components of CO gas at 60 and 65 km s−1. The CO gas at 65 km s−1 is associated with H i absorption, so could be at the nearside or farside distance. The CO gas at 60 km s−1 shows no absorption in the H i spectrum for region A, so it must be at the farside distance. Thus, the farside H i at ≃60 km s−1 is consistent with the same velocity (allowing for a few km s−1 velocity dispersion in the H i) and distance as the H ii region. Then the lack of absorption in the H ii region spectrum at ≃60 km s−1 supports the conclusion that the farside ≃60 km s−1 gas is just behind the H ii region. The distance of the H ii region then is the farside distance for 58 km s−1, i.e., 10.5 ± 0.3 kpc (constant V(R)) or 9.8 ± 0.3 kpc (linear V(R)).
The above distance for the H ii region and the limits on distance for SNR 3C 397 do not allow us to determine whether or not they are physically close to each other: the SNR could be at the same distance as the H ii region or the SNR could be anywhere closer providing it is beyond the tangent point (dtan = 6.3 ± 0.1 kpc).
3.2. Physical Conditions and Evolutionary State
3.2.1. Physical Conditions
From the H i absorption spectrum, the distance to 3C 397 is between 6.3 ± 0.1 and 9.7 ± 0.3 kpc (using the preferred linear V(R) model). For determining the physical state of the SNR, we use a nominal distance of 8.0 kpc, and write the distance as d8 × 8 kpc. The uncertainty is ±1.7 kpc, dominated by the range of distances allowed by the H i absorption spectrum.
The angular size of SNR 3C 397, which is noticeably elongated in approximately the east–west direction, is estimated in different ways. The Chandra X-ray and VLA radio images (Safi-Harb et al. 2005) show 3C 397 to be roughly rectangular, with the long axis tilted approximately 30° counter-clockwise from the east–west direction. On the basis of the available images, the radio emission seems to extend slightly (∼10%) larger than the X-ray emission. The Chandra X-ray and VLA radio images yield angular diameters of 25 by 40 and 30 by 43. Yamaguchi et al. (2015) assume a prolate ellipsoid shape, with the unmeasured semi-axis along the line of sight assumed to be the same as the semiminor axis in the sky plane, i.e., they adopt semi-axes of 24, 13, and 13. We find better agreement with their quoted volume if the semi-axes are adjusted to 24, 14, and 14. These values give better agreement with the Chandra and VLA image sizes, so we adopt these values for the prolate spheroid case for 3C 397. This yields a volume for 3C 397 of 7.3 × 1057 . It is also possible that 3C 397 is an oblate spheroid with semi-axes 24, 14, and 24. This would increase the volume to
  cm3.
cm3.
The density of the gas in 3C 397 is constrained from observations. The X-ray emission measures (EMs) constrain the density. The EMs for the hard and soft components were determined for the entire SNR from ASCA X-ray observations (Pshock + Pshock model; Table 1 of Safi-Harb et al. 2000), and for large regions of the SNR from Chandra X-ray observations (eastern and western lobes; Table 3 of Safi-Harb et al. 2005). We find that if we scale the EMs for the eastern and western lobe to the entirety of 3C 397, we obtain the same values as for the ASCA EMs: EMsoft = 32 and EMhard = 0.05. The normalization of the EMs is  cm−5.
cm−5.
The density is measured by Spitzer IR spectra. Yamaguchi et al. (2015) derive post-shock proton densities for two small regions on the rim of 3C 397 as 4.6 ± 0.4 and 8.5 ± 0.8 cm−3; thus, we use the average post-shock proton density of np = 6.5 cm−3. This yields an average post-shock electron density of 7.8 cm−3 for solar abundances. For a strong shock with a compression ratio of four, the pre-shock ambient density is np/4 ≃ 1.6 cm−3. A second estimate of the mean interstellar medium density around the SNR is found using the integrated IR flux. Yamaguchi et al. (2015) obtain a gas mass of  . This includes a factor of five increase to account for the efficiency of the detection of dust emission in the mid-IR. This mass corresponds to an ambient density of 2.1
  cm−3 or 1.2
  cm−3 for the prolate and oblate shapes of 3C 397, respectively. These agree well with the first estimate of ≃1.6 cm−3. Because the second estimate, which is global, agrees well with the first estimate, which is local, the two small regions measured by Spitzer seem to be representative of the mean post-shock density of 3C 397.
Next, we combine the measures of density and EM. There are two components seen in X-rays (the soft component and the hard component). The soft X-ray component has a proton density ns and the hard X-ray component has a proton density nh. The X-ray EMs depend on unknown filling factors: fh for the hard X-ray component and fs for the soft component. The expression for EM for the hard component including the filling factor is:  cm−5, where the factor fh accounts for the fact that the hard component does not fill the entire volume of the SNR. There is an analogous expression for EMsoft with fs and ns. We assume the two components fill the SNR volume: fh + fs = 1. The average interior proton density is given by
  . We take nav = np, i.e., use the measured post-shock proton density.
For the distance 8 kpc, we find that the hard component has a density of nh = 2.1 cm−3 and a filling factor of fh = 0.993, and the soft component has ns = 630 cm−3 and fs = 0.007. For the distance 6.3 kpc, one has nh = 2.4 cm−3, fh = 0.995, ns = 850 cm−3, and fs = 0.005. For the distance 9.7 kpc, one has nh = 1.9 cm−3, fh = 0.991, ns = 500 cm−3, and fs = 0.009. If we use the oblate ellipsoid model for 3C 397 for the distance 8 kpc instead of prolate, we find nh = 1.6 cm−3, fh = 0.985, ns = 330 cm−3, and fs = 0.015. The values for the distances of 6.3 and 9.7 kpc change in a similar manner (decreased nh, fh, and ns, and increased fs).
For the above, we assumed the hard and soft X-ray components are each of uniform density and together fill the entire SNR volume. A more realistic model would take into account the expected hot interior region of the SNR. As a first approximation, we consider a Sedov remnant structure (e.g., Heiles 1964), which has a density less than 20% of the post-shock density and a temperature greater than twice the post-shock temperature for the inner 85% of the radius, or inner 61% of the volume. For this case, the sum of the filling factors is fh + fs ∼ 0.39. One finds nh = 3.4 cm−3, fh = 0.38, ns = 530 cm−3, and fs = 0.009 for the prolate volume model and the distance 8 kpc. These values are not much different than for the uniform interior case, except that the filling factor of the hard component is reduced and its density is increased. Values for distances of 6.3 and 9.7 kpc are similarly modified. In summary, the hard component fills most of the SNR with a density of ∼2–4 cm−3 and the soft component has a high density (∼300–800 cm−3) and a very small filling factor (∼0.005–0.015).
3.2.2. Evolutionary State
Next we consider the evolutionary state of the SNR 3C 397. Above, we found that the soft component has a very small filling factor ∼0.01. This is consistent with a very small volume of the total (pre-explosion) circumstellar medium consisting of dense clouds, whereas the bulk of the circumstellar medium is the material that is shocked to become the hard X-ray component. This means that the evolution of the SNR is determined by the density associated with the hard component. Secondary shocks propagating into the high-density, low filling factor clouds can account for the relatively bright soft X-ray component without significantly affecting the evolution of the SNR.
We use models that include the ejecta-dominated phase, the transition from the ejecta-dominated to the Sedov phase, and the generalized Sedov phase. These are described in Truelove & McKee (1999). Because the SNR is known to be from a Type Ia explosion, we take the circumstellar medium, except for the small dense clouds, to be of constant density, n0. We use an ejecta power-law density profile with index n = 7 appropriate for an SN Ia (e.g., Truelove & McKee 1999).
Recent determinations of Type Ia explosion energies are as follows. Badenes et al. (2005) apply Type Ia models to several SN Ia and find (their Tables 3 and 4) E0 = 0.42 − 1.36 × 1051; for Tycho's SNR, Badenes et al. (2006) find E0 = 1.2 × 1051; and for the young Galactic SN Ia G1.9+0.3, Borkowski et al. (2013) find E0 = 1.38 × 1051. Thus, for the explosion energy, E0, we consider three cases: low (0.5 × 1051 erg), standard (1.0 × 1051 erg), and high (1.5 × 1051 erg).
For either the prolate model or the oblate model geometry of the SNR, the minimum shock radius is Rs = 4.0 d8 pc and the maximum is Rs = 4.8 d8 pc, i.e., the models need to produce shock radii, with the smaller radius corresponding to the narrow dimension of 3C 397 on the sky and the large radius corresponding to the long dimension. For the models here, we consider the nominal distance to 3C 397 of 8 kpc, as well as the lower and upper limits of 6.3 and 9.7 kpc. For 8 kpc, the minimum and maximum shock radii are 4.0 and 4.8 pc, for 6.3 kpc, they are are 3.2 and 3.8 pc, and for 9.7 kpc, they are 4.8 and 5.8 pc.
The average post-shock proton density for 3C 397 is np ∼ 6.5 cm−3 (Yamaguchi et al. 2015). Immediately behind the outer shock, the density of the shocked material (the hard component) is 4n0. However, it decreases fairly rapidly inward, so the mean observed density of the hard component is  . The exact relation between the pre-shock density n0 and the observed mean density of the shocked gas is complex: it depends on the emissivity of the material and instrument sensitivity as well as the density and temperature structure of the SNR. Here we investigate n0 values in the range ≃1.5–5 cm−3, which are consistent with the measured average post-shock proton density.
The observed post-shock temperatures are in the range 1.3–2.2 keV (Safi-Harb et al. 2005). We use the standard relation for an adiabatic shock between shock temperature Ts and shock velocity Vs: , where μ = 0.61 is the mean weight per particle and mp is the proton mass. Thus, shock velocities corresponding to the observed temperatures are in the range 1050–1360 km s−1.
A number of SNR models were calculated with E0 and n0 in the expected range by adjusting the age and phase of evolution to produce current shock radii corresponding to the long and narrow dimensions of 3C 397 for the three distances (nominal, lower limit, and upper limit). In addition, for the nominal distance of 8 kpc, we add one more model for an intermediate shock radius of 4.4 pc. This results in six values of shock radius to produce: 3.2, 3.8, 4.0, 4.4, 4.8, and 5.8 pc. Within the uncertainties, the long dimension of 3C 397 for the distance 6.3 kpc is the same as the short dimension for the distance 8 kpc, so we reduce the list of shock radii for modeling to five values: 3.2, 4.0, 4.4, 4.8, and 5.8 pc.
Table 1 presents a subset of the calculated models. Models with significantly too low or too high shock velocities are not shown. We find that the SNR is either in the transition from the ejecta-dominated to the generalized Sedov phase or early in the generalized Sedov phase. Thus, the use of the generalized Sedov phase and including the transition phase from the ejecta-dominated to the generalized Sedov phase is necessary. We find that none of the acceptable models have reached the stage where radiative losses affects the SNR. Typical timescales for radiative losses are ∼5000–10,000 years.
Table 1. Generalized SNR Modelsa for 3C 397
| E0(1051 erg) | n0(cm−3) | Rs | Age | Vs | VRS | tRS | RRS | Vs(tRS) |
|---|---|---|---|---|---|---|---|---|
| 0.5 | 1.0 | 2120 | 5.66 | 1140 | ||||
| 3.2 | 640 | 2690 | 2560 | |||||
| 4.0 | 990 | 1920 | 2780 | |||||
| 4.4 | 1210 | 1660 | 2920 | |||||
| 4.8 | 1460 | 1470 | 3070 | |||||
| 5.8 | 2250 | 1100 | ⋯ | |||||
| 1.5 | 1850 | 4.95 | 1140 | |||||
| 3.2 | 730 | 2180 | 2700 | |||||
| 4.0 | 1150 | 1570 | 2990 | |||||
| 4.4 | 1420 | 1360 | 3180 | |||||
| 4.8 | 1730 | 1190 | 3400 | |||||
| 5.8 | 2690 | 890 | ⋯ | |||||
| 2.0 | 1680 | 4.50 | 1140 | |||||
| 3.2 | 800 | 1900 | 2800 | |||||
| 4.0 | 1290 | 1360 | 3180 | |||||
| 4.4 | 1610 | 1170 | 3430 | |||||
| 4.8 | 1960 | 1035 | ⋯ | |||||
| 5.8 | 3070 | 780 | ⋯ | |||||
| 3.0 | 1470 | 3.93 | 1140 | |||||
| 3.2 | 930 | 1550 | 3000 | |||||
| 4.0 | 1540 | 1110 | ⋯ | |||||
| 4.4 | 1920 | 960 | ⋯ | |||||
| 4.8 | 2360 | 840 | ⋯ | |||||
| 5.8 | 3700 | 630 | ⋯ | |||||
| 1.0 | 2.0 | 1190 | 4.50 | 1610 | ||||
| 3.2 | 570 | 2680 | 3950 | |||||
| 4.0 | 910 | 1930 | 4490 | |||||
| 4.4 | 1135 | 1660 | 4840 | |||||
| 4.8 | 1320 | 1510 | ⋯ | |||||
| 5.8 | 2170 | 1100 | ⋯ | |||||
| 3.0 | 1040 | 3.93 | 1610 | |||||
| 3.2 | 660 | 2680 | 4240 | |||||
| 4.0 | 1090 | 1570 | ⋯ | |||||
| 4.4 | 1360 | 1360 | ⋯ | |||||
| 4.8 | 1670 | 1190 | ⋯ | |||||
| 5.8 | 2620 | 900 | ⋯ | |||||
| 5.0 | 878 | 3.32 | 1610 | |||||
| 3.2 | 810 | 2680 | 4780 | |||||
| 4.0 | 1370 | 1220 | ⋯ | |||||
| 4.4 | 1720 | 1050 | ⋯ | |||||
| 4.8 | 2110 | 920 | ⋯ | |||||
| 5.8 | 3350 | 690 | ⋯ | |||||
| 1.5 | 2.0 | 970 | 4.50 | 1970 | ||||
| 3.2 | 460 | 3290 | 4830 | |||||
| 4.0 | 750 | 2340 | 5520 | |||||
| 4.4 | 930 | 2030 | 5940 | |||||
| 4.8 | 1130 | 1780 | ⋯ | |||||
| 5.8 | 1770 | 1350 | ⋯ | |||||
| 3.0 | 850 | 3.93 | 1970 | |||||
| 3.2 | 540 | 2670 | 5230 | |||||
| 4.0 | 890 | 1920 | ⋯ | |||||
| 4.4 | 1110 | 1670 | ⋯ | |||||
| 4.8 | 1360 | 1460 | ⋯ | |||||
| 5.8 | 2140 | 1100 | ⋯ | |||||
| 5.0 | 715 | 3.32 | 1970 | |||||
| 3.2 | 650 | 2080 | 5820 | |||||
| 4.0 | 1120 | 1490 | ⋯ | |||||
| 4.4 | 1400 | 1280 | ⋯ | |||||
| 4.8 | 1730 | 1130 | ⋯ | |||||
| 5.8 | 2740 | 850 | ⋯ | |||||
| 7.0 | 640 | 2.96 | 1970 | |||||
| 3.2 | 770 | 1700 | ⋯ | |||||
| 4.0 | 1300 | 1260 | ⋯ | |||||
| 4.4 | 1640 | 1090 | ⋯ | |||||
| 4.8 | 2030 | 950 | ⋯ | |||||
| 5.8 | 3220 | 720 | ⋯ |
Note.
aAll models have an SN ejecta mass of 1.4M⊙. E0 is the explosion energy, n0 is the pre-shock density, Rs is the outer shock radius, Vs is the outer shock velocity, tRS is the time that the reverse shock reaches the center of the SNR, RRS is the outer shock radius at time tRS, and Vs(tRS) is the outer shock velocity at time tRS. For cases with age < tRS, the reverse shock velocity VRS is given. The units for time are in year, radius in parsecs, and velocities in km s−1.First we discuss the case for the distance of 8 kpc, which corresponds to 4.0, 4.4, and 4.8 pc shock radii. The low-energy models (E0 = 0.5 × 1051 erg) are closest in evolutionary phase to the ejecta-dominated phase (t < tRS): many of the low-energy models in Table 1 have an age t < tRS, where tRS is the time that the reverse shock reaches the center of the SNR. Among the low-energy models, the n0 = 2 cm−3 model most closely yields the required range of shock velocities of 1050–1360 km s−1 (derived from observed shock temperatures). However, a strong argument against most of the low-energy models is that there is no observed X-ray component corresponding to the high velocities required for the reverse shock. The standard energy models (E0 = 1.0 × 1051 erg) produce shock velocities too high for n0 < 3 cm−3 and shock velocities too low for n0 > 5 cm−3. The high-energy models (E0 = 1.5 × 1051 erg) produce shock velocities too high for n0 < ∼5 cm−3 and require densities inconsistent with the observed average post-shock proton density for n0 > ∼5 cm−3. This allows only a narrow range of pre-shock density around n0 ∼ 5 cm−3 to be consistent with the observed properties of 3C 397.
In practice, the pre-shock or ambient density can vary with position angle around the SNR. This means that for some directions n0 is low and in other directions it is somewhat higher. Such a variation is consistent with the observed non-circular projection of 3C 397 on the sky. For a model with density varying with position angle, the age must be the same in all directions, e.g., for the 8 kpc distance, the E0 = 1.0 × 1051 erg case (see Table 1), an age of ≃1350 years is obtained for: n0 = 5 cm−3 (Vs = 1220 km s−1) in a position angle with small radius (Rs = 4.0 pc); n0 = 3 cm−3 (Vs = 1360 km s−1) in a position angle with an intermediate radius (Rs = 4.4 pc); and n0 ≃ 2 cm−3 (Vs ≃ 1510 km s−1) in a position angle with a large radius (Rs = 4.8 pc). In addition, this range of model shock velocities is consistent with the range of observed shock temperatures in 3C 397. The E0 = 1.0 × 1051 erg models are preferred over the E0 = 0.5 × 1051 erg models because a high-mass/high-energy explosion is in better agreement with the the high abundances of nickel and manganese. Likewise, the E0 = 1.0 × 1051 erg models are preferred over the E0 = 1.5 × 1051 erg models because the higher energy models require too high an ambient density compared to the observed average post-shock proton density. In summary, the model which best fits the range of shock radii for the 8 kpc distance (4.0–4.8 pc) and the observed shock temperatures of 3C 397 is that with E0 = 1.0 × 1051 erg, an age of 1300–1400 years, and pre-shock densities ranging from ≃2.0–5.0 cm−3.
Next we discuss the effects of taking the distance to 3C 397 as the lower and upper limit values. For the 6.3 kpc distance, the observed angular dimensions translate to shock radii of 3.2–4 pc. From Table 1, one sees that the observed shock velocities of 1050–1360 km s−1 are produced only for n0 ≃ 4 cm−3 if E0 = 0.5 × 1051 erg, n0 ≫ 5 cm−3 if E0 = 1.0 × 1051 erg, and  cm−3 if E0 = 1.5 × 1051 erg. This fact weakens the probability of a distance of 6.3 kpc because no model can be consistent with the observed density and at the same time consistent with observed X-ray temperatures (i.e., shock velocities). For the 9.7 kpc distance, the observed angular dimensions translate to shock radii of 4.8–5.8 pc. From Table 1, one sees that the observed shock velocities of 1050–1360 km s−1 are produced only for n0 ≃ 1–1.5 cm−3 if E0 = 0.5 × 1051 erg, n0 ≃ 2 cm−3 if E0 = 1.0 × 1051 erg, and n0 ≃ 3–4 cm−3 if E0 = 1.5 × 1051 erg. Thus, the models applied with the larger distance of 9.7 kpc reproduce values compatible with both the density and the shock velocity constraints. In this case, a compatible age for 3C 397 (i.e., same age for shock radii of 4.8 and 5.8 pc) is ≃1750 years. This is obtained for a density of n0 ≃ 2 cm−3 and a shock velocity of 1350 km s−1, for a shock radius 5.8 pc and a density of n0 ≃ 5 cm−3, and a shock velocity of 1130 km s−1 for a shock radius 4.8 pc.
In summary, we find that the models predict compatible parameters for 3C 397 for distances from 8 to 9.7 kpc, matching both the observed post-shock density and the range of observed shock temperatures. The age and explosion energy of the SNR ranges from ≃1350 years and 1.0 × 1051 erg at 8 kpc to ≃1750 years and E0 = 1.5 × 1051 erg at 9.7 kpc. The spatially variable pre-shock density is ≃2.0–5.0 cm−3 for either distance.
4. SUMMARY AND CONCLUSION
We have analyzed 1420 MHz continuum, H i line, and CO line observations of the SNR 3C 397 and the nearby H ii region G41.1-0.2 to obtain H i absorption spectra. The SNR absorption spectra show clear absorption up to the tangent point velocity and the absence of absorption at 50–60 km s−1. This yields lower and upper limits to the distances of 6.3 ± 0.1 and 9.7 ± 0.3 kpc. The H ii region shows the same features of absorption up to the tangent point velocity and the absence of absorption at 50–60 km s−1. However, it also shows a recombination line at 58 km s−1, which places the H ii region very close to the 9.7 ± 0.3 kpc distance. There is no clear evidence linking the H ii region and the SNR, so the best distance range for the SNR is between 6.3 and 9.7 kpc, with a nominal value of 8 kpc.
Using the measured properties of temperatures and EMs from the X-ray (Safi-Harb et al. 2005), and the mean gas density from the infrared (Yamaguchi et al. 2015), we constrained the physical conditions of the hot gas in 3C 397. The results show that the hard component has the dominant filling factor and the soft component has a very small filling factor. Next we constructed models for the SNR, using the generalized SNR models of Truelove & McKee (1999), which account for the ejecta-dominated and transition from ejecta-dominated to adiabatic phases. We calculated different models and required them to be consistent with all the measured properties, including the density, the range of radii of 3C 397, and observed shock temperatures. We found that the models reproduce parameters consistent with the observations for the distances of 8 and 9.7 kpc, but not for a distance of 6.3 kpc, which suggests that the most probable distance of 3C 397 is in the range of ≃8–9.7 kpc. The consistent model for 8 kpc predicts an age of about 1350 years and an explosion energy 1.0 × 1051 erg. For a 9.7 kpc distance, the consistent model predicts an age of about 1750 years and an explosion energy 1.5 × 1051 erg. Both models have the same pre-shock density range, ≃2.0–5.0 cm−3, with the range in densities consistent with the range of observed angular radii of 3C 397 on the sky.
This work was supported by a grant from the Natural Sciences and Engineering Research Council of Canada. The authors thank the referee for providing useful comments which improved this work.