

Introduction
Antimicrobial resistance (AMR) represents a significant global public health crisis and, with its increasing prevalence, treatment options available to patients infected with resistant pathogens become increasingly limited. Each year 700 000 people die from AMR-related causes globally, a figure that is projected to rise to 10 million by 2050 at a cost of US $100 trillion dollars to the global gross domestic product if we do not take action.1 Although the overall number of deaths attributed to AMR in Japan is not known, a recent study estimated that deaths due to bloodstream infections caused by two pathogens, methicillin-resistant Staphylococcus aureus and fluoroquinolone-resistant Escherichia coli exceed 8000 per year.2 The threat of a rapid rise in resistance rates after the emergence of Coronavirus disease 2019 pandemic is realistic, given that a global spread of both resistant bacteria and AMR-conveying genes are driven by human migration.3
Even though AMR occurs naturally, both human interventions and, paradoxically, inaction are further increasing resistance rates and therefore exacerbating the situation. On one hand, any use of antibiotics contributes to the development of AMR, and their overuse and misuse can considerably accelerate it.4 Consequently, a growing number of infections are becoming harder to treat as currently available antibiotics become less effective. Increasing AMR means that treatment options for multi-drug resistant bacterial infections are decreasing. Furthermore, the stagnant development of antimicrobial agents is a global problem1 and the number of antimicrobial agents developed in Japan is even lower than in the European Union and the United States,5 highlighting the need for appropriate antimicrobial stewardship practices (ASPs) in Japan.5 Furthermore, despite ample availability of anti-Gram-positive agents, including anti-methicillin-resistant Staphylococcus aureus and anti-Vancomycin-resistant Enterococci agents, there is a lack of agents against Gram-negative bacteria and carbapenem-resistant Enterobacterales remains a threat.
As a result of this global crisis, an international effort is now underway to tackle the threat of AMR. In 2015, the World Health Organization published the Global Action Plan on AMR, calling for a “one health” response.6 Consequently, in 2016, the Japanese government produced the National Action Plan on AMR, outlining the measures to slow the emergence of AMR and prevent its spread.7 The current AMR National Action Plan spans the 2016–2020 time period and is due to be reviewed and updated. This represents a key opportunity to drive an international response to the AMR epidemic by providing clinical and economic projections on the benefits of reducing AMR.
In this study, we adapted to the Japanese setting a simplified version of a previously published and validated dynamic health economic model of AMR to estimate the clinical and economic consequences of different AMR forecasts, with the aim to guide resource allocation defined within the upcoming National AMR Action Plan.
METHODS
Patients and Methods
We adapted a previously developed AMR dynamic cost-effectiveness model8 to evaluate the impact of varying drug-resistant Gram-negative pathogen levels on clinical and economic outcomes in Japan. The model utilizes the decision tree treatment pathway component from the previously published and validated dynamic model of AMR8 to estimate economic and clinical outcomes (quality-adjusted life years [QALYs] gained, and life years [LY] lost, hospital length of stay [LOS], defined daily dose [DDD] of antibiotics, hospitalization costs, and net monetary benefit [NMB]).
Patient Population and Setting
Gram-negative infections caused by Escherichia coli (E. coli), Klebsiella pneumoniae (K. pneumoniae), and Pseudomonas aeruginosa (P. aeruginosa) include complicated urinary tract infections (cUTIs), complicated intra-abdominal infections (cIAIs), or hospital-associated pneumonia including ventilator-associated pneumonia (HAP/ VAP) were included in the model. These were selected because infections with gram-negative bacteria are highly problematic in terms of resistance development with UTIs, IAIs, and HAP being common among carbapenem-resistant Enterobacterales and multi-drug resistant P. aeruginosa (MDRP) infections in the Japan Medical Data Vision (MDV).
The annual infected population and corresponding numbers exhibiting resistance in Japan were not directly available and were estimated by using available data from a hospital-based administrative claims database, MDV (with >30 million accumulated patients, across public and private health-care institutes, since April 2003), and the national surveillance program (Japan Nosocomial Infections Surveillance [JANIS]),9 and then extrapolating the data to the general population of Japan. MDV data was obtained for patients aged 15 years and older due to differences in the treatment of infectious disease between this patient population and pediatric patients. Three different scenarios were assessed in which different targeted populations available in the MDV database (Table 1) were used to provide estimates of the annual infected population and corresponding resistance levels in Japan:
Scenario 1: Population (A) was obtained by extracting data from the MDV inpatients with a diagnosis of interest (cUTI, cIAI, and HAP/VAP) and multiplying the probability of the three pathogens being implicated in each disease. Probabilities were sourced from published literature10–12 and are provided in the Online Supplementary Material.
Scenario 2: Population (B) was obtained by extracting data from the MDV inpatients with a diagnosis of interest (cUTI, cIAI and HAP/VAP). Eligible patients were prescribed with injectable antimicrobial agents that are covered by National Health Insurance and can be used in current clinical practice with possible antibacterial sensitivity against the three modelled pathogens: E. coli, K. pneumoniae, and P. aeruginosa, including generic products. Of note the antibiotic agent that was prescribed to the most patients was piperacillin/tazobactam (first), followed by meropenem (second).
Scenario 3: Population (C) was obtained by extracting from the MDV inpatients with a diagnosis of interest and prescribed piperacillin/tazobactam or meropenem, including generic products.
To note, outpatient costs were not evaluated as Gram-negative bacteria are mostly associated with nosocomial infections.
To estimate the number of patients across Japan who correspond to the three targeted populations, the ratio between the number of new hospitalized patients from the MDV data relative to the number of new hospitalized patients across Japan was calculated for the same period (January to December 2019). Thus, a scaling factor of 6.039 was applied, derived from the number of new admissions in general wards in Japan from the Ministry of Health, Labor and Welfare13 and the number of new admissions included in the MDV in 2019.
Antibiotic resistance rates were calculated for each population since resistance rates of the three pathogens differed between populations. Hence, antibiotic resistance rates were based on the proportion of patients with infectious disease for each population.
Model Structure
Figure 1 shows the adapted AMR dynamic economic model (treatment pathway), utilized for determining the health impact of the treatment strategy in the context of the modelled infectious environment. Infected patients in the decision tree component receive a specified antibiotic treatment and, as a result, are either cured (successfully treated or infection naturally resolves) or die from infection. Patients who are unsuccessfully treated progress onto the subsequent therapeutic option. Therefore, the modelled treatment pathway comprises a maximum of two lines of treatment. Piperacillin/tazobactam was assumed to be the first-line treatment and meropenem to be the second-line treatment. Selection of antimicrobial treatments was based on the frequently used antimicrobials for Gram-negative bacteria when counted as a generic name from the MDV database. Furthermore, in Japan, the first- and second-line therapies for Gram-negative AMR in clinical practice are piperacillin/tazobactam and meropenem, respectively. Clinical efficacy was assumed to be equivalent for each treatment. The model assumes all patients diagnosed as infected (ie, annual infected population) are treated. In scenarios modelled in populations B and C, the estimated number of annual infections are based on treated populations reducing the impact of this assumption.

Data Source
Pathogen-specific resistance levels for each treatment were informed by the national surveillance program JANIS.9 Indication-specific default hospitalization costs were informed by Japanese diagnosis procedure combinations (DPC) costs; source costs referred to daily hospitalization costs for diagnosis and treatment for each indication.14 Daily hospitalization costs were accrued by patients throughout the treatment period (4 days for first-line treatment, and an additional 7 days for second-line treatment). The LOS associated with mortality was assumed to be 3 days, and the cost of death was assumed to be equivalent to the corresponding indication-specific hospitalization cost. Utility values for patients not infected were derived from population norms for a Japanese population aged 70 years and older.15 Life expectancy was estimated from the mean age (65–68 years old) of the indication specific infected population, and Japanese life tables (22.13 years at 65–69 years old).16,17 To calculate QALYs, the estimated life expectancy was multiplied by the utility values.
Where possible, local model inputs were sourced to better reflect the clinical environment and AMR levels in Japan. Key inputs are summarized in Table 2 and further indication-specific inputs are presented in Table 3.
Cost-effectiveness Analysis
The cost-effectiveness analysis assessed both clinical and economic outcomes as a function of varying AMR levels of three Gram-negative pathogens in Japan (increasing or decreasing relative to the current level by up to 100%). The outcomes were evaluated for each population (A, B and C) and included hospital LOS (combining the number of days spent in hospital due to treatment and LOS due to mortality) and the corresponding cost of hospitalization based on indication-specific general ward costs, DDD, the number of LYs lost as a result of infection (LYs lost), and the number of QALYs lost as a result of infection (QALYs lost). For each population, current AMR levels of three Gram-negative pathogens were increased/reduced in order to evaluate the impact on incremental benefits. The model was run over a 10-year time horizon with a willingness-to-pay threshold of ¥5 000 000 (US $46 827), in line with the most conservative threshold used in the Japan Health Technology Assessment to estimate NMB.23 Both costs and benefits were discounted at a rate of 2% per annum in accordance with health technology assessment guidance in Japan.24 The Japanese Yen was converted to US dollars using the average rate in 2020 (US $1=¥106.775) published by the Organization for Economic Cooperation and Development.25
Sensitivity Analysis
One-way sensitivity analyses (OWSA) were conducted on key model input parameters, listed in Table 2. Each input was adjusted by ±20%, with the impact on hospitalization costs saved and QALYs gained assessed in population A.
RESULTS
Population-based Estimates of Value Associated with Gram-negative AMR Reduction
The absolute and incremental outcomes derived based on populations A-C are presented in Tables 4-6. Extrapolating population B to the general Japanese population size was associated with the greatest costs, resource use, and LY and QALY loss. This is consistent with the largest annual number of infections among the 3 populations included in the model. Using population B, a 50% reduction in AMR levels of three Gram-negative pathogens was estimated to save 2 328 109 LYs, corresponding to 1 973 612 QALYs, and freeing up 2 210 023 hospital bed days over 10 years, generating a savings of ¥58.8 billion (US $550.5 million) in hospitalization costs (Table 5).
Estimates based on populations A (Table 4) and C (Table 6) were substantially smaller than for population B and relatively similar to each other, with higher economic gains realized by reducing Gram-negative AMR in population A than C and the converse observed for LYs and QALYs.
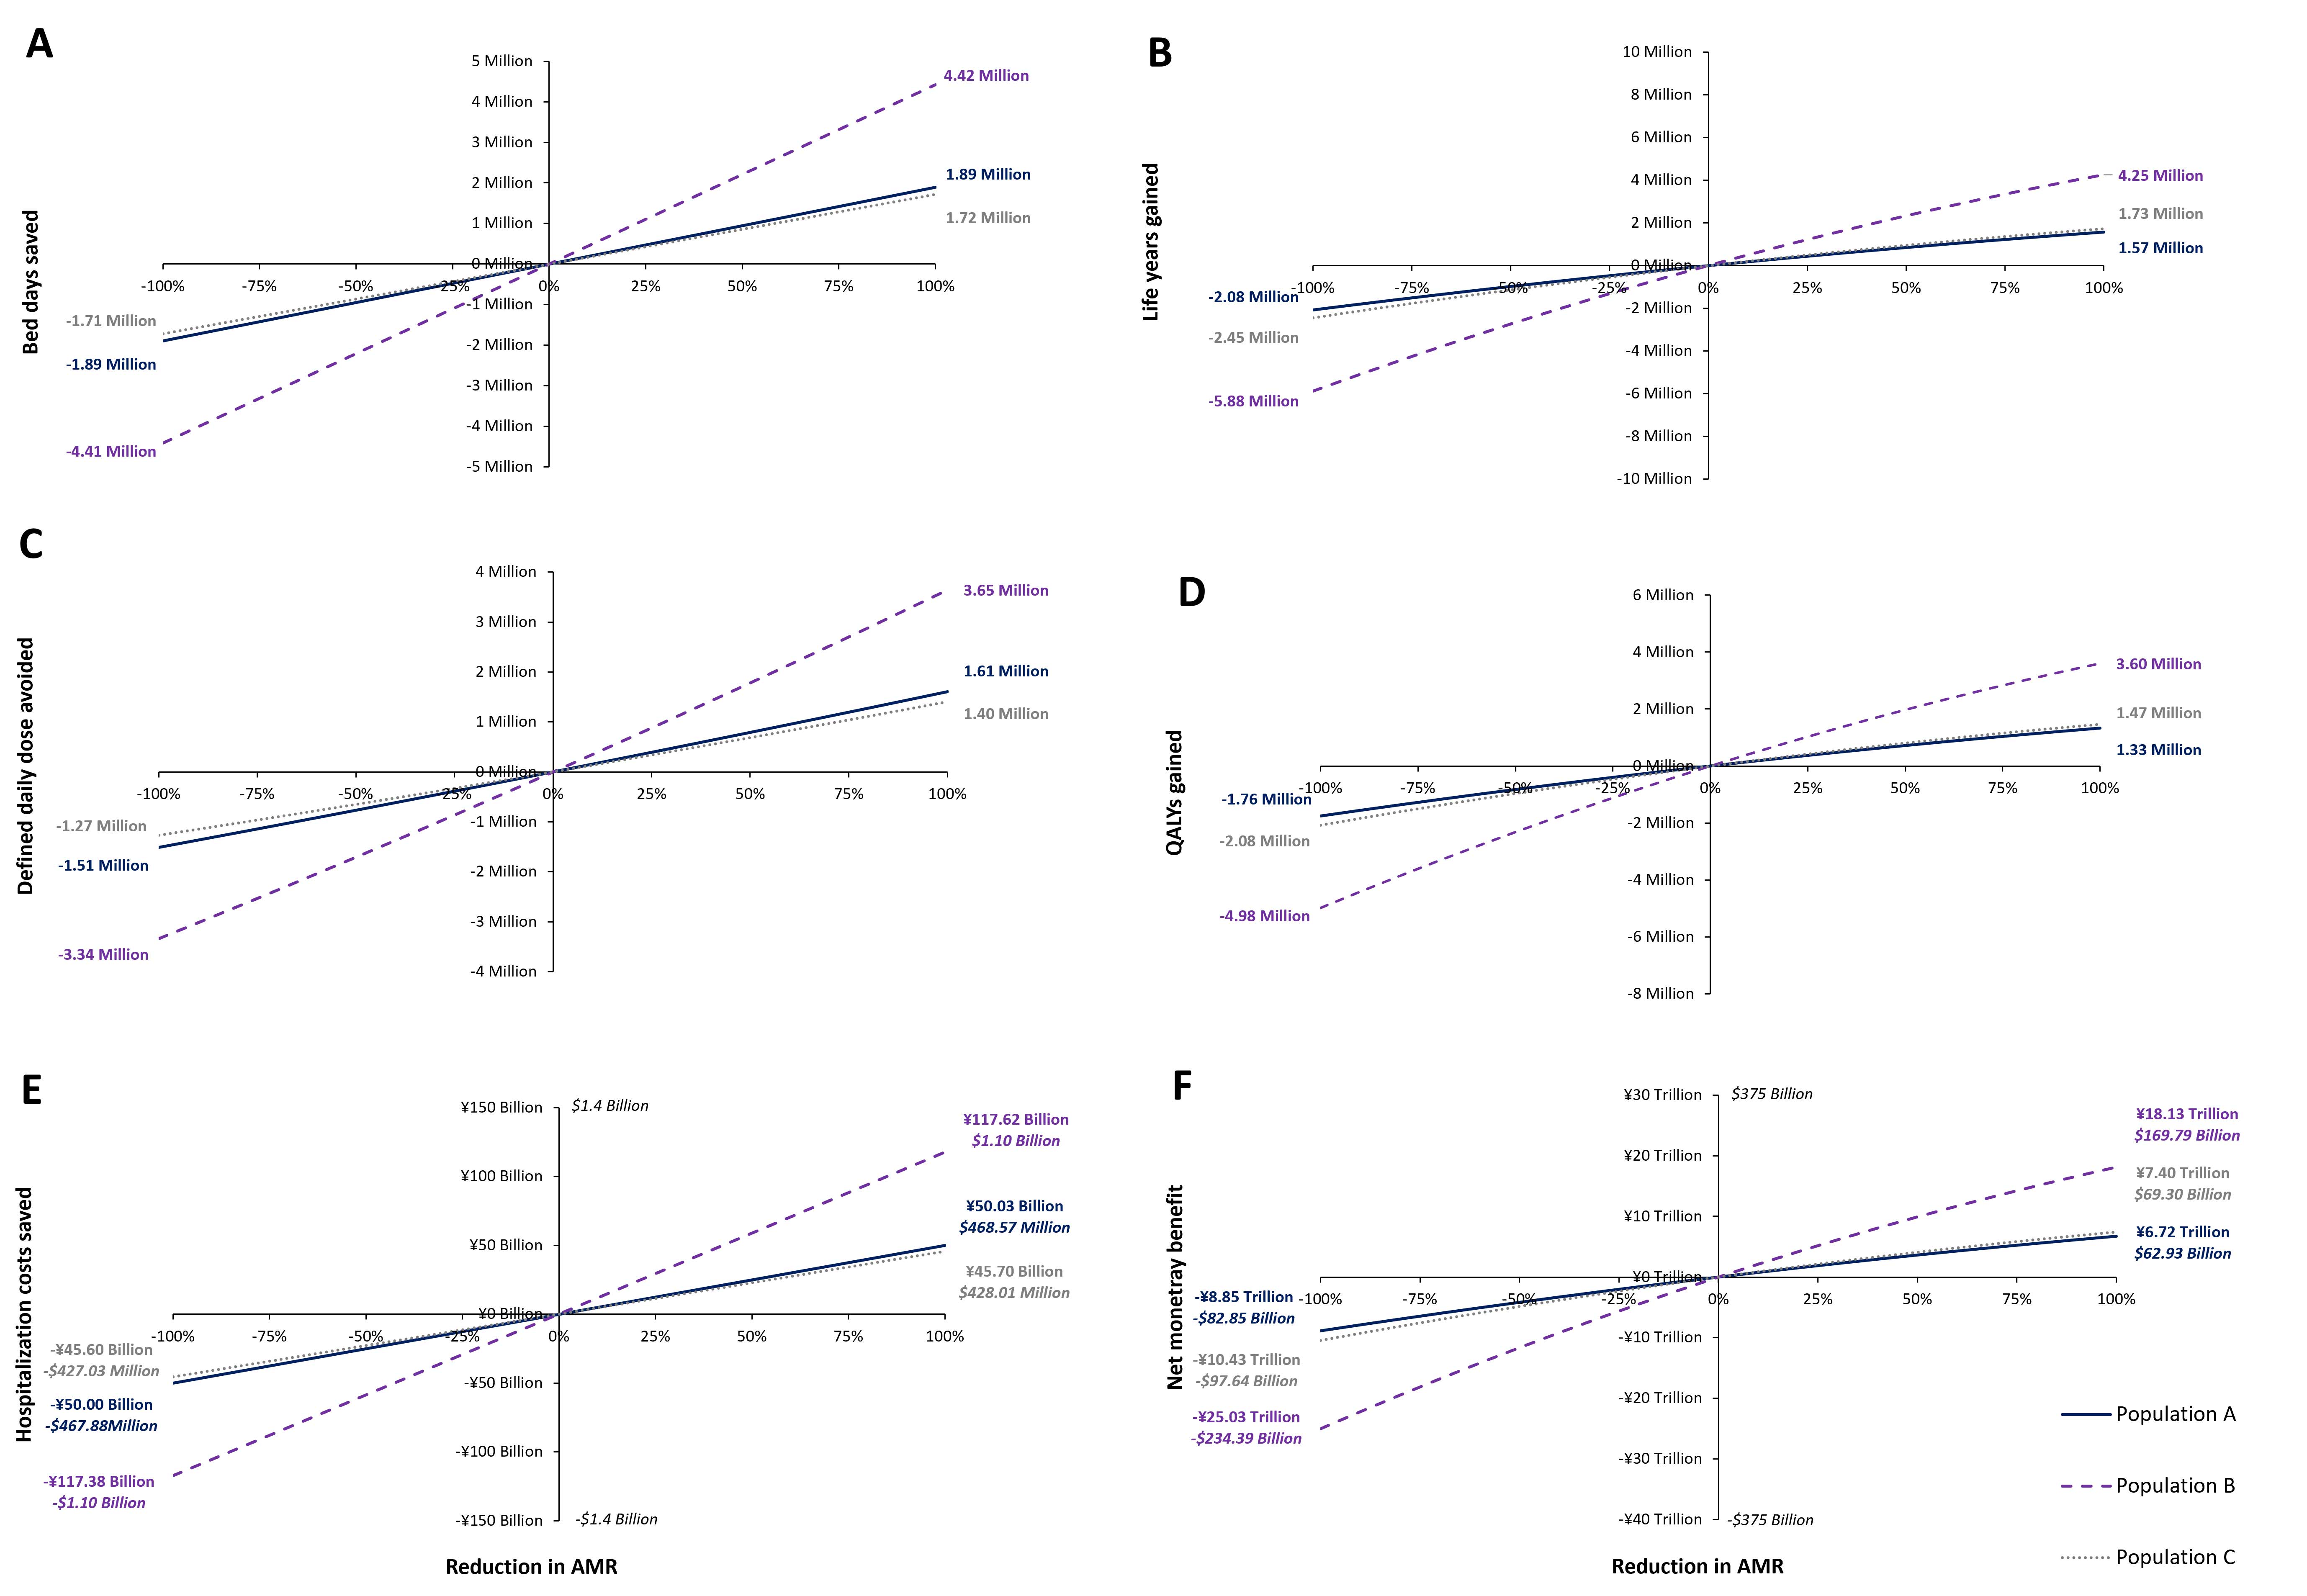
The Relationship Between Reduction in Gram-negative AMR and Clinical and Economic Outcomes
Figure 2 presents the effect of varying AMR levels of three Gram-negative pathogens on outcomes of interest. The horizontal axis represents the percentage reduction in AMR levels of three Gram-negative pathogens from 100% of the current level (corresponding to no resistance) to -100% of the current level (corresponding to doubled resistance incidence). Based on the number of infections per year over a 10-year period, reducing AMR levels of three Gram-negative pathogens in Japan has the potential to save 4 249 096 life years, corresponding to 3 602 311 QALYs.

The maximum economic gains realized over a 10-year period from AMR levels of three Gram-negative pathogens were estimated at up to 4 422 284 bed days saved, up to 3 645 480 DDDs avoided, up to ¥117.6 billion (US $1.1 billion) saved in hospitalization costs, and an NMB of up to ¥18.1 trillion (US $169.8 billion).
One-way Sensitivity Analysis
Varying the input for treatment efficacy (given no resistance) had the greatest impact on QALYs gained. Estimates for LOS for unsuccessful treatment had the largest impact on hospitalization costs saved. Hospitalization costs saved were also sensitive to estimates for infected population (per year) and treatment efficacy (given no resistance). Figure 3 displays the impact of all assessed input parameters in a tornado plot.

DISCUSSION
The analysis undertaken in this study demonstrates the potential clinical and economic savings from reducing future Gram-negative AMR levels in Japan, as well as the threats associated with potential increases in Gram-negative AMR levels. JANIS-derived populations A, B, and C represent different scenarios in which a reduction in Gram-negative AMR may be realized, with population A focused on specific pathogens (E. coli, K. pneumoniae, and P. aeruginosa) causing cUTI, cIAI, and HAP/VAP, and population C on cUTI, cIAI, and HAP/VAP treated with piperacillin/tazobactam or meropenem. Population B was a broad population of patients with cUTI, cIAI, and HAP/VAP treated with agents potentially effective against E. coli, K. pneumoniae, and P. aeruginosa. The broadest population (B), having the highest annual number of infections, gained the greatest clinical and economic benefits from AMR reduction. The outcomes estimated for populations A and C were broadly similar, with a larger potential resource and cost savings attained in population A, owing to the higher annual number of infections than in population C. Conversely, LYs and QALYs gained were greater in population C, in which baseline resistance was higher than in population A. Patients whose infections are resistant to both piperacillin/tazobactam and meropenem have potentially very limited treatment options, so that a reduction in AMR in this setting was associated with high LY and QALY gains.
The NMB of ¥18.1 trillion (US $169.8 billion) represents the maximum value of investment according to the Japanese willingness-to-pay threshold and can be used by the Japanese government to help inform decision-making on the strategies that may be included in the upcoming National AMR Action Plan and facilitate allocation of the required budget. This figure, however, is likely to be an underestimation since our study focuses only on a limited number of indications and pathogens. Therefore, when considering other infections with high prevalence, such as methicillin-resistant Staphylococcus aureus, the actual economic savings will be greater. Nevertheless, the results of this study provide a clear motivation for incentivizing global research and development initiatives, in order to achieve the benefits associated with lowering AMR levels.
Reducing the use of inappropriate antimicrobial agents is one way of lowering AMR rates, as evidenced in a study by Terahara et al, which showed an association between fluoroquinolone consumption and E. coli. resistance on a national scale in Japan.26 Other evidence has demonstrated a positive correlation between carbapenem use and the proportion of carbapenem-resistant P. aeruginosa isolates.27 In addition, interventions to reduce AMR already exist, and are proving to be successful. Such interventions include ASPs that may limit the use of specific antibiotics, regulate treatment duration, and incorporate auditing.28,29 In Japan, a sustained ASP implementation with additional consultation was shown to reduce AMR in a pediatric population.30 Similarly, another study in Spain evaluated the impact of ASP implementation on meropenem prescription and subsequent effect on clinical and economic outcomes.31 This study found that lowering meropenem usage through ASP implementation reduced costs and mortality associated with hospital-acquired multidrug-resistant bloodstream infection.
Morel et al presented a framework guiding AMR-related cost assessments across different localizations, with the aim that this can feed into both more detailed analyses comparing AMR-related interventions at the local level and broader analyses aiming to capture the economic burden of AMR at a global level.32 In our analysis, extrapolations were made using Japanese local data. While caution should be used in attempting to generalize the analysis presented in our study to other countries, even within the Asia-Pacific region, the message that economic and clinical benefits can be achieved by reducing AMR can be applied globally. The need for an international strategy that includes antimicrobial use in human and animal health, and its environmental impact, is evident.
While efforts to optimize the use of existing antimicrobials are ongoing, there is stagnation in the development of novel antimicrobial agents, owing to the lack of investment in this area. This is a particular problem in Japan, where only 6 antibiotic agents have been approved since 2002. Conversely, within the same time-frame, the amount of antibiotic agents approved in the United States and the European Union has almost quadrupled this amount,5 an indication that the development situation of antimicrobial agents in Japan is not as great as in the United States and the European Union.
Whilst the development of antimicrobial agents has halted in recent years, efforts are being made in some countries to overcome this issue, such as in the United Kingdom, the United States and Sweden. In the United Kingdom, an antimicrobial reimbursement pilot program has been launched,33 a scheme that rewards the manufacturer of an antimicrobial agent based on the medicine’s value to the health-care system rather than the volume of drug used. Whilst this and similar efforts encourage pharmaceutical companies to kick-start the development of novel antimicrobial agents, the appropriate use of new and existing antimicrobial agents will remain essential to limit the increase in AMR.
There are some limitations to this study that need to be addressed. First, although this analysis may help inform the value of reducing AMR levels of three Gram-negative pathogens, or the burden associated with their increase, it does not consider the methods required to achieve these outcomes, including any additional costs they might incur. Second, changes in future populations, including demographic changes such as the growth in the number of older people, were not considered. Third, the number of pathogens evaluated was limited to 3 due to the constraints of the model structure. Fourth, the diseases and pathogens analyzed were limited. According to the data published by JANIS, the isolation rates of the three organisms (E. coli, K. pneumoniae, and P. aeruginosa) were 13.88%, 6.23%, and 6.56%, respectively, of the total number of patients with available specimens. While the pathogens considered are frequently implicated in nosocomial infection, the generalizability of our results to other bacterial species is uncertain. Fifth, in Japan, hospitalization costs are calculated on a DPC basis in DPC hospitals (mostly acute hospitals) and on a fee-for-service reimbursement basis in non-DPC hospitals (mostly small- and middle-sized non-acute hospitals). Nevertheless, the DPC costs were used in the results. Sixth, the model does not account for the additional benefits of reduced AMR, including reduced secondary transmission, the impact of infection on pregnant women, or prophylactic use of antimicrobial agents in surgery. Seventh, hospitalization costs have not been adjusted for inflation over the 10 years assessed and are therefore likely underestimated. Finally, estimates of hospital LOS are uncertain due to the reliance on expert opinion in the absence of empirical research.
CONCLUSION
Our study shows the economic and clinical value of reducing AMR levels of three Gram-negative pathogens in Japan. With increased efforts now being made globally to reduce AMR rates, our model could be utilized to help support the valuation of antimicrobial treatment and resistance. Successfully updating, implementing, and executing a National AMR Action Plan is necessary to respond robustly to the threat posed by an increase in AMR prevalence.
Funding
This study was funded by Pfizer Inc.
Acknowledgements
Medical writing and editorial support was provided by James Dennis, Karolina Badora, and Stephen McKenna, Health Economics and Outcomes Research Ltd. and was funded by Pfizer Inc. in accordance with Good Publication Practice (GPP3) guidelines (http://www.ismpp.org/gpp3). The MDV data was extracted and tabulated by Linghua Xu, Pfizer Japan Inc.
Author Contributions
JG, PME, AT, and AY conceptualized and designed the study; RM and OD developed the model under supervision from JG and PME; TO and AY provided local data to inform the model; TM ensured applicability of the model and analysis to the Japanese clinical setting and provided expert guidance to that end. All authors contributed to interpretation of the results, preparation and review of the manuscript, and approval of the final manuscript for publication.
Conflicts of Interest
The authors declare the following potential conflicts of interest with respect to the research, authorship, and/or publication of this article: TM has been on the speakers’ bureau for Pfizer Japan Inc. and MSD K.K. JG, PM, and RM are employees of Health Economics and Outcomes Research Ltd., which received funding from Pfizer Inc. to undertake the research outlined in this study. OD was an employee of Health Economics and Outcomes Research Ltd. at the time this study was conducted and is now an employee of Public Health Wales. AT is a full-time employee of Pfizer R&D UK Limited. AT and AY hold stocks and stock options from Pfizer Inc. TO and AY are full-time employees of Pfizer Japan Inc.
Data Availability Statement
The anonymized patient data underlying this manuscript are derived from the Medical Data Vision database and the national surveillance program (Japan Nosocomial Infections Surveillance) and cannot be made available by the authors.