- *Corresponding Author:
- R. D. Bawankar
Agnihotri College of Pharmacy, Bapuji Wadi, Wardha, Maharashtra 442001, India
E-mail: rambawankar2008@rediffmail.com
| Date of Received | 24 August 2021 |
| Date of Revision | 16 March 2023 |
| Date of Acceptance | 12 May 2023 |
| Indian J Pharm Sci 2023;85(3):667-677 |
This is an open access article distributed under the terms of the Creative Commons Attribution-NonCommercial-ShareAlike 3.0 License, which allows others to remix, tweak, and build upon the work non-commercially, as long as the author is credited and the new creations are licensed under the identical terms
Abstract
Gastro retentive floating matrix tablet provide drug delivery at the controlled rate, improve bioavailability and prolong the retention of dosage forms in gastrointestinal tract. In present study attempt has been made to develop gastroretentive floating matrix tablet of nifedipine in the management of hypertension by direct compression method using Okra gum and HPMCK4M polymer ratio in single or in combination; Avicel PH 102 as a directly compressible material; citric acid for production of acidic microenvironment and sodium-bicarbonate as gas generating agent. Pre-compression parameters of powdered blend as well as prepared batches were studied and found within the range. Fourier-transform infrared spectroscopy of physical mixture (nifedipine, Okra gum and HPMCK4M) suggesting no incompatibility. Formulation batch F8 floated, and remained buoyant without disintegration with swelling index value 41.23 %, released nifedipine 91.30 % about 12 h might be due to combine use of HPMC K4M and Okra gum; showed higher correlation coefficient (r-value) followed Zero order release kinetics. DSC thermogram of F8 confirms uniform dispersion of drug in an amorphous form as endothermic peak was below 173.5°. No significant changes in physiochemical properties, drug release profile as well as drug content of optimized F8 batch when subjected to stability at 40±2° temperature with relative humidity 75±5 % for 3 mo indicating there was no degradation and change in the matrix system.
Keywords
Gastroretentive drug delivery system, nifedipine, hypertension, fourier transform infrared spectroscopy, differential scanning calorimetry
Oral sustained drug delivery system is complicated by limited gastric residence time. Rapid gastrointestinal transit can prevent complete drug release in the absorption zone and reduce the efficacy of administered dose, since the majority of drugs are absorbed in stomach or the upper part of small intestine. Floating drug delivery offers several applications for drugs having poor bioavailability because of the narrow absorption window in the upper part of the gastrointestinal tract. It retains the dosage form at the site of absorption and thus enhances the bioavailability[1].
In present investigation attempt has been made to develop and evaluate gastro retentive floating tablets of nifedipine by direct compression method using Okra gum and HPMCK4M polymer ratio in single or in combination to achieve controlled drug release with reduced frequency of drug administration, reduced side effects, patient compliance as well as to prolong the drug release in gastrointestinal tract and consequently into the plasma. Nifedipine, with short elimination time 2-4 h, used for the treatment of hypertension and is suitable candidate for controlled release administration.
Materials and Methods
Nifedipine was gift sample procured from Qualitek Pharma, Hyderabad. Okra gum procured from Gold king Biogene Private Ltd., HPMCK4M procured from Mahalaxmi Chemicals, Hyderabad, whereas sodium bicarbonate, citric Acid, microcrystalline cellulose, magnesium stearate and talc are procured from Samar chemicals, Nagpur.
Organoleptic properties:
Organoleptic properties such as colour, taste, odour and melting point has been determined.
Preparation of stock solution:
20 mg of Nifedipine was accurately weighed in a 100 ml volumetric flask then the volume was made up to 100 ml with 0.1 N HCl.
Determination of wavelength maxima (λmax) of Nifedipin:
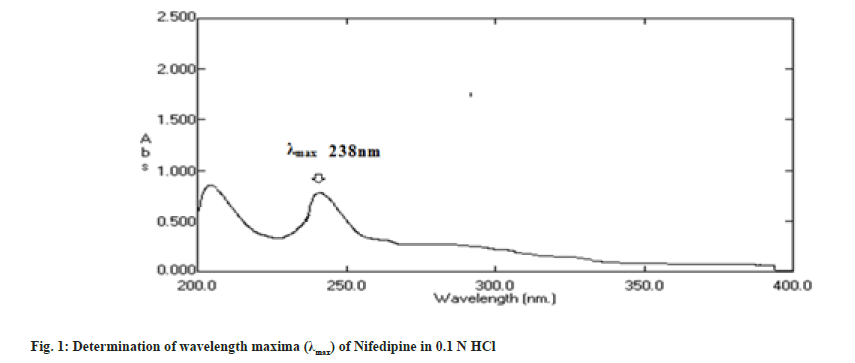
The solution of 10 μg/ml in 0.1 N HCl was prepared and scanned in the range of 200-400 nm and λmax was determined by using Shimadzu Ultraviolet (UV) Spectrophotometer[2].
Standard calibration curve of nifedipine:
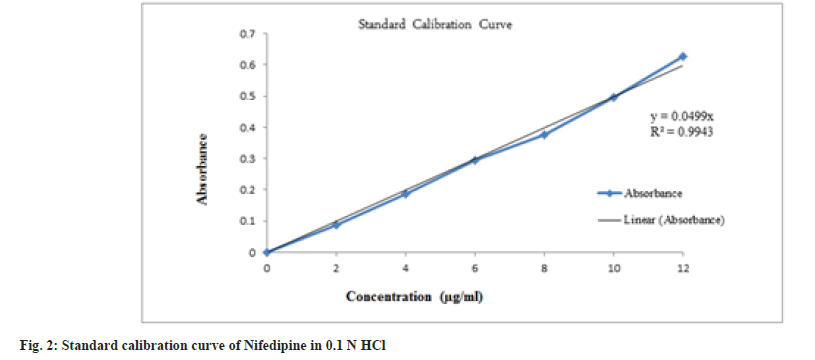
From the stock solution, 10 ml was pipetted out and transferred in to a 100 ml volumetric flask and volume was made up to 100 ml with 0.1 N HCl containing concentration of 20 μg/ml. From this solution, aliquots from 1 to 10 ml were pipetted out in to a series of 10 ml volumetric flask and volume was made up to 10 ml with 0.1 N HCl so as to final make concentration equivalent to 2-20 μg. The absorbance of these solutions was measured against 0.1 N HCl as blank at 238 nm using UVVisible double beam spectrophotometer [2].
Solubility study:
The solubility of nifedipine was determined in solvents of different polarities. The solubility of nifedipine is usually determined by the equilibrium solubility method[3], which employs a saturated solution of nifedipine, obtained by adding an excess amount of nifedipine in the solvent to promote drug precipitation, and then stirring for 2h until equilibrium was reached. The mixture was filtered and amount of Nifedipine was determined by using UV Spectrophotometer at 238 nm.
Drug excipient compatibility study using Fourier Transform Infrared (FTIR) spectroscopy:
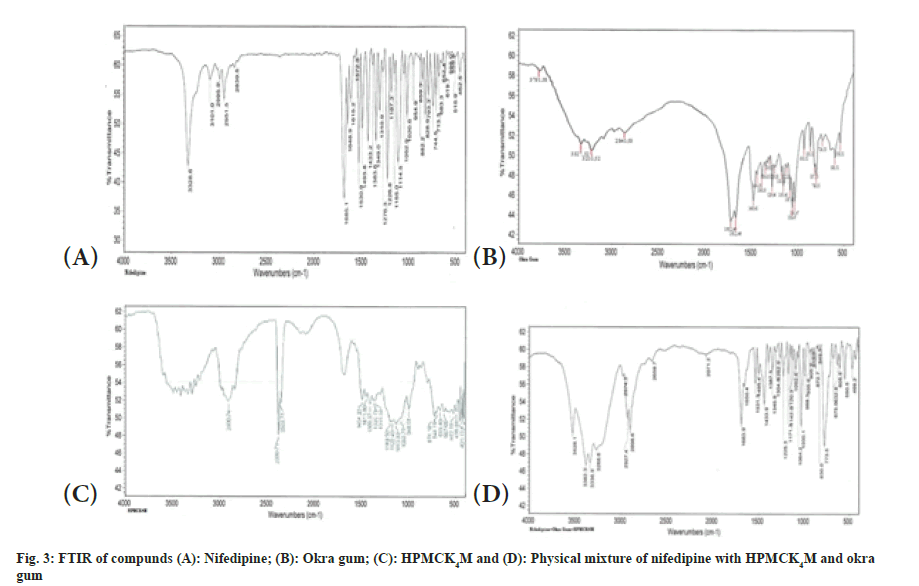
The samples were crushed with KBr to make pellets under hydraulic pressure of 10 tons and then the FTIR spectra were recorded between 400 and 4000 cm-1. It was used to study the interactions between the drug and polymer. The drug and polymer must be compatible with one another to produce a stable product. Drug and polymer interactions were studied by using FTIR [4,5].
Evaluation of powder parameters:
Parameters including bulk density, tapped density, Carr’s index, Hausner ratio and angle of repose of powder were evaluated according to the procedure given in Indian Pharmacopoeia [3].
Formulation and development of nifedipine floating matrix tablets:
Nifedipine, selected polymers, sodium bicarbonate, citric acid and Avicel pH 102 were taken in required quantities and passed through 60 meshes separately. In dry state, the drug with other ingredients was mixed for the period of 10 min in mortar to get uniform mixture powder. The mixture was blended with Magnesium stearate and talc for 2-3 min to improve flow property. The powder materials were compressed using 8 mm diameter, round, biconcave punches on a Fluid pack multi station rotary tablet machine. The tablet weight was kept 120 mg and hardness between 5-7 kg m-2. The weights of the tablets were kept constant for all formulations (Table 1).
| S No. | Ingredients | F1 | F2 | F3 | F4 | F5 | F6 | F7 | F8 | F9 |
|---|---|---|---|---|---|---|---|---|---|---|
| 1 | Nifedipine | 20 | 20 | 20 | 20 | 20 | 20 | 20 | 20 | 20 |
| 2 | Okra Gum | 10 | 20 | 30 | -- | -- | -- | 10 | 20 | 30 |
| 3 | HPMCK4M | -- | -- | -- | 10 | 20 | 30 | 10 | 20 | 30 |
| 5 | Sodium Bi-Carbonate | 20 | 20 | 20 | 20 | 20 | 20 | 20 | 20 | 20 |
| 6 | Citric Acid | 10 | 10 | 10 | 10 | 10 | 10 | 10 | 10 | 10 |
| 7 | Avicel pH 102 | 57 | 47 | 37 | 57 | 47 | 37 | 47 | 27 | 7 |
| 8 | Magnesium-stearate | 2 | 2 | 2 | 2 | 2 | 2 | 2 | 2 | 2 |
| 9 | Talc | 1 | 1 | 1 | 1 | 1 | 1 | 1 | 1 | 1 |
| 10 | Total (mg) | 120 | 120 | 120 | 120 | 120 | 120 | 120 | 120 | 120 |
Table 1: Composition Of Floating Tablets Of Nifedipine
Evaluation of post compression parameter of floating tablets:
Floating tablets parameters like taste, color, size, thickness, shape, hardness, friability, weight variation and drug content were determined as per the procedures given in Indian Pharmacopoeia [3].
Tablet density:
Tablet density was an important parameter for floating tablets. The tablet would float only when its density was less than that of gastric fluid (1.004). The density was determined using following relationship.
V=πr2h and d=m/v
Where v is the volume of tablet (cc), r is the radius of tablet (cm), h is the crown thickness of tablet (g/ cc), m is the mass of tablet.
Floating lag time:
The lag time was carried out in beaker containing 100 ml of 0.1 N HCl as a testing medium maintained at 37±0.5°. The time required for the tablet to rise to the surface and float was determined as floating lag time.
Floating time/buoyancy study:
The tablets were placed in a 100 ml beaker containing 0.1 N HCL. The time required for the tablet to rise to the surface and float was taken floating lag time.
Swelling characteristics:
The swelling properties of matrix tablet containing drug were determined by placing the tablet matrices in the glass beaker containing 200 ml of 0.1 N HCL and incubated at 37±1°. At regular 1 h time interval until 10 h, the tablet was removed from beaker and the excess surface liquid was removed carefully using the filter paper. The swollen tablet was then re-weighted. Swelling characteristics were expressed in term of percentage Water Uptake (WU %) according to the equation given below. The swelling properties of matrix tablet containing drug were determined by placing the tablet matrices in the glass beaker containing 200 ml of 0.1 N HCL and incubated at 37±1°. At regular 1 h time interval until 10 h, the tablet was removed from beaker and the excess surface liquid was removed carefully using the filter paper. The swollen tablet was then re-weighted. Swelling characteristics were expressed in term of percentage Water Uptake (WU %) according to the equation given below.
Swelling index=Weight of swollen tablet-Initial weight of tablet/Initial weight of tablet×100
In Vitro drug release study:
The dissolution rate of nifedipine from floating matrix tablets was determined with following specifications of dissolution test apparatus.
Details of dissolution test apparatus were as follows. Apparatus: USP Type II; volume of medium: 900 ml; temperature: 37±0.5°; paddle speed: 50 rpm; dissolution medium used: 0.1 N HCl; aliquot taken at each time interval: 1 ml. Absorbance of these solutions was measured by UV spectrophotometer at the λ max of 238 nm.
Dissolution Kinetic Model:
Model dependent methods (Table 2) are based on different mathematical functions, which describe the dissolution profile. Once a suitable function has been selected the dissolution profiles are evaluated depending on the derived model parameters[5-7].
| Sno. | Models | Equation |
|---|---|---|
| 1 | Zero Order release Equation | Qt=Q0+K0t |
| 2 | First Order release Equation | ln Qt=ln Q0+K1t |
| 3 | Higuchi Plot Equation | Qt=KHt1/2 |
| 4 | Hixson–Crowell Equation | Q01/3-Qt1/3=Kst |
| 5 | Korsmeyer-Peppas Equation | Log(Mt/Mf)=Logk+nLogt |
Table 2: Mathematical Models For Drug Dissolution Curves
Differential scanning calorimetry (DSC):
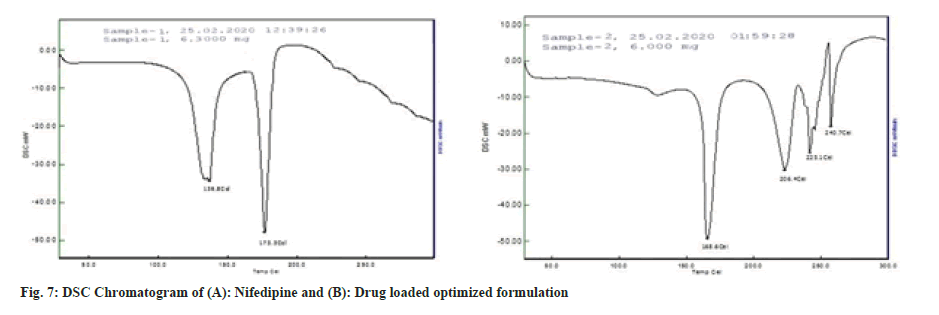
Thermal properties of pure Nifedipine and the optimized formulation were analyzed using DSC[8]. The samples were heated in a hermetically sealed aluminum pans. Heat runs for each sample were set from 30-35° at a heating rate of 10° min, using nitrogen as blanket gas.
Stability studies:
The optimized tablet batch was selected and wrapped in aluminum foil of thickness 0.04 mm and stored at temperature 40±2° with relative humidity of 75±5 %. The sampling was done after every one mo and evaluated for appearance, thickness, hardness, friability, drug content and cumulative percentage drug release[4,5,9].
Results and Discussion
Nifedipine evaluated for parameters like color, odor, taste and melting point was found to be complying the specifications given in the Indian pharmacopoeia[10]. Nifedipine was observed to be yellow colored, odorless and tasteless powder with melting point of 169-171°. The solution of 10 μg/ ml in 0.1 N HCl was prepared and scanned in the range of 200-400 nm and wavelength maxima (fig. 1) was found to be 238 nm. In order to prepare standard calibration curve of nifedipine (fig. 2), absorbance values of different concentrations of nifedipine were determined (Table 3). Solubility of nifedipine by the equilibrium solubility method in water, 0.1 N HCl and Phosphate buffer (pH 6.8) was found to be 5 mg/ml, 10.7 mg/ml and 0.05 mg/ ml respectively.
| Concentration (μg/ml) | Absorbance |
|---|---|
| 0 | 0 |
| 2 | 0.086±0.02 |
| 4 | 0.187±0.01 |
| 6 | 0.295±0.03 |
| 8 | 0.375±0.06 |
| 10 | 0.496±0.07 |
| 12 | 0.626±0.04 |
| 14 | 0.788±0.05 |
| 16 | 0.902±0.03 |
| 18 | 1.007±0.04 |
| 20 | 1.100±0.07 |
Table 3: Absorbance Values Of Nifedipine In 0.1 N Hcl.
The interaction studies of drug with polymers suggest no incompatibility. Nifedipine shows retention of basic characteristics as N-H stretch at 3336.9 cm-1, =C-H (alkene aromatic) at 2974.3 cm- 1, C-H (alkane stretching) at 2927.4, 2898.6 cm-1, O-H (carboxylic acid) at 2659.7, 2898.6 cm-1, C=O Stretch (ester) at 1650.4, 1683.90 cm-1 and N-O Stretch (nitro compound) at 1531.3, 1495.4 cm-1 as shown in FTIR of drug and excipients. The typical FTIR curves shown in fig. 3 and wave number values for major peaks present of nifedipine are shown in Table 4.
| Peak at wave number (cm-1) | Peak report (cm-1) | Peak observed (cm-1) |
|---|---|---|
| N-H stretch | 3400-3250 | 3336.9 |
| =C-H (alkene aromatic) | 3000-2970 | 2974.3 |
| C-H (alkane stretching) | 2960-2862 | 2927.4, 2898.6 |
| O-H (carboxylic acid) | 3800-2500 | 2659.7, 2898.6 |
| C=O Stretch (ester) | 1730-1630 | 1650.4, 1683.90 |
| N-O Stretch (nitro compound) | 1550-1475 | 1531.3, 1495.4 |
Table 4: Major Peaks Present In Ir Spectra Of Nifedipine.
Powder characteristics were evaluated and found to be passing the tests for various batches according to the procedure given in Indian Pharmacopoeia (Table 5). Evaluation of tablets of batches F1 to F9 were carried out and thickness was found in range of 2.80±0.06 to 2.92±0.01 mm; Hardness 5.25±0.14 to 5.50±0.12 kg/cm2; friability around 0.23±0.06; weight variation about 121±0.57 mg and 98.99±0.21 which is maximum in F8 batch (Table 6). To provide good floating behavior in the stomach, the density of the device found to be less than that of the gastric contents (1.004 g/ cm3). All the batches showed density below than that of gastric fluid (1.004). The values are shown in Table 7.
| Batches | Angle of repose (θ)±SD |
Bulk density (g/ml)±SD |
Tapped density (g/ml)±SD |
Compressibility Index (%)±SD |
Hausner’s ratio±SD |
|---|---|---|---|---|---|
| F1 | 29.12±0.11 | 0.222±0.35 | 0.266±0.05 | 16.76±0.11 | 1.19±0.07 |
| F2 | 27.75±0.18 | 0.200±0.22 | 0.235±0.31 | 14.89±0.09 | 1.17±0.11 |
| F3 | 27.30±0.19 | 0.190±0.09 | 0.222±0.07 | 14.41±0.62 | 1.16±0.01 |
| F4 | 26.67±0.33 | 0.181±0.22 | 0.210±0.44 | 13.42±0.17 | 1.15±0.04 |
| F5 | 25.55±0.12 | 0.169±0.05 | 0.200±0.14 | 12.75±0.19 | 1.14±0.03 |
| F6 | 25.11±0.06 | 0.166±0.08 | 0.190±0.06 | 12.63±022 | 1.14±0.09 |
| F7 | 24.44±0.45 | 0.210±0.03 | 0.235±0.40 | 10.60±0.21 | 1.11±0.09 |
| F8 | 26.88±0.35 | 0.201±0.21 | 0.199±0.33 | 11.30±0.12 | 1.15±0.07 |
| F9 | 25.90±0.02 | 0.166±0.12 | 0.190±0.34 | 12.63±0.11 | 1.14±0.04 |
Table 5: Preformulation Studies Of Various Batches.
| Batches | Thickness (mm)±SD |
Hardness (kg/cm2)±SD |
Friability (%)±SD |
Weight variation (mg)±SD |
Drug content uniformity (%) ±SD |
|---|---|---|---|---|---|
| F1 | 2.87±0.04 | 5.35±0.08 | 0.13±0.05 | 119±1.15 | 98.45±0.25 |
| F2 | 2.85±0.01 | 5.25±0.14 | 0.23±0.06 | 120±2.08 | 98.39±0.30 |
| F3 | 2.80±0.06 | 5.50±0.09 | 0.16±0.09 | 119 ±1.52 | 98.24±0.25 |
| F4 | 2.91±0.04 | 5.50±0.11 | 0.19±0.04 | 119±1.52 | 98.46±0.25 |
| F5 | 2.92±0.01 | 5.35±0.03 | 0.14±0.01 | 121±0.57 | 98.69±0.30 |
| F6 | 2.82±0.02 | 5.50±0.12 | 0.19±0.02 | 119 ±1.5 | 98.74±0.17 |
| F7 | 2.87±0.02 | 5.25±0.17 | 0.11±0.09 | 120 ±0.57 | 98.24±0.19 |
| F8 | 2.85±0.07 | 5.45±0.45 | 0.15±0.08 | 121±0.32 | 98.99±0.21 |
| F9 | 2.82±0.03 | 5.25±0.40 | 0.21±0.04 | 120±1.05 | 98.71±0.20 |
Table 6: Physical Evaluation Of Formulated Tablet.
| Batches | Tablet density (g/cc) | Buoyancy lag time (sec) | Total floating time (h) |
|---|---|---|---|
| F1 | 0.88±0.01 | 97±0.02 | >12 |
| F2 | 0.91±0.02 | 98±0.01 | >12 |
| F3 | 0.89±0.01 | 98±0.03 | >12 |
| F4 | 0.86±0.02 | 94±0.01 | >12 |
| F5 | 0.88±0.01 | 95±0.02 | >12 |
| F6 | 0.81±0.02 | 95±0.02 | >12 |
| F7 | 0.84±0.02 | 92±0.03 | >12 |
| F8 | 0.83±0.01 | 91±0.01 | >12 |
| F9 | 0.82±0.03 | 90±0.02 | >12 |
| Note: (n=03) | |||
Table 7: Tablet Densities, Buoyancy Lag Time And Total Floating Time.
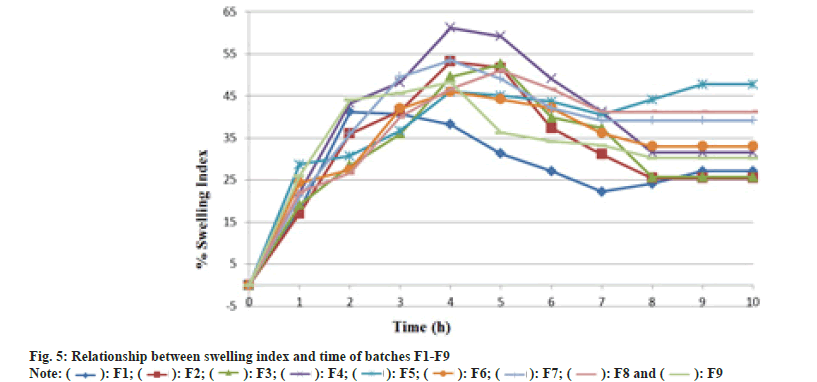
On immersion in 0.1 N HCl solution pH (1.2) at 37°, the optimized (F8) tablets floated, and remained buoyant without disintegration. Table 8 shows the results of buoyancy study showing buoyancy character of prepared tablet shown in fig. 4. Swelling is used to describe the process that a polymer system undergoes addition to solvent; this is a composite, and not simple, term that encompasses all of the processes viz. hydration, gelling, swelling and erosion of polymer. After 10 h, swelling index for prepared batches was found to be 27.12 %-41.23 % which was maximum for F8 batch summarized in Table 8 and fig. 5.
| Time (h) | Swelling index (%) or % Hydration | ||||||||
|---|---|---|---|---|---|---|---|---|---|
| F1 | F2 | F3 | F4 | F5 | F6 | F7 | F8 | F9 | |
| 1 | 18.1 | 17.06 | 19.21 | 22.12 | 28.68 | 24.39 | 21.09 | 22.12 | 26.03 |
| 2 | 41.25 | 36.06 | 28.46 | 43.24 | 30.78 | 27.47 | 36.06 | 26.62 | 44.05 |
| 3 | 40.66 | 41.49 | 36.06 | 48.21 | 36.73 | 42.03 | 49.55 | 40.04 | 45.73 |
| 4 | 38.22 | 53.23 | 49.55 | 61.22 | 46.05 | 46.07 | 53.51 | 46.64 | 48.22 |
| 5 | 31.32 | 51.7 | 52.55 | 59.19 | 45.07 | 44.22 | 49.12 | 51.15 | 36.3 |
| 6 | 27.12 | 37.38 | 39.91 | 49.13 | 43.66 | 42.19 | 42.12 | 46.65 | 34.23 |
| 7 | 22.21 | 31.14 | 37.38 | 41.23 | 40.61 | 36.22 | 39.22 | 41.23 | 33.24 |
| 8 | 24.11 | 25.49 | 25.74 | 31.56 | 44.16 | 33.01 | 39.22 | 41.23 | 30.25 |
| 9 | 27.12 | 25.49 | 25.74 | 31.56 | 47.78 | 33.01 | 39.22 | 41.23 | 30.25 |
| 10 | 27.12 | 25.49 | 25.74 | 31.56 | 47.78 | 33.01 | 39.22 | 41.23 | 30.25 |
Table 8: Swelling Index Of Formulations.
In vitro dissolution study of prepared tablets namely F1-F9 (Table 9, fig. 6) were carried out. Batches F1 to F6 releases nifedipine early i.e. up to 10 h in range of 98.26±0.35, might be due to use of one polymer in formulation whereas use of combination of polymers (Okra gum and HPMCK4M) in batches F7 to F9, releases nifedipine up to 12 h. F8 promisingly releasing 92.89±0.20 % of drug considered as optimized batch. The kinetic treatment data of dissolution profiles of formulations F1-F9 has been summarized in Table 10. The in vitro drug release pattern of F8 showed the highest regression value (r2=0.9799) for Korsmeyer-Peppas model. The ‘n’ value was found to below 0.5 suggesting that release of drug follows Fickian diffusion (Higuchi Matrix) mechanism. Release kinetics may be following diffusion mechanism from the formulation.
| Time (h) | Formulations | ||||||||
|---|---|---|---|---|---|---|---|---|---|
| F1 | F2 | F3 | F4 | F5 | F6 | F7 | F8 | F9 | |
| 0 | 0 | 0 | 0 | 0 | 0 | 0 | 0 | 0 | 0 |
| 0.5 | 34.29±0.34 | 31.23±0.31 | 26.62±0.56 | 33.56±0.24 | 30.03±0.41 | 25.56±0.32 | 34.12±0.11 | 29.92±0.29 | 28.82±0.41 |
| 1 | 54.78±0.91 | 49.12±0.35 | 45.15±0.30 | 46.00±0.29 | 44.36±0.50 | 43.15±0.49 | 44.84±0.19 | 40.42±0.32 | 34.10±0.31 |
| 2 | 62.63±0.13 | 59.36±0.20 | 51.31±0.10 | 52.36±0.10 | 52.10±0.32 | 49.10±0.49 | 50.56±0.52 | 46.84±0.59 | 40.73±0.30 |
| 3 | 66.46±0.19 | 63.35±0.12 | 56.65±0.28 | 57.23±0.26 | 55.45±0.45 | 55.55±0.56 | 54.54±0.34 | 52.24±0.43 | 45.56±0.66 |
| 4 | 70.05±0.32 | 65.47±0.16 | 58.57±0.30 | 60.94±0.20 | 58.57±0.34 | 57.15±0.94 | 60.63±0.18 | 57.18±0.19 | 50.68±0.39 |
| 5 | 76.09±0.27 | 68.01±0.25 | 62.09±0.33 | 68.86±0.66 | 63.00±0.44 | 61.08±0.54 | 63.09±0.73 | 60.12±0.57 | 54.45±0.77 |
| 6 | 82.10±0.47 | 70.42±0.53 | 65.05±0.40 | 76.47±0.10 | 66.47±0.11 | 64.89±0.13 | 66.94±0.19 | 64.10±0.42 | 57.78±0.45 |
| 7 | 90.03±0.55 | 77.77±0.77 | 72.20±0.41 | 88.02±0.56 | 79.01±0.46 | 71.17±0.35 | 72.34±0.25 | 70.07±0.16 | 67.76±0.44 |
| 8 | 99.36±0.46 | 84.15±0.17 | 80.15±0.54 | 99.10±0.10 | 87.94±0.18 | 79.21±0.30 | 79.42±0.42 | 75.19±0.53 | 78.46±0.41 |
| 9 | - | 98.26±0.35 | 90.34±0.13 | - | 99.10±0.10 | 92.12±0.14 | 82.12±0.19 | 80.23±0.24 | 83.43±0.33 |
| 10 | - | - | 99.89±0.30 | - | - | 99.47±0.30 | 85.15±0.50 | 86.21±0.51 | 86.68±0.31 |
| 11 | - | - | - | - | - | - | 87.34±0.11 | 89.89±0.22 | 88.88±0.56 |
| 12 | - | - | - | - | - | - | 91.30±0.50 | 92.89±0.20 | 91.35±0.20 |
Table 9: In Vitro Drug Release Profile Of Formulations
| Batch | Variables | Zero order | First order | Hixson crowell | Korsmeyer peppas | Higuchi plot |
|---|---|---|---|---|---|---|
| F1 | r2 | 0.8959 | 0.6247 | 0.7257 | 0.9753 | 0.9724 |
| n | 0.1535 | 0.003 | 0.0164 | 0.3076 | 0.2389 | |
| K | 29.955 | 1.0724 | 4.2864 | -0.1698 | -2.0136 | |
| F2 | r2 | 0.8907 | 0.6186 | 0.7076 | 0.9718 | 0.9638 |
| n | 0.1271 | 0.0029 | 0.0152 | 0.2998 | 0.2667 | |
| K | 29.093 | 1.0534 | 4.1645 | -0.709 | -2.086 | |
| F3 | r2 | 0.9305 | 0.631 | 0.7219 | 0.9499 | 0.9732 |
| n | 0.1231 | 0.0029 | 0.0148 | 0.3206 | 0.2743 | |
| K | 24.824 | 1.013 | 3.8791 | -0.2807 | -1.2294 | |
| F4 | r2 | 0.9354 | 0.6335 | 0.7417 | 0.9818 | 0.9785 |
| n | 0.1569 | 0.003 | 0.0157 | 0.297 | 0.2456 | |
| K | 23.887 | 1.0351 | 3.9848 | -0.1983 | -1.1307 | |
| F5 | r2 | 0.9327 | 0.6241 | 0.7179 | 0.974 | 0.9731 |
| n | 0.1366 | 0.0029 | 0.0147 | 0.291 | 0.2624 | |
| K | 23.907 | 1.0253 | 3.9461 | -0.2179 | -1.0831 | |
| F6 | r2 | 0.9392 | 0.6395 | 0.7344 | 0.9429 | 0.9755 |
| n | 0.1256 | 0.0029 | 0.0149 | 0.3354 | 0.272 | |
| K | 23.328 | 0.9987 | 3.7767 | -0.3161 | -0.8755 | |
| F7 | r2 | 0.9138 | 0.614 | 0.7075 | 0.9911 | 0.9798 |
| n | 0.0938 | 0.0028 | 0.0144 | 0.2549 | 0.3224 | |
| K | 30.732 | 1.04 | 4.0368 | -0.247 | -3.517 | |
| F8 | r2 | 0.9399 | 0.6309 | 0.7254 | 0.9799 | 0.988 |
| n | 0.0999 | 0.0029 | 0.0145 | 0.2911 | 0.3141 | |
| K | 26.759 | 1.0067 | 3.805 | -0.2731 | -2.3939 | |
| F9 | r2 | 0.9612 | 0.6351 | 0.7343 | 0.9651 | 0.9865 |
| n | 0.1068 | 0.0028 | 0.0137 | 0.28 | 0.2998 | |
| K | 21.799 | 0.9736 | 3.5797 | -0.2636 | -0.7462 |
Table 10: Kinetic Treatment Profiles
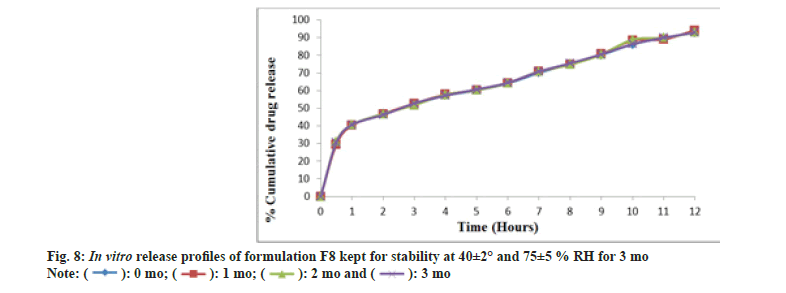
The DSC thermogram of nifedipine (fig. 7A) records two endothermic peaks corresponding to the melting point of drug (173.3°) whereas nifedipine loaded optimized formulation, F8 (fig. 7B), showed lesser melting point (148.4°), suggesting the possibility of interaction. Formulation F8 was studied for stability at 40±2° and 75±5 % RH for about 3 mo (Table 11). After every 1 mo sampling, no significant changes in appearance, thickness, hardness, friability, drug content and cumulative % drug release were observed and summarized in Table 12 and fig. 8.
| Parameters | 0 mo | 1 mo | 2 mo | 3 mo |
|---|---|---|---|---|
| Appearance/Colour | Yellow | Yellow | Yellow | Yellow |
| Thickness (mm) | 2.85 | 2.85 | 2.85 | 2.84 |
| Hardness (Kg/cm2) | 5.45 | 5.35 | 5.35 | 5.35 |
| Friability (%) | 0.15 | 0.15 | 0.17 | 0.16 |
| Drug content (%) | 98.24 | 98.18 | 98.19 | 98.18 |
Table 11: Stability Studies Of Formulation F8 At 400°/75 % Rh.
| Time (h) | Cumulative % Nifedipine release | |||
|---|---|---|---|---|
| 0 mo | 1 mo | 2 mo | 3 mo | |
| 0 | 0 | 0 | 0 | 0 |
| 0.5 | 29.92 | 29.45 | 31.05 | 30.59 |
| 1 | 40.42 | 40.21 | 40.61 | 40.61 |
| 2 | 46.84 | 46.79 | 46.74 | 46.19 |
| 3 | 52.24 | 52.69 | 51.77 | 52.71 |
| 4 | 57.18 | 57.77 | 57.73 | 57.22 |
| 5 | 60.12 | 60.39 | 60.19 | 60.71 |
| 6 | 64.1 | 64.35 | 64.32 | 64.42 |
| 7 | 70.07 | 70.82 | 70.82 | 70.82 |
| 8 | 75.19 | 74.74 | 74.74 | 75.48 |
| 9 | 80.23 | 80.73 | 80.37 | 80.57 |
| 10 | 86.21 | 88.36 | 88.86 | 86.36 |
| 11 | 89.89 | 89.05 | 89.95 | 89.99 |
| 12 | 92.89 | 94.19 | 92.93 | 92.9 |
Table 12: In Vitro Drug Release Study Of Formulation F8.
Nifedipine gastro-retentive tablet for management of hypertension developed successfully using Okra gum and HPMCK4M polymer ratio and Avicel pH 102 as a directly compressible material, Citric acid for production of acidic microenvironment while sodium-bicarbonate as gas generating agent, showed desirable high-drug content, optimal hardness, floatability, swelling index and adequate release characteristics. High floating ability of the formulation is likely to increase its gastrointestinal residence time and eventually improve the extent of bioavailability, reduces the frequency of administration of drug and helps to minimize dose of drug and side effects associated with the drug. Moreover, formulations prepared by such polymer can be considered as promising gastro-retentive to bring about gastro-retention of nifedipine supported by more elaborated research in this aspect.
Acknowledgements:
Authors would like to gratefully acknowledge the staff members of Agnihotri College of Pharmacy, Wardha 442001 for their care, advice, criticism, support and help during this research work.
Conflict of interests:
The authors declared no conflict of interests.
References
- Pawar HA, Dhavale R. Development and evaluation of gastroretentive floating tablets of an antidepressant drug by thermoplastic granulation technique. Beni-suef Univ J Basic Appl Sci 2014;3(2):122-32.
- Sharma YR. Elementary organic spectroscopy, principles and chemical application. Chand and Company Ltd, New Delhi, India. 2009;23.
- Lachmann L, Lieberman HA, Kanig JL. The theory and practice of industrial pharmacy. Special Indian edition. 2009;296-301.
- Remington JP. Remington: The science and practice of pharmacy. Lippincott Williams and Wilkins; 2006.
- Sindhura B, Gampa VJ, Prakash V, Someshwar K. Development and in vitro characterization of gastro retentive floating tablets of nifedipine using various polymers. World J Pharm Biotechnol 2015;2(1):21-6.
- Fukui A, Fujii R, Yonezawa Y, Sunada H. Analysis of the release process of phenylpropanolamine hydrochloride from ethylcellulose matrix granules. Chem Pharm Bull 2002;50(11):1439-42.
[Crossref] [Google Scholar] [PubMed]
- Lee PI. Diffusion-controlled matrix systems. In: Treatise on controlled drug delivery 2017; p. 155-197. CRC Press.
- Wadher KJ, Bute SW, Milind JU. Formulation and evaluation of gastroretantive floating tablet using carbopol with xanthan gum and guar gum. Int J Chem Tech Res 2017;10(12):300-8.
- Cartensen JT. Drug stability: Principle and practice. Marcel Dekker, New York 1995;2:538-50.
- Indian Pharmacopoeia. Government of India, Ministry of Health and Family Welfare; 2007. p. 177-183.

 ): F1; (
 ): F2; (
 ): F3; (
 ): F4; (
 ): F5; (
 ): F6; (
 ): F7; (
 ): F8 and (
  ): F9
): F9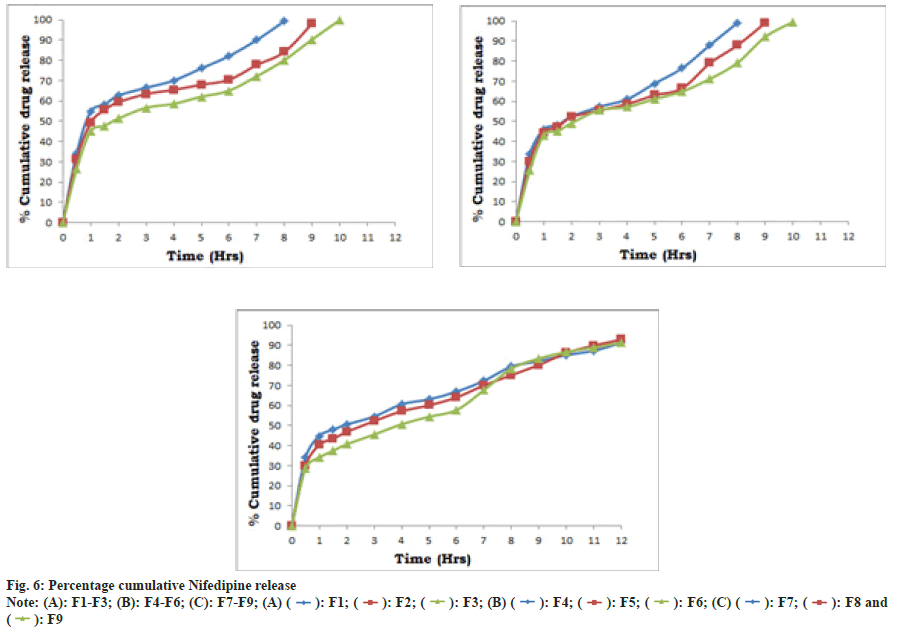
 ): F4; (
 ): F5; (
 ): F6; (
 ): F7; (
 ): F8 and (
  ): F9
): F9