
Abstract
To search for new radiophotoluminescence (RPL) materials, Eu-doped Li2SrSiO4 was synthesized by the solid-state reaction and then studied its RPL properties for radiation detector applications. All the samples were identified to be Li2SrSiO4 by X-ray diffraction. The as-prepared sample shows photoluminescence (PL) due to Eu3+ while an additional PL band appears due to a formation of Eu2+ after X-ray irradiation. This indicates that the Eu-doped Li2SrSiO4 has RPL properties. The sensitivity of RPL (or PL intensity of Eu2+) to X-ray dose is the highest when the Eu concentration is 0.1%, and the dynamic range is 5–10 000 mGy. In addition, the generated Eu2+ is so stable that only 5% of the signal degrades over 20 min after irradiation. The RPL signal notably decreases to about 30% of the initial value by heating at 500 °C for 100 s, and it is reproducible multiple times even after the heat treatment.
Export citation and abstract BibTeX RIS
1. Introduction
Storage phosphors have often been applied in the field of radiation dosimetry. Such storage phosphors record the energy of an exposed ionizing radiation and emit light, in which the intensity is proportional to the absorbed radiation energy. Therefore, the storage phosphors have been used as a sensing element of, for example, personal dosimeters and imaging plates. 1–3) Such storage luminescence phenomena include thermoluminescence (TL), optically stimulated luminescence (OSL) and radiophotoluminescence (RPL). The TL and OSL are explained by very similar luminescence mechanisms while the RPL is largely different.
Regarding the mechanism of TL and OSL, electrons and holes generated by ionizing radiation are captured by trapping center, which is typically derived by lattice defects and impurities. Upon stimulation by heat or photon, the trapped electrons or holes are de-captured to the conduction or VBs, respectively. As a result, the charges recombine at a luminescence center followed by photoemission. The emission intensity is proportional to the number of charges captured, which is proportional to the radiation dose. Therefore, the luminescence intensity is proportional to the irradiated dose, which is used as a probe of accumulated exposure dose in radiation dosimetry. 4,5) However, because the TL and OSL use the stored charges for luminescence, a readout process is destructive. Therefore, if there is any accident during a readout, the recorded signal can never be remeasured again.
In the case of RPL, in contrast, a luminescence center, called RPL center, is formed in a material upon interaction with ionizing radiation. The RPL center can be detected by photoluminescence (PL), and the PL intensity is proportional to the irradiated dose because the number of RPL center formed is proportional to the irradiated dose. 6,7) In addition, when the RPL center is stable, the signal can be readout nondestructively and multiple times, unlike TL and OSL. Because the multiple readouts allow to reduce the measurement deviation error, an accurate dose measurement is possible with RPL. Furthermore, the ideal RPL materials allow intentional reversal of RPL center, and the RPL center is reproduced by irradiation. From these behaviors, RPL materials are applied in radiation dosimetry.
Despite the functionalities of RPL, the reported number of RPL materials are very limited, and there are only a few RPL materials studied for radiation dosimetry applications, which include Ag-doped phosphate glass, 8–15) LiF, 16–19) and Al2O3:C,Mg. 20–23) For example, the RPL mechanism of Ag-doped phosphate glass, which is the most successful RPL material in radiation dosimetry, is explained by a valence change of doped Ag+ ion due to capturing of electrons and holes generated by ionizing radiation (Ag+ + e− → Ag0 and Ag+ + h+ → Ag2+). The generated Ag0 and Ag2+ act as luminescence center, emitting blue and orange light, respectively. In addition, the Ag0 and Ag2+ are highly stable under excitation and RT; therefore, dosimeters using Ag-doped phosphate glass are recognized as one of the most reliable techniques, owing to the high stability and allowance of multiple readouts. 6,9,10) As for the example mechanism of Ag-doped phosphate glass, the other materials have been investigated individually. However, the common principles of RPL properties across different materials such as occurrence conditions, sensitivity, stability and reusability are still not clear. This brings on a problem that there is no established guideline of material design so that it is difficult to develop RPL materials according to the requirements of a specific application. Therefore, searching for new RPL materials is very important to accumulate the knowledge in the research field and then resolve the above problems.
Recently, some researchers have reported RPL phenomenon in some inorganic materials using lanthanoid as a dopant such as Sm-doped oxyfluoride borophosphate glasses, 24) Sm-doped Li2CaSiO4, 25) Eu-doped SrAl2O4, 26) Eu-doped Ca2SiO4, 27) Eu-doped BaAlBO3F2 glass-ceramics, 28) and Yb-doped NaCl. 29) These materials exhibit RPL attributed to a valence change of the doped lanthanoid ion by charge trapping, for instance Eu3+ + e− → Eu2+. Therefore, a valence change of lanthanoid is one of the keys to discover new RPL materials.
In this study, we focused on Eu-doped Li2SrSiO4 as a new RPL material and studied its RPL properties. Li2SrSiO4 is easily synthesized at relatively low temperature under 1000 °C and has good chemical and thermal stabilities. In addition, lanthanoid ions can be easily incorporated in the Sr site and can function as a luminescence center. Some researchers have reported luminescence properties of Li2SrSiO4 when doped or co-doped with lanthanoid ions such as Eu2+, Eu3+, Ce3+, Pr3+, and Dy3+ for white LED applications. 30–33) Especially, it is reported that the internal quantum efficiency of Eu2+-doped Li2SrSiO4 is 62%. 30) Furthermore, Li2SrSiO4 can be a similar host material of Sm-doped Li2CaSiO4, which is known to show RPL phenomenon. 25) Therefore, Li2SrSiO4 is an attractive host in the present studies. Regarding the dopant, Eu was selected because Eu ion can take multiple valence states (Eu2+ and Eu3+) in various inorganic materials. Therefore, RPL due to a valence change of Eu is expected.
2. Experimental methods
Eu-doped Li2SrSiO4 was prepared by using the solid-state reaction technique. Li2CO3 (99.99%, Kojundo Chemical), SrCO3 (99.99%, Wako Pure Chemical), SiO2 (99.9%, Furuuchi Chemical) and Eu2O3 (99.9%, Kojundo Chemical) as the starting materials were weighed in a stoichiometric ratio and then mixed for 20 min by using an alumina pestle and mortar. The well mixed powder was loaded in an alumina crucible, which was then sintered at 700 °C for 4 h in air by using an electric furnace (FULL-TECH FT-101FMW). The obtained product was ground and mixed well and then sintered again in the same conditions. The final product was well ground to powder for following characterizations. Here, the concentration of Eu ranged 0.01, 0.05, 0.1, 0.2, 0.5, and 1.0 mol%.
The crystal structure of the obtained materials was identified by powder X-ray diffraction (XRD). The XRD patterns were measured by using a diffractometer (Rigaku UltimaⅣ) with Cu Kα radiation. The Cu Kα radiation was generated at a tube voltage of 30 kV and current of 20 mA. The obtained XRD patterns were analyzed by comparing with the reference patterns in the Powder Diffraction File (PDF) database to identify the crystal phase. 34)
PL and photoluminescence excitation (PLE) spectra were measured before and after X-ray irradiation by using a spectrofluorometer (Hitachi High-Tech F-4500). The apparatus was equipped with a Xe lamp as the excitation light source, and a photomultiplier tube (PMT; Hamamatsu Photonics R928F) was used as the photodetector. The measurements of PL and PLE spectra were performed by two different conditions, focusing on the features of Eu3+ and Eu2+. For Eu3+, the PL spectrum was measured from 560 to 750 nm while exciting the sample at 395 nm, and the PLE spectrum was measured from 300 to 500 nm while monitoring the emission at 613 nm. During the latter measurements, a short-cut filter with a cut-on wavelength of 560 ± 5 nm (SIGMAKOKI SCF-50S-56O) was placed between the sample and photodetector. In contrast, for Eu2+, the PL spectrum was measured from 500 to 750 nm while exciting the sample at 440 nm, and the PLE spectrum was measured from 300 to 460 nm while monitoring the emission at 570 nm. For these measurements, any short-cut filter was not used.
In order to evaluate the detailed RPL properties for applications in radiation dosimetry, the TSL/OSL/RPL Automated and Integrated Measurement System (TORAIMS) was used. 35) The system allows a measurement of PL spectrum, X-ray irradiation, and heating a sample in an integrated and automated manner. For excitation, a Xe lamp (Asahi Spectra LAX-C100) was used together with a band-pass filter of 440 ± 5 nm (SHIGMAKOKI VPF-50S-10-45-44000). For a PL spectrum measurement, a multi-channel spectrometer (Ocean Optics QEPro) was used, together with a short-cut filter with a cut-on wavelength of 490 nm (Asahi Spectra LVX490). X-ray irradiation was performed by using an X-ray tube with W-anode (Spellman XRB80N100B). The tube voltage was fixed to 40 kV while the tube current ranged 0.12–1.20 mA to adjust the dose rate of 0.83–8.33 mGy·s−1 range. The sample was located on an AlN ceramic heater (Sakaguchi WALN-3H) which allows to heat the sample in the range of 40 °C–500 °C.
All the above measurements were carried out at RT unless stated.
3. Results and discussion
The XRD patterns of the obtained samples and the reference pattern of Li2SrSiO4 (PDF 00-055-0217) are compared in Fig. 1. Comparing between the experimental data and the reference, these patterns showed a well agreement each other. Therefore, it was identified that the crystal phase of the obtained samples was Li2SrSiO4. The latter compound is categorized to the hexagonal system with a P3121 space group and has the same crystal structure with Li2EuSiO4. 36) In addition, the ionic radii of Eu and Sr ions are similar each other. Therefore, it is considered that the doped Eu ions into the obtained samples was replaced at Sr2+ ions site.
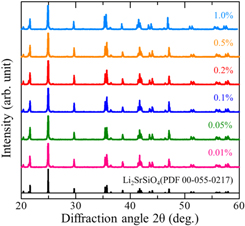
Fig. 1. The XRD patterns of obtained samples and the reference pattern of Li2SrSiO4 (PDF 00-055-0217).
Download figure:
Standard image High-resolution imageFigure 2 shows the appearance of the 0.1% Eu doped sample with and without X-ray irradiation history under UV light. Here, the does irradiated was 10 Gy, and the excitation wavelength was 254 nm. It is clear that the luminescence color changed from red to yellow by X-ray irradiation. This indicates that a new luminescence center has been generated by X-ray irradiation. In addition, the origins of the red and yellow luminescence were considered to be electronic transitions of Eu3+ and Eu2+ according to the literature. 31,37)
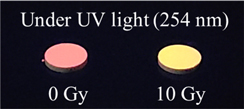
Fig. 2. Photographs of 0.1% Eu doped sample with and without X-ray irradiation history under UV light (254 nm).
Download figure:
Standard image High-resolution imageTo study the above luminescence features in more detail, the PL and PLE spectra of 0.1% Eu doped sample before and after X-ray irradiation were measured. The obtained spectra focusing on Eu3+ and Eu2+ features are shown in Figs. 3(a) and 3(b). As shown in Fig. 3(a), when excited at 395 nm, the PL spectrum before X-ray irradiation consisted of multiple sharp peaks. The emission origins were assigned to 4f–4f transitions of Eu3+: 5D0 → 7F0 (580 nm), 5D0 → 7F1 (588, 592 and 596 nm), 5D0 → 7F2 (613 and 622 nm), 5D0 → 7F3 (650 nm), and 5D0 → 7F4 (686 and 701 nm) according to the literature, 31) which agreed with the appearance of red luminescence seen before irradiation (Fig. 2). The PLE spectra of the latter emission also consisted of multiple sharp peaks, whereby the primary peak at 395 nm is attributed to the 7F0 → 5L6 transition of Eu3+. After X-ray irradiation, an additional broad emission peak appeared around 600 nm under 395 nm excitation. To study the emission features in more detail, PLE and PL spectra were measured by focusing on the luminescence appeared after X-ray irradiation [Fig. 3(b)]. When monitoring the emission at 570 nm, the PLE spectrum consisted of a broad feature. When excited at a center of the excitation band, a broad emission peaking at 570 nm was clearly seen. The former excitation band was attributed to the 4f7 → 5d14f6 transition of Eu2+ while the latter emission band was assigned to the 5d14f6 → 4f7 transition of Eu2+, 37) which agreed with the yellow luminescence in Fig. 2. However, the latter emission could not be observed from the one before irradiation measured with the same conditions [Fig. 3(b)]. The above results indicate that Eu2+ as an emission center was formed by X-ray irradiation. In other words, the Eu-doped Li2SrSiO4 has RPL properties.
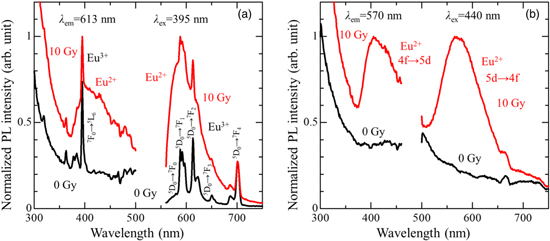
Fig. 3. The PL and PLE spectra of Eu-doped Li2SrSiO4 measured before and after X-ray irradiation (10 Gy), focusing on the features of (a) Eu3+ and (b) Eu2+.
Download figure:
Standard image High-resolution imageBecause this material clearly showed the RPL phenomenon, some properties for radiation detector applications were characterized by using the TORAIMS. First, the doping concentration of Eu maximizing the sensitivity was investigated. Figure 4 shows the RPL response after 1 Gy irradiation as a function of the doped Eu concentration. The RPL response is defined by an increase of PL intensity integrated from 500 to 700 nm under excitation at 440 nm, which is determined by the PLE spectrum in Fig. 3(b). This wavelength is suitable to excite predominantly Eu2+. As can be seen from the figure, the sensitivity was the highest when the doped Eu concentration was 0.1%. Therefore, the 0.1% Eu-doped sample was adopted for further characterizations.

Fig. 4. The RPL response by X-ray irradiation (1 Gy) as a function of Eu concentration.
Download figure:
Standard image High-resolution imageAs one of the important properties for radiation dosimetry applications, the dose response function was investigated, by measuring the PL intensity with varying X-ray irradiation dose. The obtained dose response function from 2.5 to 10 000 mGy is shown in Fig. 5. From this figure, it is clear that the RPL response increased monotonically to the irradiation dose. In addition, the lowest detection limit by using the TORAIMS was 5 mGy, determined by the cross section of the dose response function with the 3σ of instrumental noise. Therefore, the dynamic range for X-ray was confirmed to be at least 5–10 000 mGy. These results demonstrated that this material is capable for radiation dosimetry.

Fig. 5. The RPL response as a function of X-ray irradiation dose (2.5–10 000 mGy).
Download figure:
Standard image High-resolution imageTo evaluate the stability of Eu2+ generated as RPL, a set of PL spectra were measured as a function of elapsed time after X-ray irradiation (1 Gy). The PL measurements were performed with changing the interval at 30, 60, 120, and 240 s for 20 min. Figure 6 shows the measurement results of stability. It is clearly illustrated that the RPL response is fairly stable with time, and it showed a decrease in intensity by 5% after 20 min regardless of the measurement interval. This result indicates the stability of Eu2+ is not affected by the excitation light.
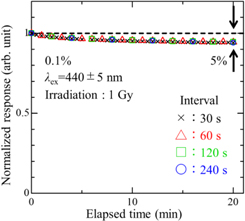
Fig. 6. The RPL response with changing measurement interval as a function of elapsed time after X-ray irradiation (1 Gy).
Download figure:
Standard image High-resolution imageFor the purpose to reverse the generated Eu2+ intentionally, an irradiated sample was heated at high temperatures, and then an influence in the PL features was investigated. The treatment temperature ranged 40 °C–500 °C and the treatment time was fixed to 100 s. All the PL spectra were measured after cooling back to the RT. Figure 7(a) illustrates the PL spectra as a function of heat treatment temperatures, in which the PL intensity of Eu2+ decreased by the heat treatment. Figure 7(b) shows the RPL response as a function of heat treatment temperature. In this figure, it is also clear that the RPL response decreased with increasing the treatment temperature. At low treatment temperatures below 100 °C, the RPL response slightly decreases. This decrease suggests that the trapped electron of Eu2+ can be de-captured by a thermal energy of RT. Therefore, it is considered that the decrease of RPL response observed by the stability study shown in Fig. 6 is caused by a de-capturing of trapped electron by RT. After the treatment at 500 °C, the response decreased to about 30% of the initial value. Although the generated Eu2+ was not fully reversed, it is confirmed that the majority of generated Eu2+ signal was erased by the heat treatment
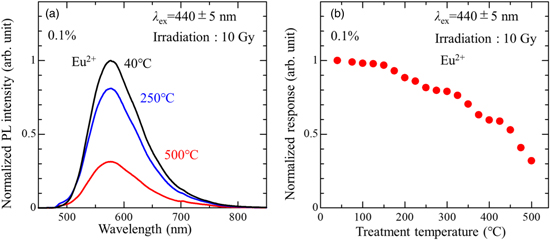
Fig. 7. Influence of heat treatment. (a) The PL spectra and (b) the RPL response of 10 Gy irradiated sample as a function of heat treatment temperature.
Download figure:
Standard image High-resolution imageAs the most Eu2+ signal generated as RPL can be reversed by heat treatment, the reproducibility of the material after heat treatment was studied. For this investigation, X-ray irradiation of 1 Gy and heat treatment at 500 °C for 600 s were performed alternatingly for a total of 10 cycles. Figure 8 represents the integrated PL intensity of Eu2+ as a function of cycle number. This figure demonstrates that, even with a history of X-ray irradiation and heat treatment, an increase of PL intensity by X-ray irradiation and a decrease by heat treatment were confirmed to be reproducible. However, pre-dose value increased with increasing the cycle number as the Eu2+ signal cannot be fully reversed by heat treatment at 500 °C. This result means that it is not appropriate to use the absolute value for accurate dose estimation. In the meantime, the difference value between before and after X-ray irradiation (or induced value) is consistent. Therefore, it is suggested that this material is reusable multiple times for radiation dosimetry applications.

Fig. 8. The integrated absolute and induced (difference) PL intensities of Eu2+ as a function of cycle number of X-ray irradiation and heat treatment.
Download figure:
Standard image High-resolution image
4. Conclusions
In this study, a set of Li2SrSiO4 doped with different concentrations of Eu (0.01%–1.0%) were synthesized by a solid-state reaction. The crystal phase of all the obtained samples was identified to the hexagonal structure of Li2SrSiO4 by using XRD. The as-prepared sample showed red luminescence under 254 nm UV lamp while the color changed to yellow after X-ray irradiation. The PL and PLE analyses revealed that the change of luminescence color was originated by an appearance of Eu2+. In other words, a new luminescence center, i.e. Eu2+ center, was formed by X-ray irradiation. Therefore, it was demonstrated that Eu-doped Li2SrSiO4 has RPL properties. The sensitivity of RPL was the highest when the concentration of Eu was 0.1%, and the dynamic range was confirmed to be 5–10 000 mGy, when the TORAIMS is used as a reader. In addition, the generated Eu2+ was highly stable because the PL intensity only decreased by 5% at 20 min after irradiation. Despite the stability, the generated Eu2+ can be reversed intentionally by a heat treatment at 500 °C for 100 s, which decreased the PL intensity of Eu2+ to about 30% of the initial value. Also, the difference of PL intensity before and after X-ray irradiation (or response) was reproducible regardless of the history of treatments by X-rays and heat. Therefore, it is suggested that Eu-doped Li2SrSiO4 is promising for radiation dosimetry applications.
Acknowledgments
This work was financially supported by a Grant-in-Aid for Scientific Research (B) (22H02009) from the Ministry of Education, Culture, Sports, Science and Technology of the Japanese government (MEXT). The Cooperative Research Project of Research Institute of Electronics, Shizuoka University, is also acknowledged.