
Abstract
High-intensity focused ultrasound (HIFU) therapy is a noninvasive treatment for cancer. Prediction of the HIFU treatment region in advance by ultrasound imaging is important for the efficacy and safety of the treatment. Acoustic radiation force (ARF) imaging has been shown to be useful in estimating the heat distribution caused by HIFU. In this study, we investigated the effect of shielding on the estimated heat distribution when the propagation of HIFU is partially shielded by an object simulating ribs, imitating an actual clinical situation, and examined the correction method of HIFU output power using ARF imaging to obtain tissue coagulation equivalent to that without shielding. As a result, it was suggested that even with partial acoustic shielding, when the HIFU output power is adjusted so that the displacement induced by ARF is equal to that without shielding, almost the same coagulated region can be obtained as in the unshielded case.
Export citation and abstract BibTeX RIS
1. Introduction
High-intensity focused ultrasound (HIFU) is a treatment modality that can treat cancer in a minimally invasive manner. In this treatment, ultrasound is irradiated from outside the body and focused inside the body to selectively heat and coagulate the target tumor. 1–4) HIFU treatment has been studied for more than half a century 1,5) and is expected to partly replace current major cancer treatments such as surgery, anticancer drugs, and radiation therapy. Current clinical applications include uterine fibroids, 6) prostate, 7) breast, 8) and liver cancer. 9) The major advantage of this treatment method is that it does not require incisions for surgical procedures. Instead, the disadvantage is that the treated region cannot be seen with the naked eye. 10,11) Therefore, it is necessary to non-invasively image the treatment site to improve the safety and efficacy of the treatment.
Currently, there are two main non-invasive monitoring modalities implemented in HIFU treatment systems: magnetic resonance imaging (MRI) and ultrasound imaging. MRI can monitor the temperature of both target and non-target tissues during treatment by taking advantage of the temperature dependence of magnetic resonance frequencies. 12,13) However, the temperature mapping by MRI lacks real-time performance with a frame rate of about 0.3 fps, 14) and the equipment itself is expensive and large. On the other hand, in US imaging, B-mode images obtained by pulse-echo methods can capture phenomena such as cavitation bubble generation and boiling that occur as temperature rises. 15–17) Recently, high-speed ultrasound imaging techniques using unfocused transmissions such as plane waves have achieved high temporal resolutions of up to 1 kfps. 18) This technology enables the visualization of millisecond-order phenomena such as shear wave propagation and cavitation bubble behavior. 19,20) In addition, ultrasound imaging has a self-compensation effect of aiming because therapeutic HIFU and imaging ultrasound are similarly refracted within the medium. 21)
Several ultrasound imaging methods have been proposed to visualize the amount of heat generated by HIFU exposure. One of these methods is thermal strain (TS) imaging, which measures tissue strain in an ultrasound image caused by temperature changes in tissues. 22) This method estimates temperature rise based on TS calculated from the temporal shift of the echo signal. There is also shear wave thermometry (SWT), which uses the temperature dependence of tissue stiffness. 23) In this method, shear waves are propagated by shear wave elastography (SWE), and a stiffness map is obtained from the difference in propagation speed, which corresponds to a temperature map. Both TS imaging and SWT require a temperature increase of several degrees Celsius because they use physical constants that change with temperature variation. 24)
Acoustic radiation force (ARF) imaging has been proposed as a method to visualize ultrasound absorption in a HIFU treatment that does not require temperature elevation. 25) ARF imaging is clinically applied to estimate a tissue shear modulus from the propagation of displacement generated inside tissue by ARF. 26) A short burst of HIFU exposure, called a push beam, generates ARF, and the resulting distribution of tissue displacement allows estimation of the HIFU heat source distribution in a homogeneous tissue. 24,25,27,28)
In ARF imaging, it has been reported that the amount of tissue displacement increases almost linearly with increasing HIFU acoustic power. 27) This means that when the attenuation in the entire HIFU propagation path is increased, the amount of displacement decreases in proportion to the attenuation. However, the effectiveness of HIFU heat source estimation by ARF imaging when the expected attenuation distribution is altered by partial acoustic shielding has not yet been investigated. In other words, the feasibility of heat source estimation under such conditions needs to be evaluated.
An example of an object partially shielding HIFU is ribs between the transducer and the region to be treated. In actual clinical practices, when a liver cancer is targeted, the HIFU transducer may be partially blocked by the ribs. In the previous study, it was reported that the ribs in the path of the HIFU beam significantly reduced the ARF generated in the area surrounded by the ribs. 29) Since the ribs absorb part of the ultrasound before it reaches the targeted region, less energy may be focused on the targeted region than expected and less coagulation is generated, possibly resulting in inadequate treatment. It is also possible that the position of the coagulation may shift due to changes in the acoustic field caused by the shielding. Therefore, we estimated the HIFU heating distribution in the presence of partial shields, such as ribs, and proposed a correction method for such cases. 30) In this paper, the efficacy of the correction method of the HIFU power to obtain the same coagulation in the presence of shielding as in its absence was investigated by obtaining the displacement distributions at various HIFU powers and comparing the coagulation areas with and without the shielding objects.
2. Experimental methods
2.1. HIFU heat source estimation by ARF
When a biological tissue is exposed to ultrasound waves, ARF is generated. ARF F can be expressed as

where α is the acoustic attenuation coefficient, I is the temporal-average acoustic intensity, and c is the longitudinal sound velocity in the biological tissue (1520 m s−1 in this study). 31)
By continuous HIFU exposure of the tissue, the acoustic energy is partially absorbed by the tissue and converted into heat. Accompanying this, the temperature in the focal region of the tissue rises, and the tissue is thermally coagulated. The heat quantity Q is expressed as 32)

where  is the acoustic absorption coefficient. The attenuation coefficient is expressed as the sum of the absorption and scattering coefficients. Since the majority of ultrasonic attenuation in vivo is due to absorption, the attenuation coefficient can be approximated by the absorption coefficient. Thus, the following proportionality equation is obtained

Since the tissue displacement u immediately after the short burst ultrasound exposure is approximated to be proportional to the ARF, Q satisfies the following relationship

Therefore, assuming that the inside of the ROI is a homogeneous tissue, the heat generation distribution due to the HIFU exposure can be approximated by the displacement distribution due to the HIFU burst exposure. 27) Figure 1 shows the process from HIFU heat source estimation to treatment using ARF imaging. In this study, the step in which a HIFU burst generates the ARF and imaging of the resulting displacement is called the estimation mode, and the step in which a continuous HIFU generates thermal coagulation in the tissue is called the coagulation mode.
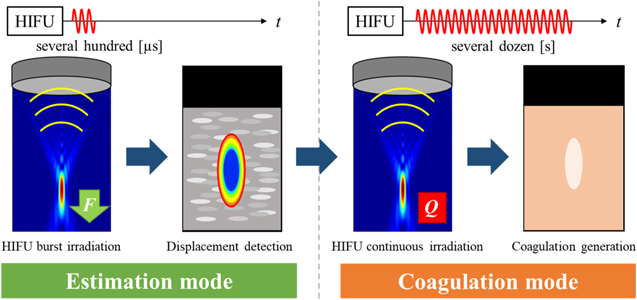
Fig. 1. (Color online) HIFU treatment flow with ARF imaging.
Download figure:
Standard image High-resolution imageThe correction method for HIFU power to generate a similar coagulation region in the unshielded case as in the shielded case is as follows. First, the displacement distribution of the estimated mode is obtained based on the TAP at which coagulation can be generated in the unshielded case, and the maximum displacement around the focal region is calculated after ROI averaging is performed on the entire displacement distribution diagram. The same process is then applied to the displacement distribution map in the shielded case, and the maximum displacement is calculated. If the effect of the slight change in the pressure distribution in the focal region due to the partial shielding is sufficiently small after the ROI averaging, it can be assumed that the displacement is the same and therefore the amount of heat generated is the same, which should result in the same degree of coagulation. By correcting the TAP in the shielded case to obtain the maximum displacement equivalent to that obtained by the reference TAP in the unshielded case, the coagulation mode is executed. For clinical applications, if the maximum displacement in the target tissue to achieve the appropriate therapeutic effect in the absence of shielding such as ribs is known, the correction method will be applicable in a similar manner. The effectiveness of this correction method, in which the TAP is corrected for the case of shielding, was examined in the following manner.
2.2. Experimental setup
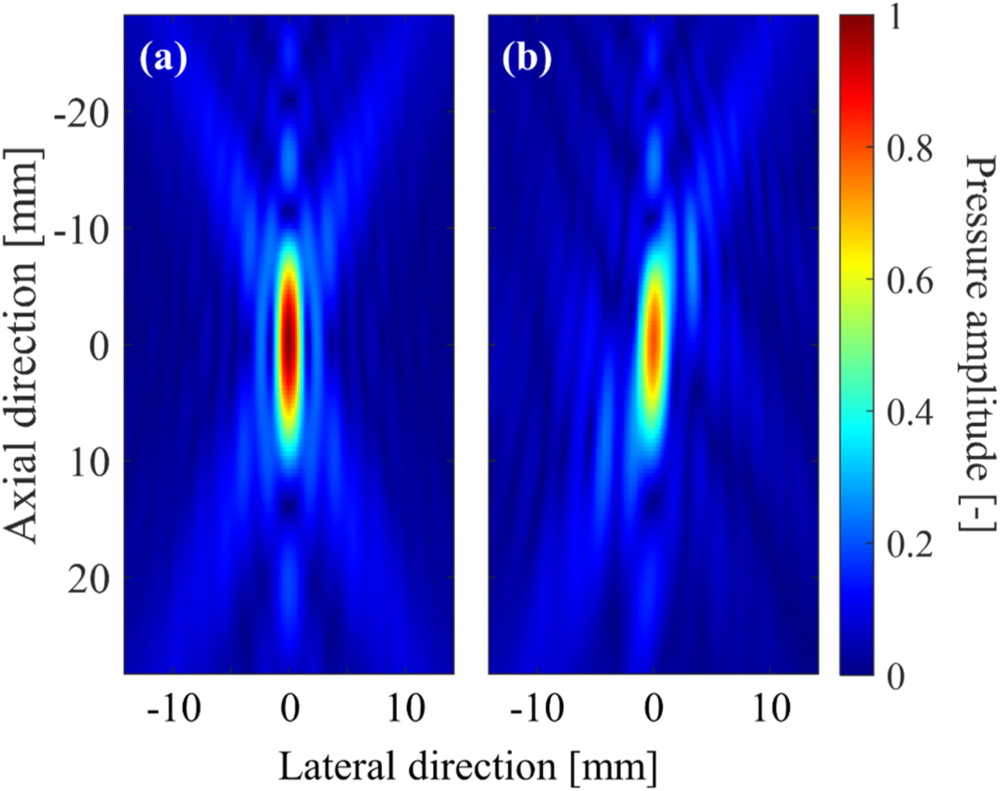
The experimental setup is shown in Fig. 2. The experiments were performed in an acrylic tank filled with deionized and degassed water (dissolved oxygen saturation of 20%−30%). A 256-channel two dimensional (2D)-array HIFU transducer with both outer diameter and focal length of 120 mm was placed in a water tank and driven at 1 MHz by a drive system (Microsonic, HIFU EU9144-2). A sector imaging probe (Hitachi Aloka Medical, UST-52105) was placed in the central hole of the transducer and connected to an ultrasound imaging system (Verasonics, Vantage 256) to acquire RF data at a sampling frequency of 14 MHz. A chicken breast tissue was used as a target tissue. It was cut into pieces about 70 × 40 × 25 mm, placed in 0.9% saline at RT, degassed for 3 h. And it is placed in plastic bags (70 μm in thickness), and vacuum compressed. In this experiment, coagulation was generated at two locations in the same sample tissue, one without rods and one with rods, and each location was designated as region A and region B, respectively. To simulate ribs, two stainless steel rods with a diameter of 12 mm were placed side by side on one side of the HIFU transducer approximately 60 mm away from the HIFU focal point. Before the HIFU exposure experiment, the acoustic pressure at the focal point was measured in the two patterns, without and with the rods. The pressure with the rods was about 20% lower than that without the rods. Table I shows the focal pressure and the HWHM pressure in the lateral, propagation, and slice directions of the HIFU. The acoustic pressure was measured without rods with a hydrophone (Onda, HGL-0085) in water at a focal peak of 1.73 Mpa peak-to-peak. An acoustic field simulation around the focal region of HIFU at 1 MHz was performed with a linear approximation based on the Rayleigh−Sommerfeld integral. Figure 3 shows the pressure distribution maps obtained from the simulation for the cases without and with rods, normalized by the focal peak pressure without rods. The axial direction in Fig. 3 corresponds to the z axis in Fig. 2. In the numerical simulation, the rods were assumed to be perfect ultrasonic absorbers. In other words, ultrasonic wave components reaching the rods were assumed to be completely absorbed, and the reflection by the rods was ignored. The HWHM pressure in the lateral, slice, and propagation directions were 2.0, 2.0, and 15.0 mm without rods, and 2.3, 1.9, and 14.7 mm with rods, respectively. The slight differences from the measured values in Table I are likely primarily due to reflections by the ultrasound imaging probe, which was not considered in the simulation. The simulated focal pressure with rods was 79% of that without rods, which is close to the measured value of 80% in Table I. The acoustic power in 3 × 3 mm2 of the focal plane with rods was 71% of that without rods. The shape of the focal region without rods was an ellipse with z-axis symmetry centered at the focal point, while with rods it was an ellipse tilted 2° with respect to the z axis.
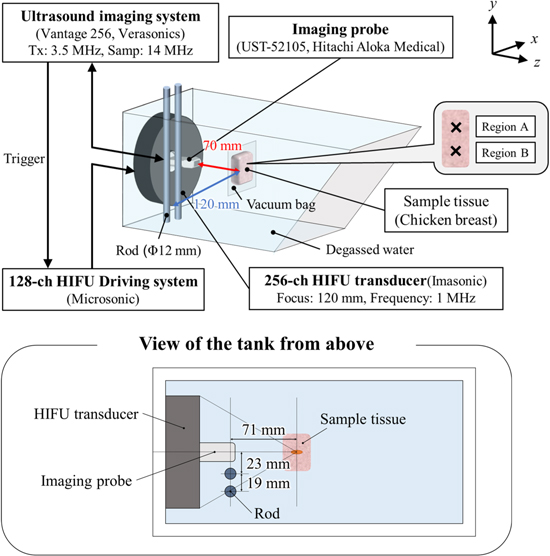
Fig. 2. (Color online) Schematic of the experimental setup.
Download figure:
Standard image High-resolution imageTable I. Focal point acoustic power and half-width in each case.
| Without rods | With rods | |||
|---|---|---|---|---|
| Normalized focal point pressure [arb. unit] | Half-width [mm] | Normalized focal point pressure [arb. unit] | Half-width [mm] | |
| x | 1.9 | 2.1 | ||
| y | 1 | 1.8 | 0.80 | 1.8 |
| z | 16.3 | 15.8 | ||
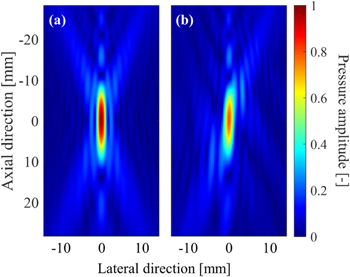
Fig. 3. (Color online) Normalized pressure distribution maps obtained from the simulation for the cases (a) without rods and (b) with rods.
Download figure:
Standard image High-resolution image2.3. Ultrasound exposure sequence
The ultrasound irradiation sequences for the estimation and coagulation modes are shown in Fig. 4. In the estimation mode shown in Fig. 4, HIFU burst was irradiated from the therapeutic HIFU transducer to the target tissue for 0.5 ms, and a single plane wave was transmitted from the imaging probe before and after the HIFU exposure to acquire RF data. The duration of a HIFU burst was set as short as possible to reduce the effect of shear wave propagation and long enough to induce the detectable axial displacement. 27) The axial displacements used to estimate the heat source distribution were calculated by applying a 2D combined autocorrelation method between the reference frame and the frame after the HIFU burst exposure. 33,34) An interval of 0.4 ms was set between the end of the HIFU burst exposure and the transmission of the next imaging pulse to reduce interference from the HIFU on the imaging. In this study, the total acoustic power (TAP) of the HIFU was fixed at 40 W without the rods and changed in the range of 40–64 W with the rods, and displacement distributions were obtained every 4 W. In the coagulation mode shown in Fig. 4, HIFU at the same intensity and frequency as used in the estimation mode was irradiated for 20 s to the same region of the target tissue to generate thermal coagulation in the tissue. In this study, to compare the coagulation results without the rods at a TAP of 40 W and with the rods at an adjusted TAP, the coagulation without the rods was generated in region A and with the rods in region B in the same tissue, respectively.
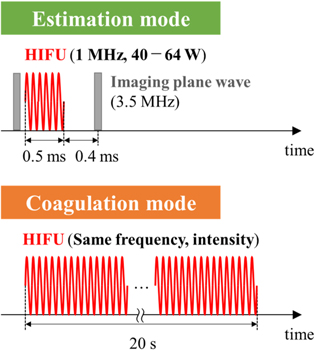
Fig. 4. (Color online) Ultrasonic exposure sequence.
Download figure:
Standard image High-resolution image3. Results and discussion
3.1. Effect of shielding on HIFU heating distribution estimation in region A
Figure 5 shows the displacement distribution maps (results of the estimation mode) by HIFU in region A without the rods and a TAP of 40 W with a duration of 0.5 ms and a TAP of 40–64 W with the rods and a duration of 0.5 ms. The geometric focal point of the HIFU was set at a depth of 70 mm in the ultrasound images for the experiment. In the displacement distribution maps, the HIFU is irradiated downward, and the displacement amount indicates downward displacement. Color bars are shown from maximum displacement to half value as a representative measure of ultrasonic absorption as previous studies and are applied to subsequent results. Comparing the results for 40 W without the rods to that for 40 W with the rods, the entire area where displacements greater than 0.8 μm were observed was smaller with the rods, and the maximum displacements was also smaller shown in Fig. 5. In addition, focusing on the shape of the displacement region, the results without the rods showed an ellipse with the depth direction as the axis, whereas the results with rods showed an overall elliptical shape tilted to the right. Figure 6 shows the maximum value after averaging in ROI (2 mm × 2 mm) in the range of width from −9.2 to 9.2 mm and depth from 35.4 to 75.0 mm. The area of the ROI was set as a square with 2 mm as one side, which is equivalent to the half-width of the HIFU beam in the lateral direction. In the case with the rods, the maximum displacement increased almost linearly with increasing TAP shown in Fig. 6. Compared to the maximum displacement of 40 W without the rods, the value was close at 64 W with the rods.
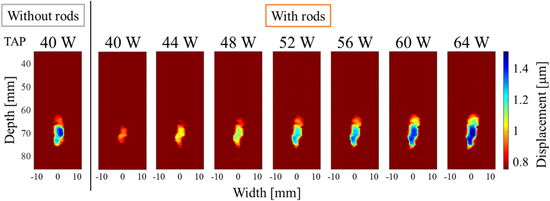
Fig. 5. (Color online) Displacement distribution maps induced by HIFU at a TAP of 40 W without rods and from 40 to 64 W with rods with a duration of 0.5 ms at region A.
Download figure:
Standard image High-resolution image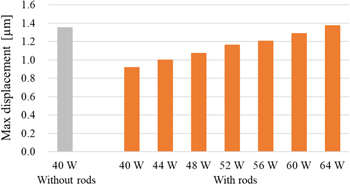
Fig. 6. (Color online) Comparison of max displacement after averaging in ROI (2 mm × 2 mm).
Download figure:
Standard image High-resolution image3.2. Effect of shielding on HIFU heating distribution estimation in region B
Figure 7 shows the displacement maps by HIFU in region B without the rods at 40 W with a duration of 0.5 ms and with the rods at 52–60 W with a duration of 0.5 ms. The geometric focal point and irradiation direction of the HIFU are the same as in 3.1. Comparing the results without and with the rods, the area of large displacement was reduced, similar to the results of 3.1 shown in Fig. 6. As for the shape of the displacement region, similar to the results in 3.1, the results with rods were generally elliptical in shape with a rightward tilt. Figure 8 shows that the maximum displacement with the rods increased almost linearly with increasing TAP. Compared to the maximum displacement without the rods at 40 W, the maximum displacement with the rods was close at a TAP of 60 W shown in Fig. 8.

Fig. 7. (Color online) Displacement distribution maps induced by HIFU at a TAP of 40 W without rods and from 52 to 60 W with rods with a duration of 0.5 ms at region B.
Download figure:
Standard image High-resolution image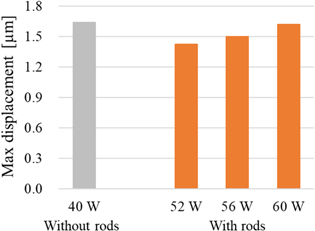
Fig. 8. (Color online) Comparison of max displacement after averaging in ROI (2 mm × 2 mm).
Download figure:
Standard image High-resolution image3.3. Comparison of coagulated area with and without shielding
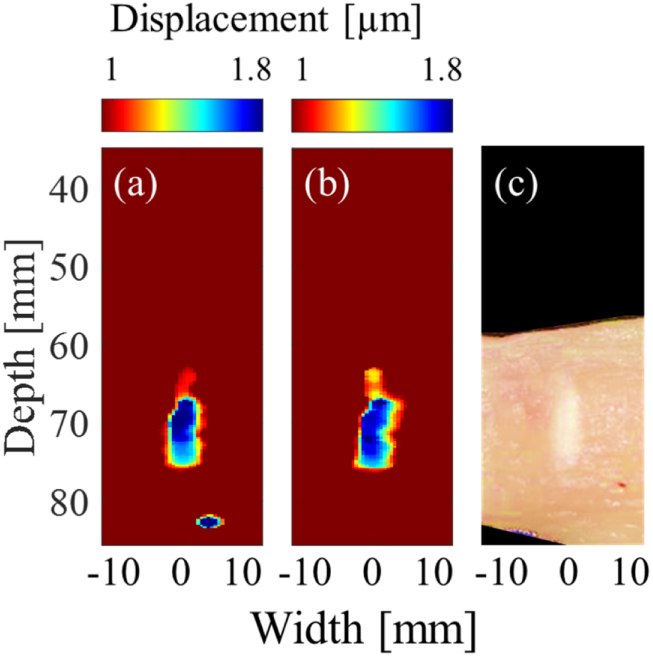
Figure 9 shows (a) a displacement distribution map of HIFU with a duration of 0.5 ms at a TAP of 40 W without the rods and (b) a cross-sectional view of the tissue sample after the HIFU exposure at 40 W with a duration of 20 s without rods in region A. Figure 10 show, (a) the displacement distribution map of HIFU exposure at 40 W without the rods with a duration of 0.5 ms, (b) the displacement distribution of HIFU irradiated at 60 W with the rods with a duration of 0.5 ms, and (c) a cross-sectional view of the tissue sample after the HIFU exposure at 60 W with a duration of 20 s with rods, in region B. As shown in Fig. 7, in region B, the maximum displacement at TAP of 40 W without the rods and at 60 W with the rods were close. From this, coagulation could be generated at HIFU output of 60 W with the rods. As shown in Figs. 9 and 10, there is good agreement between the displacement distribution maps in the estimation mode and the positions where actual coagulation was produced in the coagulation mode for both cases without and with the rods. In addition, the coagulated areas without and with the rods were similar in size despite the different values of TAP.
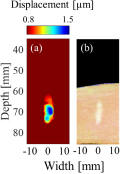
Fig. 9. (Color online) Comparison between (a) displacement distributions induced by HIFU at a TAP of 40 W with duration of 0.5 ms without rods, (b) coagulated tissue by HIFU at a TAP of 40 W with duration of 20 s without rods.
Download figure:
Standard image High-resolution image
Fig. 10. (Color online) Comparison between (a) displacement distributions induced by HIFU at a TAP of 40 W with duration of 0.5 ms without rods, (b) displacement distributions induced by HIFU at a TAP of 60 W with duration of 0.5 ms with rods, and (c) coagulated tissue by HIFU at a TAP of 60 W with duration of 20 s with rods.
Download figure:
Standard image High-resolution imageFigure 11 shows the relationship between the areas of the coagulated region without the rods in region A and those with the rods in region B in the same tissue samples from six similar experiments. In all cases, the tissues were successfully coagulated even with the rods. In the case with rods, coagulation was not obtained when the coagulation mode was performed at a TAP of 40 W without correction for TAP. The dotted line shows the graph for  . In two of the six cases, the areas of the coagulated regions without and with rods were almost equal. However, the other four cases showed differences in area size.

Fig. 11. (Color online) Relationship between coagulated area with and without rods.
Download figure:
Standard image High-resolution image
3.4. Discussion
In the case with the rods, the area and maximum displacement of the displacement distribution maps at 40 W in Fig. 5 and 52 W in Fig. 7 decreased. The reason for this is thought to be that the rods partially shielded the HIFU propagation, causing energy scattering and absorption, so that less energy reached the focal region than without the rods. As shown in Figs. 5 and 7, in both regions A and B, the shape of the displacement region with the rods was a right-tilted ellipse. Compared to Fig. 3, which simulates the experimental conditions, the shape of the displacement region with rods was similarly tilted compared to that without rods. The reason for this is thought to be that the rods partially shielded the HIFU propagation, causing the asymmetric distribution of the acoustic field. In the present experimental setup, the rods were installed on the upper left side of the displacement distribution maps, so the energy from the left half face from the HIFU transducer was reduced and the energy irradiated from the unshielded right half face was greater, resulting in the tilted the central axis of the acoustic field to the right.
Table I shows that the focal pressure with rods was 80% of that without rods. In the simulation, the acoustic power around the focal region with rods was 71% of that without rods. Since 71% of 60 W is 43 W, although it is slightly higher than 40 W, the corrected TAP with rods is considered reasonable. The half-width in the x-axis direction, i.e. lateral direction, was 0.2 mm larger with the rods due to partial shielding by the rods. Considering the effect of heat conduction during a 20 s exposure, this difference in the half-width of the coagulated area seems to be small. In the case of a higher shielding ratio, the HIFU beam width in the lateral direction further changes, so it may be necessary to reconsider the size of the ROI to be averaged.
As shown in Figs. 9 and 10, the same degree of coagulation was generated with and without rods, despite the different value of the HIFU output. This is probably because the displacement distribution areas in the estimation mode were similar and, the maximum displacement values after the averaging process were close owing to the increased TAP, resulting in the similar amount of heat generation in the focal region with and without the rods.
In Fig. 11, the reason why the four cases were not equal in area could be due to the variation in acoustic properties within the same sample such as shear modulus and acoustic absorption. In this experiment, coagulation was generated at different locations in the same sample in the coagulation mode without and with the rods, which may have caused the difference in acoustic properties in the two focal regions. To improve this, similar experiments should be conducted using samples or phantoms with a more uniform distribution of acoustic properties for comparison.
In this study, assuming that the attenuation coefficient of tissue can be approximated by the absorption coefficient, the proportionality between the ARF and heat generation by HIFU is derived in Eq. (3), and the heating distribution is estimated from the displacement distribution. Since Eq. (3) does not include the absorption coefficient, as a result, differences in absorption coefficients at different HIFU irradiation locations are taken into account in the estimated heat distribution. However, the approximation neglects the effect of the scattering coefficient, which may cause an error between the estimated heat generation area and the actual coagulation result. Therefore, it is necessary to quantitatively investigate the effect of the scattering coefficient on the estimated heat generation area. One method is to estimate the backscattering coefficient using an in situ calibration target. 35) Such techniques would be used for estimating the heat generation with considering the effects of scattering. Other factors to be considered are the longitudinal sound velocity c and stiffness μ of the medium near the focal point. In this study, we assumed that the variation of longitudinal sound velocity at different HIFU irradiation locations is small and used a constant value of 1520 m s−1. On the other hand, the variation in the stiffness is generally larger than that in the longitudinal sound velocity in soft tissues, which may affect the displacement and coagulation results. Therefore, it is necessary to visualize the distribution of the stiffness modulus. One method is the SWE method, 36) which obtains the distribution of the shear modulus (stiffness modulus) by propagating shear waves through the tissue and measuring the propagation velocity. Together, these techniques would make it possible to consider the distribution of stiffness and match the estimation of the heated region to the coagulation results.
4. Conclusions
In this paper, we simulated a case in which there is acoustic shielding between the HIFU transducer and the target tumor and investigated the effect of the shielding on the HIFU heating distribution estimation method and its correction method using ARF imaging. Even in the presence of shielding, coagulation similar to that obtained in the case of no shielding was obtained by performing HIFU exposure at a power output adjusted to obtain a displacement similar to that in the case of no shielding. The result indicates that even in the presence of partial acoustic shielding in a clinical situation, when the HIFU output power is adjusted so that the displacements in the estimation mode become a certain value depending on the tissue, it will be possible to ensure the efficacy of the treatment.
Acknowledgments
This work was partially supported by a Grant-in-Aid for Scientific Research (No. 20H04555) from the Japan Society for the Promotion of Science.