
Abstract
In the high-intensity focused ultrasound treatment enhanced by cavitation bubbles, monitoring cavitation bubbles is important to ensure the safety and efficacy of the treatment. In previous studies, a triplet pulse sequence (3P) was proposed to extract nonlinear echoes from bubbles. However, it was difficult to distinguish between the bubble component and the component from strong scatterers. In this study, in addition to 3P method, a filtering method to effectively extract cavitation bubble regions was proposed, and its effectiveness was experimentally examined. The proposed method extracts cavitation bubbles by setting a threshold value for the ratio of the amplitude from a 3P image to that from a 1P image (3P/1P). Under the conditions in this study (imaging frequency:2.45 MHz), the proposed can filter out the regions without bubbles by performing 3P/1P with the average values in the region of interest (2 × 2 mm2) and setting a threshold of −20 dB.
Export citation and abstract BibTeX RIS
1. Introduction
High-intensity focused ultrasound (HIFU) treatment is a treatment that thermally coagulates the target tissue, such as a tumor. The typical treatment is performed by irradiating HIFU from outside the body and focusing the ultrasound on the target region inside the body. HIFU treatment is minimally invasive because it neither requires surgical incisions nor uses radiation. 1–3) However, the region treated with a single exposure of HIFU is small, and treating the entire target region by scanning the HIFU focus takes a long time. 4) As a possible solution to this problem, cavitation enhanced HIFU treatment has been investigated. 5–7) This is based on the effect of oscillating cavitation bubbles to enhance HIFU heating, which is expected to shorten the duration and improve the efficiency of HIFU treatment. 8,9) Such cavitation bubbles can be generated by a HIFU pulse, and a "trigger HIFU" sequence has been proposed. In this sequence cavitation bubbles are generated by a high-intensity, short-duration "trigger pulse," followed by a medium-intensity, long-duration "heating burst" that utilizes the cavitation bubbles for heating. 10–14)
HIFU treatment does not require surgical incisions, making it a minimally invasive treatment. This is a great advantage but can be a disadvantage because the operator is not allowed to see the target, progress, and effects of the treatment with the naked eye. Therefore, the treatment must be combined with minimally invasive imaging to ensure its safety and efficacy. Currently, there are two such imaging methods combined with HIFU treatment: ultrasound imaging and magnetic resonance imaging (MRI). 15) While MRI can accurately map tissue temperature, its disadvantages include a low frame rate, high cost, and large equipment size. Ultrasound imaging, on the other hand, is superior to MRI in terms of cost, equipment size, and real-time performance. 16)
Generating the right amount of cavitation bubbles at the right time and position to enhance the HIFU treatment is not an easy task for a trigger pulse in a trigger HIFU sequence. If cavitation bubbles are generated outside the target region to be treated, it may cause some side effects. Therefore, real-time imaging of cavitation bubbles is necessary to ensure the safety and efficacy of the treatment. Since the dissolution time of cavitation bubbles is approximately proportional to the square of the radius, the larger the bubble radius, the longer the bubble life. 17–19) The size of the bubbles produced by HIFU at a frequency in the order of a megahertz is in the order of a micrometer, resulting in their lifetime in the order of a millisecond. 20,21) Therefore, monitoring cavitation bubbles requires a frame rate in the order of a kilohertz. This level of frame rate can be achieved by transmitting an unfocused ultrasound wave such as plane and diverging waves and forming many receiving lines at the same time. 22–25)
The wave reflected by cavitation bubbles has harmonic components because of the nonlinear nature of scattering by bubbles. 26) There are several ultrasound imaging methods to selectively visualize bubbles utilizing this nature. 27) The most widespread is a pulse inversion (PI) method, which detects the 2nd harmonic component. 28) However, the 2nd harmonic component is also generated through the nonlinear propagation of the transmitted ultrasound. This reduces the selectivity of the bubble signals significantly. In a previous study, a triplet pulse (3P) sequence was proposed to detect the 1.5th harmonic component, which is generated only by bubbles, and it was shown to be able to extract bubble signals at a significantly higher contrast than the conventional PI method under certain conditions. 29,30) However, it is difficult even by the 3P method to distinguish between high-intensity signals from strong scatterers and the signals from cavitation bubbles.
In this paper, a new filter that can extract bubble regions in a 3P image further selectively 31) was proposed and investigated. This filter combined with a 3P method may make an automatic as well as highly selective extraction of the bubble region possible during such HIFU treatment with a trigger HIFU sequence.
2. Experimental methods
2.1. Triplet pulse sequence
A 3P method shown in Fig. 1 has been investigated in previous studies as a method evolved from PI, which is a method of extracting the 2nd harmonic component of ultrasound echoes by transmitting two pulses with a phase shift by 180° and then adding the received echoes together. In this method, the fundamental components are canceled out while the 2nd harmonic components are enhanced by the addition. In a 3P method, on the other hand, three pulses with a phase shift by 120° are transmitted, and then the three received echoes are summed together. In this method, the 2nd harmonic as well as the fundamental components are cancelled out by the summation, while highly nonlinear components such as the 1.5th harmonic components are preserved. Considering the nonlinear component generated by the exponential power of the linear component, this simple equation:  shows that the phase of the 1.5th harmonic component is 1.5 times the phase of the fundamental component. In addition, since the resonance frequency of cavitation bubbles depends on not only its size but also its oscillation amplitude, the phase of the bubble oscillation can be different among the three pulses. Therefore, the phases of the signals from cavitation bubbles may not be in proportional to those of transmitted waves. This means that the signals of cavitation bubbles are not easily cancelled out even in the fundamental frequency component and the 2nd harmonic component. Based on these principles, a 3P method can produce a high contrast between tissues and cavitation bubbles, even in the presence of nonlinear propagation effects.
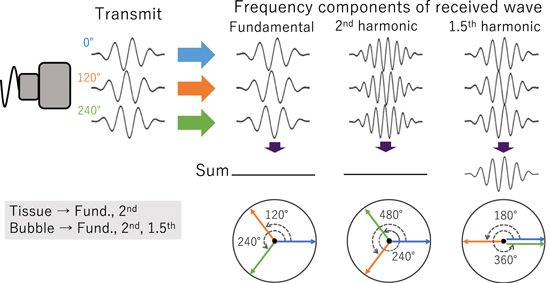
Fig. 1. (Color online) Principle of triplet pulse method.
Download figure:
Standard image High-resolution image2.2. Bubble region extract filter in 3P
Echoes with an extremely high amplitude from a strong linear scatterer may not be cancelled completely even by a 3P method, possibly because of the nonharmonic nonlinearity of the electronics at an extremely high amplitude and possibly because it is difficult to make the waveform and phase of imaging completely ideal. Therefore, a filter that could extract the bubble region with even higher selectivity than a 3P method alone is investigated in this study. The filter is created by dividing the 3P (0°, 120° and 240° summed together and divided by 3) signal by the 1P (0°) signal. The decrease due to the summation in 3P from 1P is considered to be small in the bubble region because the degree of cancellation is small, while the decrease is considered to be large in the region of linear scatterers. Based on this consideration, the proposed filter is conceived. The superiority of this proposed filter is that it uses 1P, which is a component of 3P, as a reference. Thus, the filter is less affected by body motion than when a reference is taken before treatment.
The process of filtering is described below. First, the 3P signal was divided by the 1P signal. At this time, a region of interest (ROI) was set and the average value of the 3P signal in the ROI was divided by that of 1P. This process was scanned over the entire image, pixel by pixel. Next, a threshold value is set to distinguish between bubbles and linear scatterers. The filter output is 1 if the decrease is less than the threshold, and 0 if the decrease is greater than the threshold. And finally, the filter output is multiplied with the 3P signal to extract only the bubble regions.
2.3. Experimental setup
Figure 2 shows a schematic of the experimental setup. HIFU exposure was performed with a 128-ch two-dimensional (2D) array HIFU transducer (Japan Probe) with a diameter of 147.8 mm and a focal length of 120 mm, which was placed on the side of a water tank. An 80-ch sector probe (Hitachi Aloka Medical UST-52105) was mounted in the central hole of the HIFU transducer, to perform ultrasound imaging. The imaging probe was sticking out by 50 mm from the HIFU transducer surface, so the focus of the HIFU was 70 mm from the imaging probe surface. The water tank was filled with degassed and deionized water at room temperature with dissolved oxygen 15%–17% of saturation. An excised chicken breast tissue was used as a target sample, which was degassed in 0.9% saline at room temperature at 0.08 MPa for 3 h. An injection needle (Terumo 22 G × 11⁄2') was also prepared as a strong linear scatterer by inserting it into the tissue. The target sample was fixed with a jig so that the HIFU focus was located in the target sample. The HIFU driving system 32) (Asahi TU-TX02) and an ultrasound imaging (Verasonics Vantage 256) system were synchronized by a function generator (NF WF1974). The HIFU frequency was 1 MHz and the imaging center frequency was 2.45 MHz in the experiments. The acoustic pressure of the imaging pulse around the HIFU focus was positive pressure:2.0 MPa, and negative pressure:1.3 MPa. The imaging was performed in a plane perpendicular to the long axis of the needle.

Fig. 2. (Color online) Schematic of experimental setup.
Download figure:
Standard image High-resolution image2.4. Ultrasound exposure sequence
Figure 3 shows the HIFU exposure and ultrasound imaging sequence. A trigger pulse at a spatial-peak pulse-average intensity (ISPPA) of 65 kW cm−2 with a duration of 0.1 ms was irradiated from the HIFU transducer to generate cavitation bubbles. This ISPPA was calculated assuming that an ISPPA is proportional to the square of the acoustic pressure and the input voltage, referenced to the acoustic pressure at the ISPPA of 0.37 kW cm−2 measured with a hydrophone (SN2003, ONDA) in water, assuming that the focal spot size does not change significantly with increasing the acoustic power.
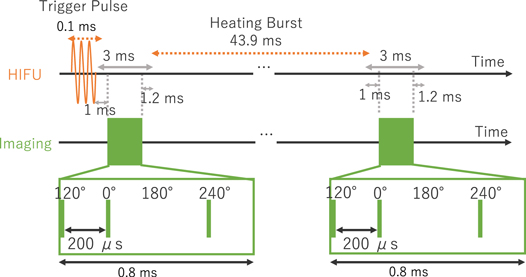
Fig. 3. (Color online) Sequence of HIFU and ultrasound imaging.
Download figure:
Standard image High-resolution imageIn this study, the filters were investigated under a simple condition without irradiation of heating burst, differently from the previous study on 3P with trigger HIFU sequence. 30) At 47.9 ms after the trigger pulse, ultrasound imaging at four phases: 120°, 0°, 180° and 240° was performed with 200 μs intervals, and the radio frequency (RF) data were acquired. 180° was obtained for use in PI method.
2.5. Image processing flow
Figure 4 shows the image data processing flow. First of all, RF data at 0°, 120° and 240° are acquired by the ultrasound imaging system using the ultrasound exposure sequence described earlier. At that time, the sampling frequency of the RF signal was 10 MHz. In addition, ultrasound imaging is performed with plane wave transmission to obtain 3P imaging data in a short time (800 μs) to reduce the effect of cavitation time variation. The input waveform to the imaging probe is shown in Fig. 5, with an input voltage of ±50 V. The transmitted waveform was naturally smoothed due to the limited bandwidth of the imaging probe. Then, the three RF data were summed pixel by pixel and all pixels were divided by three to generate the 3P image.

Fig. 4. (Color online) Overview of image data processing flow.
Download figure:
Standard image High-resolution image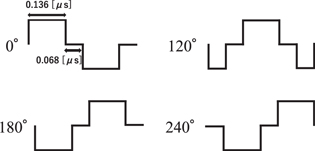
Fig. 5. Input waveforms to imaging probe.
Download figure:
Standard image High-resolution imageNext, a 2.5 MHz high-pass filter was applied to 1P (0°) and 3P ((0°+120°+240°)/3). This is to remove the components in the frequency range around 0.5 times the fundamental component (hereafter referred to as the 0.5th harmonic components), which cannot be cancelled in the 3P method. It is seen in the transmitted pressure waveforms at various distances from the imaging probe, shown in Fig. 6.
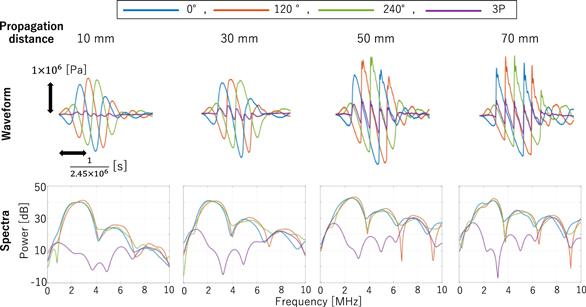
Fig. 6. (Color online) Waveforms and spectra of imaging ultrasound propagated in water measured with a hydrophone.
Download figure:
Standard image High-resolution imageNext, the high-pass filtered 1P and 3P RF data was processed with Verasonics software to obtain 1P and 3P IQ data. Then, a bubble region extraction filter was generated by dividing the 3P IQ data by the 1P IQ data. Finally, a bubble region extraction filter was applied to the 3P IQ data to obtain a bubble region extracted image.
3. Results and discussion
3.1. Results
Figure 6 shows the waveform and spectrum of imaging ultrasound propagated in water measured with a hydrophone (ONDA HGL-0085, frequency range (±3 dB): 0.25 to 40 MHz) in the water tank. Regardless of the propagation distance, it can be seen that the fundamental and 2nd harmonic components are cancelled out in 3P. In addition, it can be confirmed that as the propagation distance increases, the nonlinearity becomes larger, and the 0.5th harmonic components are also increased.
First of all, the results of imaging performed 47.9 ms after trigger pulse exposure are shown. Figure 7 shows the spectra of 1P and 3P RF data in the tissue region with and without the 2.5 MHz high-pass filter applied. In 1P and 3P, without the high-pass filter, the 0.5th harmonic components were not canceled out and remained. However, by adapting the 2.5 MHz high-pass filter, the 0.5th harmonic components are suppressed, and it is seen that the fundamental frequency band is decreased by more than 20 dB in 3P.
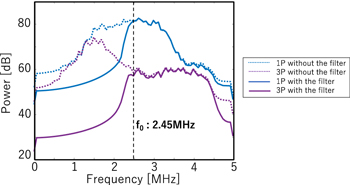
Fig. 7. (Color online) Spectra of 3P and 1P RF data in tissue area without and with the high-pass filter.
Download figure:
Standard image High-resolution imageFigure 8 shows B-mode images created from 1P and 3P IQ data without and with the high-pass filter. The focus point of the HIFU is located at a depth of 70 mm and width of −3 mm marked with an X, and the needle is depicted as the high-intensity region around at a depth of 65 mm and width of −15 mm. Without the high-pass filter applied, since the brightness reduction in 3P was small, the difference between the 1P and 3P images appears to be small. In addition, the speckle pattern of the image is larger in 3P than in 1P, and the main component of the 3P image appears to be the low-frequency components. On the other hand, with the high-pass filter applied, the difference between the 1P and 3P images appears to be large, confirming the suppression of tissue echo signals by addition. In the 3P image, the high brightness area, which was hardly visible in the 1P image, was observed around at a depth from 60 to 65 mm and width from −5 to 0 mm, which is considered to be a bubble region. However, even in the 3P image, the brightness of the needle remains at a similar level of the bubble region and is difficult to be distinguished from the bubble region. In addition, the high-pass filter removed low-frequency components, presumably the 0.5th harmonic components, resulting in somewhat noisy images, but the IQ data with the high-pass filter applied is used hereafter because the contrast ratio of the bubble region to the tissue in the 3P image was improved with the high-pass filter.
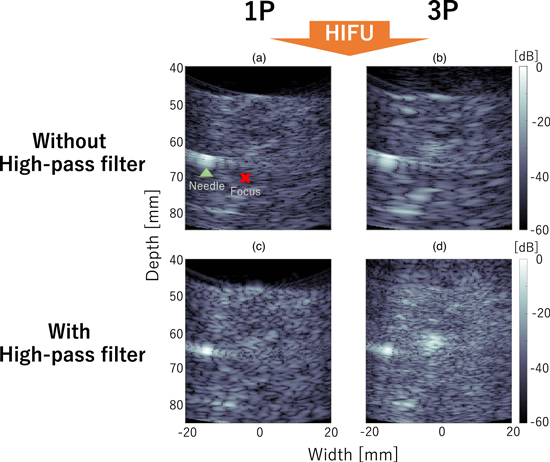
Fig. 8. (Color online) 3P and 1P B-mode images without and with the high-pass filter.
Download figure:
Standard image High-resolution imageFigure 9 shows the results of dividing the 3P by 1P signals (3P/1P) with different ROI sizes. As the ROI is larger, the image appears smoother and the contrast between the supposed bubble region and the tissue appears to be higher. However, it can be seen from the images that the resolution is reduced as the ROI is larger. Figure 10 shows the results of the quantitative evaluation of the value of 3P/1P between the bubble and tissue regions. The bubble region was defined as a depth from 60 to 65 mm and width from −4.5 to −1.5 mm, and the tissue as a depth from 60 to 65 mm and width from 10 to 13 mm from the image. The mean values in the defined regions and the error bars (unbiased standard deviations within the regions) are shown. The mean values in the bubble and tissue regions did not change significantly regardless of ROI size, but the unbiased standard deviations became smaller according to the data size in the ROI. Based on these results, a bubble region extraction filter was created with the ROI size set to 2 × 2 mm2 and the threshold for identifying the bubble region set to −20 dB.
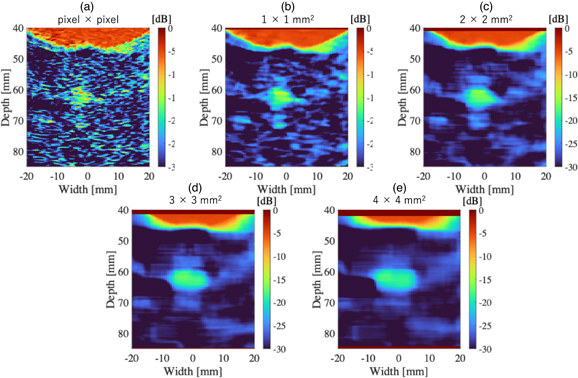
Fig. 9. (Color online) Results of 3P/1P with ROI sizes ((a) pixel × pixel, (b) 1 × 1 mm2, (c) 2 × 2 mm2, (d) 3 × 3 mm2, (e) 4 × 4 mm2).
Download figure:
Standard image High-resolution image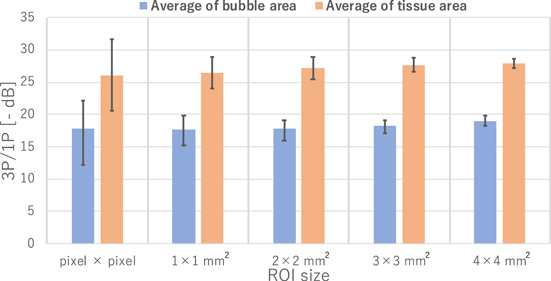
Fig. 10. (Color online) Average reductions of the bubble area and tissue area in 3P/1P and unbiased standard deviations within each area for the ROI sizes (pixel × pixel, 1 × 1 mm2, 2 × 2 mm2, 3 × 3 mm2, 4 × 4 mm2).
Download figure:
Standard image High-resolution imageFigure 11 shows the results of PI/1P with the high-pass filtered PI ((0°+180°)/2) as well. In Fig. 11(a), the distribution is similar to the result in Fig. 9, and bubbles and tissue can be distinguished. However, as can be seen in Fig. 11(b), the contrast between bubbles and tissue was smaller than in 3P/1P.
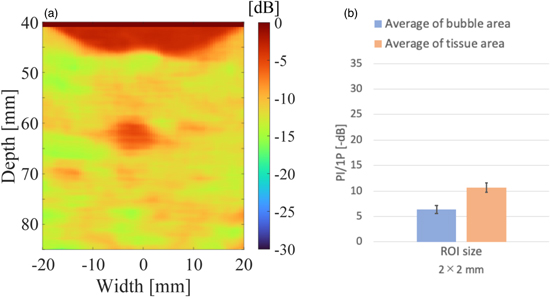
Fig. 11. (Color online) PI/1P with ROI size: 2 × 2 mm2 (a), Average reductions of the bubble area and tissue area in PI/1P and unbiased standard deviations within each area (b).
Download figure:
Standard image High-resolution imageFigure 12 shows the result of adapting the bubble region extraction filter to the 3P image. Figure 12(a) is the color image of Fig. 8(d) (the 3P B-mode image with the high-pass filter applied) for −20 dB and above. It can be confirmed that in addition to the bubble regions, high-intensity regions of needles and tissues, which were high-intensity scatterers, were extracted. Figure 12(b) shows the bubble region extraction filter, and Fig. 12(c) shows the result of applying the bubble region extraction filter [Fig. 12(b)] to the 3P image [Fig. 12(a)]. In Fig. 12(b), in addition to the region considered to be bubbles, the water region at the top of the image was also above the threshold of −20 dB in the 3P/1P image. However, in Fig. 12(c), it was confirmed that only the region considered to be bubbles could be extracted.

Fig. 12. (Color online) 3P with colored bubble signal (a), The bubble region extraction filter (b), The bubble region extraction filtered 3P with colored bubble signal (c).
Download figure:
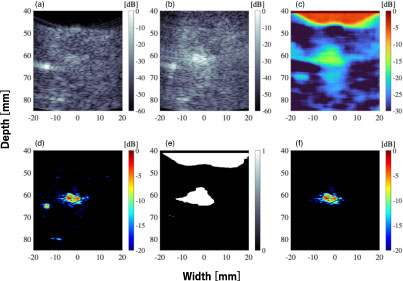
Standard image High-resolution imageFigure 13 shows the results of imaging performed 1 ms after the trigger pulse. All the results in Fig. 13 are with the 2.5 MHz high-pass filter applied. The ROI size for creating the bubble region extraction filter was 2 × 2 mm2, and the threshold for identifying the bubble region was −20 dB. The imaging performed 1 ms after the trigger pulse also showed no distinction between bubbles and the needle by the conventional 3P alone [Figs. 13(b) and 13(d)]. However, it can be seen that the bubble region can be selectively extracted by 3P combined with the bubble region extraction filter [Fig. 13(e)]. In addition, the size of the bubble region in the images were larger at 1 ms than 47.9 ms after the trigger pulse.
Fig. 13. (Color online) The results of imaging performed after 1 ms from trigger pulse; (a) B-mode image of 1P with high-pass filter, (b) B-mode image of 3P with high-pass filter, (c) Brightness reduction map from 1P image to 3P image (3P/1P), (d) 3P with colored bubble signal, (e) The bubble region extraction filter, (f) The bubble region extraction filtered 3P with colored bubble signal.
Download figure:
Standard image High-resolution image
3.2. Discussion
As seen in Figs. 6 and 7, the 0.5th harmonic components were not cancelled out in 3P. These components are considered to be caused by the nonlinear propagation and cannot be cancelled in the summation in 3P in principle. Also, when nonlinearization occurs during propagation, it is thought that the components in the frequency range around 0.5 times the fundamental component are generated due to multiplication with envelope components, and come from the envelope repeat frequency. 33,34) In addition, the initial phases of those components are canceled out by subtraction of the frequency components by multiplication. In this study, the 0.5th harmonic components were suppressed using the high-pass filter.
In Fig. 8(b), the power of the 0.5th harmonic components were large, resulting in large offsets in brightness to the entire image. Therefore, the difference between bubbles and tissue is considered to be hardly visible. On the other hand, in Fig. 8(d), the region that appears to be a bubble was extracted, and the cancellation occurs in the linear region to the extent that the water region in the upper part of the screen emerges. The reason for this is that removing the 0.5th harmonic components with the high-pass filter increased the rate of reduction of the linear scatterer signals, making the difference between the bubbles and tissue visible.
As for Figs. 9 and 10, the difference between bubbles and tissue regions became clear as the ROI size increased, while increasing the ROI size reduces the resolution of the bubble region extraction filter. Therefore, the smallest ROI size that can separate between bubble and tissue regions should be chosen. The error bars in Fig. 10 are the unbiased standard deviations for the bubble and tissue regions, respectively. Only when the bubbles and tissue error bars do not overlap, the separation by thresholding is effective. Therefore, the smallest ROI size (2 × 2 mm2), which provided 6 dB gap between the error bars, was selected. For the threshold to identify bubbles, −20 dB was used because the error bar of the bubble region was mostly smaller than −20 dB based on the ROI size (2× 2 mm2) data shown in Fig. 10.
The filter was created with the imaging results 47.9 ms after the trigger pulse. After the bubble generation by the trigger pulse, bubbles are considered to gradually dissolve, resulting in decreased signals from the bubbles. Since the 3P/1P reduction in tissue area is independent of imaging timing, it is assumed that the proposed method is also effective for the interval time immediately after the trigger pulse.
The ROI was used to reduce the effect of signal-to-noise ratio (SNR) and the difference between the point spread function in 3P and 1P. Therefore, under good SNR conditions, it would be possible to reduce the ROI size and improve the resolution of the filter by bringing the 1P and 3P spectra closer using a frequency filter. As for the threshold, since it depends on the signal reduction performance of tissue areas in 3P/1P, it is considered that the sensitivity of bubble region extraction can be improved by further lowering the threshold value with the waveforms of the 3 imaging pulses adjusted to further reduce the linear component.
In Fig. 11, the distribution trend of PI/1P is similar to that of 3P/1P, probably because the 2nd harmonic component has been cut off considerably by the bandwidth of the probe, and the fundamental component is the main component even in PI. However, 3P images were superior to PI images for extracting bubbles, 30) and Fig. 11 shows that 3P/1P is superior to PI/1P with the performance of the filter proposed in this study, indicating that 3P method is superior in the extraction of bubble regions.
In the bubble region extraction filter in Fig. 12(b), the water region at the top of the image is also above the threshold of 3P/1P. This is because the random noise in the water region has a large impact due to the weak received signal strength in the water region, making it difficult to cancel it out even when 3P method is applied. On the other hand, in Fig. 12(c), by applying the proposed bubble region extraction filter to the 3P image, only the bubble region can be extracted. This is because the area with high brightness in the 3P image and the area with a small reduction in 3P/1P is considered to be the bubble region. The water area was not extracted because of its low brightness in the 3P image, and the tissue area was not extracted because of its large reduction in 3P/1P. As the result, only the bubble region with high brightness in the 3P image and with small reduction in 3P/1P was extracted.
Figures 9, 12 and 13 show that the bubble region extracted by the imaging 1 ms after the trigger pulse was larger than that 47.9 ms after the trigger pulse. This suggests that many cavitation bubbles remained just after trigger pulse and that the region of bubbles became smaller because small bubbles dissolved and only large bubbles remained. Since the bubble region obtained at 47.9 ms was tighter than at 1 ms, it is more effective for the extraction filter even when the 3P image at 1 ms was chosen to be filtered.
In this study, the effectiveness of the bubble region extraction filter was investigated for bubbles generated by a trigger HIFU pulse. In the future, the effectiveness of the bubble region extraction filter will be investigated under the condition of the heating burst exposure for applying the proposed method to the cavitation enhanced thermal treatment in practice. The effects of heating burst intensity and the timing of imaging must be considered at that time.
4. Conclusions
In this study, the effectiveness of the method to selectively depict the bubble region was experimentally investigated. A new filter was proposed to further improve the selectivity of the triplet pulse (3P) method to distinguish between bubble signals and other signals. The experimental results showed a significant improvement by the proposed filter over a 3P method alone, suggesting that the proposed filter combined with a 3P method should be effective in selectively showing bubble regions during cavitation enhanced HIFU treatment.
Acknowledgments
This work was partially supported by a Grant-in-Aid for Challenging Exploratory Research (No. 22K19889) from the Japan Society for the Promotion of Science.