
Abstract
Bond strength is the most reliable criterion of the wafer bonding quality. Water stress corrosion affects the bond strength, corresponding to the measurement atmosphere and residual moisture at the bonding interface. In this study, we developed a new methodology to measure the wafer bond strength including the water stress corrosion effect under the controlled atmospheres, namely, dry atmosphere, wet atmosphere, and vacuum. The developed method experimentally demonstrates the evaluation of the water stress corrosion by the surrounding air and the interfacial water separately. Furthermore, it is also indicated that the water stress corrosion depends on the bonding methods, such that the surface activated bonding using Si intermediate layer has high durability for corrosion and the hydrophilic bonding has low durability. This study will provide a new understanding of the relation between the bonding process and the water stress corrosion effect, especially for the interfacial water.
Export citation and abstract BibTeX RIS
1. Introduction
Wafer bonding is nowadays an indispensable technique for fabrication, assembly, and packaging of electronic devices including LSI and micro-electric mechanical systems (MEMS). Especially, silicon (Si)-based materials such as SiO2, 1) SiN, 2) and SiCN 3) are widely employed for these applications, in many cases as a dielectric or passivation layer.
In order to fabricate and package these applications, the low temperature and direct bonding in wafer-level is in rapid research and development. First, indirect bonding using organic adhesives will lead to lower reliability of the bonding interface since the adhesive degrades at the working temperature and environmental conditions such as water. In addition, the high temperature bonding process typically at over 300 °C results in a residual stress at the bonding interface due to the mismatch of the coefficient of thermal expansion of the substrates. Therefore, many studies have reported the low temperature and direct bonding of Si-based materials.
The most common approach to achieve the wafer bonding of Si-based materials is hydrophilic bonding. In the hydrophilic bonding process, the surface treatments are widely employed such as water rinse, vapor exposure, UV irradiation, or RF plasma with O2, N2, or Ar gas. 4,5) After these treatments, the hydrophilic surfaces associated with hydroxy (OH) groups are brought into contact, and bonded mainly via hydrogen bonds. In many cases, the bonded substrates are annealed to enhance the bond strength, at less than 300 °C in the case of low temperature bonding, or at over 600 °C for industrial processes.
As an alternative approach to lower the bonding process temperature, surface activated bonding (SAB) has been studied as a room temperature bonding. 6) In its standard process, the surfaces are cleaned and activated by ion beam or fast atom bombardment (FAB), removing the oxides and organic contaminations from the surface. The activated surfaces are brought into contact under vacuum, followed by the room temperature bonding via atomic forces.
Since the standard SAB process is not applicable to certain materials such as SiO2, the SAB method has been applied to the SiO2 and polymeric materials by introducing the intermediate layers of Si or aluminum oxides (AlO). 7–9) In the case of the SAB with Si intermediate layer, the activated bonding surfaces are covered with 5 nm thick Si layer deposited by ion beam sputtering, followed by the second surface activation and bonding via the Si layers. The bonds of Si–Si at the bonding interface enhance the bond strength, resulting in a strong wafer bonding of SiO2 even by room temperature process.
In the case of the SAB using AlO intermediate layer, 5 nm thick AlO layers are deposited using ion beam of Ar and O2 gas and Al target instead of Si. The bonding of SiO2 is achieved at room temperature under vacuum as well. In addition, the bonding interface has a high transmittance due to the transparency of the AlO layer, indicating the applicability to the optical devices. 9)
For these low temperature bonding techniques, it is necessary to evaluate the bonding quality including reliability and performance of the applications. In order to guarantee the reliability of the device, the evaluation of the bonding interface is important from the perspective of mechanical, electrical, thermal, and optical interconnection. For this, the bond strength is the most reliable value for the quantification of the bonding interface.
In order to measure the bond strength at the interface, several methods are employed in the previous studies and industrial R&D. Based on the conventional fracture mechanics, the toughness of the bonding interface is measured as a stress intensity factor (KIC ), J integral, or crack opening displacement. 10) For this, the actual fracture test is conducted by tensile of a specific specimen with a certain initial crack at the bonding interface. Although this method is supported by mature models of the fracture mechanics, the Requirements for the experimental setups and specimen including the initial crack are not very convenient.
In the case of chip-to-chip bonding, the bond strength is often evaluated by the tensile test, measuring the tensile stress at the fracture of the bonding interface as tensile strength. 11) This method is widely employed in previous studies on the chip-to-chip bonding, although the chip size is limited as the fracture load depends on the bonding area. Therefore, the bond strength of wafers can not be measured by the tensile test directly, unless the bonded wafers are diced into chips.
For the bonding of chip-to-substrate or wafer, the shear test is also widely employed to evaluate the shear strength as the shear stress at the bonding interface when the chip is delaminated. 12) Although the requirements for the shear test is not complicated, the applicable shear load is lower than the tensile load in general. Furthermore, the shear test is naturally not applicable to as-bonded wafers.
Wafer bond strength is mainly measured by the double cantilever beam (DCB) method as an energy release rate G or surface energy γ due to the simplicity of the test. 13) DCB method, also referred to as blade insertion test, crack opening test, or Maszara's method, is conducted just by inserting a thin blade or razor into the bonding interface to propagate the crack. The energy release rate G is calculated based on the balance between the strain energy of the deformed substrate and the surface energy of the newly generated surface during the crack propagation, as follows;

where t is the thickness of the blade, E1 and E2 are Young's modulus of the substrates, h1 and h2 are the thickness of the substrates, and L is the length of the crack.
This method is very widely employed for the wafer bond strength measurement because it does not require special equipment, except IR imaging systems to observe the crack propagation between opaque substrates. Although DCB method can measure the limited bond strength, typically less than the intrinsic surface energy of the tested substrates, this method is the most common method for wafer bonding studies.
DCB method has the assumptions affecting the bond strength measurement such as the constant width of the specimen, quasistatic crack propagation, and the ignorance of the shear strain of the substrate deformation.
14) In addition, water stress corrosion also has a large effect on the measured bond strength, especially for Si-based materials. Water stress corrosion, by which the Si–O–Si bonds with applied stress react with H2O, lowers the fracture toughness of SiO2 structure (2 SiO2 + H2O → 2 Si–OH +  O2).
15) In the case of the hydrophilic bonding and its bond strength measurement, the water attacks the Si–O–Si bonds at the crack tip of the bonding interface, resulting in a 50% decrease in the bond strength in a wet atmosphere compared to the bond strength measured in a dry atmosphere for instance.
16)
O2).
15) In the case of the hydrophilic bonding and its bond strength measurement, the water attacks the Si–O–Si bonds at the crack tip of the bonding interface, resulting in a 50% decrease in the bond strength in a wet atmosphere compared to the bond strength measured in a dry atmosphere for instance.
16)
In previous studies, it has been reported that the bond strength of Si-based materials is affected by the ambient water of the measurement atmosphere since the SiO2 bonds are dominant for the hydrophilic bonding interface. However, it has also been reported that the adsorbed water on the bonding surface is trapped at the bonding interface in the case of low temperature bonding. 17) Although interfacial water has been reported to enhance the adhesion at the bonding interface, 16) there is not only positive effect but also negative effects. It is widely known that too much adsorbed water on the substrate surface results in interfacial voids. Moreover, the bond strength is also supposed to be affected by the water stress corrosion of the interfacial water, especially when the residual water remains at the bonding interface. Nevertheless, the effect of the water stress corrosion of the interfacial residual water has not been evaluated so far.
In this study, we propose a new methodology to evaluate the bond strength with consideration of the water stress corrosion of not only the ambient water in the measurement atmosphere but also the residual water at the bonding interface. 18) For this, we developed a new bond strength measurement machine based on the DCB method, which can evaluate the bond strength under the controlled atmospheres, namely, in wet air, dry air, and vacuum. In addition, we also quantify the water stress corrosion using several wafers bonded by several low temperature bonding methods mentioned above.
2. Method
2.1. Materials
As the water stress corrosion is significant for SiO2, we prepared the bonded wafers of glass as a SiO2 material. In addition, since it is difficult to distinguish the bulk SiO2 of glass from the intermediate oxides by the hydrophilic bonding process, we also prepared the silicon nitride bonding. 4 inch and 500 μm thick alkali-free aluminosilicate glass wafers were obtained from Nippon Electric Glass (Japan). 50 nm thick low-pressure chemical vapor deposition (LPCVD) SiN layer was deposited on a 4 inch and 525 μm thick Si wafers. In addition, as described later, the sapphire wafers are also employed for the bonding and measurement experiments to investigate the water stress corrosion of AlO. For this, 4 inch and 600 μm thick sapphire wafers were also prepared for comparison to the SAB using AlO intermediate layer.
2.2. Bonding methods
For the measurement of the wafer bond strength, we prepared the bonded wafers based on the hydrophilic bonding and SAB methods with intermediate layers. In the case of the hydrophilic bonding, the substrates are treated with 250 W RF plasma of O2 or N2 for 2 min. After the plasma activation, the bonding is performed in cleanroom ambient at room temperature, followed by post-bonding annealing at 200 °C for 2 h.
In the case of the SAB process using intermediate layers, the substrates are introduced into a vacuum chamber, followed by the Ar ion beam irradiation with 1.5 kV acceleration voltage. Then the substrate surface is covered with the Si or AlO intermediate layer with 5 nm thickness by the ion beam sputtering in the same chamber. 19,20) Subsequently, the deposited intermediate layers are activated by the Ar ion beam and are brought into contact under vacuum at room temperature with 5 kN load for the bonding.
For comparison, the standard SAB method without intermediate layers is also applied to the sapphire substrates. In this process, the substrates are activated by Ar fast atomic beam (FAB) and bonded in a vacuum chamber at room temperature.
2.3. Bond strength measurement
In order to quantify the bond strength under the controlled atmospheres, we developed a new measurement machine, as its schematic is shown in Fig. 1. In the chamber, a wafer stage is installed to fix the bonded wafers on it and moves to adjust height. A 0.1 mm thick stainless blade is inserted into the bonding interface by the liner feedthrough from the outside chamber. The blade size is 22.2 × 90 mm2 (FEATHER SAFETY RAZOR CO., Ltd., Japan). The chamber is connected to the rotary pump and turbo molecular pump to evacuate the chamber to the pressure of 3 × 10⁻³ Pa. The crack propagation by the blade insertion is observed by the IR camera system through the window on the chamber. The bond strength is calculated using Eq. (1) as a surface energy γ. Young's modulus of glass, SiN on Si wafer, and sapphire is 75, 180, and 400 GPa for the calculation.

Fig. 1. (Color online) Schematic of the developed measurement machine. The wafer bond strength measurement is based on the DCB method and the blade insertion is performed in the isolated chamber under the controlled atmospheres.
Download figure:
Standard image High-resolution imageFor the measurement, we controlled the measurement atmosphere using the ambient air as a wet atmosphere, pure N2 gas as a dry atmosphere, and vacuum condition. In order to avoid the effect of static fatigue at the bonding interface, the observation of the crack length is done 210 s after the blade insertion. In the case of the bond strength measurement in the ambient air, the temperature is 20 °C–25 °C and the relative humidity is 50%–70%.
2.4. Debonded surface analysis
For further analysis, the wafer surfaces after the debonding are analyzed using X-ray photoelectron spectroscopy (XPS) for each debonding atmosphere of ambient air, N2 gas, and vacuum. After the debonding of the bonded wafers by the blade insertion, the debonded surfaces are immediately (within 5 min) introduced into the vacuum chamber of XPS equipment. As the fracture basically occurs at the weakest point of the bonding interface during the debonding, the XPS analysis of the debonded surface shows the broken bonds at the bonding interface.
The XPS analysis is conducted with JEOL JPS-9200 using Mg X-ray source and electrostatic hemispherical analyzer. The X-ray is irradiated to the samples with an accelerating voltage of 10 kV, emission current of 10 mA, and incident angle of 45°. The collected data is calibrated using C1s peak as 284.6 eV and the curve fitting is conducted using the Gaussian-type function with the help of Igor Pro8 multi-peak fit (Hulinks Inc.).
3. Results
The bond strengths of the glass wafers measured under the controlled atmospheres are shown in Fig. 2. In the case of the hydrophilic bonding, the measured bond strength is 0.51 J m−2 in the ambient air as wet atmosphere, 0.87 J m−2 in N2 gas as dry atmosphere, and 1.2 J m−2 under vacuum. As the ambient air contains water, the results indicate that the bond strength is affected by water stress corrosion. In addition, since the bonding is achieved by the low temperature hydrophilic bonding, the bonding interface includes the residual water. For the measurement under vacuum, it is indicated that the residual water is partially desorbed from the bonding interface as the crack propagates. As the water stress corrosion occurs at the crack tip, the desorption of the interfacial residual water decreases the effect of water stress corrosion. Therefore, the bond strength under vacuum is measured the highest.
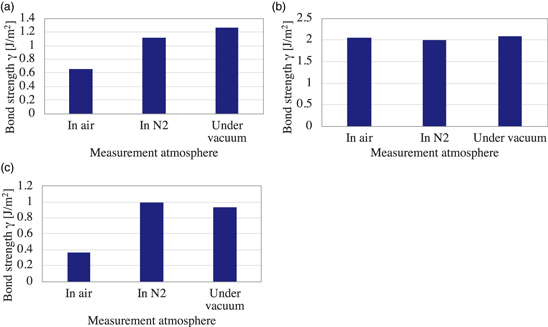
Fig. 2. (Color online) Bond strength of the glass wafers measured under the controlled atmospheres for (a) the plasma activation hydrophilic bonding, (b) SAB with Si intermediate layer, and (c) SAB using AlO intermediate layer.
Download figure:
Standard image High-resolution imageFigure 2(b) shows the bond strength of the glass wafers using SAB with Si intermediate layer. The bond strength is measured almost equally to the all measurement atmospheres, i.e. 2.0 J m−2 in the ambient air, 2.0 J m−2 in N2 gas, and 2.1 J m−2 under vacuum. Since the bonding interface of the SAB using Si intermediate layer mainly consists of Si–Si bonds, the bonding interface is not affected by water stress corrosion. Therefore, the bond strength is almost the same for each measurement atmosphere.
The bond strength of the glass wafers bonded by the SAB using AlO intermediate layer is shown in Fig. 2(c). The bond strength is 0.36 J m−2 in the ambient air, 1.0 J m−2 in N2 gas, and 0.93 J m−2 under vacuum. Given that the N2 gas and vacuum condition does not have the water, the bond strength of the SAB using AlO intermediate layer is affected by only the ambient water. Furthermore, the bonding interface of the SAB using AlO intermediate layer basically does not contain the interfacial water because the adsorbed water is removed by the ion beam irradiation and AlO layer deposition. Therefore, in the case of the measurement in N2, the water stress corrosion effect is as less as under vacuum.
In order to demonstrate the effect of the water stress corrosion under the controlled atmosphere, the SiN wafers are also bonded and its bond strength is measured in the same manner as the glass wafer bonding. Figure 3 shows the bond strength of each bonding method and each measurement atmosphere. As shown in Fig. 3(a), the bond strength of the hydrophilic bonding using O2 plasma activation is measured the lowest of 1.1 J m−2 in the ambient air, the middle of 1.5 J m−2 in N2 gas, and the highest of 2.8 J m−2 under vacuum. The bond strength of the hydrophilic bonding using N2 plasma also shows 0.46 J m−2 as the lowest in air, 0.92 J m−2 as middle in N2, and 1.1 J m−2 as the highest under vacuum. These results agree with the bond strength of the glass, as shown in Fig. 2(a).
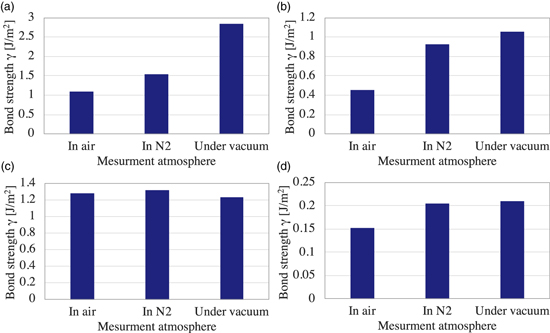
Fig. 3. (Color online) Bond strength of the SiN wafers measured under the controlled atmospheres for (a) the O2 plasma activation hydrophilic bonding, (b) the N2 plasma activation hydrophilic bonding, (c) SAB with Si intermediate layer, and (d) SAB using AlO intermediate layer.
Download figure:
Standard image High-resolution imageIn addition, the bond strength of SiN wafers by SAB using intermediate layers also shows the same trend as the glass wafer bonding. The bond strength of SiN using Si intermediate layer shows the almost equal value for each measurement atmosphere, 1.3 J m−2 in air, 1.3 J m−2 in N2, and 1.2 J m−2 under vacuum. This also agrees with the results of the glass wafer bonding shown in Fig. 2(c). This also indicates that there is almost no water stress corrosion compared to other bonding methods due to the dominant Si–Si bonds at the bonding interface. Hence, it can be said that the SAB with Si intermediate layer has high durability for water stress corrosion.
Figure 3(d) shows the bond strength of SiN wafers with AlO intermediate layer. The bond strengths for all measurement atmospheres are lower than other bonding methods because the bondability of SiN is generally low and the bond strength of AlO is also generally low. Although the bond strength difference is not great, the effect of the water stress corrosion is observed in air, which shows the lowest bond strength.
Considering that the alumina (Al2O3) is widely employed as a protection layer for corrosion, 21) it should be noted that the water stress corrosion on the AlO bonding interface is supposed to be attributed to the effect of the SAB process. In order to investigate the effect of water stress corrosion on the AlO intermediate layer, we also applied the SAB method for sapphire wafers. The measured bond strength of the sapphire wafers by the standard SAB without intermediate layer is shown in Fig. 4. In a similar way to the SAB using AlO intermediate layer, the bond strength is measured the lowest at 0.93 J m−2 in air, and higher at 1.7 J m−2 for both in N2 and under vacuum. As the surface activation on the sapphire leads to amorphization of the Al2O3 crystalline structure and in some cases the change in the ratio of the composition, the bonding interface of the sapphire substrates is similar to that of the SAB using AlO intermediate layer. Therefore, it is indicated that the bonding interface of AlO by the SAB process is affected by water stress corrosion.

Fig. 4. (Color online) Bond strength of the sapphire wafers measured under the controlled atmospheres for the standard SAB process without intermediate layer.
Download figure:
Standard image High-resolution image3.1. XPS analysis
Figure 5 shows the XPS narrow scan results of O1s peaks of the debonded SiN surfaces with the O2 plasma activation bonding process under the controlled debonding atmospheres. The debonded SiN surface in ambient air shows the peak at the binding energy of 531.46 eV, which is deconvoluted to the peaks at 531.1 eV and 531.9 eV. These peaks are attributed to Si–OH and SiO2, respectively.
22,23) As the water stress corrosion effect is observed for the bond strength of SiN wafer in the ambient air, the Si–OH peak partially corresponds to the broken SiO2 bonds with the water (2 SiO2 + H2O → 2 Si–OH +  O2). The SiO2 peak corresponds to the oxidization of the SiN surface by the physical and chemical adsorption of water on the surface and by the O2 plasma oxidization.
24,25) Therefore, the debonded surfaces are basically covered with SiO2, which indicates that the fracture during debonding occurs in the SiO2 site at the bonding interface.
O2). The SiO2 peak corresponds to the oxidization of the SiN surface by the physical and chemical adsorption of water on the surface and by the O2 plasma oxidization.
24,25) Therefore, the debonded surfaces are basically covered with SiO2, which indicates that the fracture during debonding occurs in the SiO2 site at the bonding interface.
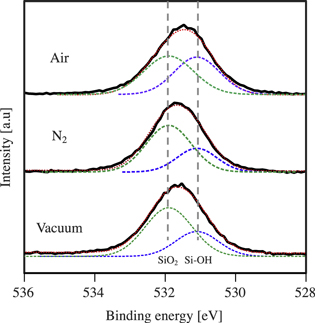
Fig. 5. (Color online) XPS analysis of the O1s peak of the debonded SiN surface for O2 plasma hydrophilic bonding. The results of the debonding in the ambient air, dry N2 gas, and under vacuum are illustrated with the original curve by black line, deconvoluted curves by the dashed lines.
Download figure:
Standard image High-resolution imageFor the debonded surface in the N2 gas, the O1s peak shifts to the higher binding energy, which results in a smaller relative ratio of Si–OH. This is explained by the less water stress corrosion due to the absence of the ambient water, which is also indicated by the bond strength measurement shown in Fig. 3. This also applies to the debonded surface of SiN under vacuum, which shows less ratio of the Si–OH. Given that the water stress corrosion results in a broken SiO2 bonds with the termination of OH groups, the XPS analysis on the debonded surfaces shows that the water stress corrosion effect is the greatest in the ambient air, middle in the dry atmosphere, and the poorest under vacuum. Hence, the water stress corrosion is also suggested by the XPS analysis of the debonded surfaces as well as the bond strength measurement.
The Si2p peaks are shown in Fig. 6 for the N2 plasma activation bonding of SiN. Basically, the Si2p peaks appear at 103.5 eV, which is attributed to the SiO2 bonds. However, in the case of the debonding under vacuum, another surface of the bonded wafer pair shows the lower binding energy. From the results of the deconvolution of the peak, the peaks at 103.5 eV and 101.6 eV are detected (Fig. 6 vacuum opposite side), corresponding to the Si–O bonds and Si–N bonds, respectively. 26,27) Given that the N2 plasma activation does not form SiO2 directly, the SiO2 at the bonding interface is attributed to the physical and chemical adsorption of water by the hydrophilic bonding process. Therefore, it is indicated that the SiO2 layer of the N2 plasma bonding is thinner than that of the O2 plasma bonding. In addition, this result also indicates that the fracture path during debonding changes with the debonding atmosphere. Since the water stress corrosion affects the SiO2 bonds, it is suggested that the fracture occurs at the SiO2 layer in wet and dry atmospheric conditions. However, in the case of the debonding under vacuum, there is less effect of the water stress corrosion, which results in less fracture in the SiO2 layer. Hence, the fracture path changes from the SiO2 layer to the SiN surface.
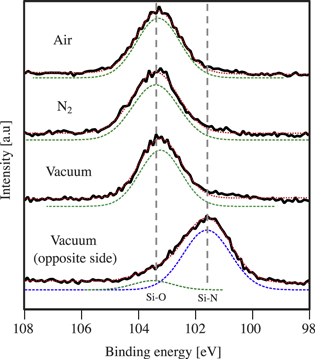
Fig. 6. (Color online) XPS analysis of the Si2p peak of the debonded SiN surface for N2 plasma hydrophilic bonding. The results of the debonding in the ambient air, dry N2 gas, and under vacuum are illustrated with the original curve by black line, deconvoluted curves by the dashed lines. For the results of the debonding under vacuum, the both surfaces of the bonded wafer pair are shown.
Download figure:
Standard image High-resolution imageFigure 7 shows the O1s peaks of the debonded SiN surface with the N2 plasma activation bonding process. Not like the XPS results of the O2 plasma bonding, the debonded surface of the N2 plasma bonding does not show the increased ratio of Si–OH peak with the water stress corrosion effect. The Si–OH ratio is basically small to the SiO2, but the highest under vacuum, middle in N2 atmosphere, and the lowest in the wet atmosphere. Given that the SiO2 layer is thinner than that of the O2 plasma bonding, the amount of SiO2 bonds at the bonding interface is also less than that of O2 plasma bonding. This is also suggested by the results that the bond strength of N2 plasma bonding is lower than that of O2 plasma bonding. Therefore, it is indicated that the effect of the water stress corrosion is not very apparent by XPS analysis compared to the O2 plasma bonding. However, the effect of the debonding atmosphere is observed by the shift of the fracture path under vacuum.

Fig. 7. (Color online) XPS analysis of the O1s peak of the debonded SiN surface for N2 plasma hydrophilic bonding. The results of the debonding in the ambient air, dry N2 gas, and under vacuum are illustrated with the original curve by black line, deconvoluted curves by the dashed lines.
Download figure:
Standard image High-resolution imageIn order to investigate the water stress corrosion effect on the AlO bonds, the debonded surface of the glass using the AlO SAB process is analyzed by XPS, whose results are shown in Fig. 8. The original curve is deconvoluted to the peaks at 74.4 eV and 75.6 eV, which corresponds to Al–O and Al–OH, respectively. 28,29) The peak ratio of the Al–OH is higher for the debonding in air than in N2 and vacuum. Since the AlO is affected by the water stress corrosion, 30) the Al–O bonds at the bonding interface are broken with hydrolysis. For the debonding in the air, Al–O bonds are broken with the termination of OH groups in the same manner as the water stress corrosion of SiO2 bonds. Therefore, the water stress corrosion of AlO, which is suggested by the bond strength measurement, is also supported by the XPS analysis of the debonded surfaces.

Fig. 8. (Color online) XPS analysis of the Al2p peak of the debonded glass surface for SAB using AlO intermediate layer. The results of the debonding in the ambient air, dry N2 gas, and under vacuum are illustrated with the original curve by black line, deconvoluted curves by the dashed lines.
Download figure:
Standard image High-resolution image4. Discussion
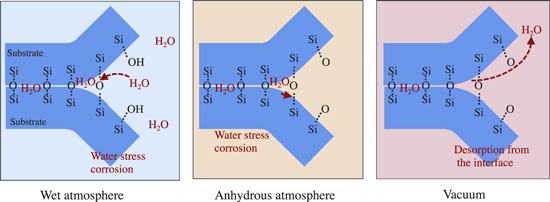
In the case of the hydrophilic bonding, the water stress corrosion is observed for the glass and SiN wafer bonding. Comparing the bond strength in the wet atmosphere and dry atmosphere, it is indicated that the Si–O–Si bonds at the bonding interface are attacked by ambient water in the measurement atmosphere, as illustrated in Fig. 9. This is why the bond strength in the ambient air is measured the lowest. In addition to the water stress corrosion by the ambient water, it is also indicated the bond strength is affected by the interfacial residual water by comparing the measurement in the dry atmosphere and vacuum. In the case of the measurement under vacuum, the interfacial water is partially desorbed as the crack propagates. Therefore, the effect of the water stress corrosion is the least in vacuum, resulting in the highest bond strength.
Fig. 9. (Color online) Schematic of the water stress corrosion at the hydrophilic bonding interface during debonding under the controlled atmospheres.
Download figure:
Standard image High-resolution image
This is also supported by the XPS analysis of the debonded surfaces, at least for the O2 plasma activation bonding. The peak ratio of Si–OH, that corresponds to the breakage of SiO2 by water stress corrosion, is measured in descending order for the debonding in air, in N2 gas, and vacuum. Therefore, XPS analysis also suggests the effect of the water stress corrosion, which agrees with the bond strength measurement.
In the case of the SAB using Si intermediate layer, the bond strength is not affected by the water stress corrosion for all the measurement atmospheres. As mentioned above, there is basically no interfacial water at the bonding interface of the SAB with Si intermediate layer. Furthermore, the Si–Si bonds are dominant at the bonding interface and are not affected by the water stress corrosion directly. Therefore, despite the measurement atmosphere, the bond strength is measured equally to all the conditions.
For the SAB using AlO intermediate layer, the water stress corrosion is only observed in the ambient air. In the same manner as the SAB using Si intermediate layer, there is no interfacial water at the bonding interface of the AlO intermediate layer. However, the AlO bonds at the bonding interface is affected by the water stress corrosion, in this case, of the ambient air. It is known that the Al2O3 has high durability for the corrosion, but also the stress corrosion cracking and static fatigue effect were reported in the environment containing water. 31,32) Furthermore, it has also been reported that the amorphous AlO has lower durability for water corrosion. 30) Therefore, the bond strength of the SAB using AlO intermediate layer is measured the lowest in the ambient air. This is also supported by the results of the sapphire bonding by the standard SAB process shown in Fig. 4, which has been reported to form an amorphous Al2O3 interface. 33)
In addition, the water stress corrosion of AlO is also indicated by the XPS analysis of the debonded AlO interface. As the peak ratio of Al–OH is measured higher for the debonding in air, the breakage of Al–O bonds and termination with OH groups are suggested.
According to the experimental results, the proposed measurement method in this study evaluates the effect of the water stress corrosion of the ambient water and interfacial water separately. When the bonding interface consists of corrodible bonds such as SiO2 and AlO, the bond strength is measured lower in the wet atmosphere than in the dry atmosphere. Moreover, when the bonding interface contains interfacial water such as the low temperature hydrophilic bonding, the bond strength is measured higher under vacuum than in the dry atmosphere, as summarized in Table I. This means that the water stress corrosion effects of the ambient water and the interfacial water are evaluated separately by comparing the bond strength in the wet atmosphere, dry atmosphere, and vacuum.
Table I. Summary of the bonding process and the effect of the water stress corrosion.
| Bonding process | Interfacial water | Durability for corrosion | Bond strength |
|---|---|---|---|
| Hydrophilic bonding | Trapped water | Low (SiO2) | In wet air < dry air < vacuum |
| SAB using Si intermediate layer | No water | High (Si–Si) | In wet air = dry air = vacuum |
| SAB using AlO intermediate layer | No water | Low (AlO) | In wet air < dry air=vacuum |
This is not only for the evaluation of the durability of the bonding interface for corrosion but also for the development of the wafer bonding process. One of the important criteria for the low temperature wafer bonding is the control of the interfacial water. When the adsorbed water at the bonding interface is too less, the bond strength is low due to the less formation of SiO2 bonds at the bonding interface. When the adsorbed water is too much, the interfacial water is trapped at the bonding interface and appears as the interfacial voids or defects. Therefore, it is important to optimize the amount of the adsorbed water at the bonding interface to form sufficient SiO2 bonds and completely consume H2O by the polymerization reaction by the post-bonding annealing.
Since the developed measurement method in this study evaluates the water stress corrosion of the interfacial water, it is indicated that too much interfacial water can be detected as deference of the bond strength between in dry atmosphere and vacuum. Therefore, this measurement method will contribute to the process development to optimize the adsorbed water by detecting too much interfacial water.
5. Conclusion
In this study, we developed a novel methodology to evaluate the water stress corrosion of the ambient water and the interfacial water separately by measuring the bond strength under the controlled atmospheres. The water stress corrosions of the ambient water and the interfacial water are detected by comparing bond strengths in wet air to dry air, and dry air to vacuum, respectively, as also indicated by the XPS analysis. For hydrophilic bonding, the bond strength is the lowest in wet air, middle in dry air, and the highest under vacuum, indicating the low corrosion durability of the bonding interface and the existence of the interfacial water. In the case of the SAB using AlO intermediate layer, the water stress corrosion is observed only for the ambient water, indicating the low durability of AlO for corrosion and the absence of interfacial water. In the meantime, the SAB using Si intermediate layer shows no water stress corrosion, showing the high corrosion durability of Si–Si bonds at the bonding interface. The developed method will provide a new understanding of the bonding interface corresponding to the bonding method, especially related to the water stress corrosion by the interfacial water.
Acknowledgments
Authors would like to thank LanTechnical Service Co. Ltd. (Japan) and Bondtech Co. Ltd. for the bonding experiment cooperation. This work is partially supported by the Precise Measurement Technology Promotion Foundation (PMTP-F) and the Amada foundation, Japan.