
Power to Hydrogen and Power to Water Using Wind Energy


Department of Water Resources and Environmental Engineering, School of Civil Engineering, National Technical University of Athens, 157 80 Athens, Greece
*
Author to whom correspondence should be addressed.
Wind 2022, 2(2), 305-324; https://doi.org/10.3390/wind2020017
Submission received: 29 March 2022
/
Revised: 5 May 2022
/
Accepted: 10 May 2022
/
Published: 13 May 2022
(This article belongs to the Special Issue Challenges and Perspectives of Wind Energy Technology)
Abstract
:The need for energy and water security on islands has led to an increase in the use of wind power. However, the intermittent nature of wind generation means it needs to be coupled with a storage system. Motivated by this, two different models of surplus energy storage systems are investigated in this paper. In both models, renewable wind energy is provided by a wind farm. In the first model, a pumped hydro storage system (PHS) is used for surplus energy storage, while in the second scenario, a hybrid pumped hydrogen storage system (HPHS) is applied, consisting of a PHS and a hydrogen storage system. The goal of this study is to compare the single and the hybrid storage system to fulfill the energy requirements of the island’s electricity load and desalination demands for domestic and irrigation water. The cost of energy (COE) is 0.287 EUR/kWh for PHS and 0.360 EUR/kWh for HPHS, while the loss of load probability (LOLP) is 22.65% for PHS and 19.47% for HPHS. Sensitivity analysis shows that wind speed is the key parameter that most affects COE, cost of water (COW) and LOLP indices, while temperature affects the results the least.
1. Introduction
Climate change brings the world face to face with the need for carbon-free technologies, such as renewable energy sources (RESs), to meet their need for electricity [1]. The use of wind turbines is one of the most attractive RESs to meet the load demand in remote areas, not only due to their reduced initial costs but also for the wide range of industrial and residential systems to which they can be applied [2]. Moreover, wind turbines require limited land cover, compared to solar panels, and cause less landscape transformation than hydroelectric energy [3]. Wind energy is an energy source with a decreasing levelized cost of energy (LCOE) trend [4] and its global energy generation capacity has reached 650.8 GW as of 2019 [5], a number expected to rise to 1000 GW by the year 2030 [6]. According to Greece’s National Energy and Climate Plan, Greece should reach 7 GW of installed wind farm capacity by 2030, compared to 3.6 GW in 2020, to meet its environmental targets [7]. However, increasing the proportion of RESs in the power mix creates new challenges for renewable energy production and demand. As far as wind energy is concerned, the intermittent nature of wind potential, due to its dependence on different climate conditions, makes the forecasting of wind energy very difficult [8] and creates the need to use of wind turbines not individually but as a part of a hybrid renewable energy system (HRES). HRESs use at least one form of RES and at least one form of energy storage technology for the excess energy that cannot be used immediately.
Pumped hydro storage (PHS) is an environmentally friendly storage method and can be used in areas where topography and water availability parameters permit. About 96% of the total energy storage installed capacity (160 GW) is through PHS systems [9]. Numerous studies have been published with PHS as a storage solution. A comparative review of HRESs integrated with PHS storage systems based on techno-economic and environmental analysis was presented in [10]. In [11], a standalone hybrid wind turbine (WT)/photovoltaic (PV)/biomass/PHS system was designed for the satisfaction of load demand, focusing on the minimization of the cost of energy. Eisapour et al. [12] carried out a feasibility study of an HRES with PHS for storing the excess energy to meet the load demand of Eram Campus, Shiraz University, Iran. In [13], a PV/WT/PHS energy system was optimized for the techno-economic viability of the project and the supply of electricity at a significantly low cost. The optimization of an HRES consisting of PVs, WTs and a PHS was presented in [14]. As long as the installation of a PHS is permitted by the topography and wind speeds and solar radiation are high, the results show a promising solution for the electrification of a city in Libya, with a minimum value of LCOE of 0.130 EUR/kWh.
In recent years, increasing attention has been given to the investigation of hydrogen as a storage option in HRESs. Hydrogen can be produced locally, increasing the independence of the energy supply [15]. In contrast to pumped storage systems, much less space is needed for the installation of the hydrogen production unit, and no specific topographic parameters are necessary. Hydrogen is considered a zero-emission fuel; however, when its production is powered by conventional fuels a large amount of CO2 is generated, which means hydrogen is not an environmentally friendly solution [16]. The exploitation of RES for water electrolysis leads to the decarbonization of hydrogen, producing green hydrogen [17]. Surplus energy from RESs can be utilized for the production and storage of green hydrogen for use when RES production is less than the load demand [18]. Hinokuma et al. [19] investigated the optimal configuration of a PV/WT/hydrogen system to supply the annual load of the Chikushi campus in Japan based on the net present value (NPV) and the LCOE. The operation of a PV/hydrogen system was examined in [20] by analyzing the demand over 10 years and considering the degradation of the components in the total performance of the system. In [21], a wind energy assessment in Afghanistan was investigated in all capital cities, considering three scenarios and five degradation rates, and a techno-economic analysis was conducted for a WT/hydrogen system to the city with minimum LCOE. Makhdoomi et al. [22] presented the optimal size of two hybrid systems consisting of PVs and two different storage technologies, PHS and hydrogen, with three PV tracking systems and based their results on NPV and loss of power supply probability. In [23], a techno-economic analysis of a PV/hydrogen system was conducted. The system was designed to meet the electric load of a residential community by focusing on the increase in RES penetration, the reduction in greenhouse gas emissions and the minimization of the cost of energy. The levelized cost of energy was estimated at 0.14EUR/kWh. Sultan et al. [24] focused on the optimal design of a grid-dependent and an off-grid HRES, consisting of three different configurations PV/FC, WT/FC and PV/WT/FC. Five different optimization algorithms were compared and the results on COE show a minimum value of 0.370 EUR/kWh for the PV/FC model in the integrated system and 0.420 EUR/kWh for the PV/WT/FC model in the isolated system.
During the operation of an HRES with a single storage system, produced renewable energy that cannot be exploited simultaneously can be stored, subject to available storage capacity and the rated power of other components, otherwise it ends up in a dump. In [25], a methodological framework for the calculation of this rejected energy in a WT/PHS system is proposed, based on the percentage of direct contribution of wind energy to the system and the percentage of energy set for desalination versus pumping. With hybrid storage, excess energy can be further exploited. Many studies on hybrid storage systems have been published. In [26], a battery/flywheel hybrid system is presented to investigate delaying the aging of the batteries. The results showed that battery life can be increased more than 20%. Javed et al. [27] simulated a domestic PV/battery/supercapacitor hybrid system for Sultanpur, India, and a fuzzy logic control strategy was implemented to control the power flow of the battery and supercapacitor, resulting in enhancement of the battery life span and reduction in maintenance costs of the system. Size optimization for a WT/PV/battery/hydrogen hybrid system was performed in [28], based on the minimization of LCOE or CO2 emissions. Ferrario et al. [29] assess the optimal sizing of a WT/PV/battery/hydrogen system, simulating four different energy storage configurations for supplying a residential load in Spain. In [30], an optimal sizing strategy for a hybrid PV/battery/hydrogen system is proposed by minimizing the life cycle cost of the installed components. In [31], the optimum design size for a wind–hydro–battery hybrid energy system is presented for meeting the load demand of Yesser valley, in Algeria. Homer Pro software is used in order to perform the economic analysis and present the total costs based on different water flows and different wind speeds. Canales et al. [32] present a mathematical model for the size optimization of a WT/PV/PHS/battery system for the evaluation of the effect of Cost of Energy (COE) on optimal sizing by the capital cost and the loss of power supply probability (LPSP). The case study is Ometepe Island in Nicaragua where an existing upper reservoir of a crater lake of a volcano reduces the capital cost. The COE ranges between 0.047 EUR/kWh and 0.095 EUR/kWh based on sensitivity analysis for different initial costs and LPSP. In [33], a techno-economic analysis of a PV/hydro/hydrogen/battery system is conducted and COE is estimated at 0.240 EUR/kWh. In [34], an HRES exploiting solar and wind energy with the combination of battery and hydrogen fuel cells is introduced. The optimal configuration is investigated, which results in COE of about 0.660 EUR/kWh. In [35], three different configurations of HRES are examined for a hypothetical remote community in Western Australia. PV is the primary RES, while the storage system is a battery for the first case, hydrogen for the second and a combination of them both for the third. The results of COE are 0.370 EUR/kWh, 0.450 EUR/kWh and 0.320 EUR/kWh, respectively, making the hybrid storage the most cost-effective solution.
The Greek islands face the consequences of power supply dependency, as well as water scarcity, while transport connectivity with the mainland is limited [36]. Additionally, the transportation of potable water to the islands from the mainland costs about 8.2 EUR/m3 as of 2019 [37]. At the same time, they are surrounded by inexhaustible quantities of seawater. The installation of an HRES can provide the required energy for meeting both needs by coupling a desalination unit. This also gives the opportunity to increase RES penetration in the global energy scenario. A water electrolysis system is investigated in [38], where WTs and PVs are used for seawater desalination and hydrogen production in Iran. In the last two decades, desalination plants based on membrane technologies have been installed and now represent about 70% of the total plants. Nowadays, reverse osmosis (RO) desalination, a membrane-based technology, represents 63% of the desalination industry [39]. Additionally, RO plants have approximately 25% less capital cost than thermal-based desalination technologies [40]. Energy requirements for RO desalination range between 3.7 and 8 kWh/m3 [41]. In hydrogen production, desalination plants can be used to provide desalinated water for electrolysis in order to generate green hydrogen from renewable sources. Additionally, in addition to domestic water, the demand for desalinated irrigation water is predicted to meet the irrigation needs of the area. A methodology for energy, domestic and irrigation purposes on the Greek islands is proposed in [42] by implementing a wind/PHS hybrid renewable system. In [43], a sizing methodology is presented in Bulgaria for a hybrid system coupled with WT, PV and a water tank storage, and the introduction of a battery is examined. Combinations of PVs, WTs and water tank capacities are examined, based on the investment cost, the crop requirements, the wasted energy and a ratio between the first two criteria. In [44], optimization of a PV-RO system is conducted using a seasonal water storage tank for the storage of water instead of storage of energy, resulting in 2.46 EUR/m3 of desalinated water. In [45], a PV/WT/diesel generator/battery HRES is optimized in order to supply electricity and fresh water to a non-connected island to the national grid in Bangladesh. A hybrid optimization algorithm based on genetic and particle swarm optimization provides the optimum system with a COE of 0.22 EUR/kWh.
Under the abovementioned framework, the main aim of the present study relies on the assessment of an HRES, using wind turbines for renewable energy production and the comparison of the results for coupling with either a single storage system of PHS or a hybrid storage system, consisting of an HPHS for the storage of the surplus energy. Our literature review examined, for the first time, hybrid storage that combines PHS with a hydrogen storage system. This was evaluated and the results are extracted for comparison. Additionally, using a hydrogen storage system to fulfill both electricity and desalination demands has not yet been investigated. Therefore, this research gap is addressed in this work. The contribution of this study is summarized in the comparison between a single and a hybrid storage system, the PHS and the HPHS, for the simultaneous satisfaction of energy demands for electric loads and domestic and irrigation water desalination on a Greek island using wind energy. Two energy management strategies are introduced for single and hybrid storage. In the hybrid storage, priority is given to PHS and using hydrogen as a supplementary storage option for unexploited energy that cannot be absorbed through the single storage operation. This research paper investigates the COE, the Cost of Water (COW) and the Loss of Load Probability (LOLP) of the two storage systems, the single and the hybrid. Additionally, a sensitivity analysis is conducted in order to examine how the results are affected by variations in the installation height of certain components, variations in the meteorological data and variations in the demand data. Furthermore, the paper depicts a reliability analysis for both storage technologies and for each one of the demands, electricity, domestic and irrigation water, as well as for the entire HRES. Additionally, the paper demonstrates the share of energy of each component of the HRES for the fulfillment of each demand on a monthly and hourly basis. Finally, the paper presents the state of charge of both the upper reservoir and the hydrogen tank.
2. Materials and Methods
2.1. Case Study
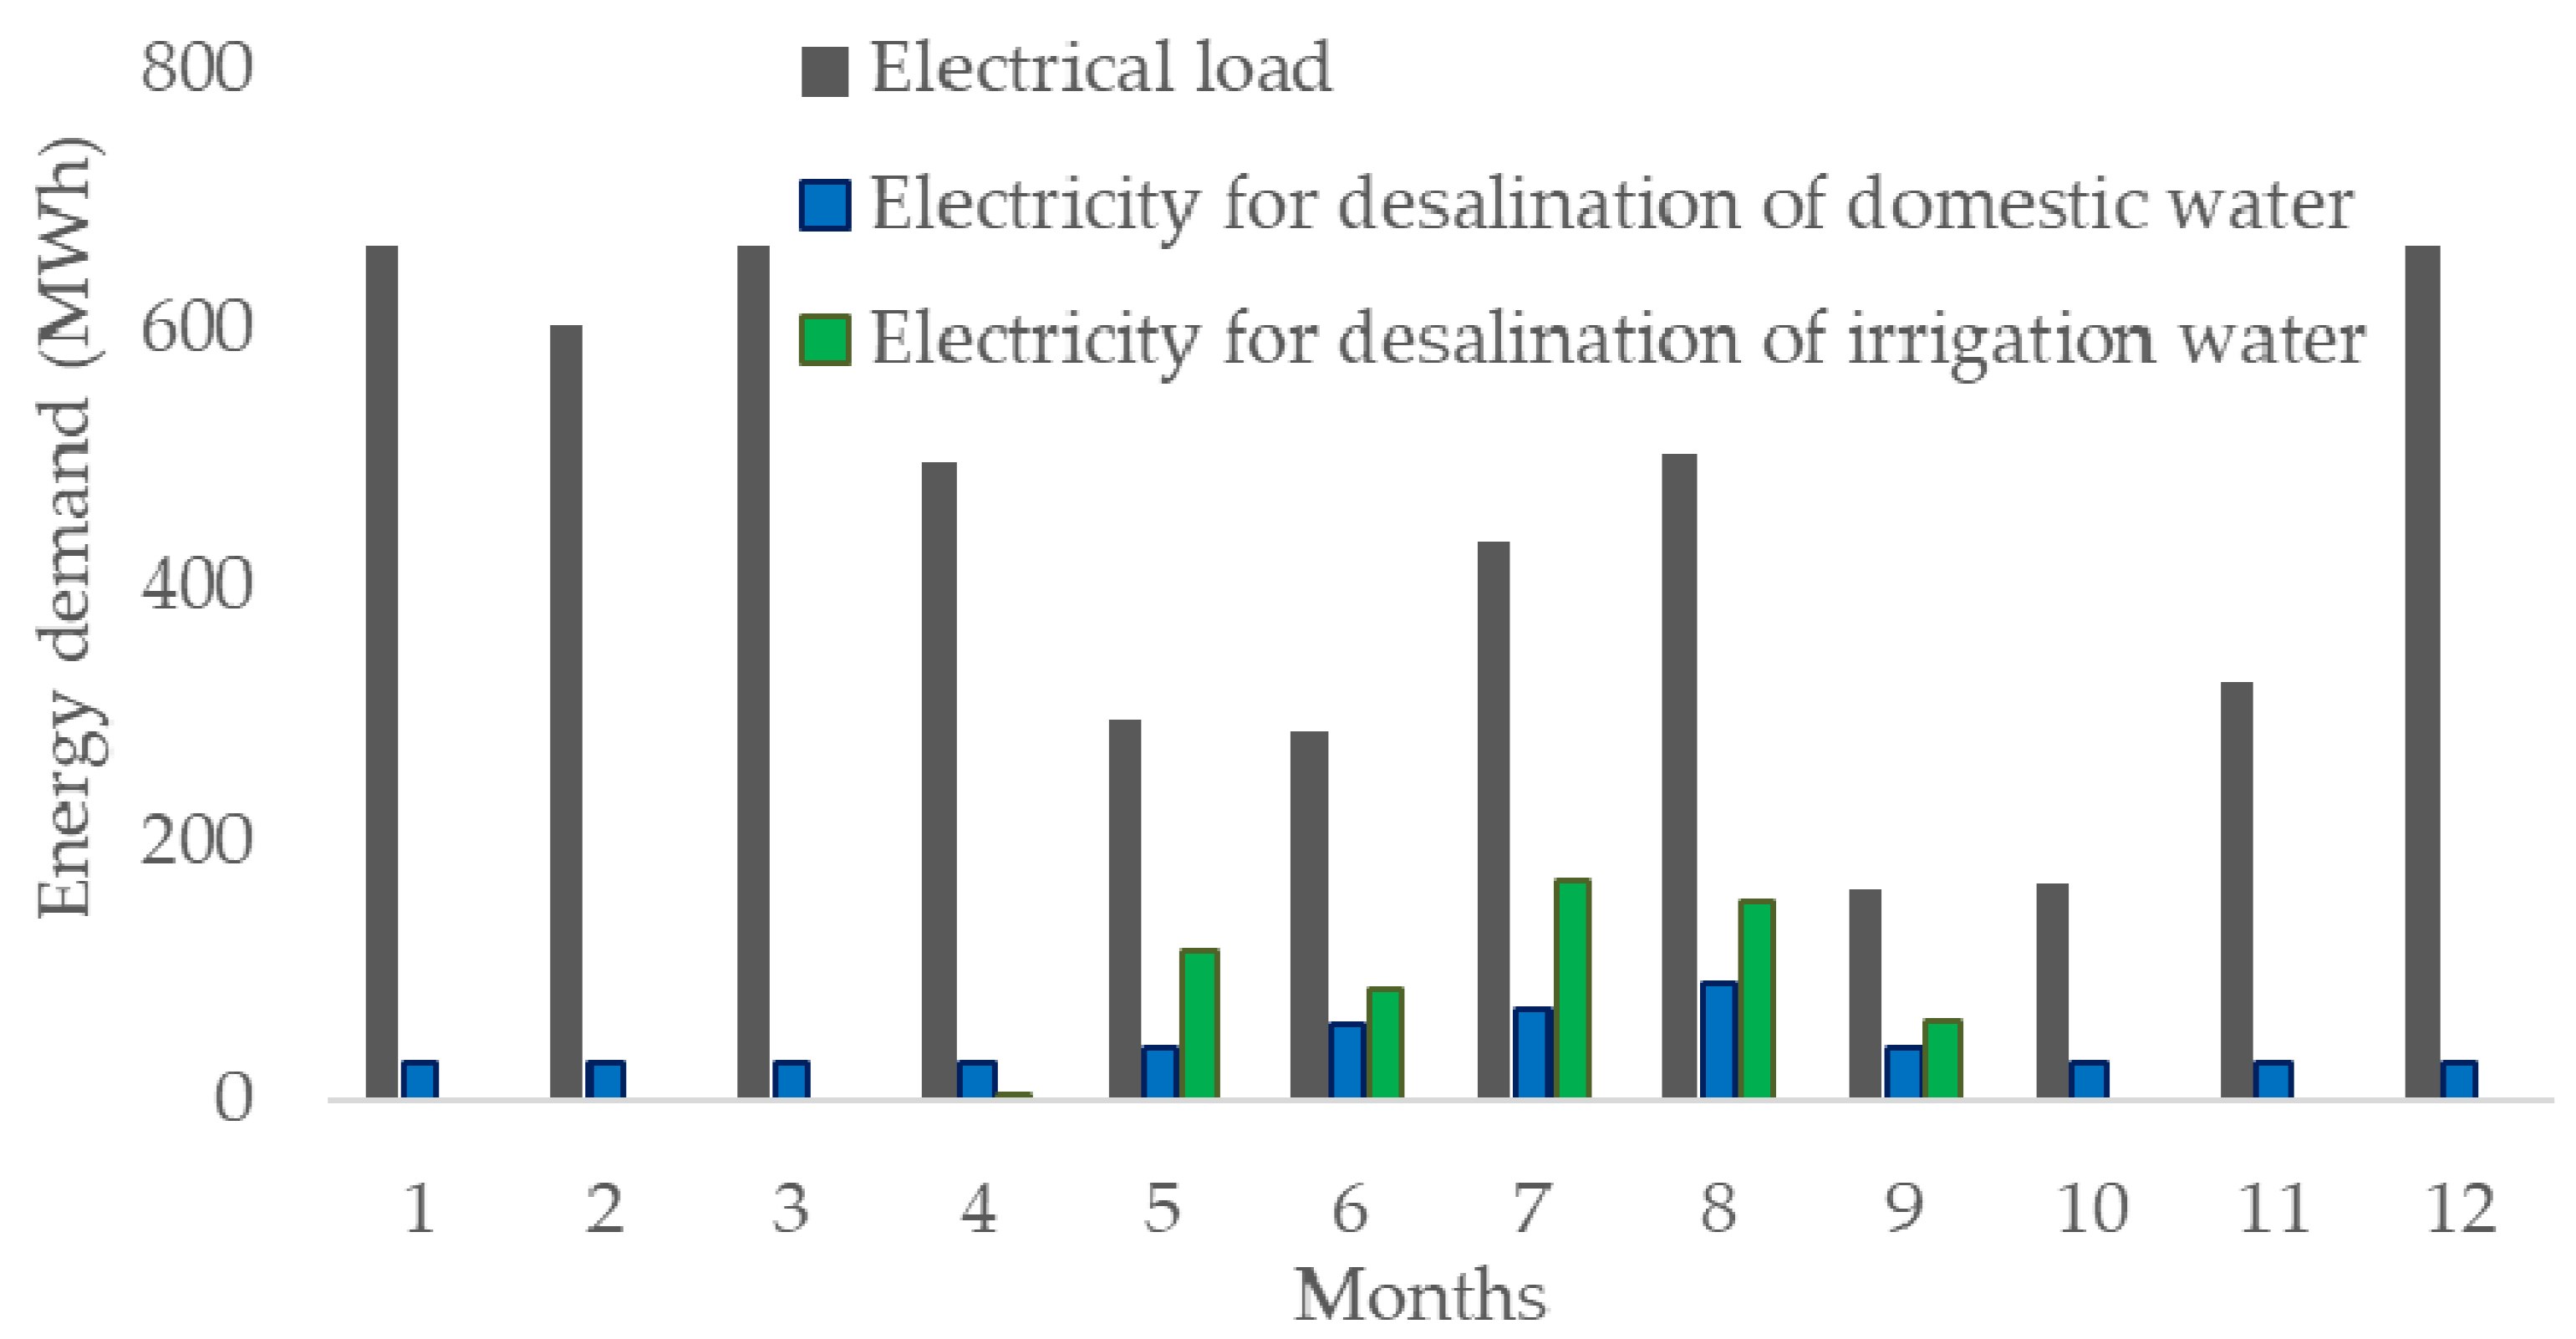
The selected case study for the application of the methodology is Fournoi Korseon, in the Northern Aegean Sea, in Greece. It is an island with 1400 permanent residents, a population that almost triples during the summer months. The wind directions are mainly westerly and northerly, the average annual wind speed is 8 m/s and values over 20 m/s rarely occur, although the high wind potential has not yet been exploited and no wind turbines are installed on the island. However, for its electricity loads, it depends on the submarine connection with the nearby island of Samos, creating problems with the supply of electricity. Additionally, the island is not supplied with drinking water, forcing residents to resort to cost-effective and not environmentally friendly bottled water. As for the irrigation needs, the solution has been found in private wells, thus to low water levels of the aquifer level. Data for electricity load are collected upon request from the Public Power Corporation (PPC) and data for domestic water quantities are selected through personal communication with the Technical Service of the municipality of the island. Data on crop species from the Hellenic Statistical Authority were used and the Blaney–Criddle [46] method was used to estimate the evapotranspiration for all crop species to determine the irrigation water needs of the island. Energy consumption for reverse osmosis desalination is assumed equal to 5.85 kWh/m3 [41]. Wind speed, temperature and precipitation data are collected from the weather station of Fournoi Korseon from the National Observatory of Athens [47]. Figure 1 shows the monthly energy requirements per consumption category, i.e., electric load, energy for desalination of domestic water and energy for desalination of irrigation water. Maximum demand for electricity is observed during the winter months, while maximum demand for domestic and irrigation water is observed in August and July, respectively.
2.2. Energy Management Strategies
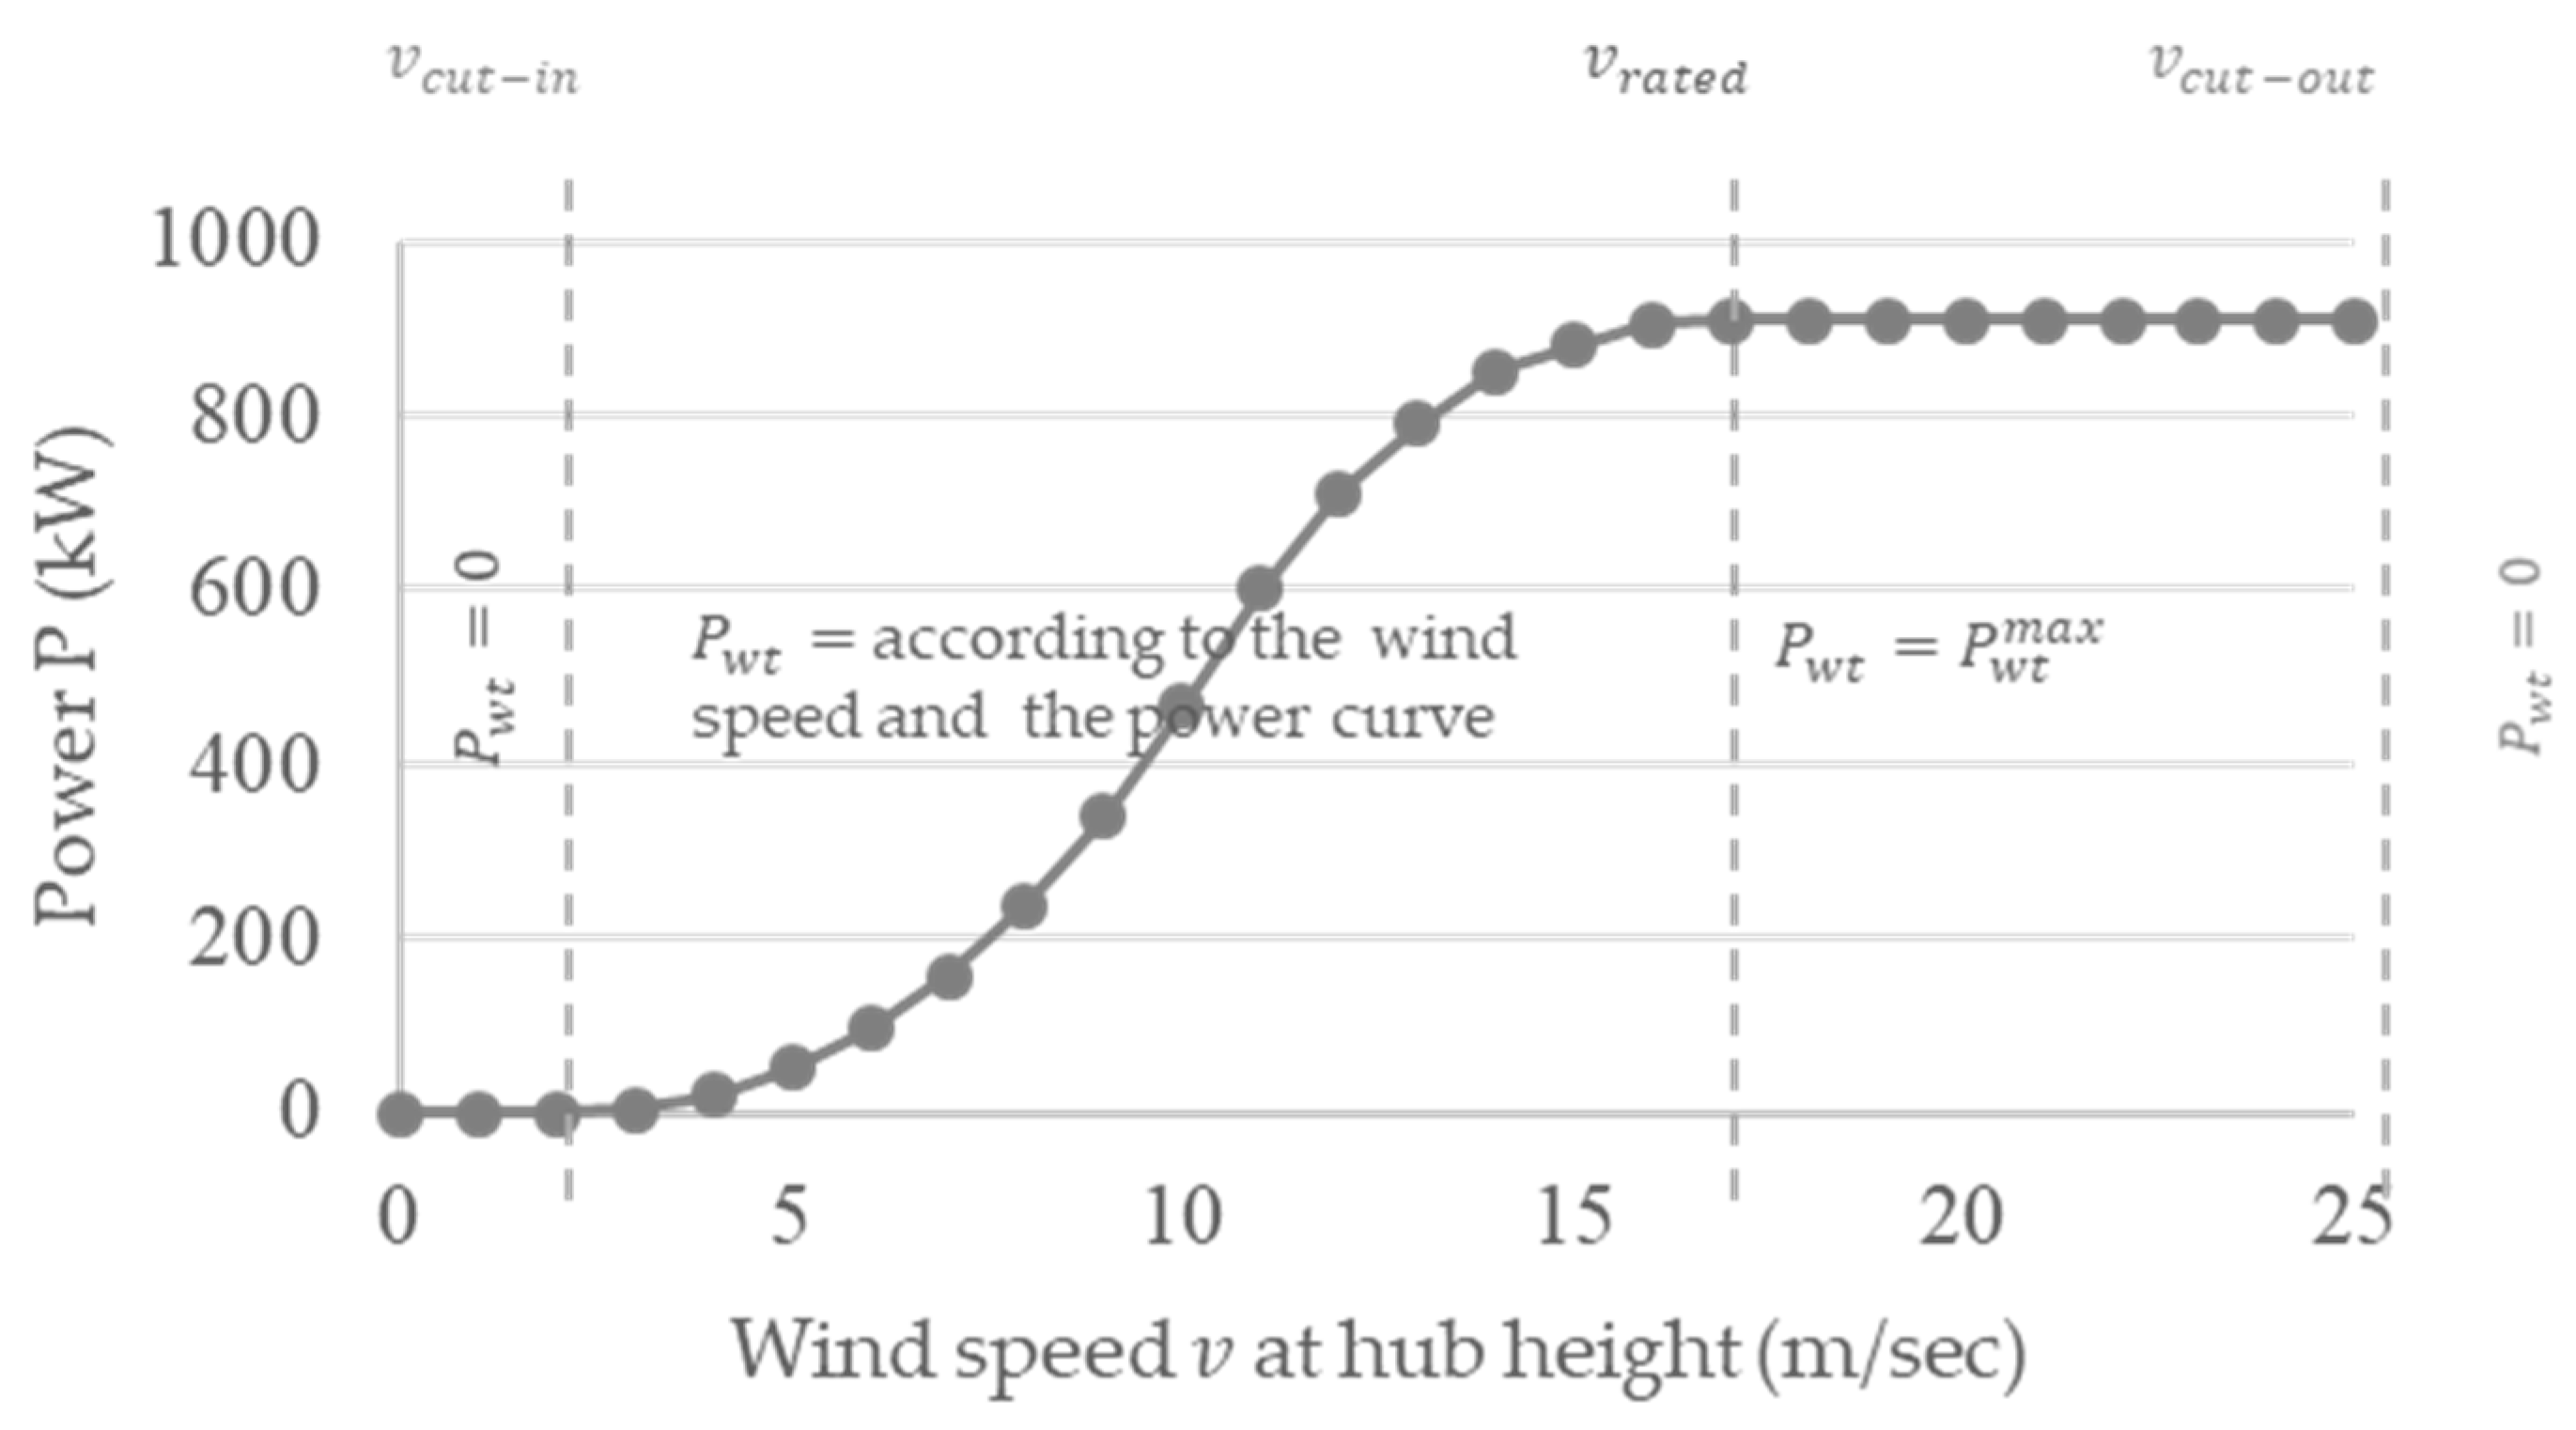
An Enercon E-44 (900 kW) wind turbine is used for the simulation and the power curve of this model is depicted in Figure 2. The power coefficient of this model ranges from 0.00 to 0.50, depending on the prevailing wind speed at the hub height, and is given by the manufacturer [48]. Τhe exploitable power of the wind turbine depends on its nominal power and on wind speed . The value in which the operation of the WT begins is the starting speed and it is 2 m/s for this model. The value in which the rated power of the machine is firstly achieved is the rated speed and here is equal to 17 m/s. Safety reasons require shutdown of the WT at very high speeds over , which in this model is equal to 25 m/s. For the power output is equal to zero. For the power output has its maximum value equal to 900 kW and for the power output is calculated according to the power curve. The 5th degree polynomial trendline obtained by the power curve for the estimation of power output (y) based on wind speed (x) is given by the following equation with an R-squared value higher than 0.99.
Wind turbine sitting is performed on the basis of the exploitation of high wind potential and considering the proximity to the main settlement of Fournoi, according to [49], minimizing the energy losses due to transmission cables. The hub height of the installed turbines is at , while data of wind speed in the weather station are measured at height . For the estimation of at hub height, the following formula is used [50], where is the roughness length parameter depending on the ground surface of the land on which wind turbines are installed.
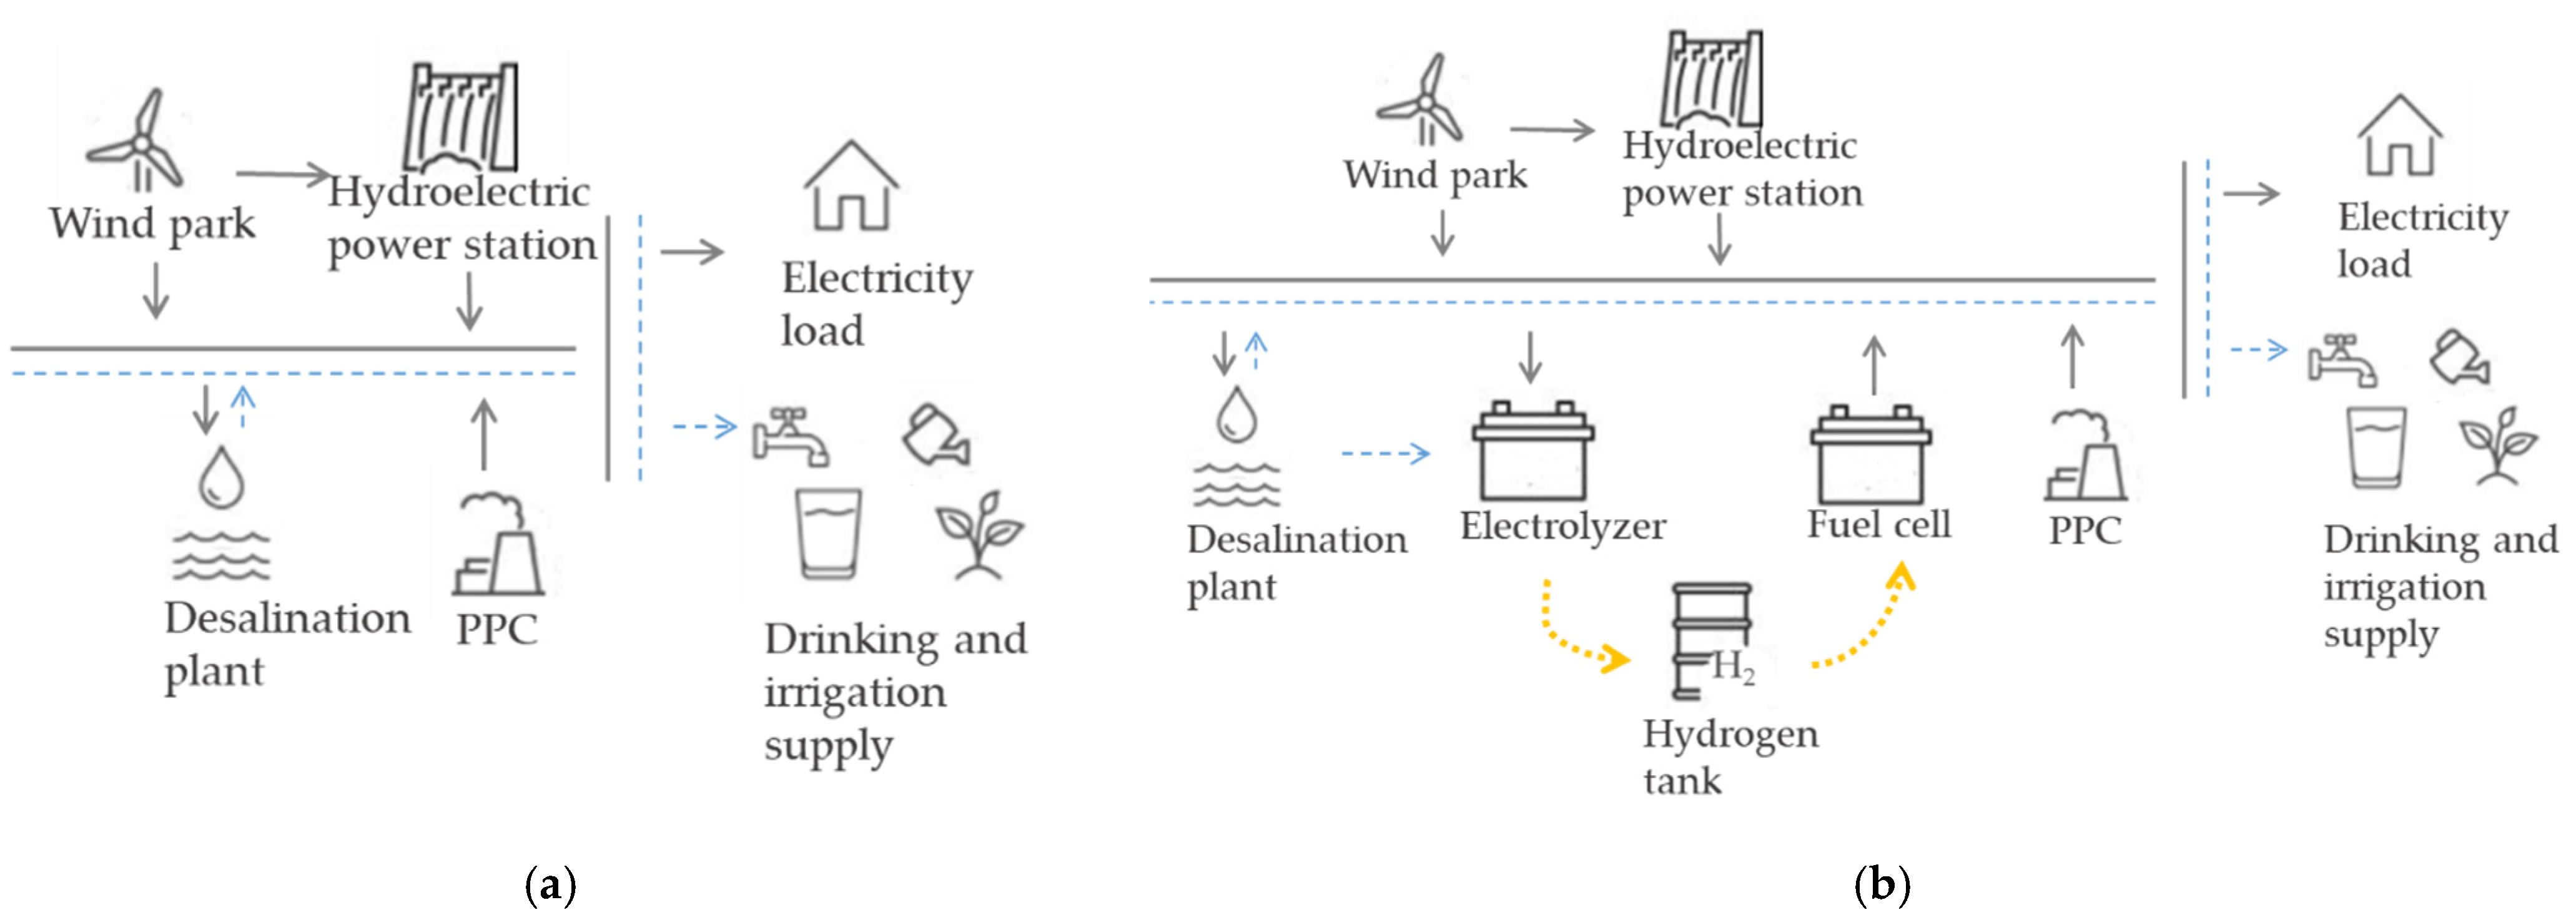
Figure 3 depicts the two different HRES depending on the storage technology. Figure 3a shows the HRES with the single PHS storage, while (b) shows the HRES with the HPHS. The grey solid line depicts the energy circulation, while the blue dashes represent the desalinated water supply. The yellow dot line illustrates the hydrogen circulation.
In both proposed HRES, priority is given to domestic water. It is checked whether the produced wind energy is sufficient to meet the electrical needs for desalination for the required quantity of domestic water for the corresponding step. The same procedure is then performed for the remaining energy concerning the desalination of irrigation water and finally for the electric load. The time step of the simulation is hourly to ensure the maximum reliability of the results.
For the first HRES, coupled with PHS, if there is surplus energy after meeting the three different demands, it is used for pumping of water to the upper reservoir. Otherwise, the hydro turbine comes into operation for the production of the deficit energy. Τhe order of coverage is still the same with priority in the desalination of domestic water then the irrigation water and, in the end, the electric load. The volume of water V () pumped and stored through the operation of the pumping system is given by [51]:
where is the density of the water (kg/m3), is the gravity acceleration (m/s2), the net head (m), the pumping station efficiency, which is equal to 78% for this study and is the energy surplus (kWh). Τhe operation of the pumps depends on the surplus energy and if the surplus is not enough to start the pumping system, no water is stored in the upper reservoir. The energy produced by the hydro turbine is estimated by [51]:
where the hydro turbine efficiency and it is equal to 90% [42]. The upper reservoir is assumed to be half full at the start of the simulation. The upper reservoir is subject to some restrictions regarding the upper and lower limit and the pumping and releasing operation of the pumps and the hydro turbine, respectively. Specifically:
where and is the minimum and maximum storage capacity of the reservoir, respectively, while is the total capacity of the upper reservoir.
For the second HRES, coupling with HPHS, the operation is slightly different. The surplus energy is still used for pumping water to the upper reservoir according to Equation (2). However, in this case, there is a hydrogen storage system as a supplementary system to the whole HRES. The energy that cannot be stored in the upper reservoir because either the upper reservoir is full or there is not enough energy for the pumps to work is stored in the form of hydrogen in the hydrogen tank. This unexploited energy is estimated according to the methodology of [25]. The electrolyzer converts this energy into hydrogen by electrolysis of desalinated water. This means that with the surplus energy, it must be ensured that there is the required energy for both the desalination of the water used for electrolysis and for the production of hydrogen. Specifically, for 1 kg of hydrogen produced, 9 kg of desalinated water is required [52,53]. Water electrolysis using electricity generated from RES, in this particular case wind and hydro energy, produces green hydrogen. The heating value of the hydrogen in standard conditions is 3.4 kWh/m3, while its density is 0.09 kg/m3, so the energy output of 1 kg of hydrogen is 37.8 kWh [54]. The amount of produced hydrogen (in kg) by the electrolyzer can be expressed as follows [54]:
where is the energy surplus (kWh) and is the electrolyzer efficiency and it is equal to 74% [54]. When the demand is covered, neither by the wind turbines nor by the hydro energy, the stored hydrogen is converted into energy through the fuel cell and is given to the network. Energy, in kWh, that can be produced by 1 kg of hydrogen can be expressed by [54]:
where is the required amount of hydrogen to be consumed to the fuel cell (kg) and is the fuel cell efficiency and equal to 50% [54]. Fuel cells are sorted by their operating temperature, and they are classified according to the electrolyte they employ [55]. The type of fuel cell selected in this study is the proton exchange membrane fuel cell (PEMFC), due to its maturity, fast response to varying loads and shorter start-up [35,56].
The hydrogen tank is also subject to some restrictions regarding the upper and lower limit while the electrolyzer and the fuel cell are operating. Specifically:
where and is the minimum and maximum storage capacity of the hydrogen tank, respectively, while is the total capacity of the tank. The hydrogen tank is assumed to be up to level at the start of the simulation.
The volume of the storage reservoirs (water and hydrogen) is based on the required days of autonomy, two in this study [57], meaning the days the system can provide the required energy, supposing that low wind speeds, below 2 m/s, prevail in the area and no wind energy can be generated by the wind turbines. The same applies to the determination of the rated power of the hydro turbine. It must be guaranteed that is able to cover the maximum load in case of low wind speeds. Τhe nominal power of the pumping system is estimated according to [58]. For the electrolyzer, it is assumed that is able to convert into hydrogen, while the fuel cell should be able to cover the electrical load that is not covered by wind or hydro energy [20]. Load demand that is not covered by the wind turbines, nor the hydro turbine, nor the fuel cell, is covered by the grid, meaning the startup of the local power station.
2.3. Techno-Economic Analysis
For the assessment of the HRES Cost of Energy (COE), Cost of Water (COW) and Loss of Load Probability (LOLP) are estimated. COE (EUR/kWh) is estimated by [53,59]:
where is the initial investment cost of the whole HRES (EUR), is the operation and maintenance cost of each component (EUR), is the replacement cost during the lifetime of the project (EUR), is the salvage cost, which is the value of each component of the HRES at the end of the project lifetime (EUR) and is the produced energy from the HRES (kWh). Salvage cost is estimated separately for each component by the following equation:
where is the lifetime of each component and is the lifetime of the HRES. COW (EUR/m3) is estimated by:
where is the energy required for the desalination of seawater (kWh/m3). In Table 1 the economic parameters used in this study are presented.
LOLP (%) evaluates the reliability of the HRES and is estimated by [59]:
where is the uncovered demand, the annual load demand and is the number of hours during one year of simulations. Four different LOLP are calculated, concerning the energy demand for desalination of domestic water, LOLPd, the energy demand for desalination of irrigation water, LOLPir, the energy demand for the electric load, LOLPel and the total energy demand for the three demands, LOLPhres,
3. Results & Discussion
3.1. HRES Assessment
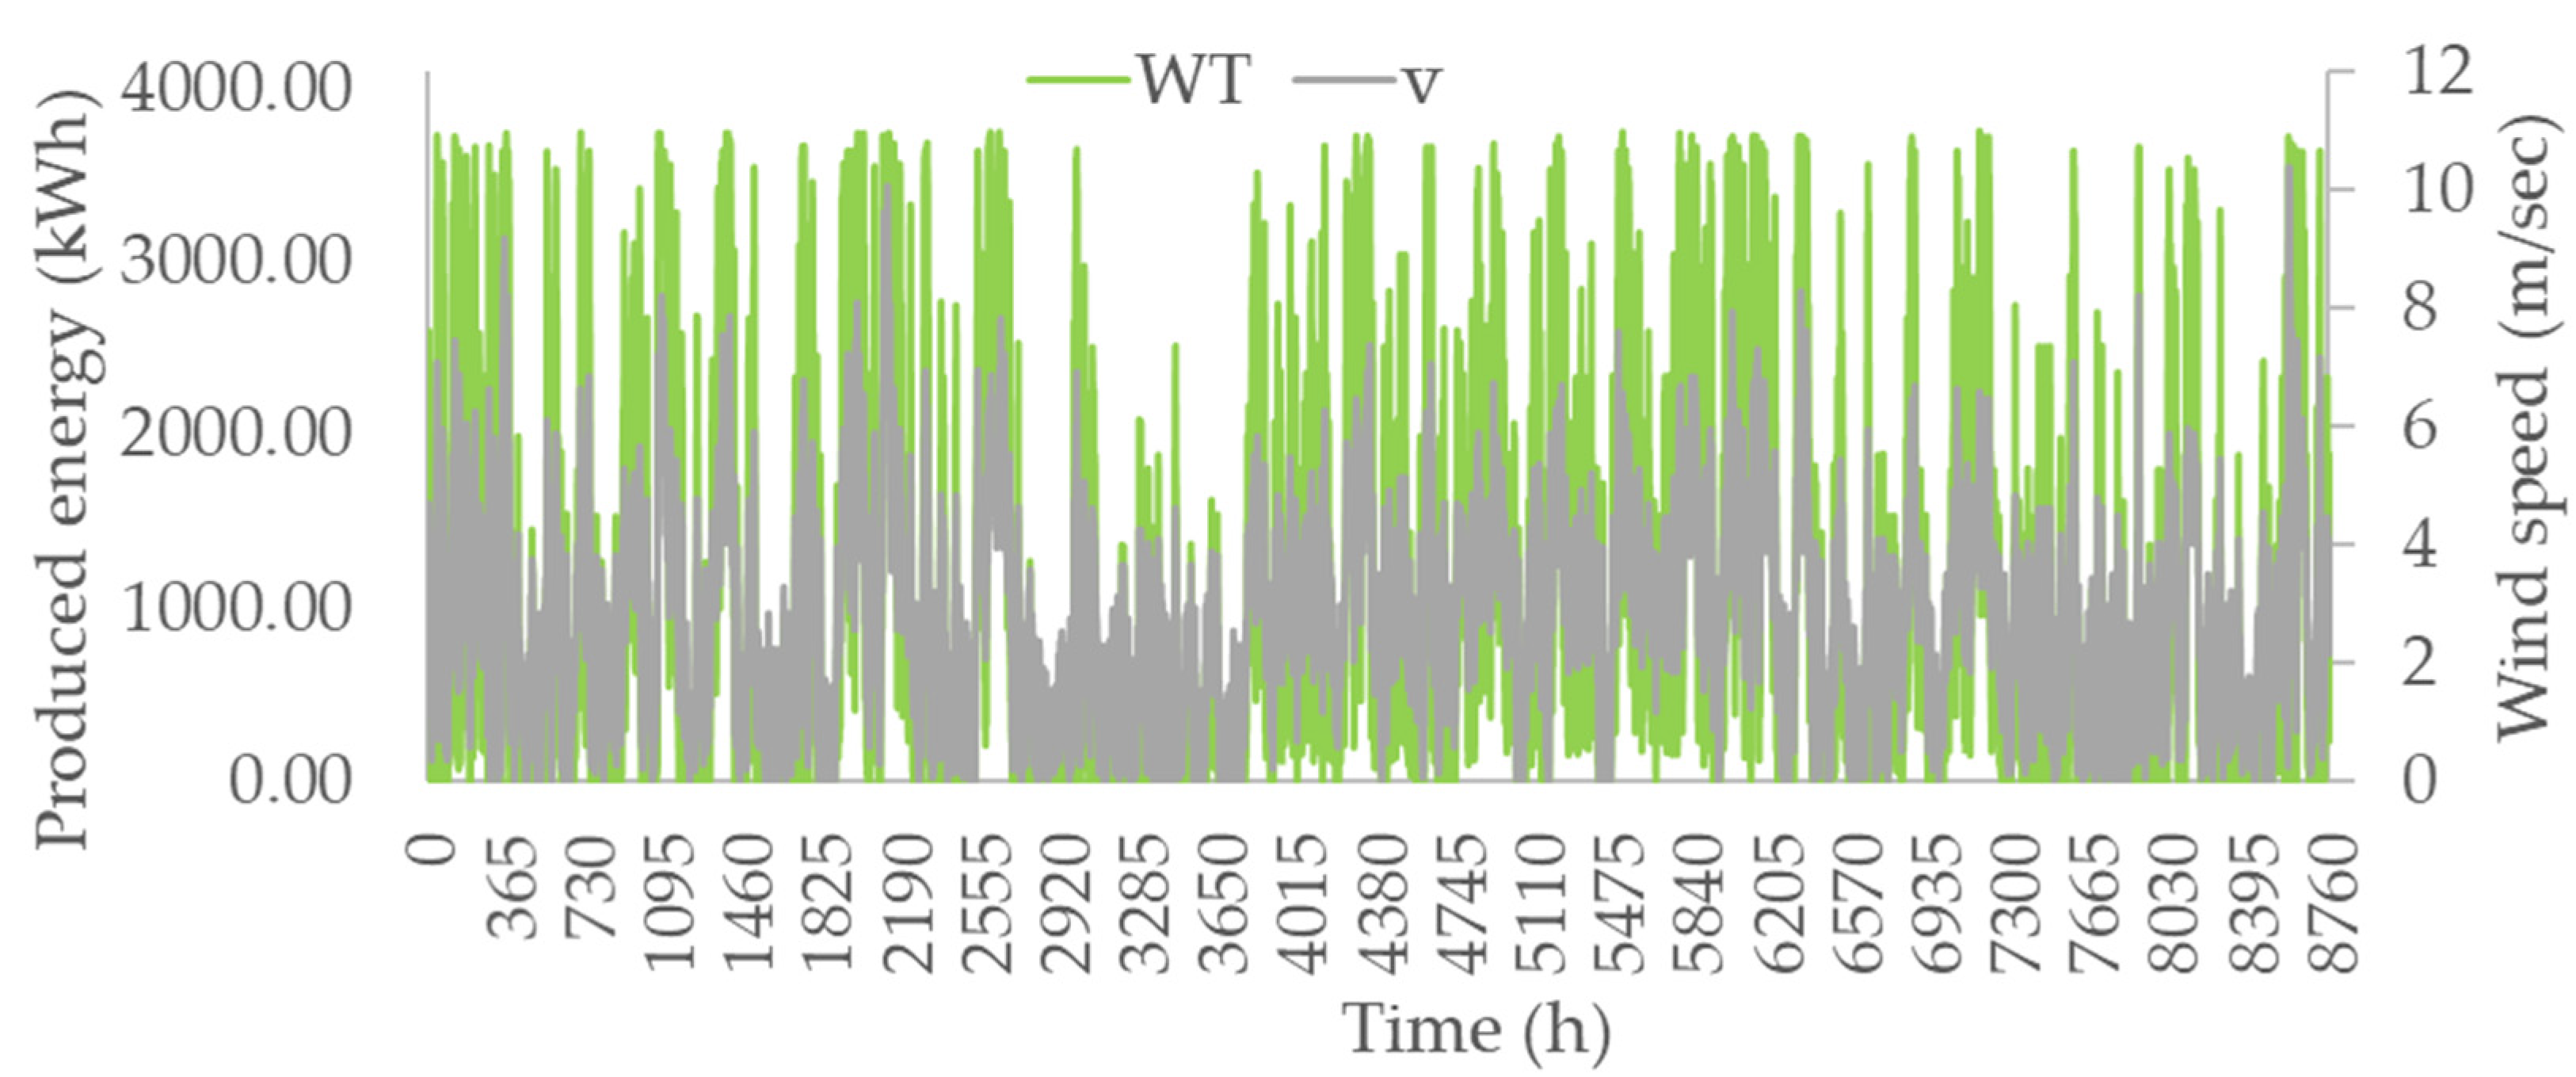
The measured wind speeds at the weather station for one year are shown in Figure 4. Estimating the wind speed to the hub height of the wind turbine with Equation (2), using the power curve of the model used in the case study and considering the total number of installed wind turbines, the total generated wind energy is shown also in Figure 4 and is proportional to the wind potential.
Simulations of both models, the one with the single storage, PHS, and the second with the hybrid storage, HPHS, provide results on the reliability of the systems. In Figure 5, the average rate of reliability for a whole year (12 months) is presented. Generated results are estimated for each one of the demands, electricity, domestic and irrigation water as they are described by the subscripts of the legend, “el”, “d”, “ir”, respectively. It is shown that the average coverage of each demand is consistently over 80% for each month and that for each separate demand the HPHS provides better results than the PHS of an average of 3%. This value ranges from 0.5% to 8% depending on the month and on the demand examined. Additionally, an overall average is extracted for the reliability of the entire HRES (subscript “hres”). From the results, it is clear that hybrid storage provides better reliability results, as the energy that would otherwise be thrown away is now utilized by an additional storage system, in this case, the hydrogen storage system.
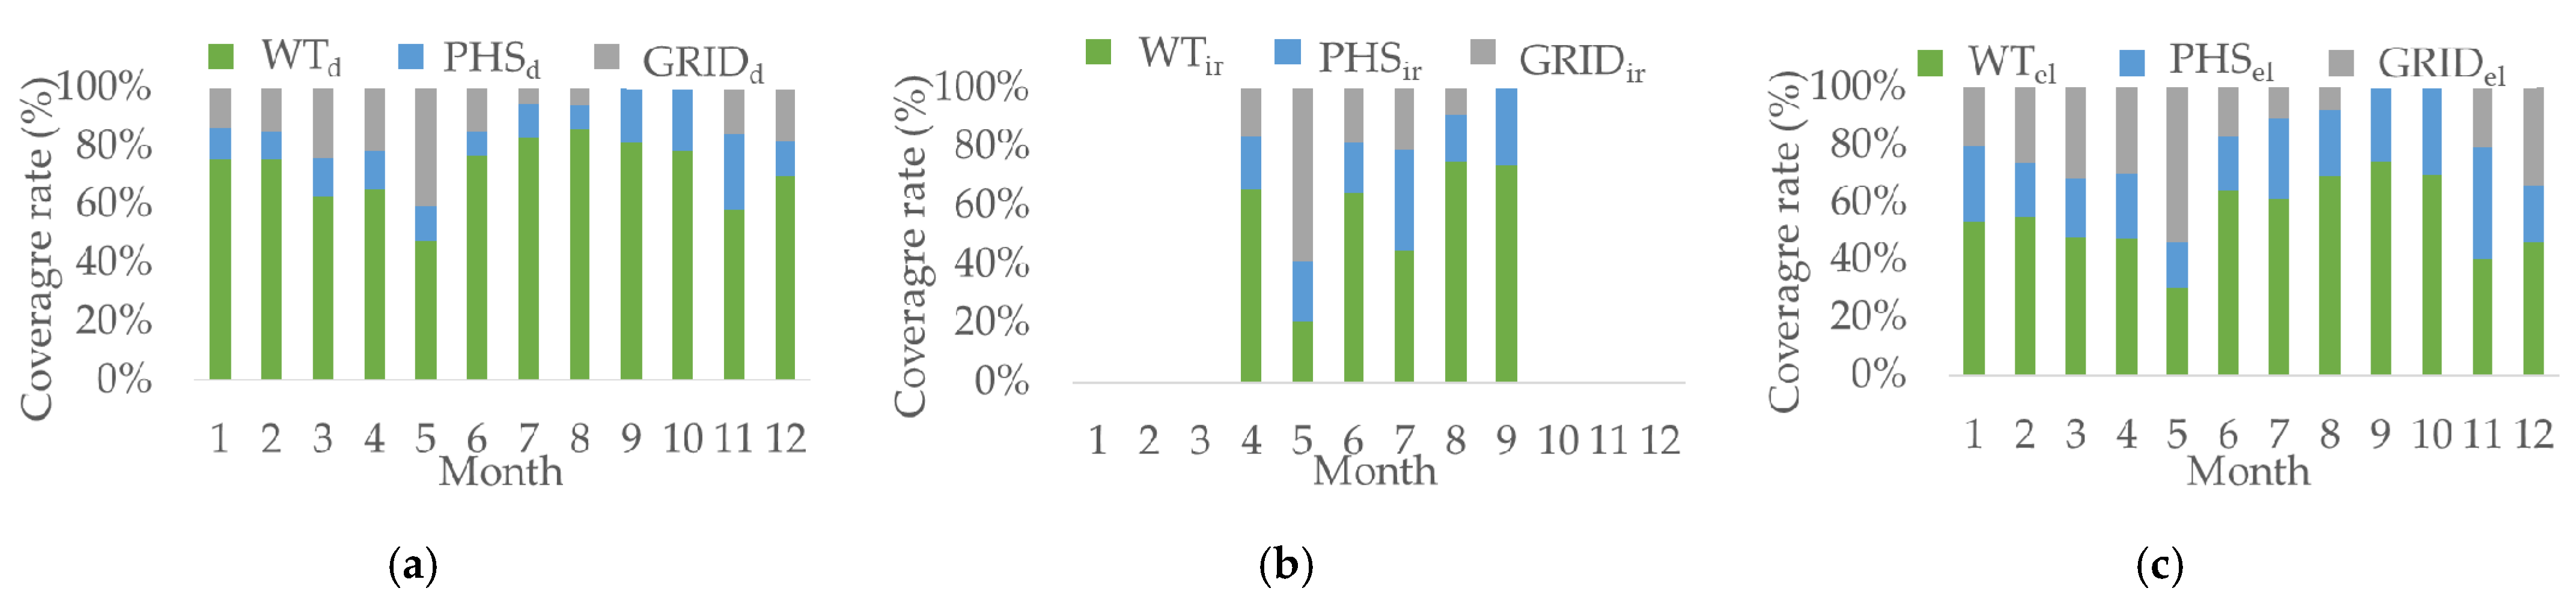
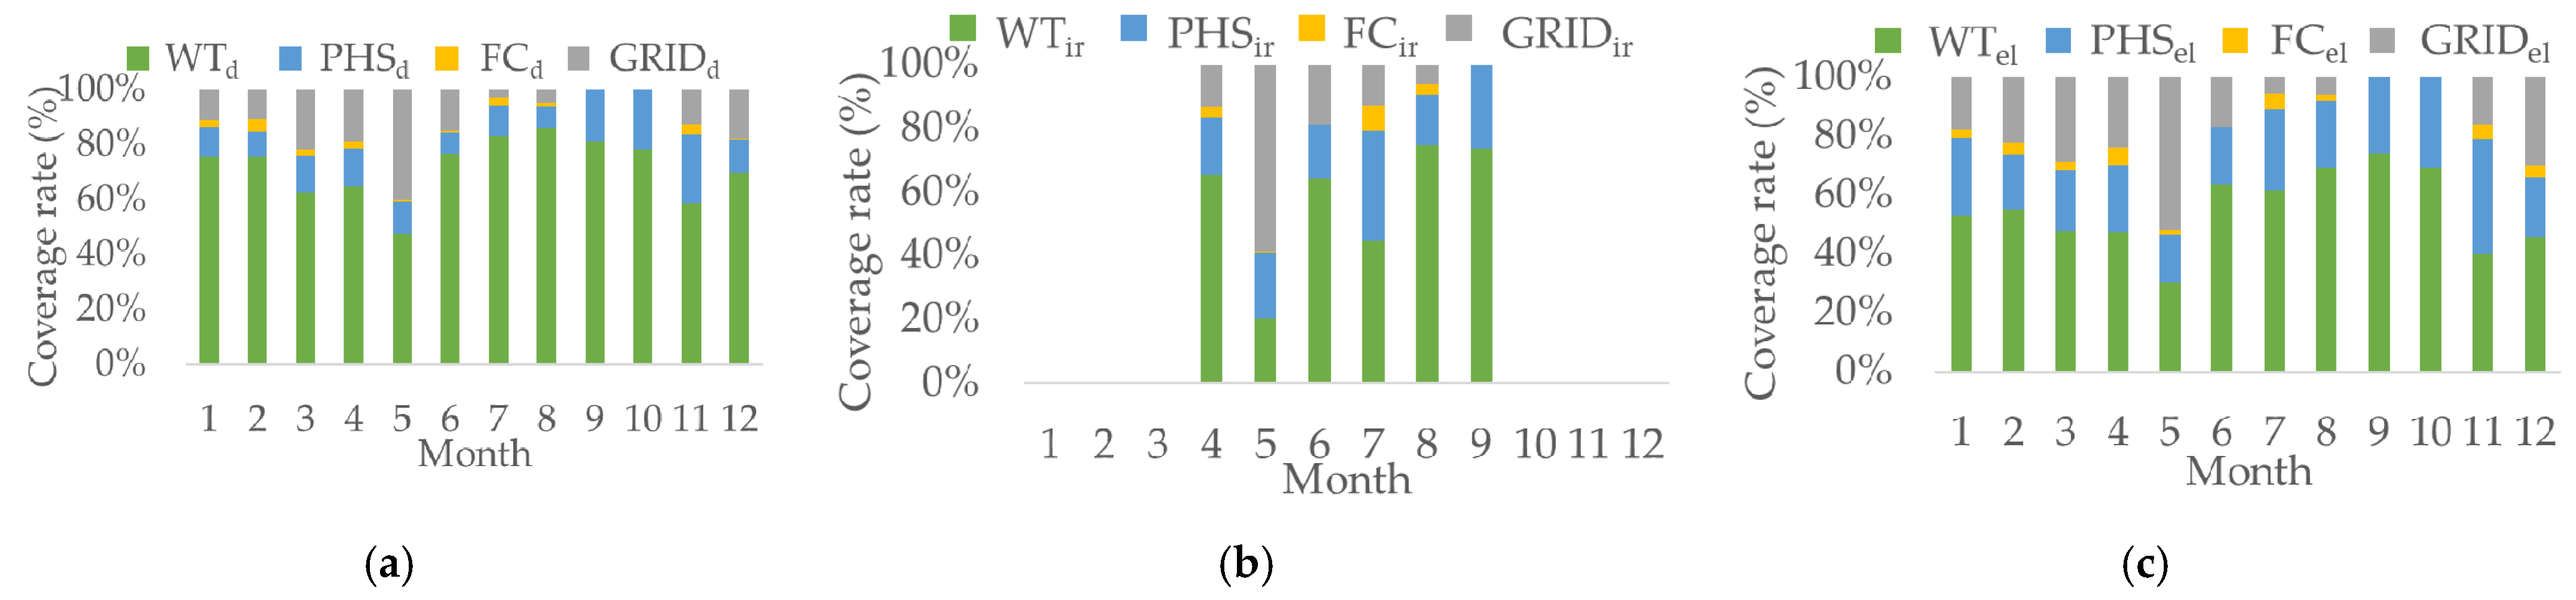
Figure 6 and Figure 7 show the share of energy by the four different sources, which are the wind turbines, the pumped hydro storage, the fuel cell (FC) and the grid (GRID) of the island. In Figure 6 results by the single storage are presented, and particularly results for domestic water (a), irrigation water (b) and electricity (c). In Figure 7 the corresponding results are depicted for the hybrid storage. In both cases, the energy is initially supplied by the wind turbines and then the hydropower. For the PHS, uncovered needs are covered by the local network of the island, while for the HPHS, the storage of unexploited energy through the fuel cell is utilized before the use of the grid. It is observed that during September and October, GRID is not used at all for either of the needs and for either of the two storage systems. During these months, the demands and the produced RES are in balance and HRES is completely autonomous. In May, when the irrigation season is starting and the irrigation needs are increased, there is greater use of GRID for irrigation and, consequently, for electricity, which is the third demand in a row to cover. The increased demand for irrigation water also affects the way the domestic water is covered during the irrigation season, reducing the coverage rate from the HRES compared with the rest of the months where no irrigation water is required to be desalinated. Additionally, the exploited wind energy for the demands varies for each month and depends on the demands and on the prevailing wind potential, as shown in Figure 1 and Figure 4, respectively. On the other hand, the produced hydro energy depends on the surplus energy and the stored water of the pumped water as it is estimated according to Equation (3), while produced energy from the fuel cell depends on the unexploited energy and on the stored hydrogen.
After the simulation of both models, results related to COE, COW and LOLP for each demand and for the whole operation of the HRES are extracted and are presented in Table 2. The initial and replacement cost for the PHS model is 18,184,000 EUR, while for the HPHS model is about 27,730,000 EUR, almost 10 million higher due to the additional hydrogen storage system. The operation and maintenance costs are 752,500 EUR and 771,000 EUR for PHS and HPHS models. This difference, mainly in the initial cost, is also reflected in the COE and COW values for both models. Although more energy is produced by the model with the hybrid storage, the cost of the components of the hydrogen storage system is comparatively and proportionally larger, leading to this difference in energy price. Nassar et al. [14] estimate the minimum and maximum levelized cost of energy 0.130 EUR/kWh and 0.663 EUR/kWh, respectively, for a different configuration of a WT/PV/PHS model. Sultan et al. [24] calculate COE about 0.420 EUR/kWh and 0.390 EUR/kWh for a WT/hydrogen and a WT/PV/hydrogen model, respectively, both integrated into the grid. The research study of Dawood et al. [35] results in COE equal to 0.370 EUR/kWh for PV/battery model, 0.450 EUR/kWh for PV/hydrogen model and 0.320 EUR/kWh for PV/battery hydrogen model.
3.2. Storage System Operation
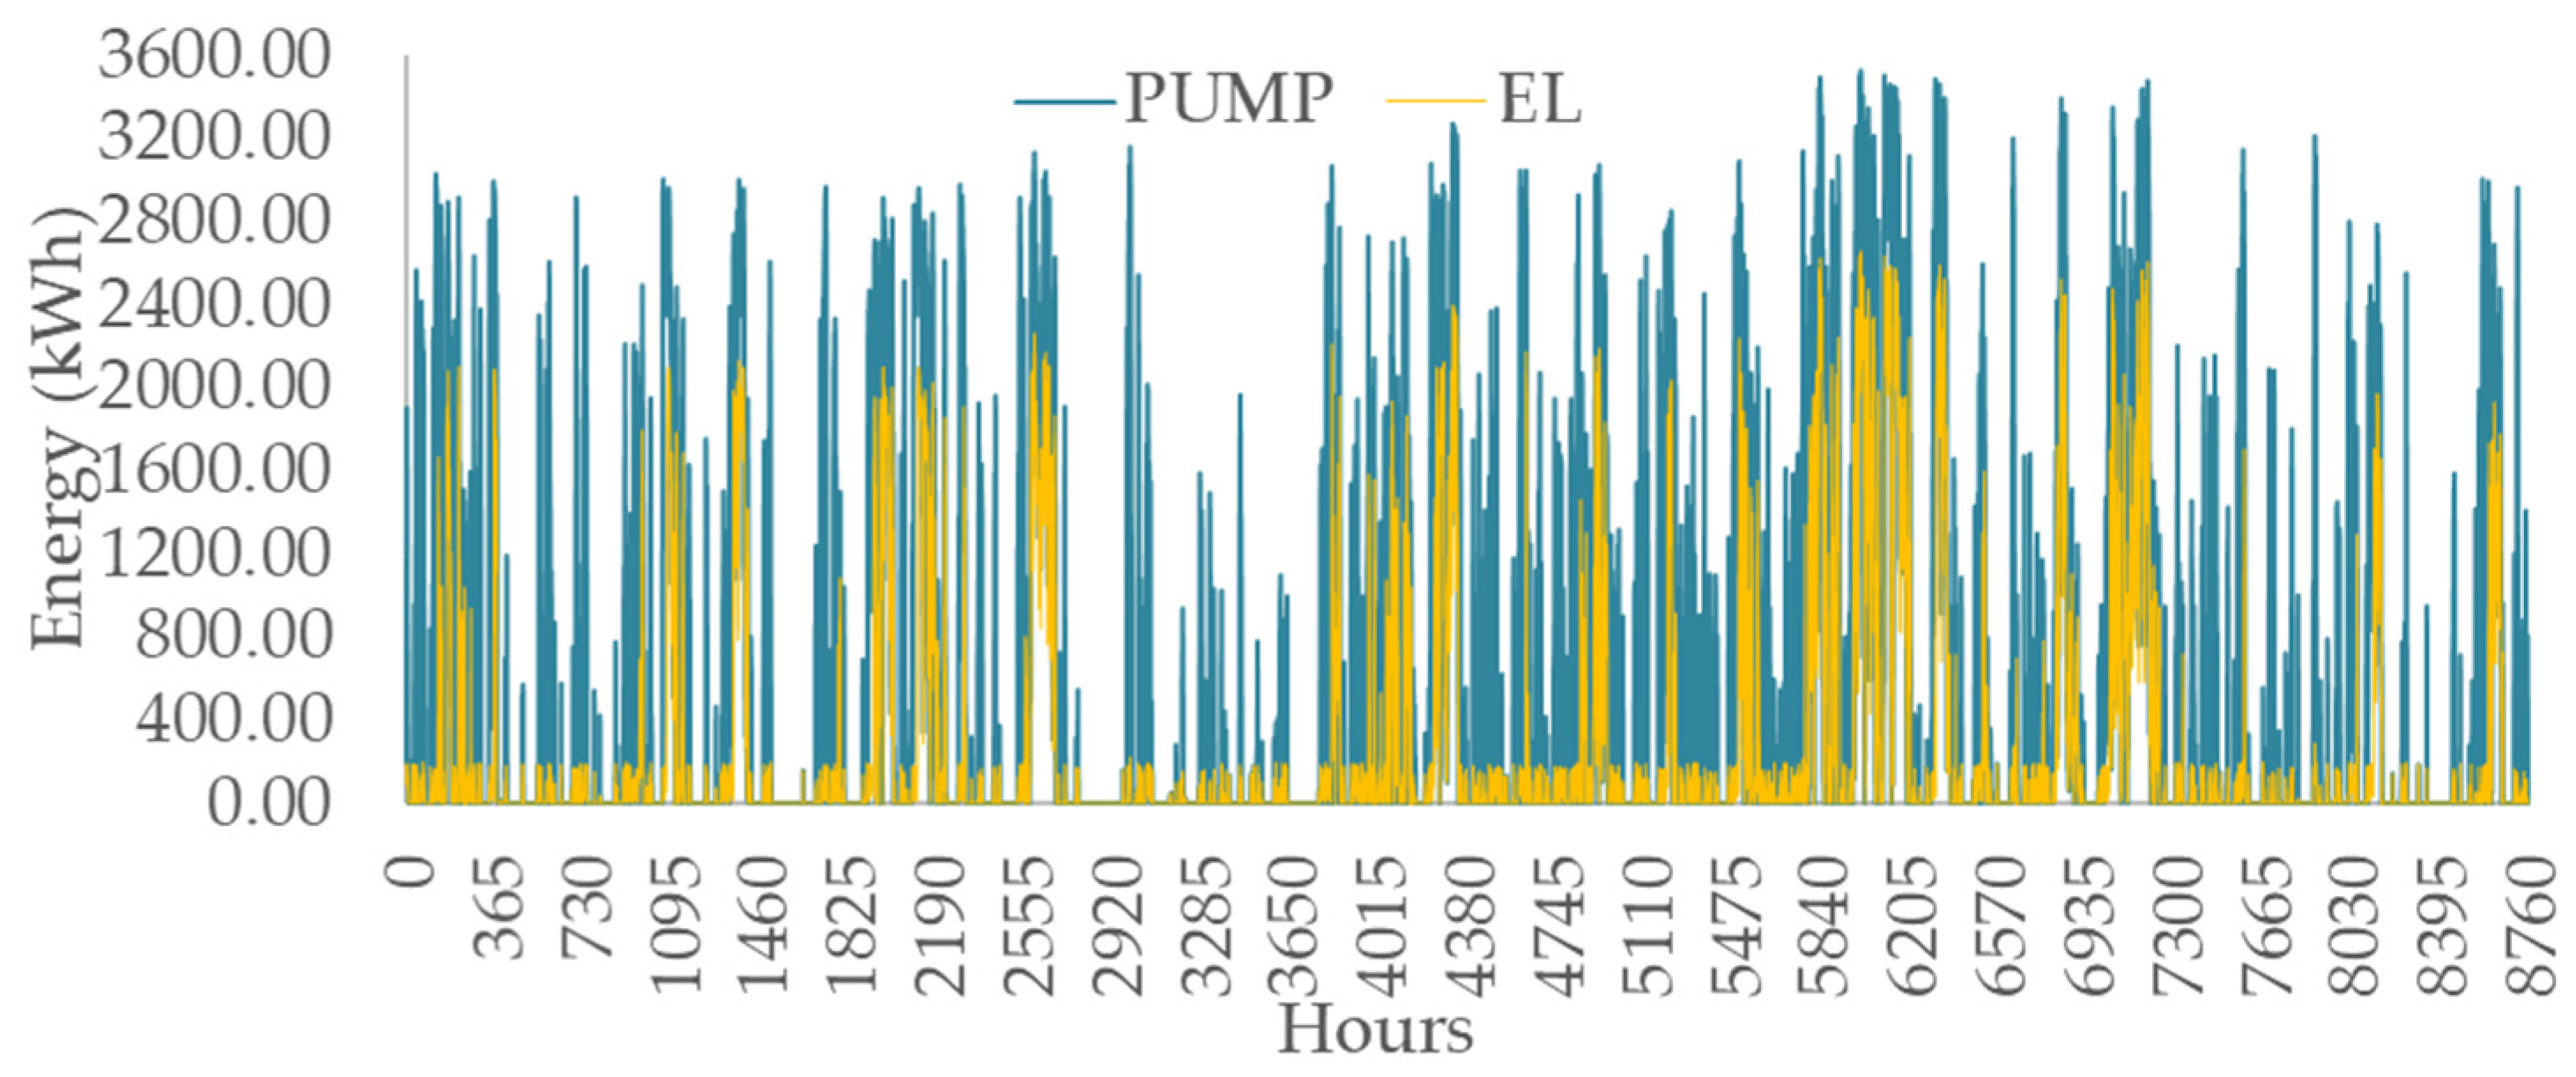
During the operation of the HRES, surplus energy is given for pumping. This energy is shown in Figure 8 for the HPHS (in hourly step), as well as the unexploited energy which remains after pumping, either because it could not be utilized by the pumps or because the upper reservoir is full, and no more water can be stored. This unexploited energy is sent to the electrolyzer (EL) to be converted into hydrogen. This amount is also used for the corresponding amount, which is required for the desalination of seawater in order to be used for electrolysis. The yellow line depicting the energy utilized by the electrolyzer in the HPHS model represents energy that ends up in a dump in the single storage.
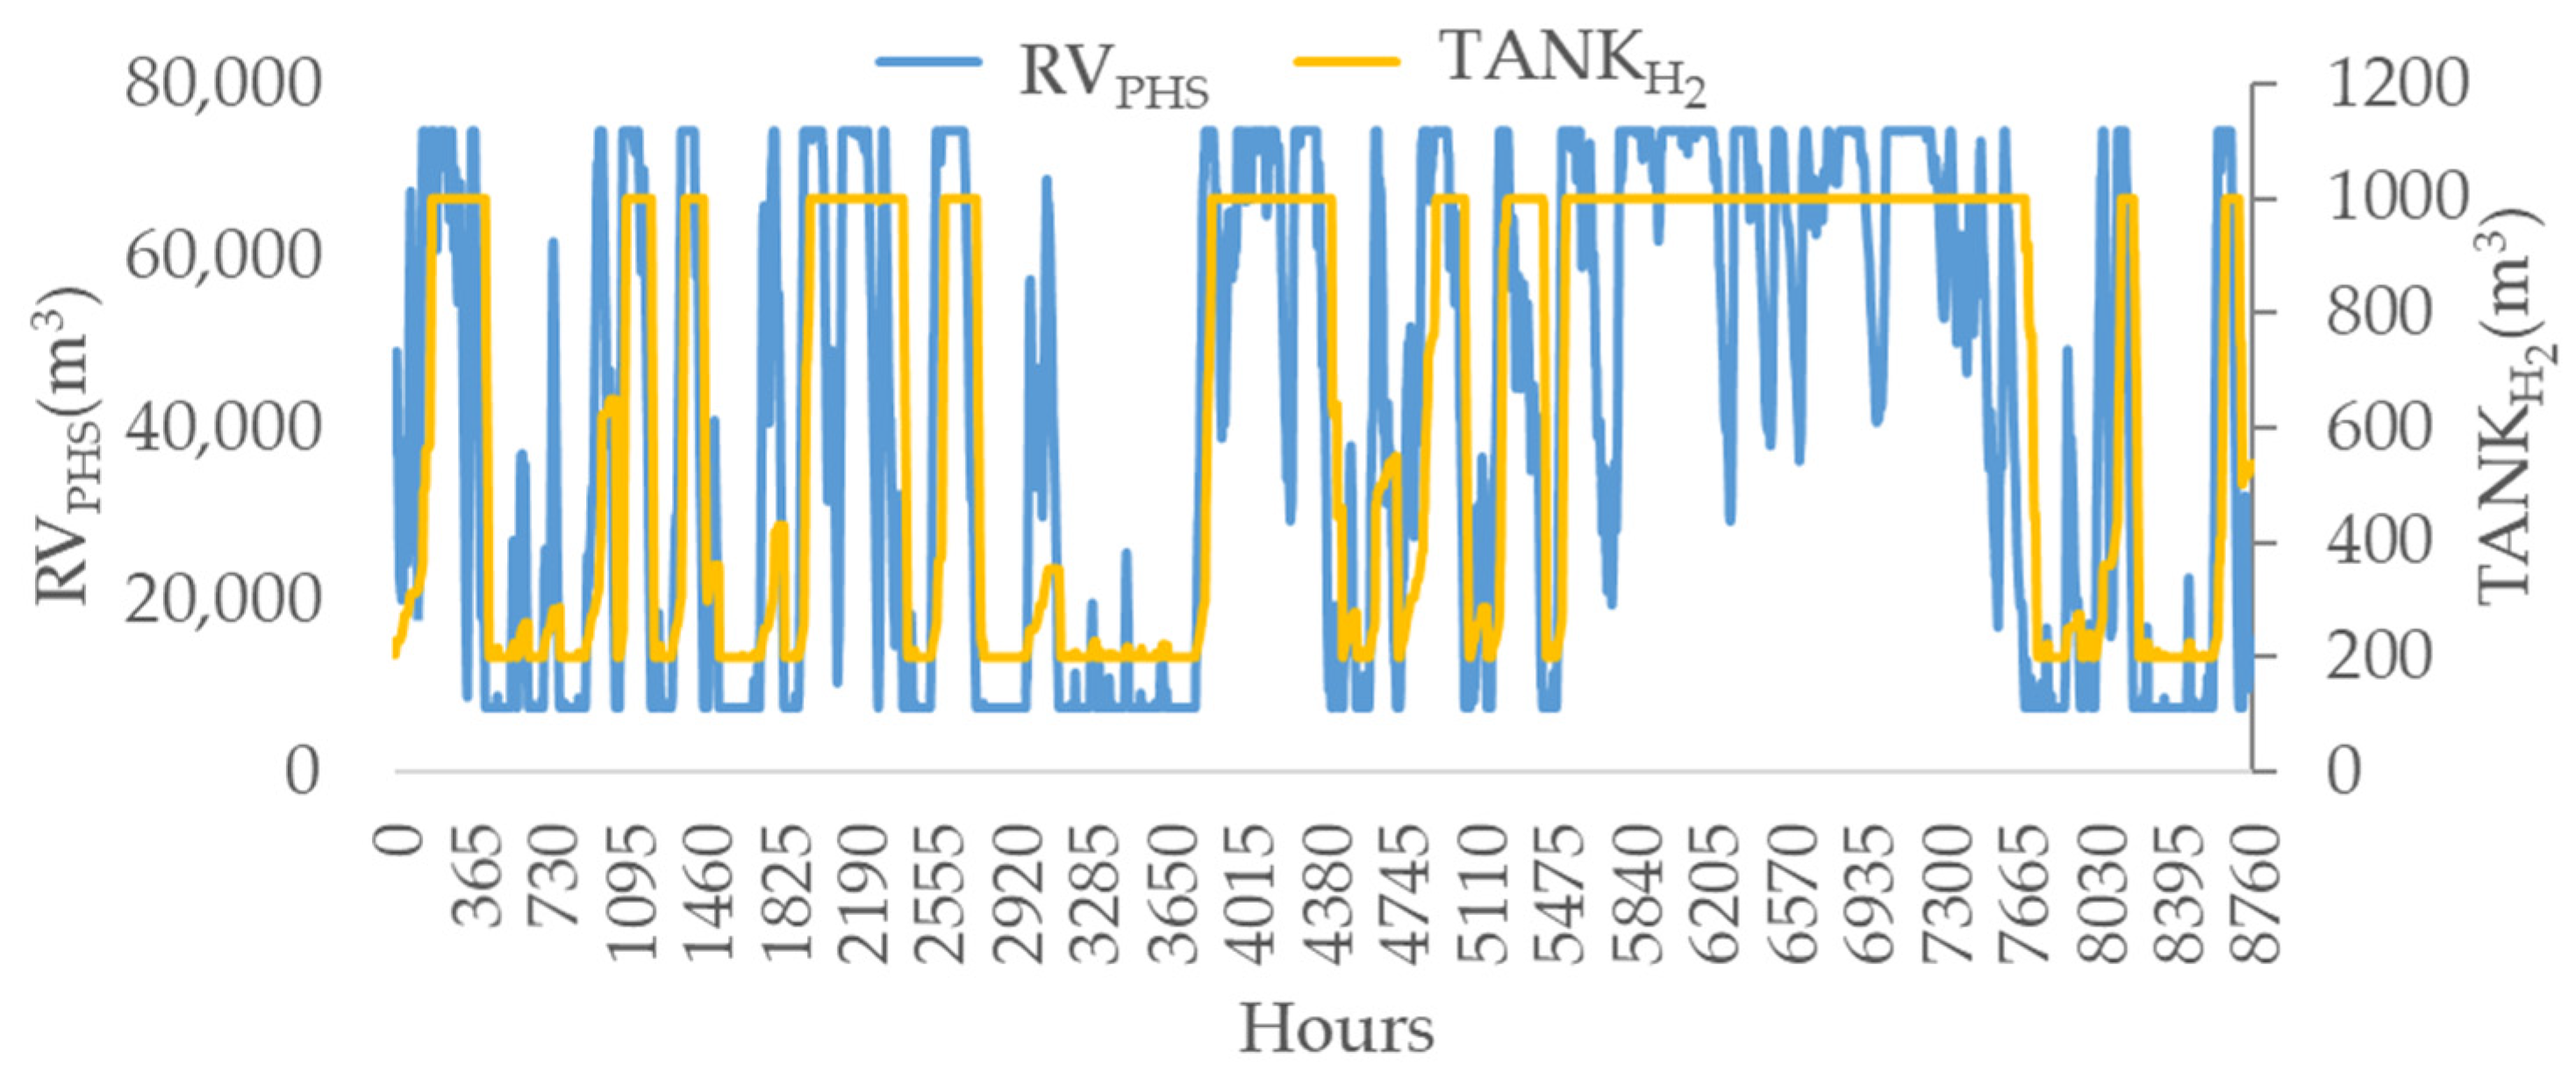
Figure 9 presents the hourly storage level of both the upper reservoir and the hydrogen tank for the HPHS model. It is shown that every time the upper reservoir reaches its minimum level, the hydrogen tank starts to discharge, providing hydrogen to the fuel cell for energy production. For periods in which the upper reservoir never reaches its minimum level, such as from about 5840 to 7300 h of the year, no change is observed in the hydrogen tank. When both the upper reservoir and the hydrogen tank reach the minimum level, the uncovered demands are fulfilled by the grid.
3.3. Energy Balance
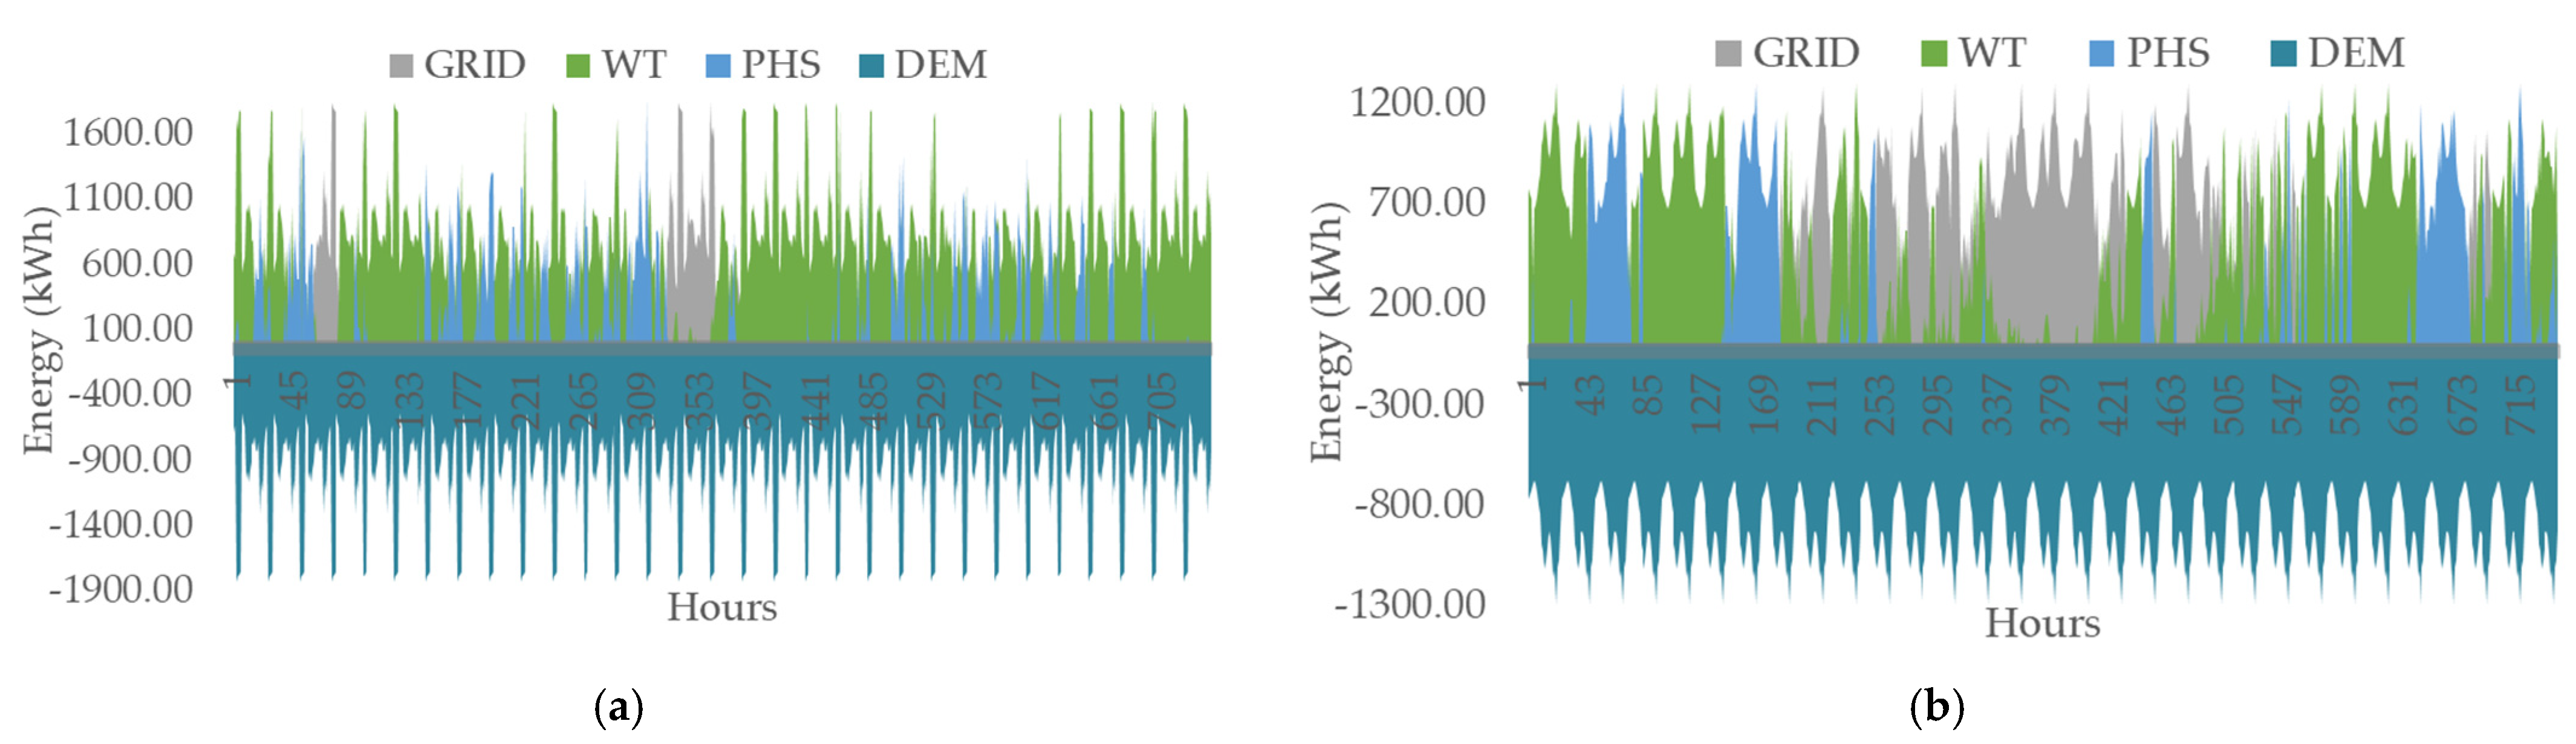
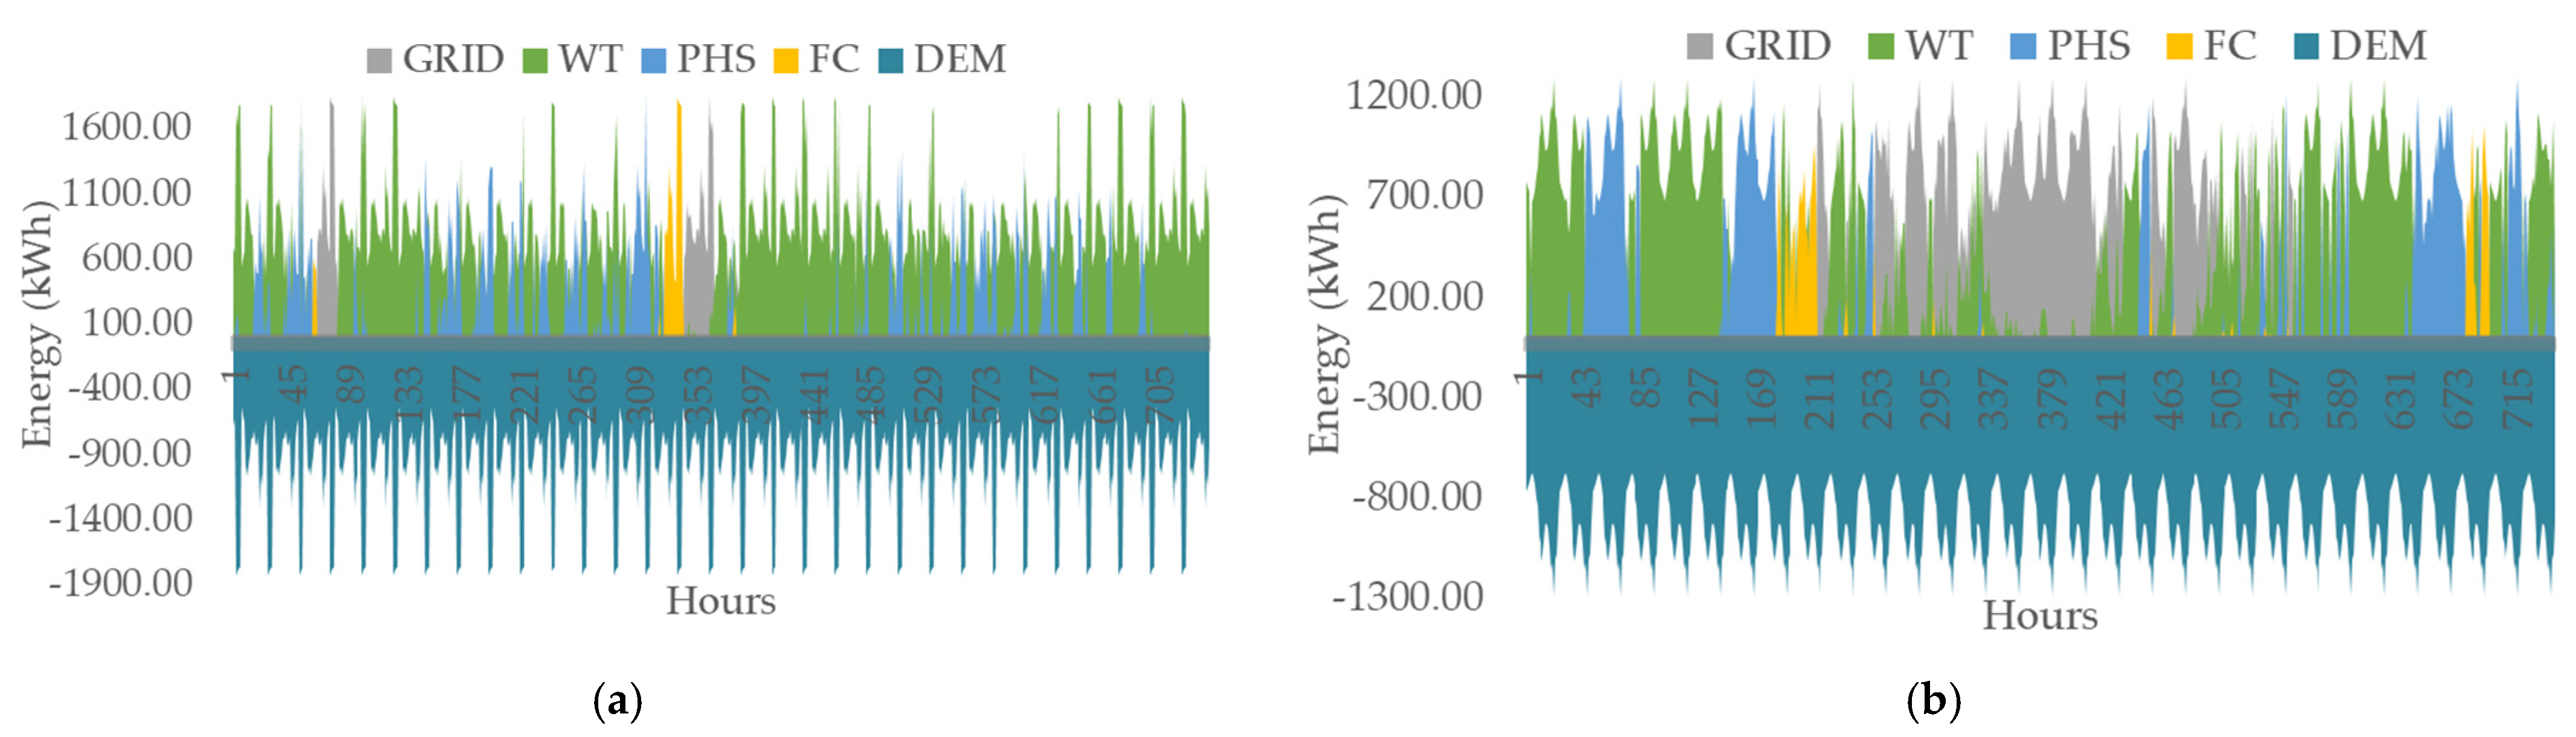
The share of energy for the PHS and HPHS is depicted in Figure 10 and Figure 11. August is presented in (a) and December in (b). The demand (DEM) is displayed with negative prices in order for the comparison to be obvious. The selection of the specific months is made based on the demands. December presents the higher demands in electricity, while August presents the higher demands in desalinated water for domestic and irrigation use. The pattern of increased values appearing in August, Figure 10a and Figure 11a, are due to the irrigation water that is considered to be required after midnight, as watering is applied after sunset. During the night, the other demands (domestic water and electricity) are much lower. Comparing both figures, it seems that in the HPHS, some periods when the grid would otherwise operate are now replaced by the operation of the fuel cell. Moreover, the hybrid storage model offers more days of autonomy compared to the single storage. Additionally, the fuel cell seems to operate more in December, compared to August. This may be explained by the fact that although in December, the total required energy demands are more, compared to August, at the same time, the wind potential, as shown in Figure 4, is higher, resulting in more unexploited energy being driven and utilized in the electrolyzer. Additionally, in December, more use of the grid is observed, compared to August, since more energy demands arise. Additionally, as it is explained previously, irrigation water demands are shifted separately to the night hours, where the rest of the energy demands are minimized, ceding by this way to the HRES the ability to cover separately these demands and provide more energy for the rest at the remaining hours of the day, based on the wind potential.
A comparison between Figure 9 and Figure 11 shows that the grid supplies the island with power every time that both the upper reservoir and the hydrogen tank are at their minimum level. Days on which they do not reach their minimum level and no use of the grid is suspected means that the island if fully autonomous.
3.4. Sensitivity Analysis
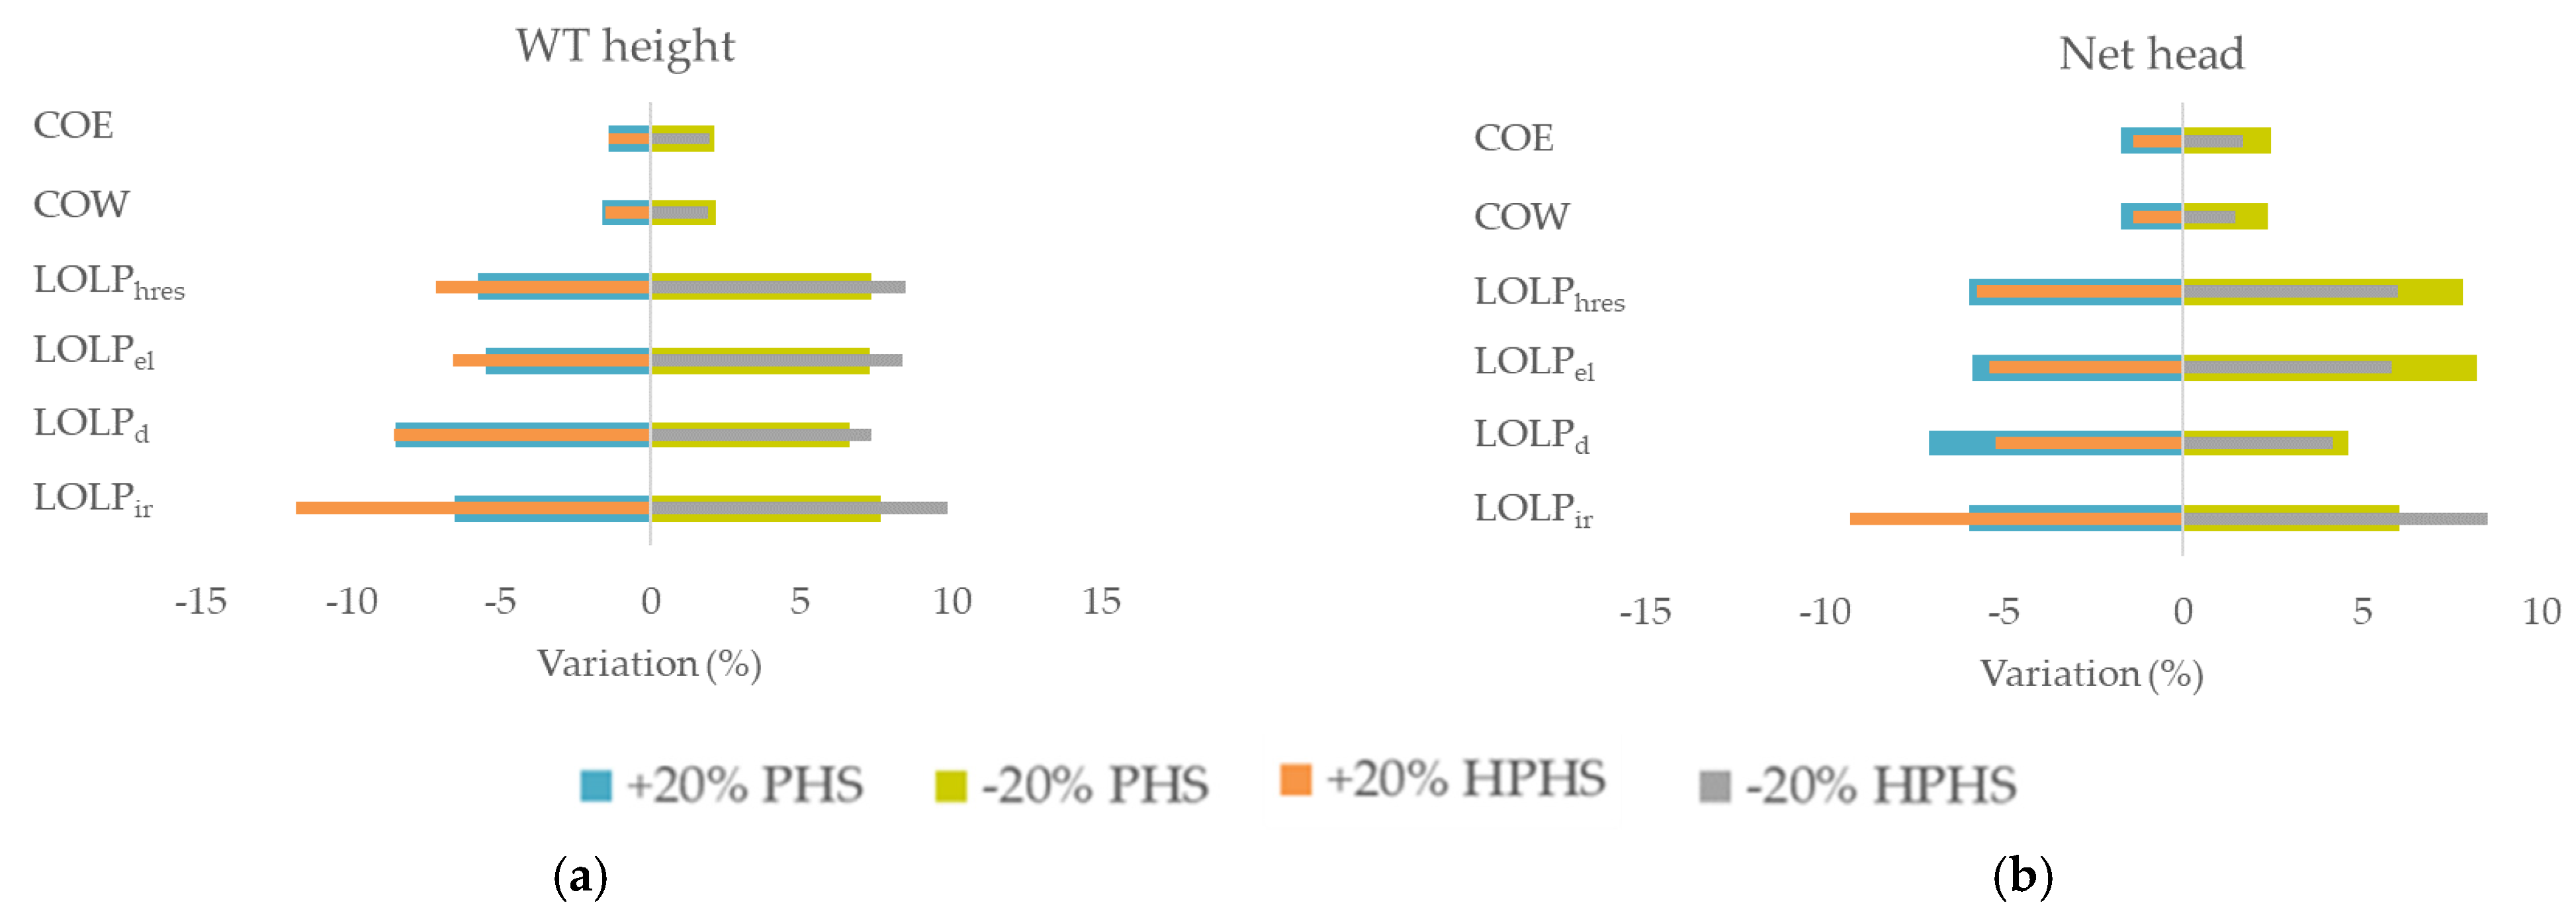
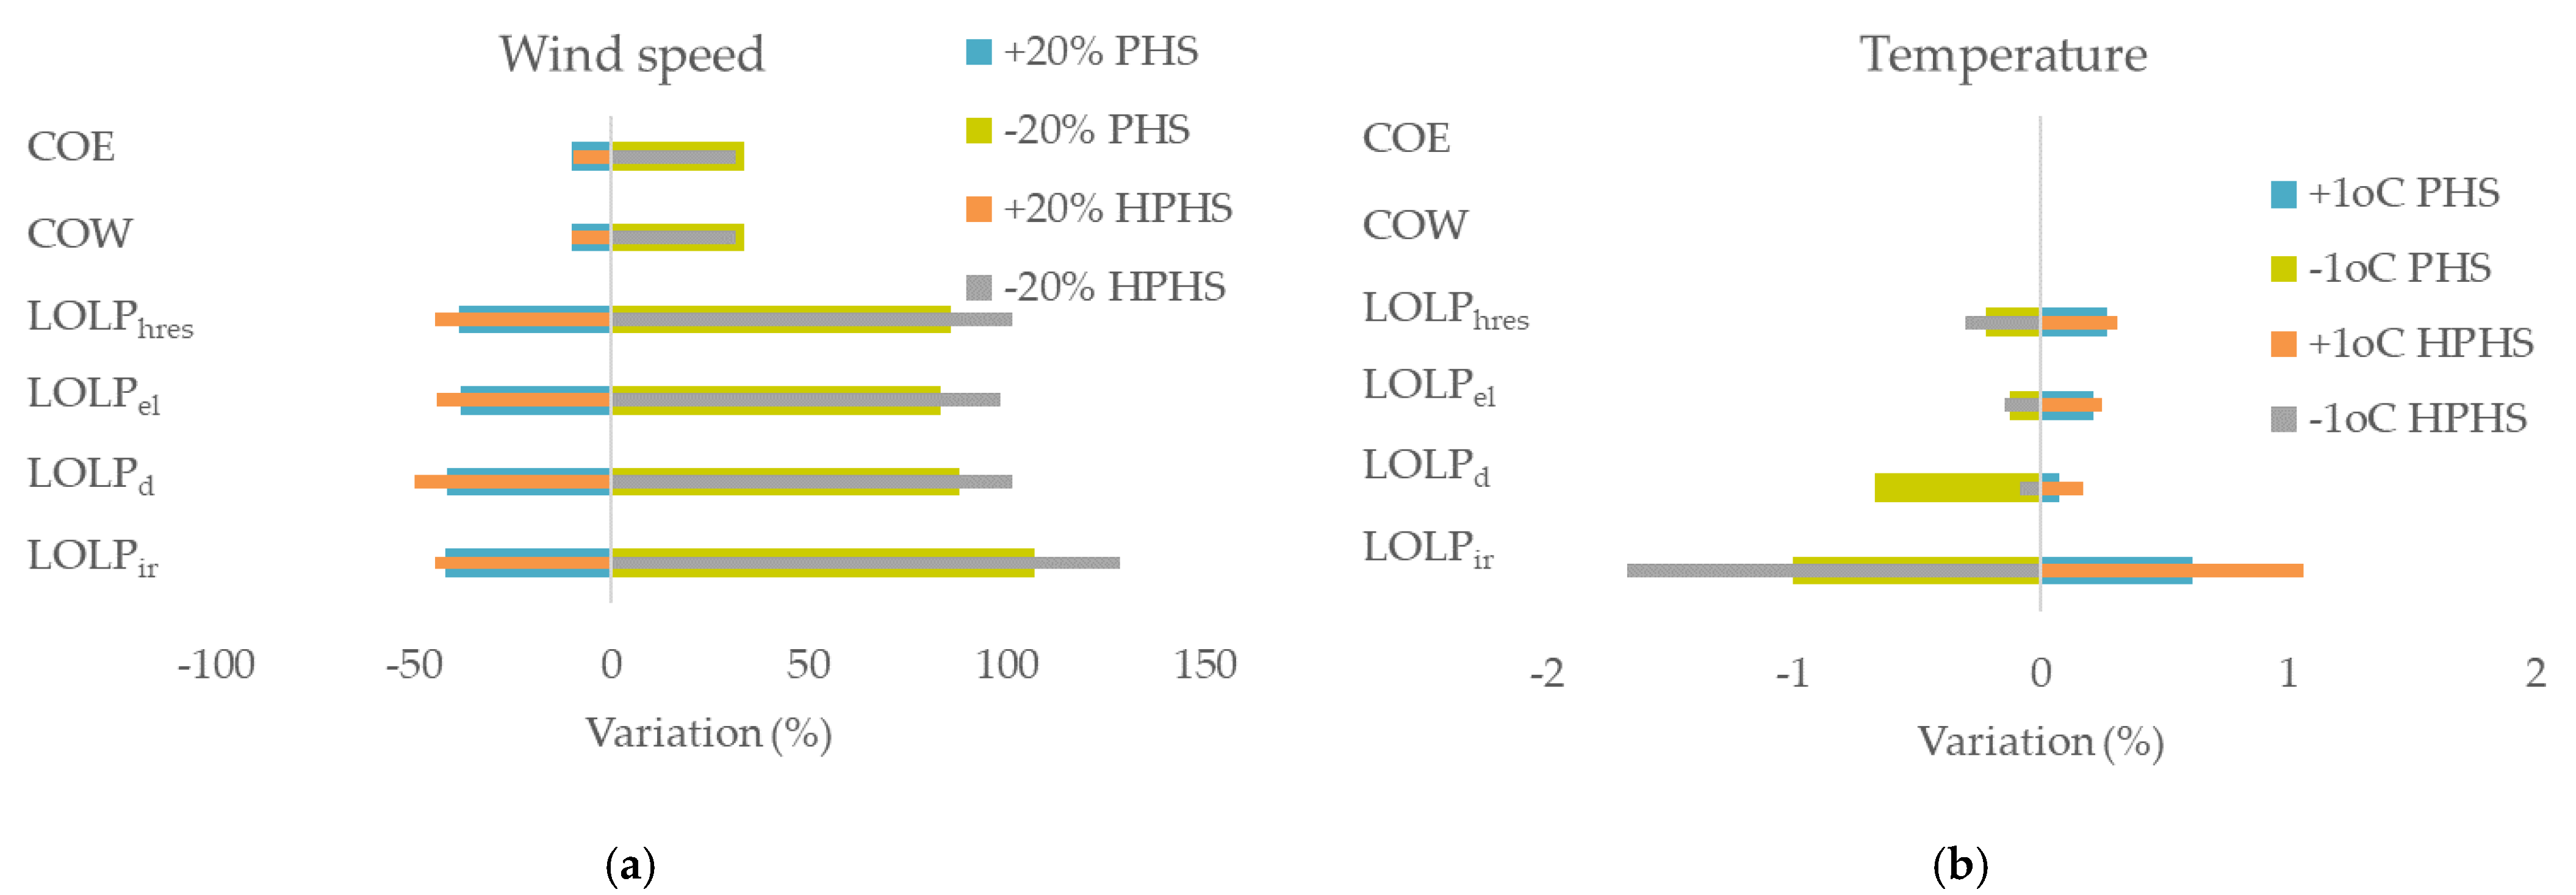
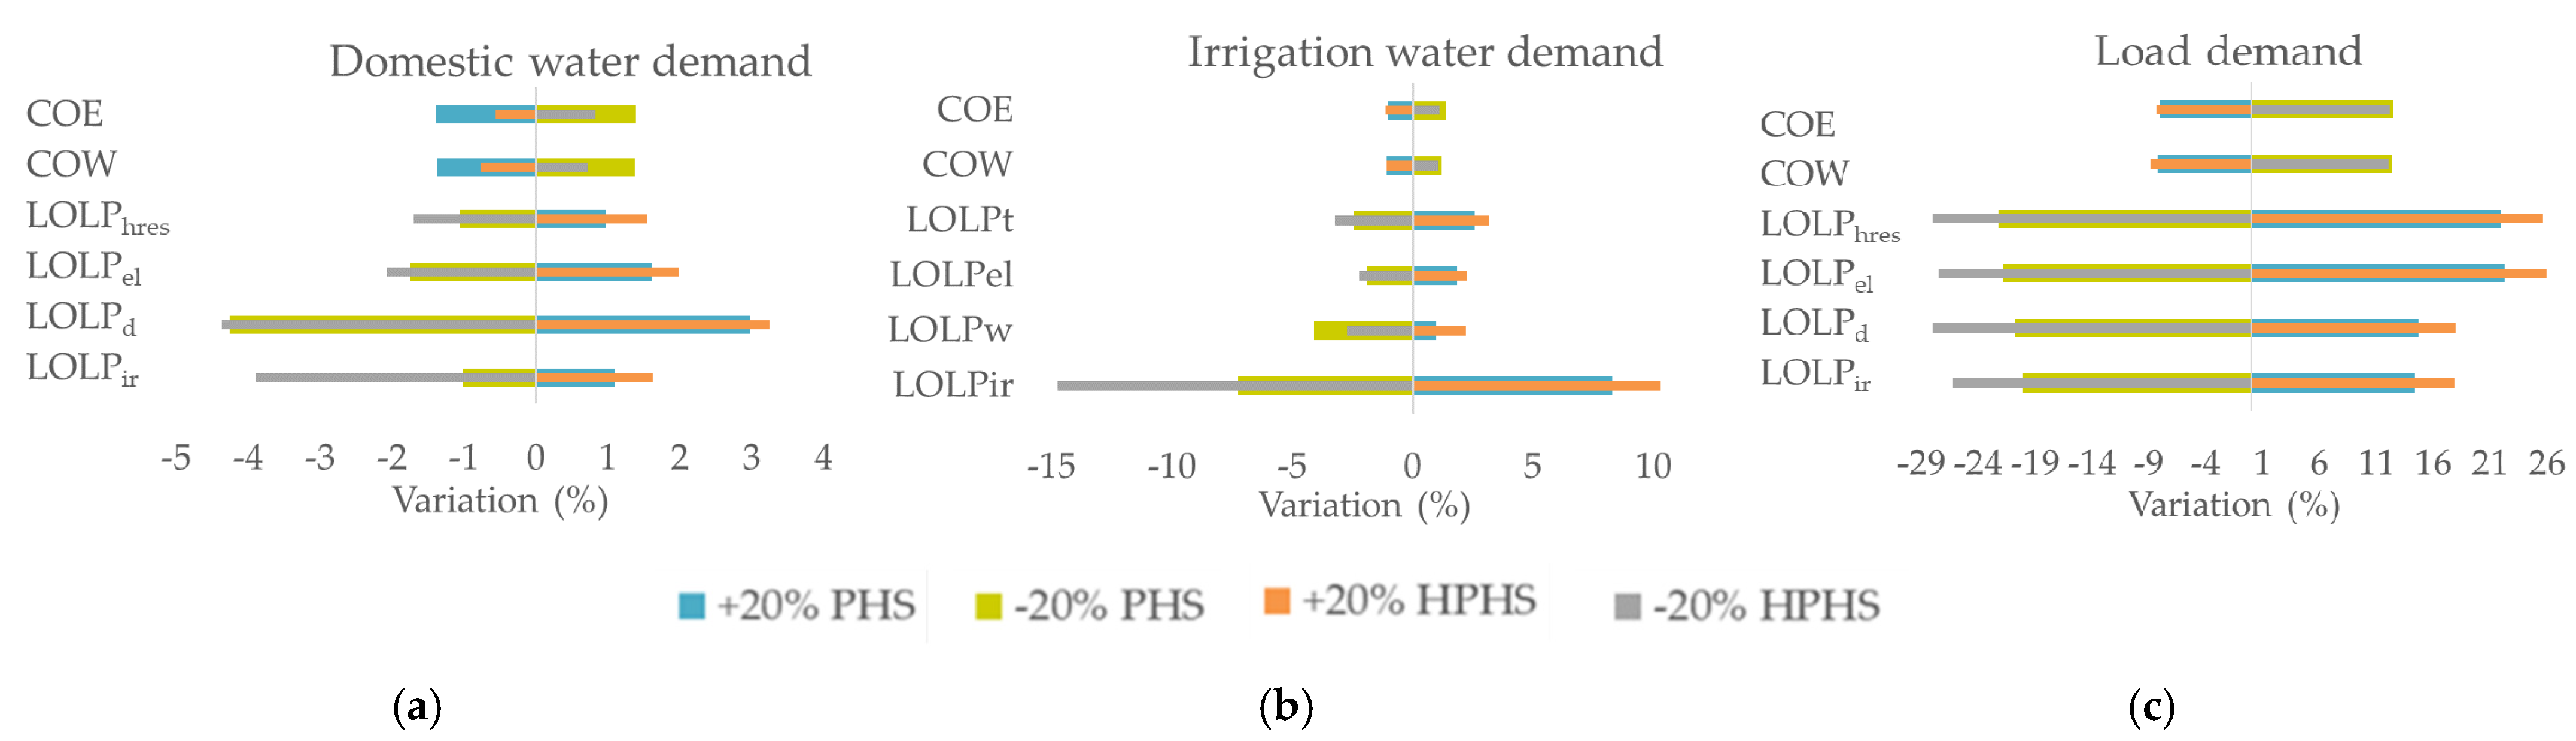
A sensitivity analysis is conducted based on seven key parameters for both models, PHS and HPHS. The results are presented in Figure 12, Figure 13 and Figure 14 showing the comparison between single and hybrid storage and how they are affected by each key parameter. Key parameters refer to the installation height of the wind turbine and the upper reservoir (Figure 12), meteorological data such as wind speed and temperature (Figure 13) and variation in the three demands: domestic water, irrigation water and electricity (Figure 14). Every parameter is examined in the context of an increase and a decrease of 20% in order to show the relationship between the change in the initial value and the six indices that are calculated (COE, COW, LOLPhres, LOLPel, LOLPd, LOLPir). Concerning the variation in temperature, an increase and a decrease of 1 °C is examined.
The height of the wind turbines affects the wind speed that is exploited by the wind turbines according to Equation (2) and generally the speed measured at the hub height affects the produced wind energy. As shown in Figure 12a, an increase in the installation height of the wind turbines means higher wind energy production, therefore the cost of both energy and water is reduced. Additionally, LOLP decreases as with more wind energy produced, more demands are expected to be met. While COE and COW are proportional to both models, in the case of LOLP, HPHS is more affected by the changes in wind turbines installation. This is to be expected, as there is an additional storage unit, that of hydrogen. The largest deviation is observed in the irrigation water between the two models. One possible explanation may be related to the fact that, as has been stated previously, all the demand for irrigation water is concentrated in the night hours and, as the remaining demands are reduced, the possible increase in wind energy production at night due to the installation of wind turbines at a greater height leads to the greater coverage of irrigation needs. This is more intense, especially when there is a second storage system, that of hydrogen, which acts as a backup. Additionally, the possible reduction in the total wind energy produced at night will lead to less coverage of the irrigation needs and if there is no second storage system from where uncovered energy can be exploited, the LOLP will increase more intensely.
The net head, the height between the altitude of the pumps and the hydro turbine and the altitude of the upper reservoir, affects not only the amount of pumped water (Equation (3)), but also the amount of the produced hydro energy (Equation (4)). Concerning the net head, more energy may be required to pump and store water in the upper reservoir; however, as shown in Figure 12b, the hydropower generated is much higher covering more energy demands in both models and considerably reducing COE and COW. Moreover, the comparison between PHS and HPHS shows that COW and COW are more affected in PHS than HPHS. This is probably observed due to the decrease, for example, in the net head, leading to less energy produced without the hydrogen storage that could supply more energy and, thus, COE and COW increase more sharply. In the case of the increase in the net head, although more energy is produced for both models, the initial cost of HPHS is higher, leading to a smaller reduction in COE and COW. Here, also, a special behavior in meeting the irrigation demands is observed, which can be explained as above in the case of the installation height of the wind turbines.
In Figure 13a, the effect of wind speed is presented. A decrease in the wind speed affects the COE and the COW more intensively than the corresponding increase. Concerning LOLP indices, they are more affected in HPHS than in HPS, probably due to the additional hydrogen storage unit. An increase in wind potential reduces LOLP further in the hybrid model, as this additional storage system can utilize the additional wind energy produced. The reduction in wind potential leads to a larger increase in LOLP in HPHS, despite the fact that the additional storage unit could cover the potential reduction in demand coverage. Obviously, hydrogen storage is not able to cover this 20% reduction in wind potential.
Variation in temperature affects the estimation of evapotranspiration and, consequently, the demand for irrigation water. An increase in temperature means more irrigation water is required, while a decrease in temperature decreases the demand for irrigation water. As it is shown in Figure 13b, COE and COW are not affected, as the energy produced from the HRES, or its cost are also not affected. However, LOLPhres is affected more in the HPHS. Additionally, the largest impact is displayed in LOLPir, as irrigation is the demand that is affected more by the variations in temperature, and it also appears in HPHS.
In Figure 14, the effect of domestic water demand (a), irrigation water demand (b) and load demand (c) are presented. COE and COW are affected, since the produced energy from the HRES is affected according to the variation in the demands. The higher the energy demand is, the more intensive the variation in the LOLP indices. For this reason, there is greater variation for the changes in electricity than for the changes in the irrigation water and, finally, for the changes in domestic water, which constitutes the lowest energy demand. Additionally, in the LOLP indices, the greater change is depicted for HPHS, except for LOLPd, which shows different behavior in the change in irrigation water. This may be due to the fact that domestic water is the first priority. Therefore, a reduction in irrigation water causes a decrease in the LOLPd more intensively in the single storage system than in the hybrid storage system, as in the second, the additional hydrogen tank can cover more demands, especially that of domestic water, which is the first fulfilled in every time step.
4. Conclusions
In this research, the assessment of two HRESs is presented based on their storage technology and a comparison between a single storage system, consisting of a PHS, and a hybrid storage system, consisting of an HPHS, is investigated. The main points of this study are summarized in the following:
- Evaluation of a hybrid pumped hydrogen storage system;
- Comparison between a single and a hybrid storage system, the PHS and the HPHS; in terms of six indices (COE, COW, LOLPhres, LOLPel, LOLPd, LOLPir);
- Reliability analysis for both storage technologies;
- Sensitivity analysis which presents how the results are affected for both storage technologies based on variations in installation height of the wind turbines and the upper reservoir, variations in the meteorological data (wind speed and temperature) and variations in demand data (load demand, domestic and irrigation water). Every parameter is examined in the context of an increase and a decrease of 20% in order to show the relationship between the change in the initial value and the six indices. Concerning the variation in temperature, an increase and a decrease of 1 °C are examined. Results give useful information about the impact of each parameter on the calculated indices. The simulation is conducted in an hourly step; meteorological data of wind speed, temperature and precipitation are selected, as well as data about electricity, domestic water and irrigation water demands.
The assessment shows that COE and COW have lower values for single storage; however, hybrid storage leads to lower LOLP values, meaning that the HPHS meets more energy demands than the PHS. Specifically, COE is 0.287 EUR/kWh for PHS and 0.360 EUR/kWh for HPHS. COW is 1.680 EUR/m3 for PHS and 2.108 EUR/m3 for HPHS. On the other hand, LOLPhres, which shows that the loss of load probability of the whole HRES is 22.65% for PHS and 19.47 for HPHS, and the reliability analysis shows that hybrid storage always gives better coverage results for all three demands. Sensitivity analysis shows that wind speed is the key parameter that affects more both the cost of energy and water and LOLP indices. The ranking order continues with load demand, WT height and net head. Irrigation water is before domestic water only for LOLPir and LOLPhres, and temperature is the key parameter that affects the results the least. COE and COW are more affected in the single storage by the net head and the domestic water variation than in the hybrid storage, while the behavior is the same for the rest of the parameters. Concerning LOLP values, it seems that HPHS is more affected by almost all parameters with the exception of the net head, although LOLPir is also affected differently.
Results obtained by the proposed energy management strategies enhance the importance of utilizing wind potential in the energy systems of islands and the benefits of coupling with a storage system. Additionally, they provide information on the reliability of both storage models under the aspect of an economic and sensitivity analysis. This methodology is proposed for anhydrous and non-connected islands to the mainland, in order to evaluate whether a single or a hybrid storage system is preferable when coupling with wind turbines and in relation to the respective data of each island. The configuration of the hybrid pumped hydrogen storage can also promote the use of renewable energy on small islands. Both proposed algorithms, for single and hybrid storage, excel in the fact that they use an hourly step, allowing more precise observation between produced and consumed energy. Additionally, they combine all the energy demands of an island related to energy and water independence and they can easily be used for any isolated region by inserting its meteorological and demand data. At the same time, extracted results answer the critical questions of the cost and the reliability of an HRES. The algorithm’s deficiency is summarized in the fact that the results of the cost of energy and water are extracted based on current demands and without considering population and wind speed fluctuations in the future, so further research is suggested in the direction of the generation of meteorological and demand data forecasts.
Author Contributions
Conceptualization, M.M.B. and E.B.; methodology, M.M.B.; software, M.M.B.; validation, E.B.; formal analysis, M.M.B.; investigation, M.M.B.; resources, M.M.B.; data curation, M.M.B.; writing—original draft preparation, M.M.B.; writing—review and editing, M.M.B. and E.B.; visualization, M.M.B.; supervision, E.B.; funding acquisition, M.M.B. All authors have read and agreed to the published version of the manuscript.
Funding
The research work was supported by the Hellenic Foundation for Research and Innovation (HFRI) under the HFRI PhD Fellowship grant (Fellowship Number: 266).
Institutional Review Board Statement
Not applicable.
Informed Consent Statement
Not applicable.
Data Availability Statement
Data that support the findings of this study are not publicly available due to restrictions applied to them but are available from the authors upon reasonable request and with the permission of the services that provided them.
Acknowledgments
The research work was supported by the Hellenic Foundation for Research and Innovation (HFRI) under the HFRI PhD Fellowship grant (Fellowship Number: 266). Additionally, the authors are grateful for the valuable comments of the four anonymous reviewers regarding the improvement of this research work.
Conflicts of Interest
The authors declare no conflict of interest.
Nomenclature
| CAPEX | initial investment cost of the whole HRES (EUR) |
| COE | cost of energy (EUR/kWh) |
| COW | cost of water (EUR/m3) |
| replacement cost (EUR) | |
| salvage cost (EUR) | |
| energy required for the desalination of seawater (kWh) | |
| energy produced from fuel cell (kWh) | |
| produced energy from the HRES (kWh) | |
| annual load demand (kWh) | |
| uncovered demand (kWh) | |
| energy surplus (kWh) | |
| hydroenergy (kWh) | |
| unexploited energy (kWh) | |
| gravity acceleration (m/s2) | |
| net head (m) | |
| produced hydrogen by the electrolyzer (kg) | |
| roughness length parameter (m) | |
| height of weather station (m) | |
| hub height of wind turbine (m) | |
| discount rate (%) | |
| lifetime of the HRES (years) | |
| lifetime of each component (years) | |
| LOLP | loss of load probability (%) |
| number of hours | |
| electrolyzer efficiency (%) | |
| fuel cell efficiency (%) | |
| pumping efficiency (%) | |
| hydro turbine efficiency (%) | |
| operation and maintenance cost (EUR) | |
| exploitable power of the wind turbine (kW) | |
| nominal power pf the wind turbine (kW) | |
| total capacity of the hydrogen tank (kg) | |
| maximum storage capacity of the hydrogen tank (kg) | |
| minimum storage capacity of the hydrogen tank (kg) | |
| total capacity of the upper reservoir (m3) | |
| maximum storage capacity of the upper reservoir (m3) | |
| minimum storage capacity of the upper reservoir (m3) | |
| volume of stored water (m3) | |
| wind speed (m/s) | |
| wind speed in the weather station (m/s) | |
| wind speed at hub height (m/s) |
Abbreviations
| HPHS | hybrid pumped hydrogen storage system |
| HRES | hybrid renewable energy system |
| NPV | net present value |
| PHS | pumped hydro storage system |
| PV | photovoltaic module |
| RES | renewable energy sources |
| WT | wind turbine |
| Greek letter | |
| ρ | water density (kg/m3) |
| Subscripts | |
| d | domestic water |
| el | electricity |
| hres | hybrid renewable energy system |
| ir | irrigation |
References
- Potashnikov, V.; Golub, A.; Brody, M.; Lugovoy, O. Decarbonizing Russia: Leapfrogging from Fossil Fuel to Hydrogen. Energies 2022, 15, 683. [Google Scholar] [CrossRef]
- Farh, H.M.; Al-Shamma’a, A.A.; Al-Shaalan, A.M.; Alkuhayli, A.; Noman, A.M.; Kandil, T. Technical and Economic Evaluation for Off-Grid Hybrid Renewable Energy System Using Novel Bonobo Optimizer. Sustainability 2022, 14, 1533. [Google Scholar] [CrossRef]
- Ioannidis, R.; Koutsoyiannis, D. A review of land use, visibility and public perception of renewable energy in the context of landscape impact. Appl. Energy 2020, 276, 115367. [Google Scholar] [CrossRef]
- Canbulat, S.; Balci, K.; Canbulat, O.; Bayram, I.S. Techno-economic analysis of on-site energy storage units to mitigate wind energy curtailment: A case study in Scotland. Energies 2021, 14, 1691. [Google Scholar] [CrossRef]
- Finnegan, W.; Jiang, Y.; Dumergue, N.; Davies, P.; Goggins, J. Investigation and validation of numerical models for composite wind turbine blades. J. Mar. Sci. Eng. 2021, 9, 525. [Google Scholar] [CrossRef]
- Subramanian, S.; Sankaralingam, C.; Elavarasan, R.M.; Vijayaraghavan, R.R.; Raju, K.; Mihet-Popa, L. An evaluation on wind energy potential using multi-objective optimization based non-dominated sorting genetic algorithm III. Sustainability 2021, 13, 410. [Google Scholar] [CrossRef]
- National Energy and Climate Plan. Available online: https://ec.europa.eu/energy/sites/ener/files/el_final_necp_main_en.pdf (accessed on 10 February 2022).
- Olabi, A.G.; Wilberforce, T.; Elsaid, K.; Salameh, T.; Sayed, E.T.; Husain, K.S.; Abdelkareem, M.A. Selection guidelines for wind energy technologies. Energies 2021, 14, 3244. [Google Scholar] [CrossRef]
- Baldinelli, A.; Barelli, L.; Bidini, G.; Cinti, G.; Di Michele, A.; Mondi, F. How to power the energy–water nexus: Coupling desalination and hydrogen energy storage in mini-grids with reversible solid oxide cells. Processes 2020, 8, 1494. [Google Scholar] [CrossRef]
- Das, P.; Das, B.K.; Mustafi, N.N.; Sakir, M.T. A review on pump-hydro storage for renewable and hybrid energy systems applications. Energy Storage 2021, 3, e223. [Google Scholar] [CrossRef]
- Alturki, F.A.; Awwad, E.M. Sizing and Cost Minimization of Standalone Hybrid WT/PV/Biomass/Pump-Hydro Storage-Based Energy Systems. Energies 2021, 14, 489. [Google Scholar] [CrossRef]
- Eisapour, A.H.; Jafarpur, K.; Farjah, E. Feasibility study of a smart hybrid renewable energy system to supply the electricity and heat demand of Eram Campus, Shiraz University; simulation, optimization, and sensitivity analysis. Energy Convers. Manag. 2021, 248, 114779. [Google Scholar] [CrossRef]
- Islam, M.S.; Das, B.K.; Das, P.; Rahaman, M.H. Techno-economic optimization of a zero emission energy system for a coastal community in Newfoundland, Canada. Energy 2021, 220, 119709. [Google Scholar] [CrossRef]
- Nassar, Y.F.; Abdunnabi, M.J.; Sbeta, M.N.; Hafez, A.A.; Amer, K.A.; Ahmed, A.Y.; Belgasim, B. Dynamic analysis and sizing optimization of a pumped hydroelectric storage-integrated hybrid PV/Wind system: A case study. Energy Convers. Manag. 2021, 229, 113744. [Google Scholar] [CrossRef]
- Yue, M.; Lambert, H.; Pahon, E.; Roche, R.; Jemei, S.; Hissel, D. Hydrogen energy systems: A critical review of technologies, applications, trends and challenges. Renew. Sust. Energ. Rev. 2021, 146, 111180. [Google Scholar] [CrossRef]
- Yu, M.; Wang, K.; Vredenburg, H. Insights into low-carbon hydrogen production methods: Green, blue and aqua hydrogen. Int. J. Hydrog. Energy 2021, 46, 21261–21273. [Google Scholar] [CrossRef]
- Kakoulaki, G.; Kougias, I.; Taylor, N.; Dolci, F.; Moya, J.; Jäger-Waldau, A. Green hydrogen in Europe–A regional assessment: Substituting existing production with electrolysis powered by renewables. Energy Convers. Manag. 2021, 228, 113649. [Google Scholar] [CrossRef]
- Elberry, A.M.; Thakur, J.; Santasalo-Aarnio, A.; Larmi, M. Large-scale compressed hydrogen storage as part of renewable electricity storage systems. Int. J. Hydrog. Energy 2021, 46, 15671–15690. [Google Scholar] [CrossRef]
- Hinokuma, T.; Farzaneh, H.; Shaqour, A. Techno-economic analysis of a fuzzy logic control based hybrid renewable energy system to power a university campus in Japan. Energies 2021, 14, 1960. [Google Scholar] [CrossRef]
- Ceran, B.; Mielcarek, A.; Hassan, Q.; Teneta, J.; Jaszczur, M. Aging effects on modelling and operation of a photovoltaic system with hydrogen storage. Appl. Energy 2021, 297, 117161. [Google Scholar] [CrossRef]
- Rezaei, M.; Naghdi-Khozani, N.; Jafari, N. Wind energy utilization for hydrogen production in an underdeveloped country: An economic investigation. Renew. Energy 2020, 147, 1044–1057. [Google Scholar] [CrossRef]
- Makhdoomi, S.; Askarzadeh, A. Impact of solar tracker and energy storage system on sizing of hybrid energy systems: A comparison between diesel/PV/PHS and diesel/PV/FC. Energy 2021, 231, 120920. [Google Scholar] [CrossRef]
- Ghenai, C.; Salameh, T.; Merabet, A. Technico-economic analysis of off grid solar PV/Fuel cell energy system for residential community in desert region. Int. J. Hydrog. Energy 2020, 45, 11460–11470. [Google Scholar] [CrossRef]
- Sultan, H.M.; Menesy, A.S.; Kamel, S.; Korashy, A.; Almohaimeed, S.A.; Abdel-Akher, M. An improved artificial ecosystem optimization algorithm for optimal configuration of a hybrid PV/WT/FC energy system. Alex. Eng. J. 2021, 60, 1001–1025. [Google Scholar] [CrossRef]
- Bertsiou, M.M.; Baltas, E. Management of energy and water resources by minimizing the rejected renewable energy. Sustain. Energy Technol. Assess. 2022, 52, 102002. [Google Scholar] [CrossRef]
- Dambone Sessa, S.; Tortella, A.; Andriollo, M.; Benato, R. Li-ion battery-flywheel hybrid storage system: Countering battery aging during a grid frequency regulation service. Appl. Sci. 2018, 8, 2330. [Google Scholar] [CrossRef] [Green Version]
- Javed, K.; Ashfaq, H.; Singh, R.; Hussain, S.M.; Ustun, T.S. Design and performance analysis of a stand-alone PV system with hybrid energy storage for rural India. Electronics 2019, 8, 952. [Google Scholar] [CrossRef] [Green Version]
- Marocco, P.; Ferrero, D.; Lanzini, A.; Santarelli, M. The role of hydrogen in the optimal design of off-grid hybrid renewable energy systems. J. Energy Storage 2022, 46, 103893. [Google Scholar] [CrossRef]
- Ferrario, A.M.; Bartolini, A.; Manzano, F.S.; Vivas, F.J.; Comodi, G.; McPhail, S.J.; Andujar, J.M. A model-based parametric and optimal sizing of a battery/hydrogen storage of a real hybrid microgrid supplying a residential load: Towards island operation. Adv. Appl. Energy 2021, 3, 100048. [Google Scholar] [CrossRef]
- Akter, H.; Howlader, H.O.R.; Nakadomari, A.; Islam, M.; Saber, A.Y.; Senjyu, T. A Short Assessment of Renewable Energy for Optimal Sizing of 100% Renewable Energy Based Microgrids in Remote Islands of Developing Countries: A Case Study in Bangladesh. Energies 2022, 15, 1084. [Google Scholar] [CrossRef]
- Kefif, N.; Melzi, B.; Hashemian, M.; Assad, M.E.H.; Hoseinzadeh, S. Feasibility and optimal operation of micro energy hybrid system (hydro/wind) in the rural valley region. Int. J. Low Carbon Technol. 2022, 17, 58–68. [Google Scholar] [CrossRef]
- Canales, F.A.; Jurasz, J.K.; Guezgouz, M.; Beluco, A. Cost-reliability analysis of hybrid pumped-battery storage for solar and wind energy integration in an island community. Sustain. Energy Technol. Assess. 2021, 44, 101062. [Google Scholar] [CrossRef]
- Lata-García, J.; Jurado, F.; Fernández-Ramírez, L.M.; Sánchez-Sainz, H. Optimal hydrokinetic turbine location and techno-economic analysis of a hybrid system based on photovoltaic/hydrokinetic/hydrogen/battery. Energy 2018, 159, 611–620. [Google Scholar] [CrossRef]
- Phan, B.C.; Lai, Y.C. Control strategy of a hybrid renewable energy system based on reinforcement learning approach for an isolated microgrid. Appl. Sci. 2019, 9, 4001. [Google Scholar] [CrossRef] [Green Version]
- Dawood, F.; Shafiullah, G.M.; Anda, M. Stand-alone microgrid with 100% renewable energy: A case study with hybrid solar PV-battery-hydrogen. Sustainability 2020, 12, 2047. [Google Scholar] [CrossRef] [Green Version]
- Kaldellis, J.K.; Zafirakis, D. Prospects and challenges for clean energy in European Islands. The TILOS paradigm. Renew. Energy 2020, 145, 2489–2502. [Google Scholar] [CrossRef]
- Myronidis, D.; Nikolaos, T. Changes in climatic patterns and tourism and their concomitant effect on drinking water transfers into the region of South Aegean, Greece. Stoch. Environ. Res. Risk Assess. 2021, 35, 1725–1739. [Google Scholar] [CrossRef]
- Rezaei, M.; Mostafaeipour, A.; Jafari, N.; Naghdi-Khozani, N.; Moftakharzadeh, A. Wind and solar energy utilization for seawater desalination and hydrogen production in the coastal areas of southern Iran. J. Eng. Des. Technol. 2020, 18, 1951–1969. [Google Scholar] [CrossRef]
- Gude, V.G. Desalination and sustainability–an appraisal and current perspective. Water Res. 2016, 89, 87–106. [Google Scholar] [CrossRef]
- Alkaisi, A.; Mossad, R.; Sharifian-Barforoush, A. A review of the water desalination systems integrated with renewable energy. Energy Procedia 2017, 110, 268–274. [Google Scholar] [CrossRef]
- Fornarelli, R.; Shahnia, F.; Anda, M.; Bahri, P.A.; Ho, G. Selecting an economically suitable and sustainable solution for a renewable energy-powered water desalination system: A rural Australian case study. Desalination 2018, 435, 128–139. [Google Scholar] [CrossRef]
- Bertsiou, M.; Feloni, E.; Karpouzos, D.; Baltas, E. Water management and electricity output of a hybrid renewable energy system (HRES) in Fournoi island in Aegean Sea. Renew. Energ. 2018, 118, 790–798. [Google Scholar] [CrossRef]
- Stoyanov, L.; Bachev, I.; Zarkov, Z.; Lazarov, V.; Notton, G. Multivariate Analysis of a Wind–PV-Based Water Pumping Hybrid System for Irrigation Purposes. Energies 2021, 14, 3231. [Google Scholar] [CrossRef]
- Ajiwiguna, T.A.; Lee, G.R.; Lim, B.J.; Cho, S.H.; Park, C.D. Optimization of battery-less PV-RO system with seasonal water storage tank. Desalination 2021, 503, 114934. [Google Scholar] [CrossRef]
- Das, P.; Das, B.K.; Rahman, M.; Hassan, R. Evaluating the prospect of utilizing excess energy and creating employments from a hybrid energy system meeting electricity and freshwater demands using multi-objective evolutionary algorithms. Energy 2022, 238, 121860. [Google Scholar] [CrossRef]
- Blaney, H.F.; Criddle, W.D. Determining Consumptive Use and Irrigation Water Requirements (No. 1275); US Department of Agriculture: Washington, DC, USA, 1962.
- Lagouvardos, K.; Kotroni, V.; Bezes, A.; Koletsis, I.; Kopania, T.; Lykoudis, S.; Mazarakis, N.; Papagiannaki, K.; Vougioukas, S. The automatic weather stations NOANN network of the National Observatory of Athens: Operation and database. Geosci. Data J. 2017, 4, 4–16. [Google Scholar] [CrossRef]
- ENERCON Product Overview. Available online: https://www.enercon.de/fileadmin/Redakteur/Medien-Portal/broschueren/pdf/en/ENERCON_Produkt_en_06_2015.pdf (accessed on 3 May 2022).
- Bertsiou, M.M.; Theochari, A.P.; Baltas, E. Multi-criteria analysis and geographic information systems methods for wind turbine siting in a North Aegean island. Energy Sci. Eng. 2021, 9, 4–18. [Google Scholar] [CrossRef]
- Van Sark, W.G.; Van der Velde, H.C.; Coelingh, J.P.; Bierbooms, W.A. Do we really need rotor equivalent wind speed? Wind Energy 2019, 22, 745–763. [Google Scholar] [CrossRef] [Green Version]
- Simão, M.; Ramos, H.M. Hybrid pumped hydro storage energy solutions towards wind and PV integration: Improvement on flexibility, reliability and energy costs. Water 2020, 12, 2457. [Google Scholar] [CrossRef]
- Rievaj, V.; Gaňa, J.; Synák, F. Is hydrogen the fuel of the future? Transp. Res. Proc. 2019, 40, 469–474. [Google Scholar] [CrossRef]
- Hausmann, J.N.; Schlögl, R.; Menezes, P.W.; Driess, M. Is direct seawater splitting economically meaningful? Energy Environ. Sci. 2021, 14, 3679–3685. [Google Scholar] [CrossRef]
- Abdelshafy, A.M.; Hassan, H.; Jurasz, J. Optimal design of a grid-connected desalination plant powered by renewable energy resources using a hybrid PSO–GWO approach. Energy Convers. Manag. 2018, 173, 331–347. [Google Scholar] [CrossRef]
- Rajalakshmi, N.; Jafri, R.I.; Dhathathreyan, K.S. Electrocatalysts for Low Temperature Fuel Cells, Fundamentals and Recent Trends; Wiley-VCH Verlag GmbH & Co., KGaA: Weinheim, Germany, 2017; pp. 35–74. [Google Scholar]
- Robinius, M.; Raje, T.; Nykamp, S.; Rott, T.; Müller, M.; Grube, T.; Katzenbach, B.; Küppers, S.; Stolten, D. Power-to-Gas: Electrolyzers as an alternative to network expansion–An example from a distribution system operator. Appl. Energy 2018, 210, 182–197. [Google Scholar] [CrossRef]
- Bhandari, B.; Lee, K.T.; Lee, G.Y.; Cho, Y.M.; Ahn, S.H. Optimization of hybrid renewable energy power systems: A review. Int. J. Precis. Eng. Manuf. Green Technol. 2015, 2, 99–112. [Google Scholar] [CrossRef]
- Rezk, H.; Sayed, E.T.; Al-Dhaifallah, M.; Obaid, M.; Abou Hashema, M.; Abdelkareem, M.A.; Olabi, A.G. Fuel cell as an effective energy storage in reverse osmosis desalination plant powered by photovoltaic system. Energy 2019, 175, 423–433. [Google Scholar] [CrossRef] [Green Version]
- Ma, T.; Javed, M.S. Integrated sizing of hybrid PV-wind-battery system for remote island considering the saturation of each renewable energy resource. Energy Convers. Manag. 2019, 182, 178–190. [Google Scholar] [CrossRef]
- Baruah, A.; Basu, M.; Amuley, D. Modeling of an autonomous hybrid renewable energy system for electrification of a township: A case study for Sikkim, India. Renew. Sustain. Energy Rev. 2021, 135, 110158. [Google Scholar] [CrossRef]
- He, Y.; Guo, S.; Zhou, J.; Wu, F.; Huang, J.; Pei, H. The quantitative techno-economic comparisons and multi-objective capacity optimization of wind-photovoltaic hybrid power system considering different energy storage technologies. Energy Convers. Manag. 2021, 229, 113779. [Google Scholar] [CrossRef]
Figure 1.
Monthly demands for electricity load and electricity for desalination of domestic and irrigation water supply.
Figure 1.
Monthly demands for electricity load and electricity for desalination of domestic and irrigation water supply.

Figure 2.
The power curve of Enercon E-44 wind turbine.

Figure 3.
Schematic representation of the HRES: (a) with PHS; (b) with HPHS.

Figure 4.
Produced energy of Enercon E-900 wind turbines of case study and measured wind speeds at Fournoi weather station.
Figure 4.
Produced energy of Enercon E-900 wind turbines of case study and measured wind speeds at Fournoi weather station.

Figure 5.
Reliability analysis of PHS and HPHS.

Figure 6.
Share of energy in PHS by WT, PHS, FC and GRID for: (a) domestic water; (b) irrigation water; (c) electrical load.
Figure 6.
Share of energy in PHS by WT, PHS, FC and GRID for: (a) domestic water; (b) irrigation water; (c) electrical load.

Figure 7.
Share of energy in HPHS by WT, PHS, FC and GRID for: (a) domestic water; (b) irrigation water; (c) electrical load.
Figure 7.
Share of energy in HPHS by WT, PHS, FC and GRID for: (a) domestic water; (b) irrigation water; (c) electrical load.

Figure 8.
Energy for pumping and electrolyzer in HPHS.

Figure 9.
Storage level in HPHS for the reservoir and the hydrogen tank.

Figure 10.
Share of energy in PHS for demands in: (a) August; (b) December.

Figure 11.
Share of energy in HPHS for demands in: (a) August; (b) December.

Figure 12.
Sensitivity analysis for installation height of: (a) wind turbines; (b) upper reservoir.

Figure 13.
Sensitivity analysis for variation of meteorological data: (a) wind speed; (b) temperature.
Figure 13.
Sensitivity analysis for variation of meteorological data: (a) wind speed; (b) temperature.

Figure 14.
Sensitivity analysis for variation of demands: (a) domestic water; (b) irrigation water; (c) electricity.
Figure 14.
Sensitivity analysis for variation of demands: (a) domestic water; (b) irrigation water; (c) electricity.


Table 1.
Economic Parameters.
| Component | Parameter | Value (unit) |
|---|---|---|
| WT [60] | Initial cost (EUR/kW) | 906 |
| Operation and maintenance cost (EUR/kW) | 136 | |
| Lifetime (years) | 25 | |
| Reservoir [61] | Initial cost (EUR/m3) | 154 |
| Operation and maintenance cost (EUR/m3) | 3.1 | |
| Lifetime (years) | 35 | |
| Hydro turbine [61] | Initial cost (EUR/kW) | 910 |
| Operation and maintenance cost (EUR/kW) | 18 | |
| Replacement cost (EUR/kW) | 910 | |
| Lifetime (years) | 10 | |
| Pumping station [61] | Initial cost (EUR/kW) | 217 |
| Operation and maintenance cost (EUR/kW) | 4.35 | |
| Replacement cost (EUR/kW) | 217 | |
| Lifetime (years) | 20 | |
| Hydrogen tank [54] | Initial cost (EUR/kg) | 1182 |
| Operation and maintenance cost (EUR/kg) | 13.6 | |
| Replacement cost (EUR/kW) | 1092 | |
| Lifetime (years) | 20 | |
| Electrolyzer [54] | Initial cost (EUR/kW) | 606 |
| Operation and maintenance cost (EUR/kW) | 1.8 | |
| Replacement cost (EUR/kW) | 455 | |
| Lifetime (years) | 5 | |
| Fuell cell [54] | Initial cost (EUR/kW) | 910 |
| Operation and maintenance cost (EUR/kW) | 0.02 | |
| Lifetime (years) | 25 | |
| Desalination unit [54] | Initial cost (EUR/m3/day) | 484 |
| Operation and maintenance cost (EUR/m3/day) | 0.32 |
Table 2.
Economic and reliability analysis.
| Key Parameter | PHS | HPHS |
|---|---|---|
| COE | 0.287 | 0.360 |
| COW | 1.680 | 2.108 |
| LOLPhres | 22.65 | 19.47 |
| LOLPel | 23.57 | 20.23 |
| LOLPd | 13.41 | 11.69 |
| LOLPir | 22.84 | 19.73 |
Publisher’s Note: MDPI stays neutral with regard to jurisdictional claims in published maps and institutional affiliations. |
© 2022 by the authors. Licensee MDPI, Basel, Switzerland. This article is an open access article distributed under the terms and conditions of the Creative Commons Attribution (CC BY) license (https://creativecommons.org/licenses/by/4.0/).
Share and Cite
MDPI and ACS Style
Bertsiou, M.M.; Baltas, E. Power to Hydrogen and Power to Water Using Wind Energy. Wind 2022, 2, 305-324. https://doi.org/10.3390/wind2020017
AMA Style
Bertsiou MM, Baltas E. Power to Hydrogen and Power to Water Using Wind Energy. Wind. 2022; 2(2):305-324. https://doi.org/10.3390/wind2020017
Chicago/Turabian StyleBertsiou, Maria Margarita, and Evangelos Baltas. 2022. "Power to Hydrogen and Power to Water Using Wind Energy" Wind 2, no. 2: 305-324. https://doi.org/10.3390/wind2020017