
Thermal Characteristics of a Beaver Dam Analogues Equipped Spring-Fed Creek in the Canadian Rockies


Department of Geography and Planning, Centre for Hydrology, University of Saskatchewan, Saskatoon, SK S7N 5C8, Canada
*
Author to whom correspondence should be addressed.
Water 2021, 13(7), 990; https://doi.org/10.3390/w13070990
Submission received: 24 February 2021
/
Revised: 29 March 2021
/
Accepted: 1 April 2021
/
Published: 3 April 2021
(This article belongs to the Special Issue Ecosystem Functioning in Rivers and Riparian Zones)
Abstract
:Beaver dam analogues (BDAs) are becoming an increasingly popular stream restoration technique. One ecological function BDAs might help restore is suitable habitat conditions for fish in streams where loss of beaver dams and channel incision has led to their decline. A critical physical characteristic for fish is stream temperature. We examined the thermal regime of a spring-fed Canadian Rocky Mountain stream in relation to different numbers of BDAs installed in series over three study periods (April–October; 2017–2019). While all BDA configurations significantly influenced stream and pond temperatures, single- and double-configuration BDAs incrementally increased stream temperatures. Single and double configuration BDAs warmed the downstream waters of mean maxima of 9.9, 9.3 °C by respective mean maxima of 0.9 and 1.0 °C. Higher pond and stream temperatures occurred when ponding and discharge decreased, and vice versa. In 2019, variation in stream temperature below double-configuration BDAs was lower than the single-configuration BDA. The triple-configuration BDA, in contrast, cooled the stream, although the mean maximum stream temperature was the highest below these structures. Ponding upstream of BDAs increased discharge and resulted in cooling of the stream. Rainfall events sharply and transiently reduced stream temperatures, leading to a three-way interaction between BDA configuration, rainfall and stream discharge as factors co-influencing the stream temperature regime. Our results have implications for optimal growth of regionally important and threatened bull and cutthroat trout fish species.
1. Introduction
Beavers (Caster canadensis and C. fiber) are ubiquitously considered as aquatic ecosystem engineers in recognition of the ecosystem functions provided by their dams [1,2,3,4]. Changes in the streamflow regime can lead to channel aggradation [5,6]. In streams from which beavers have been lost via removal or relocation, channels incise and riparian areas ecologically degrade [7,8]. When streams have degraded to the point that they are inhospitable for beavers, beaver dam analogues (BDAs) are used as a low-cost, low-tech restoration solutions [9,10,11,12]. BDAs can be installed in a variety of configurations, ranging from individual structures to multiple structures in sequence [13,14], the goal of which is ensuring some BDAs persist following larger flow events [4].
One critical restoration priority for degraded streams is the moderation of high water temperatures [12]. Temperature is a key environmental variable regulating phenology, metabolism, and acclimation of aquatic species [15,16,17] including cold-water fish [18]. Streams that are degraded have higher temperatures [19,20] that may severely limit the life processes of cold-water fish or result in mortality due to the high cost of metabolic maintenance [21]. In the Canadian Rocky Mountains, westslope cutthroat trout (Oncorhynchus clarki lewisi) and bull trout (Salvelinus confluentus) are recognized as threatened species [22,23]. The thermal tolerance range of both fish species is 8 to 19 °C, with sustained temperatures >19.6 °C identified as lethal [18,24].
BDAs, similar to beaver dams, pool stream water and enhance groundwater-surface water interactions [25]. These ecohydrological changes can impact the overall stream temperature regime. The literature describing how beaver dams and BDAs influence the thermal regime of streams is sparse and inconsistent. Some studies conclude that beaver dams increase overall downstream temperature [18,26], with increases ranging from as little as 0.4 °C to 3.6 °C [27,28,29] to as much as 7.0 °C [30]. Other studies come to mixed conclusions on whether dams warm or cool streams, citing dam height as an important distinguishing factor. Fuller and Peckarsky [31], for example, reported that downstream warming occurred below low dams and under low stream velocity compared to cooling that occurred below high-headed dams and under higher stream velocity conditions. Other studies have reported cooling downstream beaver dam complexes [28]. A study at Bridge Creek, Oregon for example, reported that BDAs buffered summer stream temperature extremes and created temperature refugia important for salmonoids [20]. Further, Lautz et al. [32] argued that ponding by BDAs may increase downstream surface area and subsequently temperature; however, surface water-groundwater exchanges around BDA and associated increased vegetation shading may lead to lower and less variable stream temperatures.
What the research on BDAs indicates is that a deeper understanding of how they influence various hydrologically and ecologically important processes is needed, including the thermal regime of streams. Studying the process responses of BDAs in different climates and hydrogeomorphic settings and comparing results will aid in developing guidance for practitioners on how to best use this stream restoration tool. Thus, the goal of our study was to evaluate the effects of different BDA configurations on the stream temperature regime. We hypothesized that the stream would be warmed by the use of BDAs, and that the warming effect would be magnified by installing a greater number of BDAs in sequence. Study results will be useful for those in management who may be considering the installation of BDAs, especially on streams that provide habitat to temperature-sensitive fish species.
2. Materials and Methods
2.1. Study Area
The study was conducted in Ann and Sandy Cross Conservation Area (ASCCA), a 19.4 km2 nature preserve of the rolling foothills of the Canadian Rocky Mountains in western Alberta. There are several perennial springs on ASCCA which drain eastward on Pine Creek to Fish Creek, which is a tributary of the Bow River. Dominant hydrogeology of the area is comprised of Paskapoo formation, which is an extensive fluvial sandstone and mudstone complex in the Western Canadian sedimentary basin and reported to support more groundwater wells than any other aquifer system in the Canadian Prairies [33]. The overstory comprises trembling aspen (Populus tremuloides), balsam poplar (Populus balsamifera), blue spruce (Picea pungens), white spruce (Picea glauca), flowering almond (Prunus triloba), lodgepole pine (Pinus contorta), mugo pine (Pinus mugo), paper birch (Betula papynifera), Siberian crabapple (Malus baccata) and water birch (Betula occidentalis). The understory comprises prickly rose (Rosa acicularis) and snowberry (Symphoricarpos albus) shrubs mixed with bluejoint (Calamagrostis canadensis), smooth brome (Bromus inermis ssp. Inermis), small bottle sedge (Carexutriculata) and northern reed (Calamagrostis stricata spp. Inexpansa) [25]. Thirty-year (1981–2010) mean seasonal (May–October) air temperature (T_air) and precipitation normals in the region are 12.2 °C and 63.5 mm, respectively.
Historically, Pine Creek, the upstream reach of Fish Creek, has been a beaver habitat [34]; remnant beaver dams along Pine Creek are still visible. Southern arm of the Pine Creek once had a trout farm. An electrofishing survey [35] found that the two most abundant native trout species in the Fish Creek were westslope cutthroat trout (Oncorhynchus clarkii lewisi) and bull trout (Salvelinus confluentus). Beavers were lost from the area by the early 1990s because of illegal trapping or relocation (G. Shyba, pers. comm.). In the absence of beaver, Pine Creek has degraded—the stream is incised, and Salix spp. shrubs are either dead or severely degraded. The fish population in the lower Bow River fell by an average of 46.5% during 2003–2013 in response to the potential stressors of whirling disease, flooding, and release mortality [36]. The Alberta Institute for Wildlife Conservation in collaboration with site management attempted to rewild ASCCA with the native beaver species; a pair of beavers was introduced on 18 May 2016 [37] but not to Pine Creek.
2.2. Methods
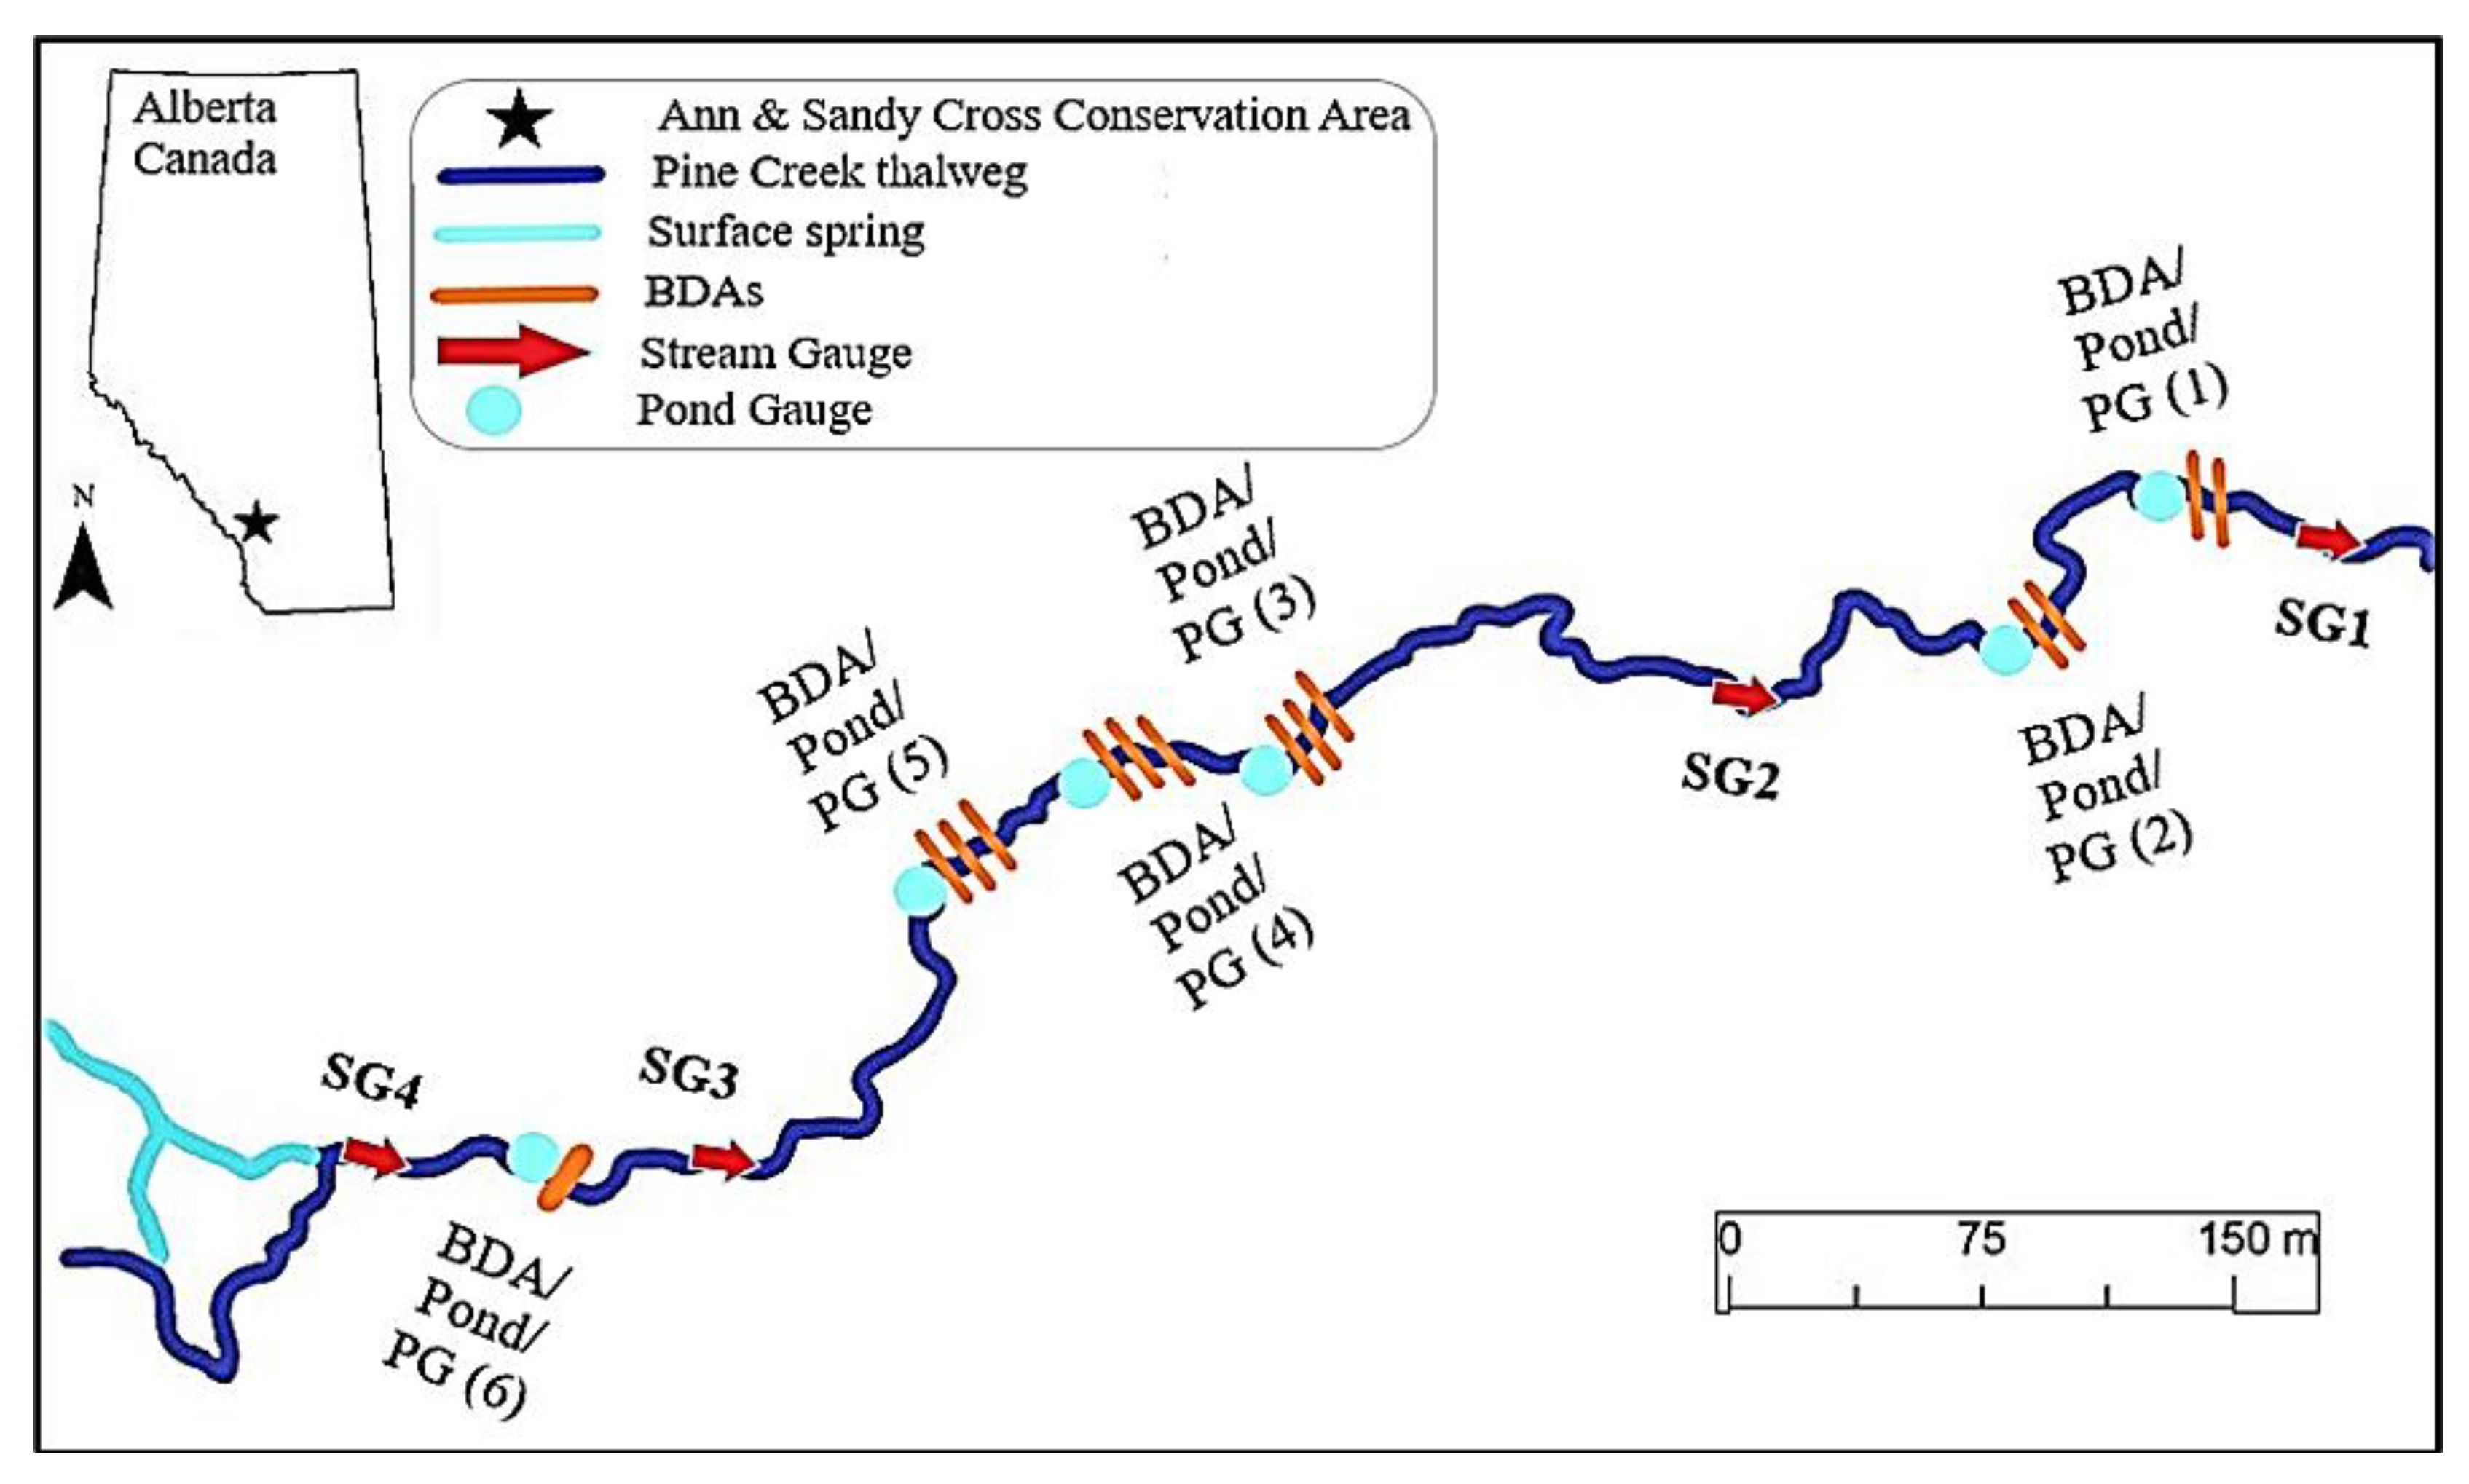
We studied a 1075-m long reach of the north arm of Pine Creek in the ice-free period of May-October in 2017, 2018 and 2019. The reach has an average stream width of 0.63 m, an approximate elevation of 1150 m (asl) and N–W and W–E slopes of 0.21% and 1.22%, respectively. A total of six BDA structures were installed in the study reach 3–9 August in 2018. The BDAs were in single (BDA6), double (BDA2, BDA1) and triple (BDA5, BDA4, BDA3) configurations. Further details on BDA construction, materials and installation are explained by Munir and Westbrook [25].
Stream temperature and stage were monitored at four locations in the study reach in the thalweg, starting in May 2018. Four stream gauges (SG4–SG1; stage at each measured with a levelogger junior 3001, Solinst, ON, Canada) were installed such that SG4 was at the upstream of BDA6 and SG3–SG1 were installed downstream of each of the three BDA configurations (Figure 1). Stage was converted to discharge using a rating curve. Streamflow data were also measured in 2017 before the BDAs were installed, but only at SG1. The stream stage and temperature at each SG were measured at 15-min intervals, corrected for barometric pressure, and averaged by the three BDA configurations.
Temperature and level in the deepest part of the ponds formed by each of the six BDAs (PG6–PG1) were measured during April–August 2019 with automatic loggers (levelogger junior 3001, Solinst, ON, Canada) housed in perforated PVC pipes (length = 1.0 m; diameter = 0.035 m) inserted into the stream bed [18,26]. Observations were collected at 15-min intervals, levels were corrected for barometric pressure, and levels and temperature were averaged by the three BDA configurations. Rainfall observations were obtained from the nearest Alberta Environment and Parks rain gauge at Priddis (Alberta station ID 3033505), located 7.5 km west of the study reach at 1371 m elevation.
2.3. Data Analysis
SPSS 26.0 package (SPSS, Chicago, IL, USA) was used for statistical analyses Landau and Everitt [38]. Two separate linear mixed-effects models (LMEM) were performed to predict the fluctuations in stream and pond temperatures in response to the fixed effects of BDA-configuration (single, double, triple), stream discharge, rainfall and BDA pond level. A random effect of BDA configuration was used to test the effects of upstream/downstream configurations on the predictor and outcome variables. It was assured that any significant interactions between rainfall and other predictors (stream discharge, BDA pond level) were not only the result of collinearity. A compound symmetry covariance structure was used in all LMEM applications. Daily mean changes in stream temperature values (ΔT) were obtained by subtracting daily downstream values from corresponding upstream values; these data were used in the model. Before analyses, all data were tested for normality and homogeneity of variance using the Kolmogorov–Smirnov test and Levene’s test, respectively. Regressions and 1:1 fit (s) were performed to validate the models developed. A significance level of 95% (p < 0.05) and/or LogWorth (-log10(p); p < 0.01) was used. The goodness of fit was reported as R2 value. Temporally paired t-tests were used to compare stream temperatures before and after BDA installations. One-way analysis of variance (ANOVA) and/or Tukey’s Post hoc test were used, when needed, to explain differences in stream or pond maximum temperatures (Tmax) for different BDA configurations. The Holm–Sidak method was used to test the differences in means when the data used was not normally distributed. The downstream—upstream difference in temperature (ΔT) for the three BDA configurations were obtained by using the raw temperatures logged at 15-minute intervals across the study reach/years; these data were used for drawing density curves for ΔT.
3. Results
Mean seasonal (May–October) air temperature for the 2017-18-19 study years fell linearly from 12.3 to 11.7 to 11.5 °C, respectively, coincident with decreases in maximum air temperatures from 20.9 to 17.8 to 17.2 °C. However, seasonal minimum temperature increased in the study years from 3.7 to 5.6 to 5.8 °C. Seasonal rainfall was lowest (160 mm) in 2017, higher in 2018 (277 mm) and highest in 2019 (317 mm). Rainfall influenced T_air during storm events (Figure 2; ANOVA: F1,169 = 5.73, p = 0.018, R2 = 0.03). T_air had a significant influence on the overall stream temperature both pre- (ANOVA: F1,70 = 159.44, p < 0.001, R2 = 0.80) and post-BDA (ANOVA: F1,169 = 350.40, p < 0.001, R2 = 0.68) installations.
3.1. Stream Temperature
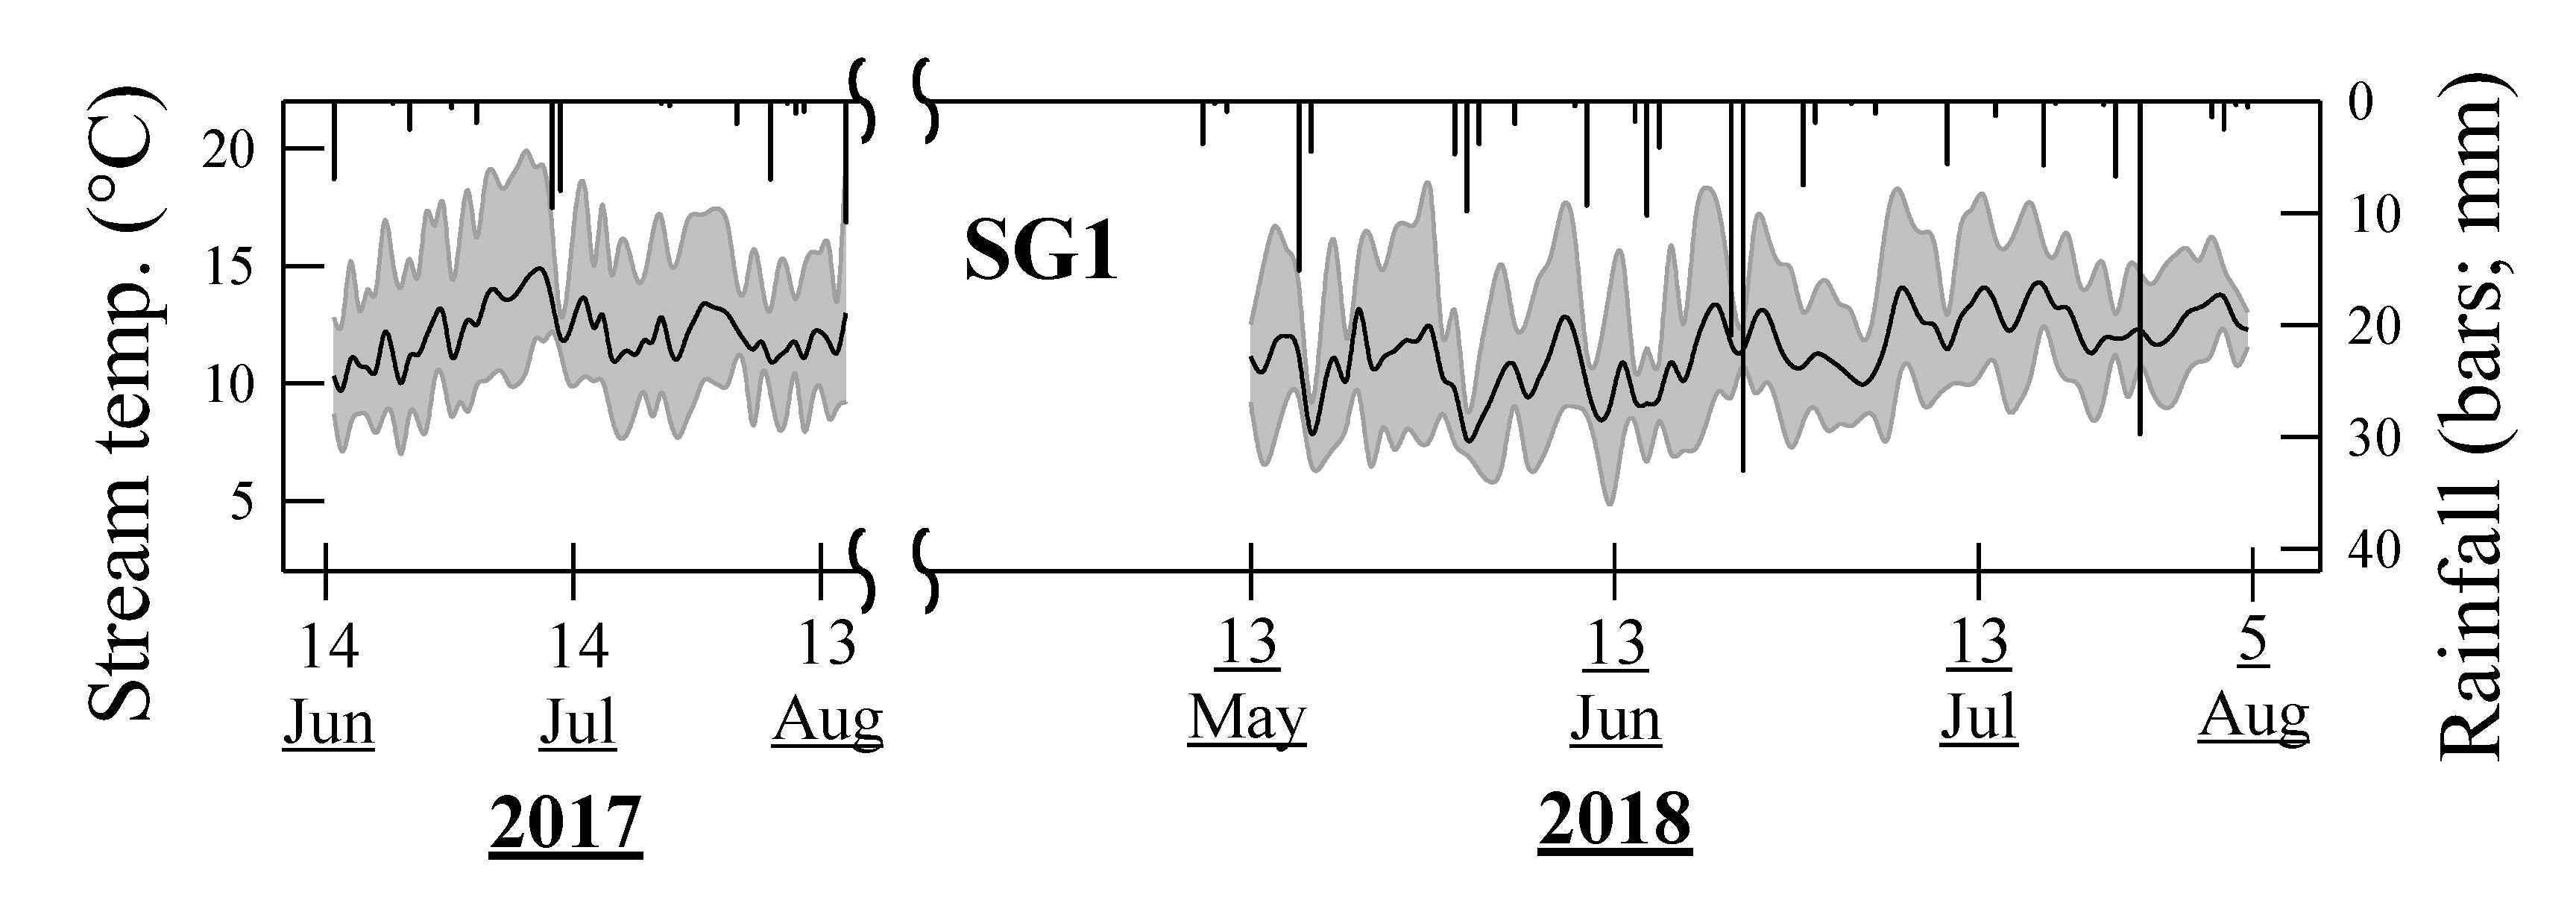
Before BDAs installation (2017), mean daily stream temperature at SG1 was 12.0 °C with a daily average range of 9.2–15.8 °C during June 4-August 4 (Figure 2). In 2018, mean daily temperature was cooler by 0.2 (11.8 °C) with an average daily thermal variation of 9.2–14.9 °C for the same period, before BDA installation. No difference in thermal variation between the two years was found (ANOVA: F1,102 = 0.45, p = 0.499). Rainfall had only a weak effect on stream temperature (ANOVA: F1,302 = 686.37, p < 0.001, R2 = 0.02).
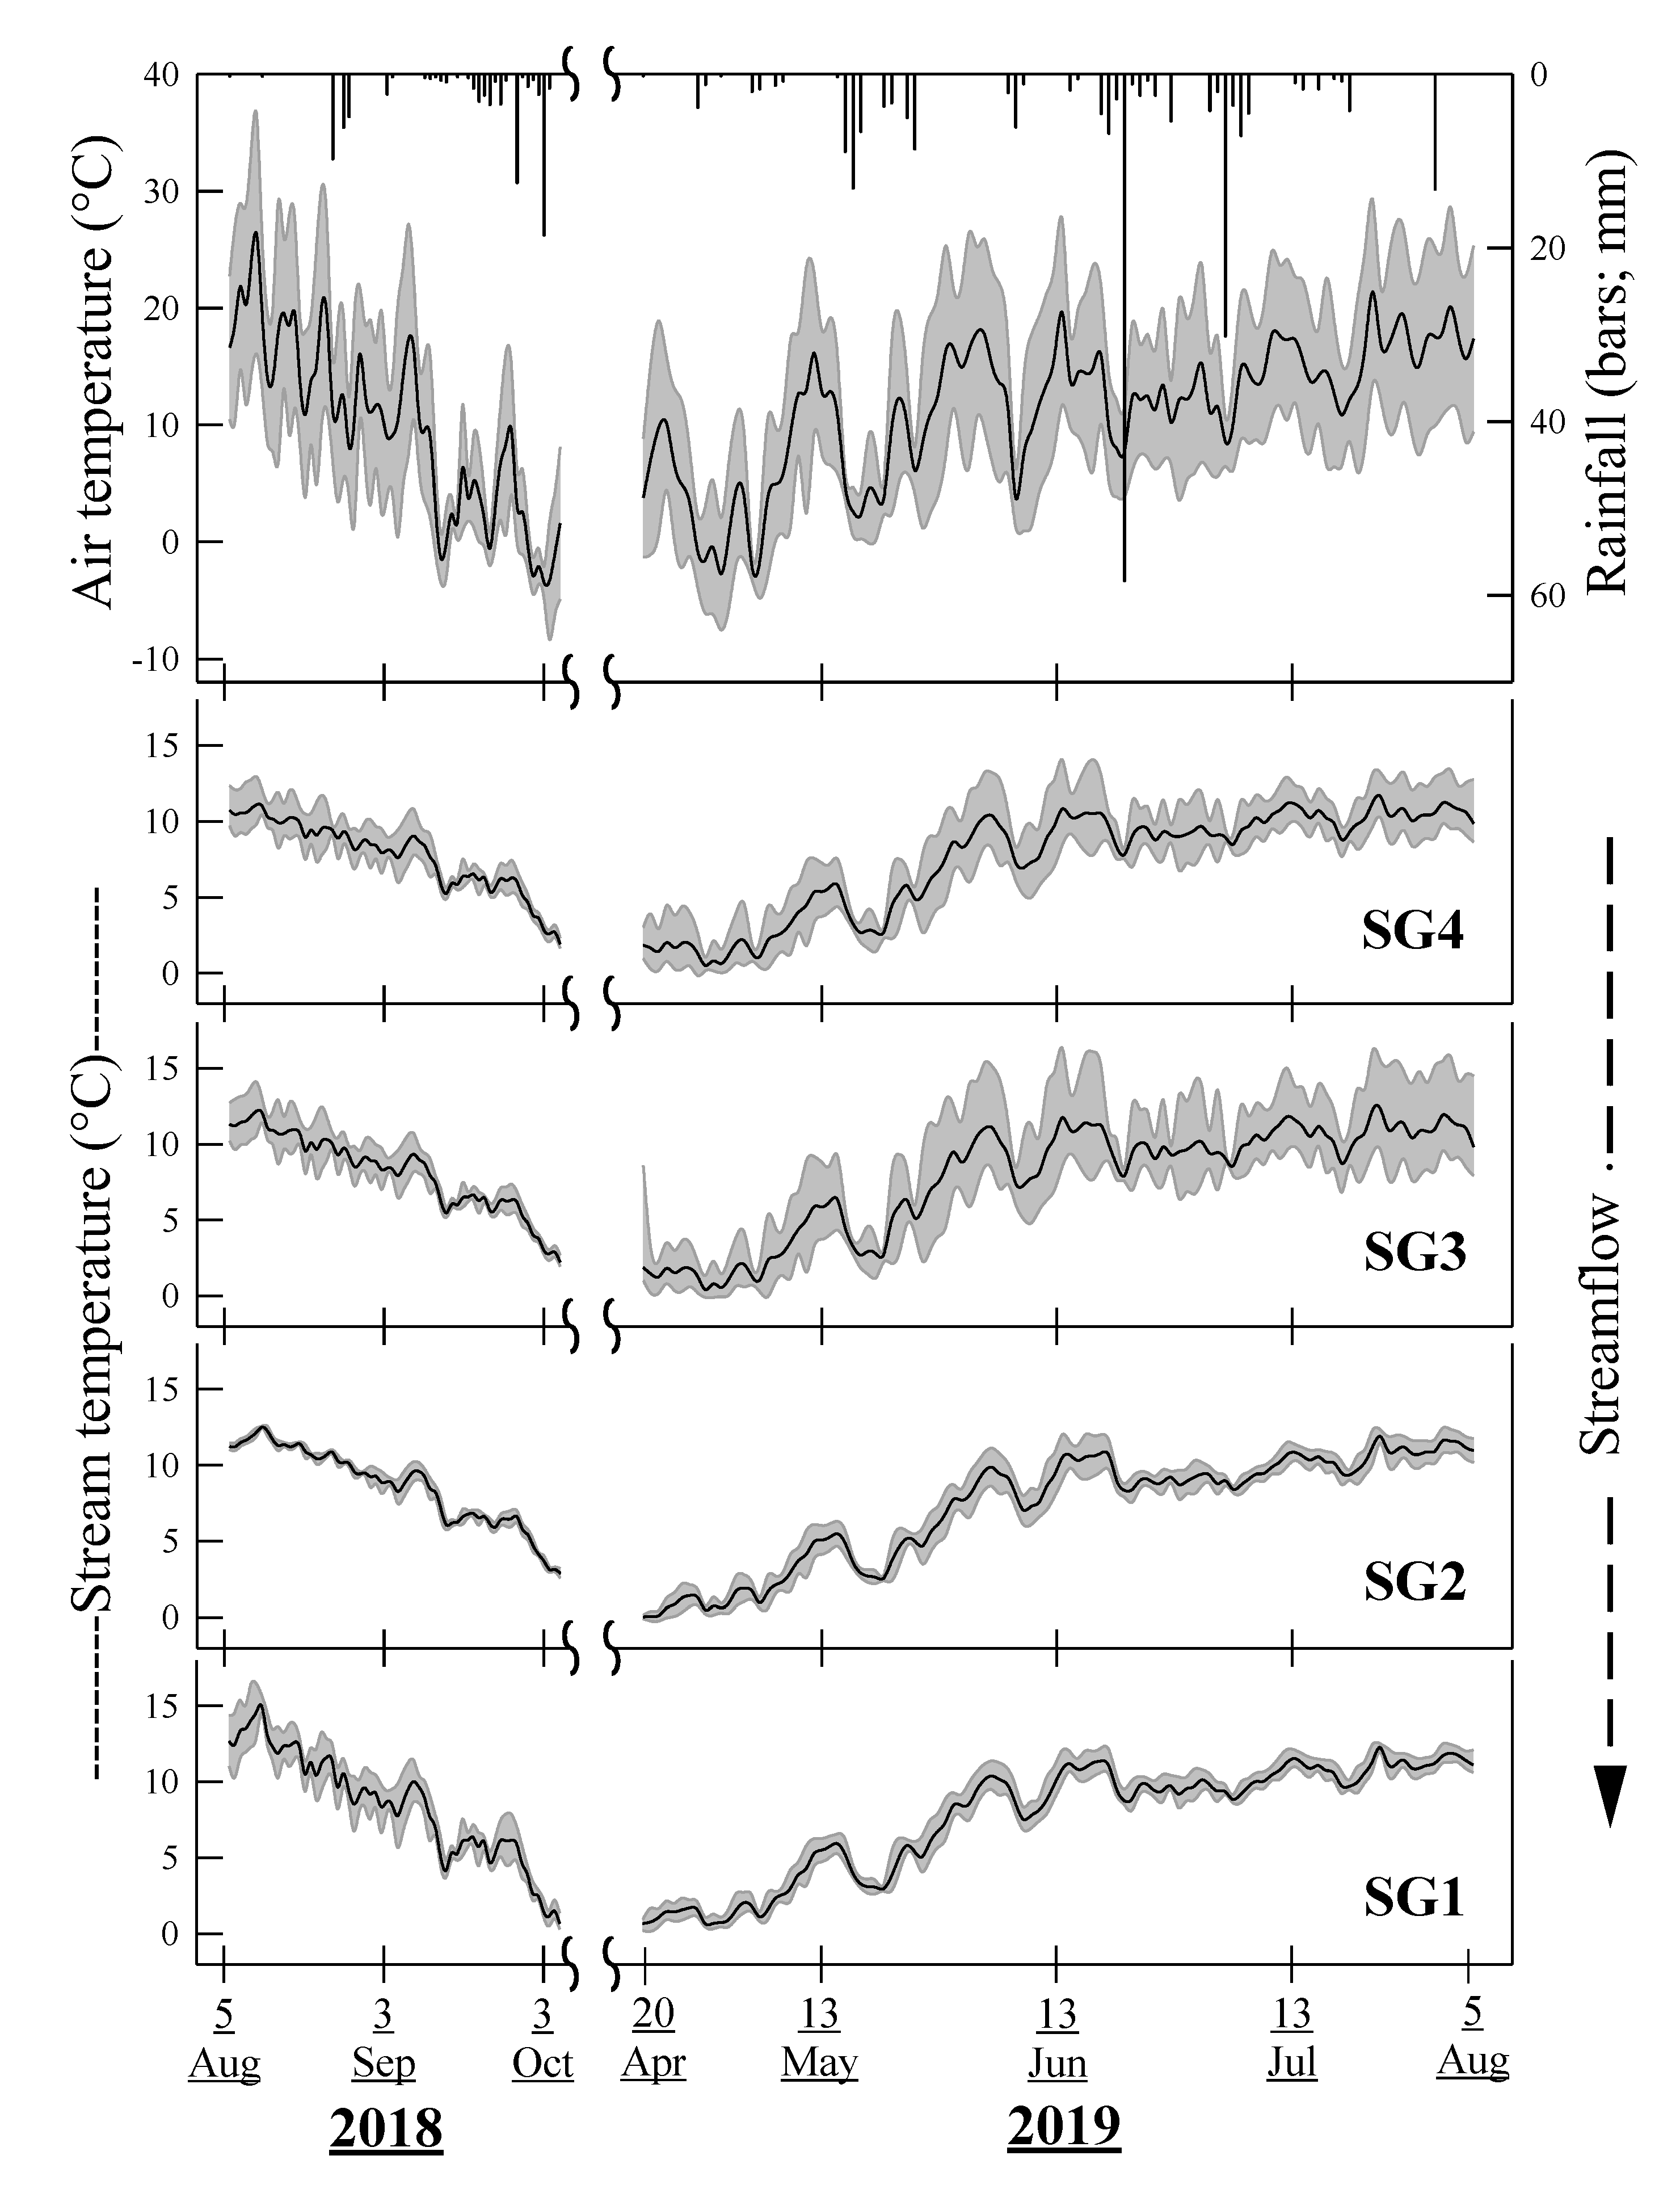
After the BDAs were installed in August 2018, mean daily stream temperature increased longitudinally downstream, from 7.5 °C at SG4 to 8.4 °C at SG1 (Figure 3). Higher daily thermal variation was found below singularly configured BDA than downstream of the double and triple configuration BDAs. Single and double configurations contributed to warming downstream by 0.38 and 0.76 °C, respectively, converse to the triple configuration which aided in cooling the downstream by 0.24 °C. Increases in stream velocity also cooled the downstream of any configuration.
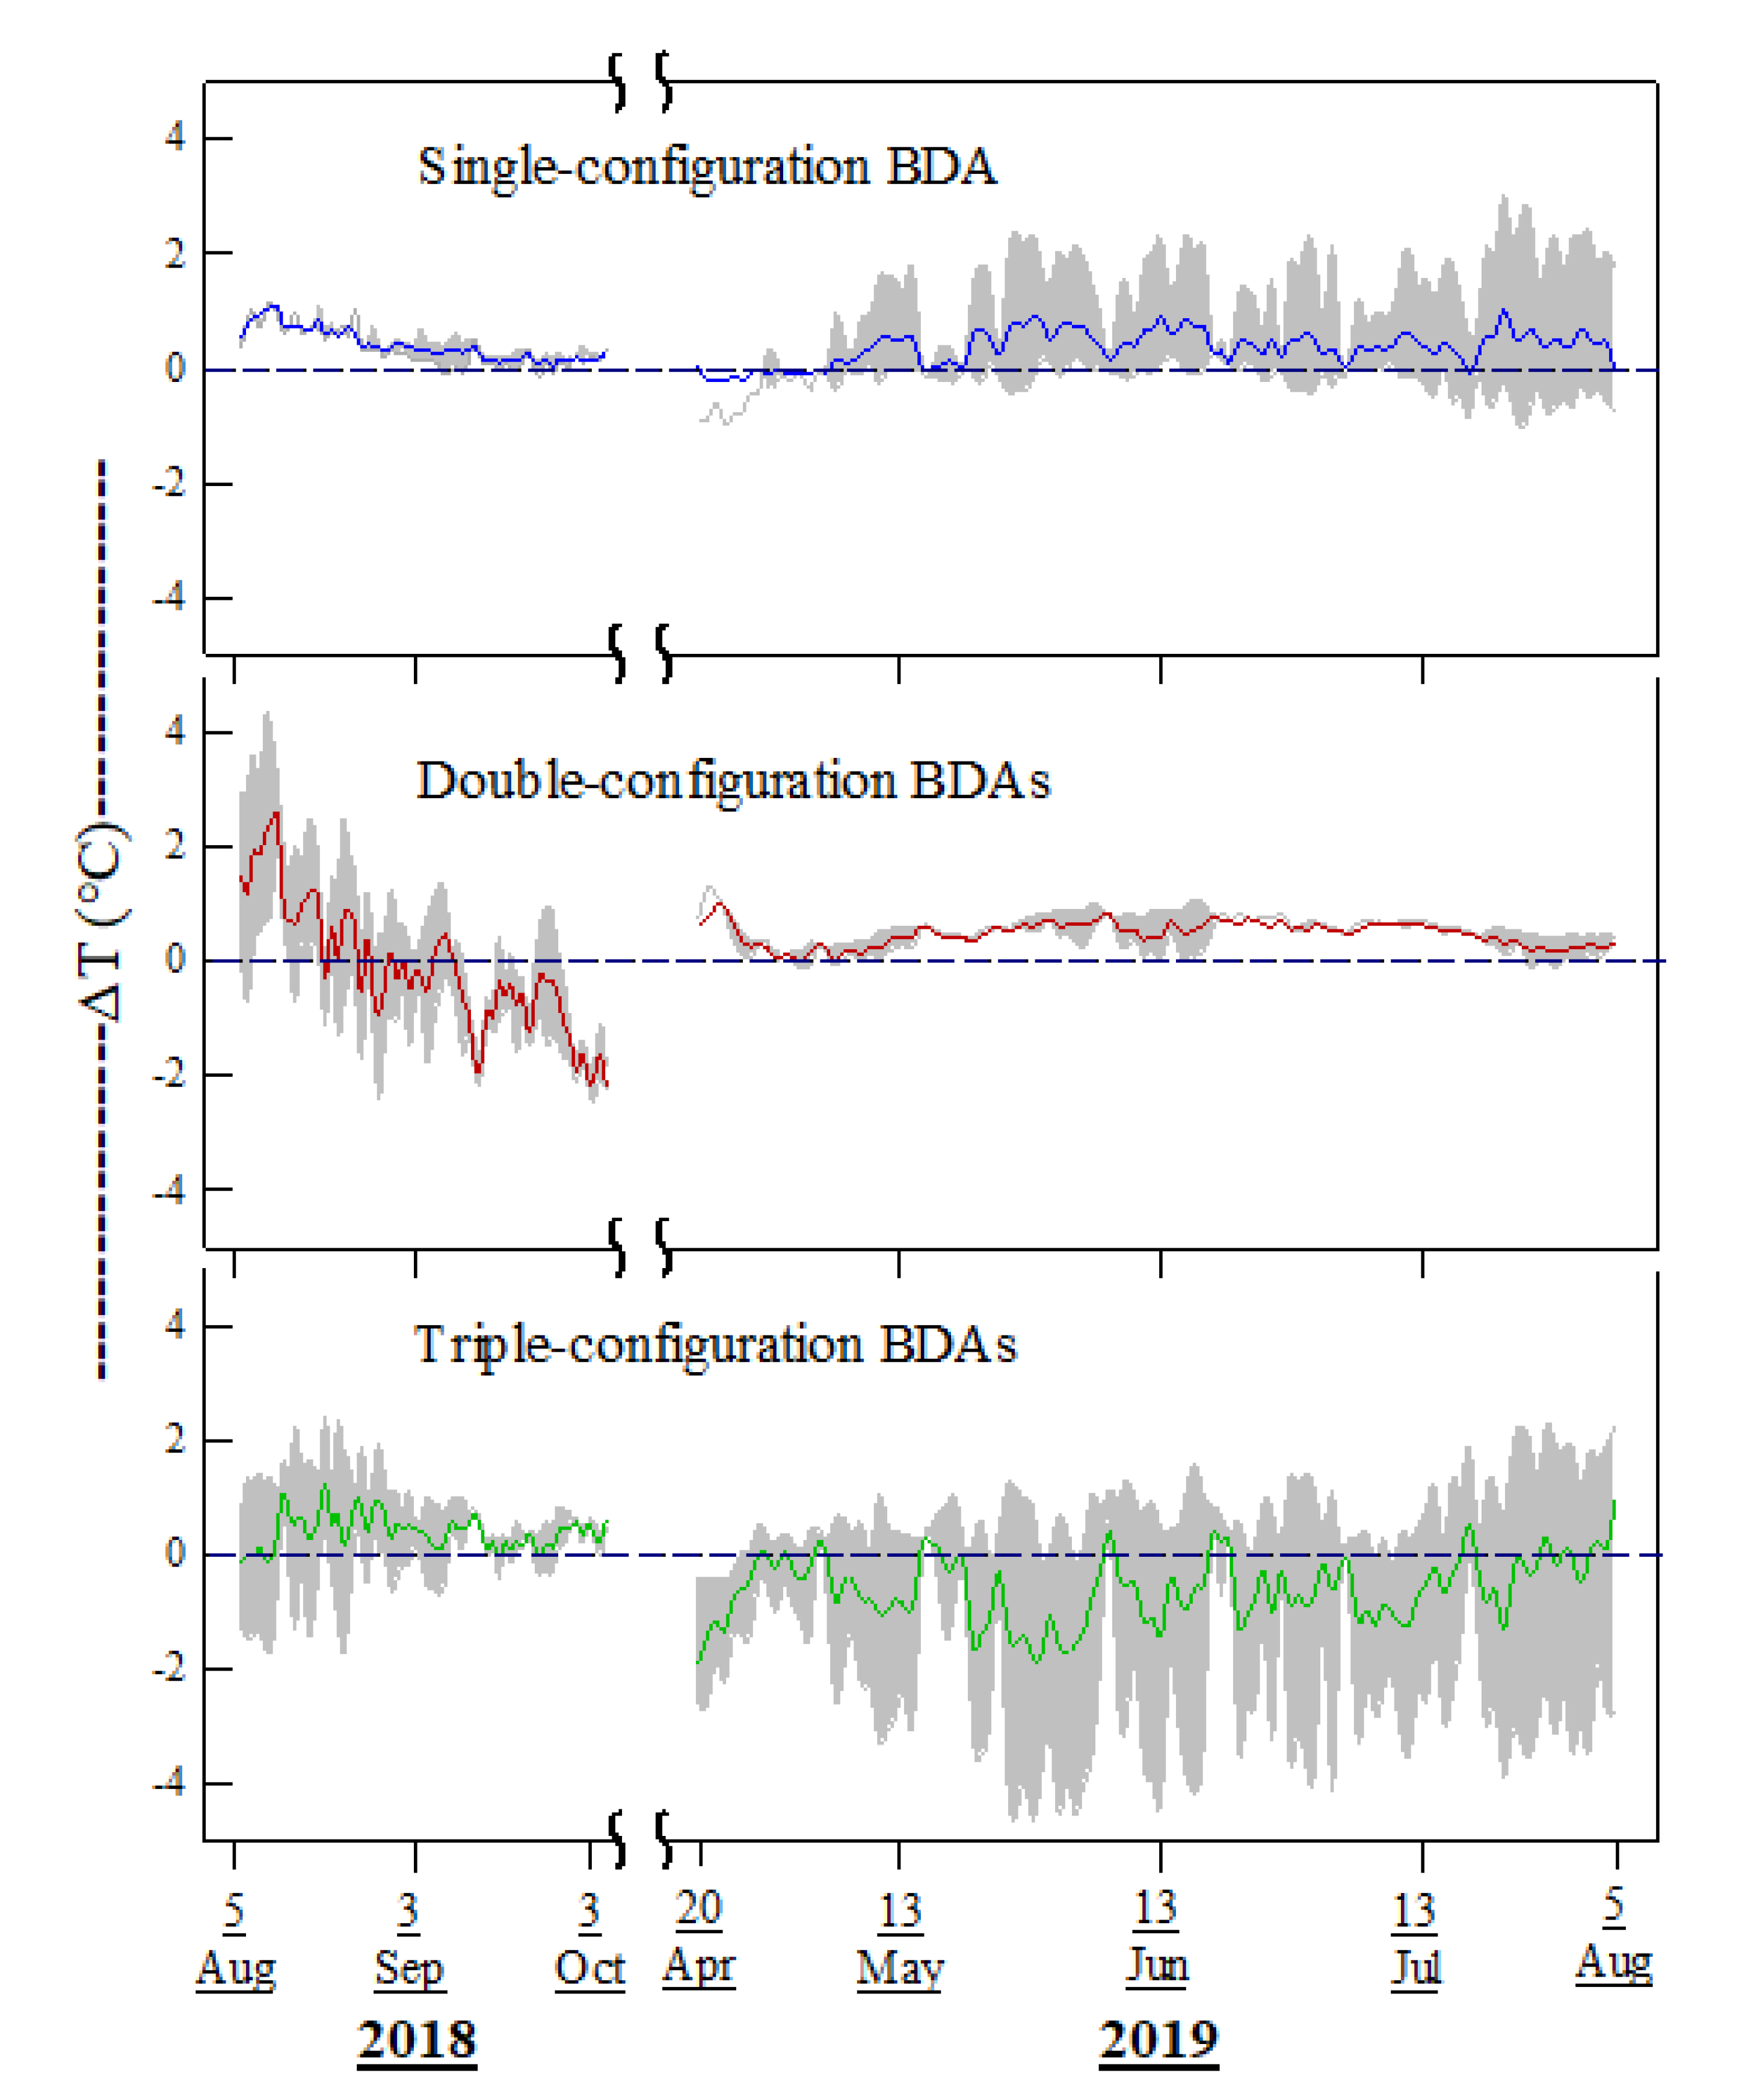
Single and double configuration BDAs showed overall positive ΔT through 2018–2019, indicating net warming of stream water as it passed through the BDA. In contrast, the triple configuration BDAs largely had negative ΔT, indicating net cooling of water as it passed through the BDA sequence, especially in 2019 (Figure 4). The disparities in ΔT distribution densities for the three BDA configurations across the two BDA years are illustrated in Figure 5. Triple configuration BDAs showed the most variation in ΔT followed by the double and single configurations in that order. Also, the triple and double configurations had bimodal distributions, with the different peaks corresponding to the overall warmer 2018 and cooler 2019.
Maximum temperatures (Tmax) of stream water below BDA configurations were compared by applying one-way ANOVA; Tmax below the triple configuration was significantly higher than below the double and single configurations, which had similar Tmax (Table 1). Temporal, paired t-test comparisons (pre- vs. post-BDA installation) were performed to determine if the various BDA configurations influenced downstream temperature differently. In comparing the same day’s stream temperature data logged at SG4–SG1 across the pre- and post-BDA installation years, we found that downstream temperatures were significantly reduced after BDA installation (Table 1); Post-installation reductions below single, double, and triple BDAs were 1.5, 3.8 and 1.6 °C, respectively.
Stream temperatures below the BDAs were mostly in the safe range (<10–12 °C) for westslope cutthroat and bull trout species, although triple configuration offered transiently largest range of temperatures with warmer conditions over an extended period across the two years (Table 2). No lethal temperature (≥19.6 °C) occurred below any configuration at any time.
BDA configuration, stream discharge and pond level were significant predictors responsible for explaining variations in downstream temperatures (Table 1). Rainfall events sharply and transiently reduced stream temperatures, leading to a three-way interaction between BDA-configuration, rainfall and stream discharge influencing the stream temperature regime. Stream discharge was the strongest control over variations in downstream temperatures followed by BDA configuration and pond depth in that order.
3.2. Pond Temperature
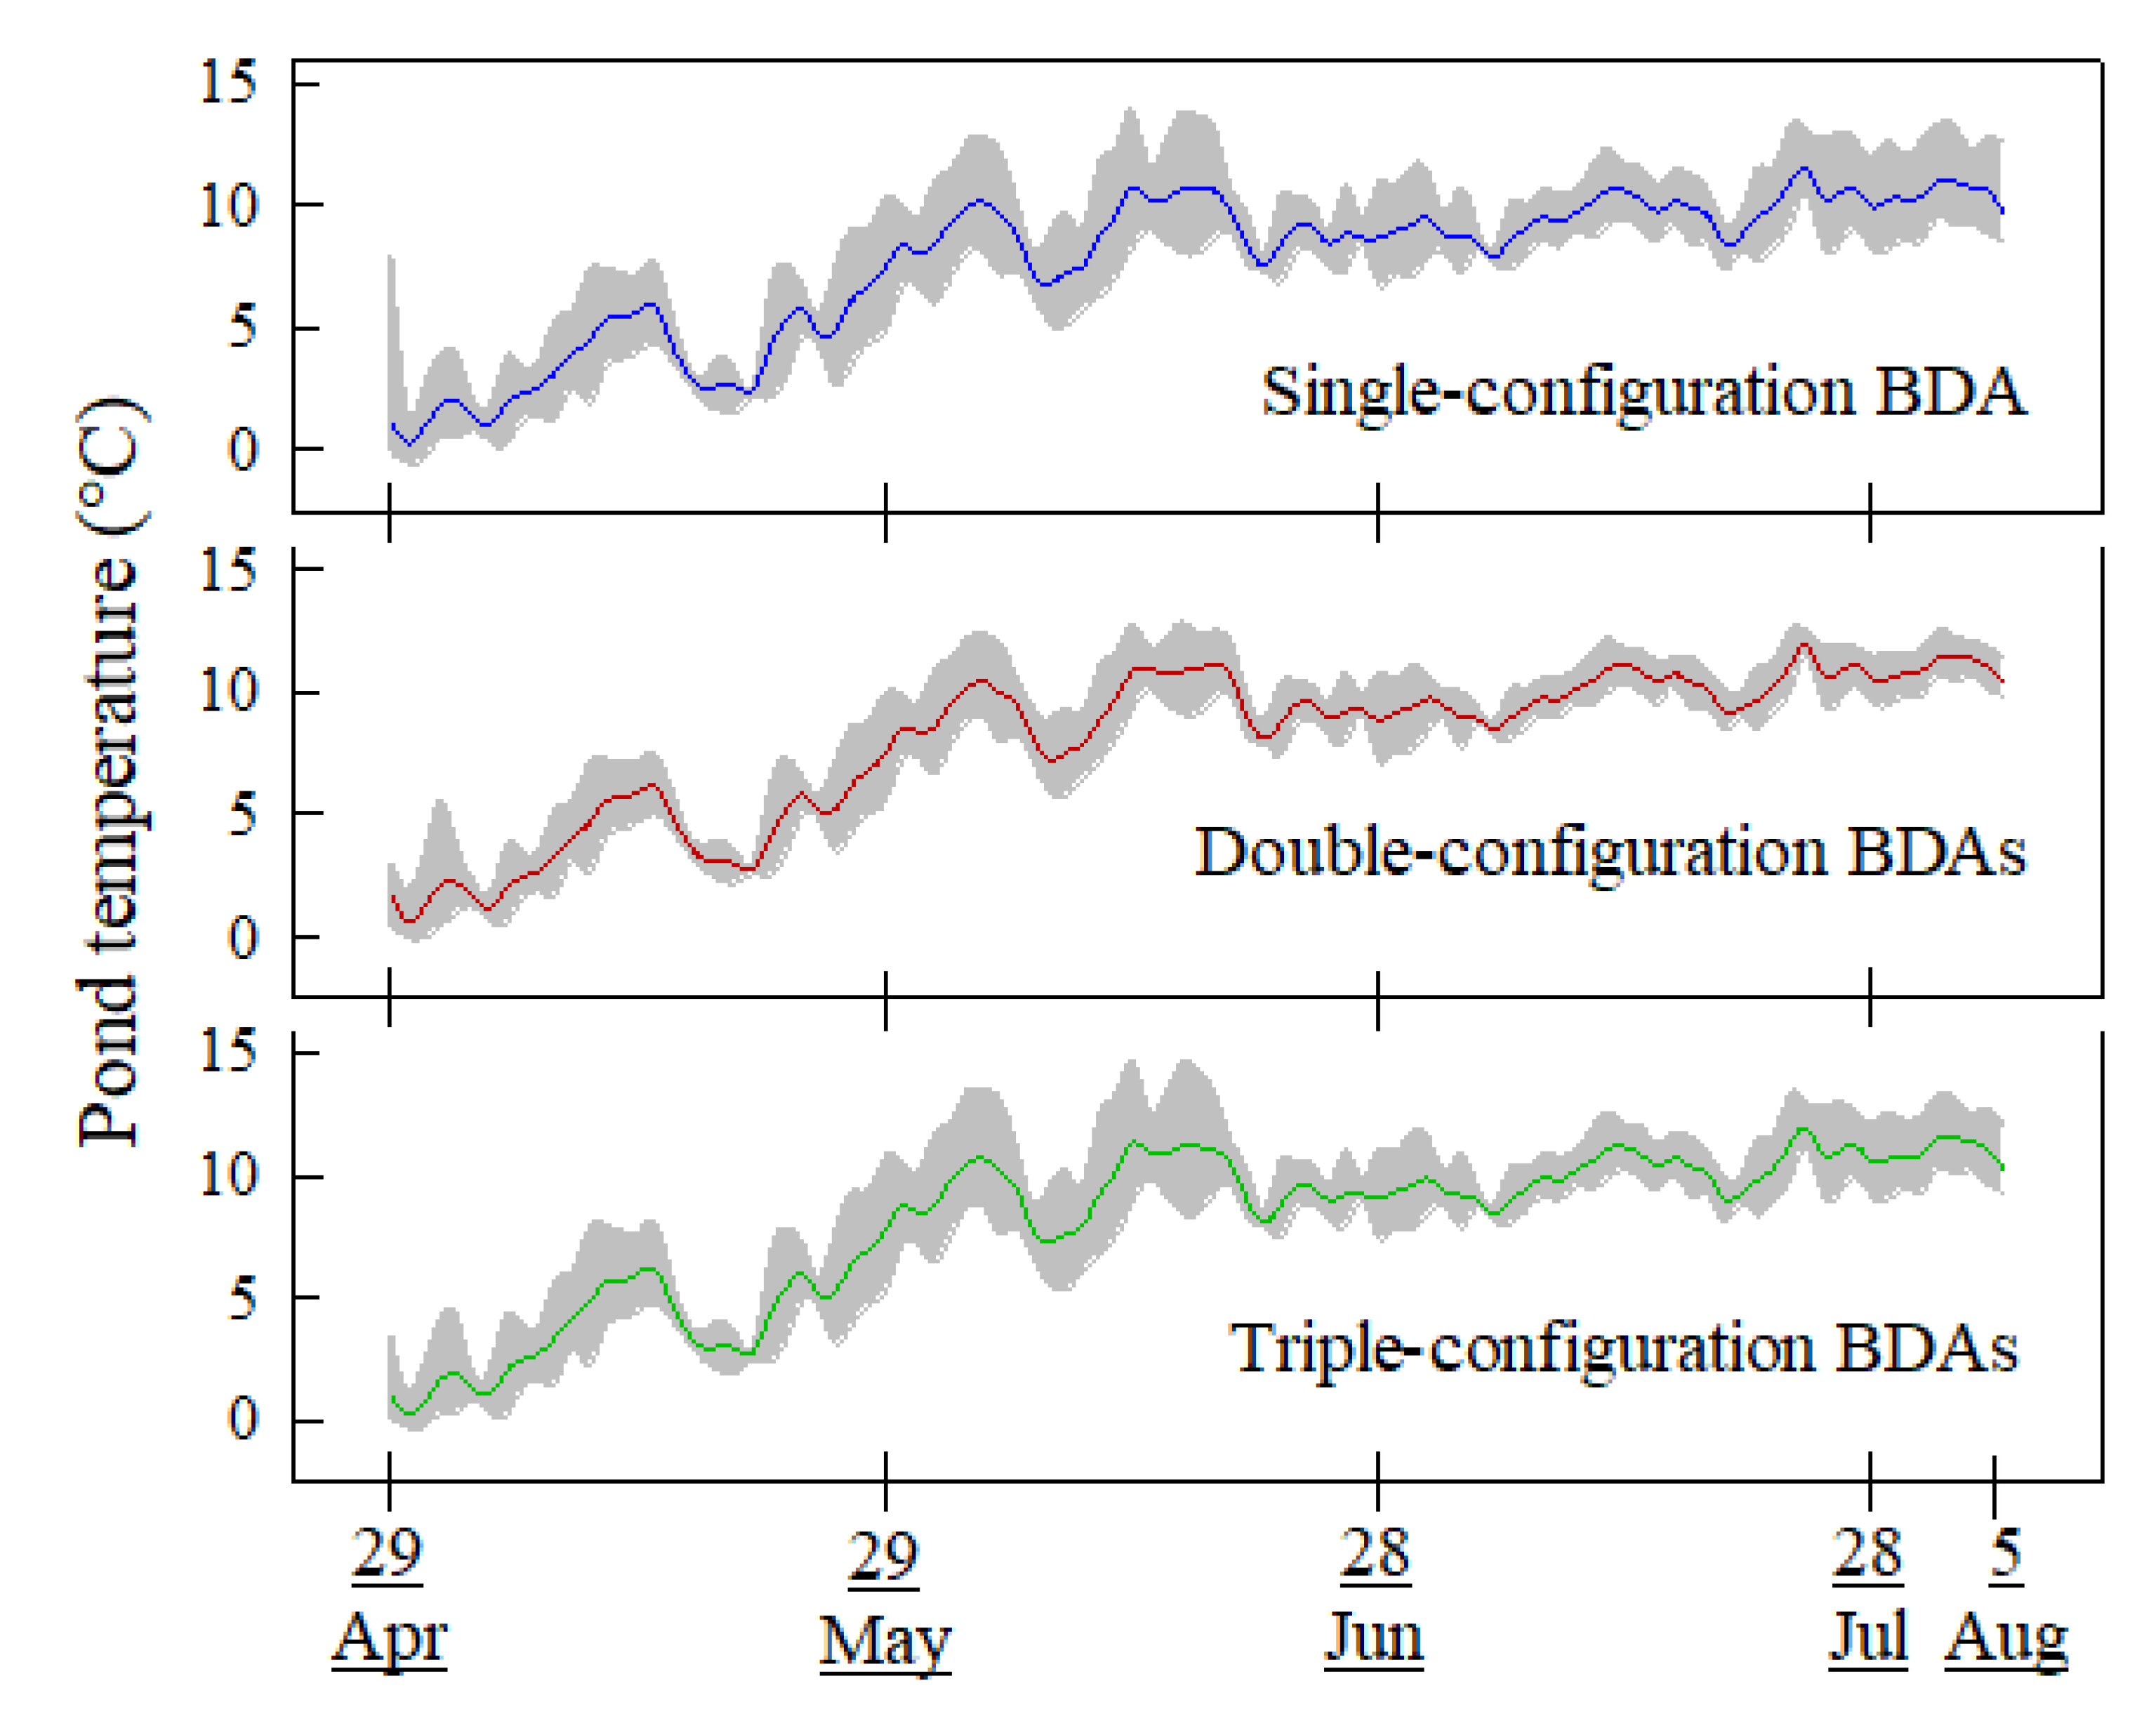
Overall, mean daily pond temperature was higher with more BDAs in sequence (single = 7.7 °C; triple = 8.0 °C; p < 0.001). Thermal variation in the pond formed by the single configuration BDA (6.2–9.3 °C) was higher than in the ponds formed by the double (6.9–9.4 °C) and triple (6.7–9.7 °C) configuration BDAs (Figure 6). A one-way ANOVA compared pond Tmax values from three BDA configurations. Tmax in ponds formed by the BDAs in the triple configuration was significantly higher than in the ponds formed by the double and single configuration BDAs, which were similar (Table 1). BDA configuration, stream discharge, BDA pond depth and rainfall were significant predictors responsible for variation in BDA pond temperature between 6.2–9.7 °C (Table 1). While installing multiple BDAs in sequence magnified the increase in upstream pond temperature; these increases were moderated by increases in stream velocity and pond level or by rainfall events.
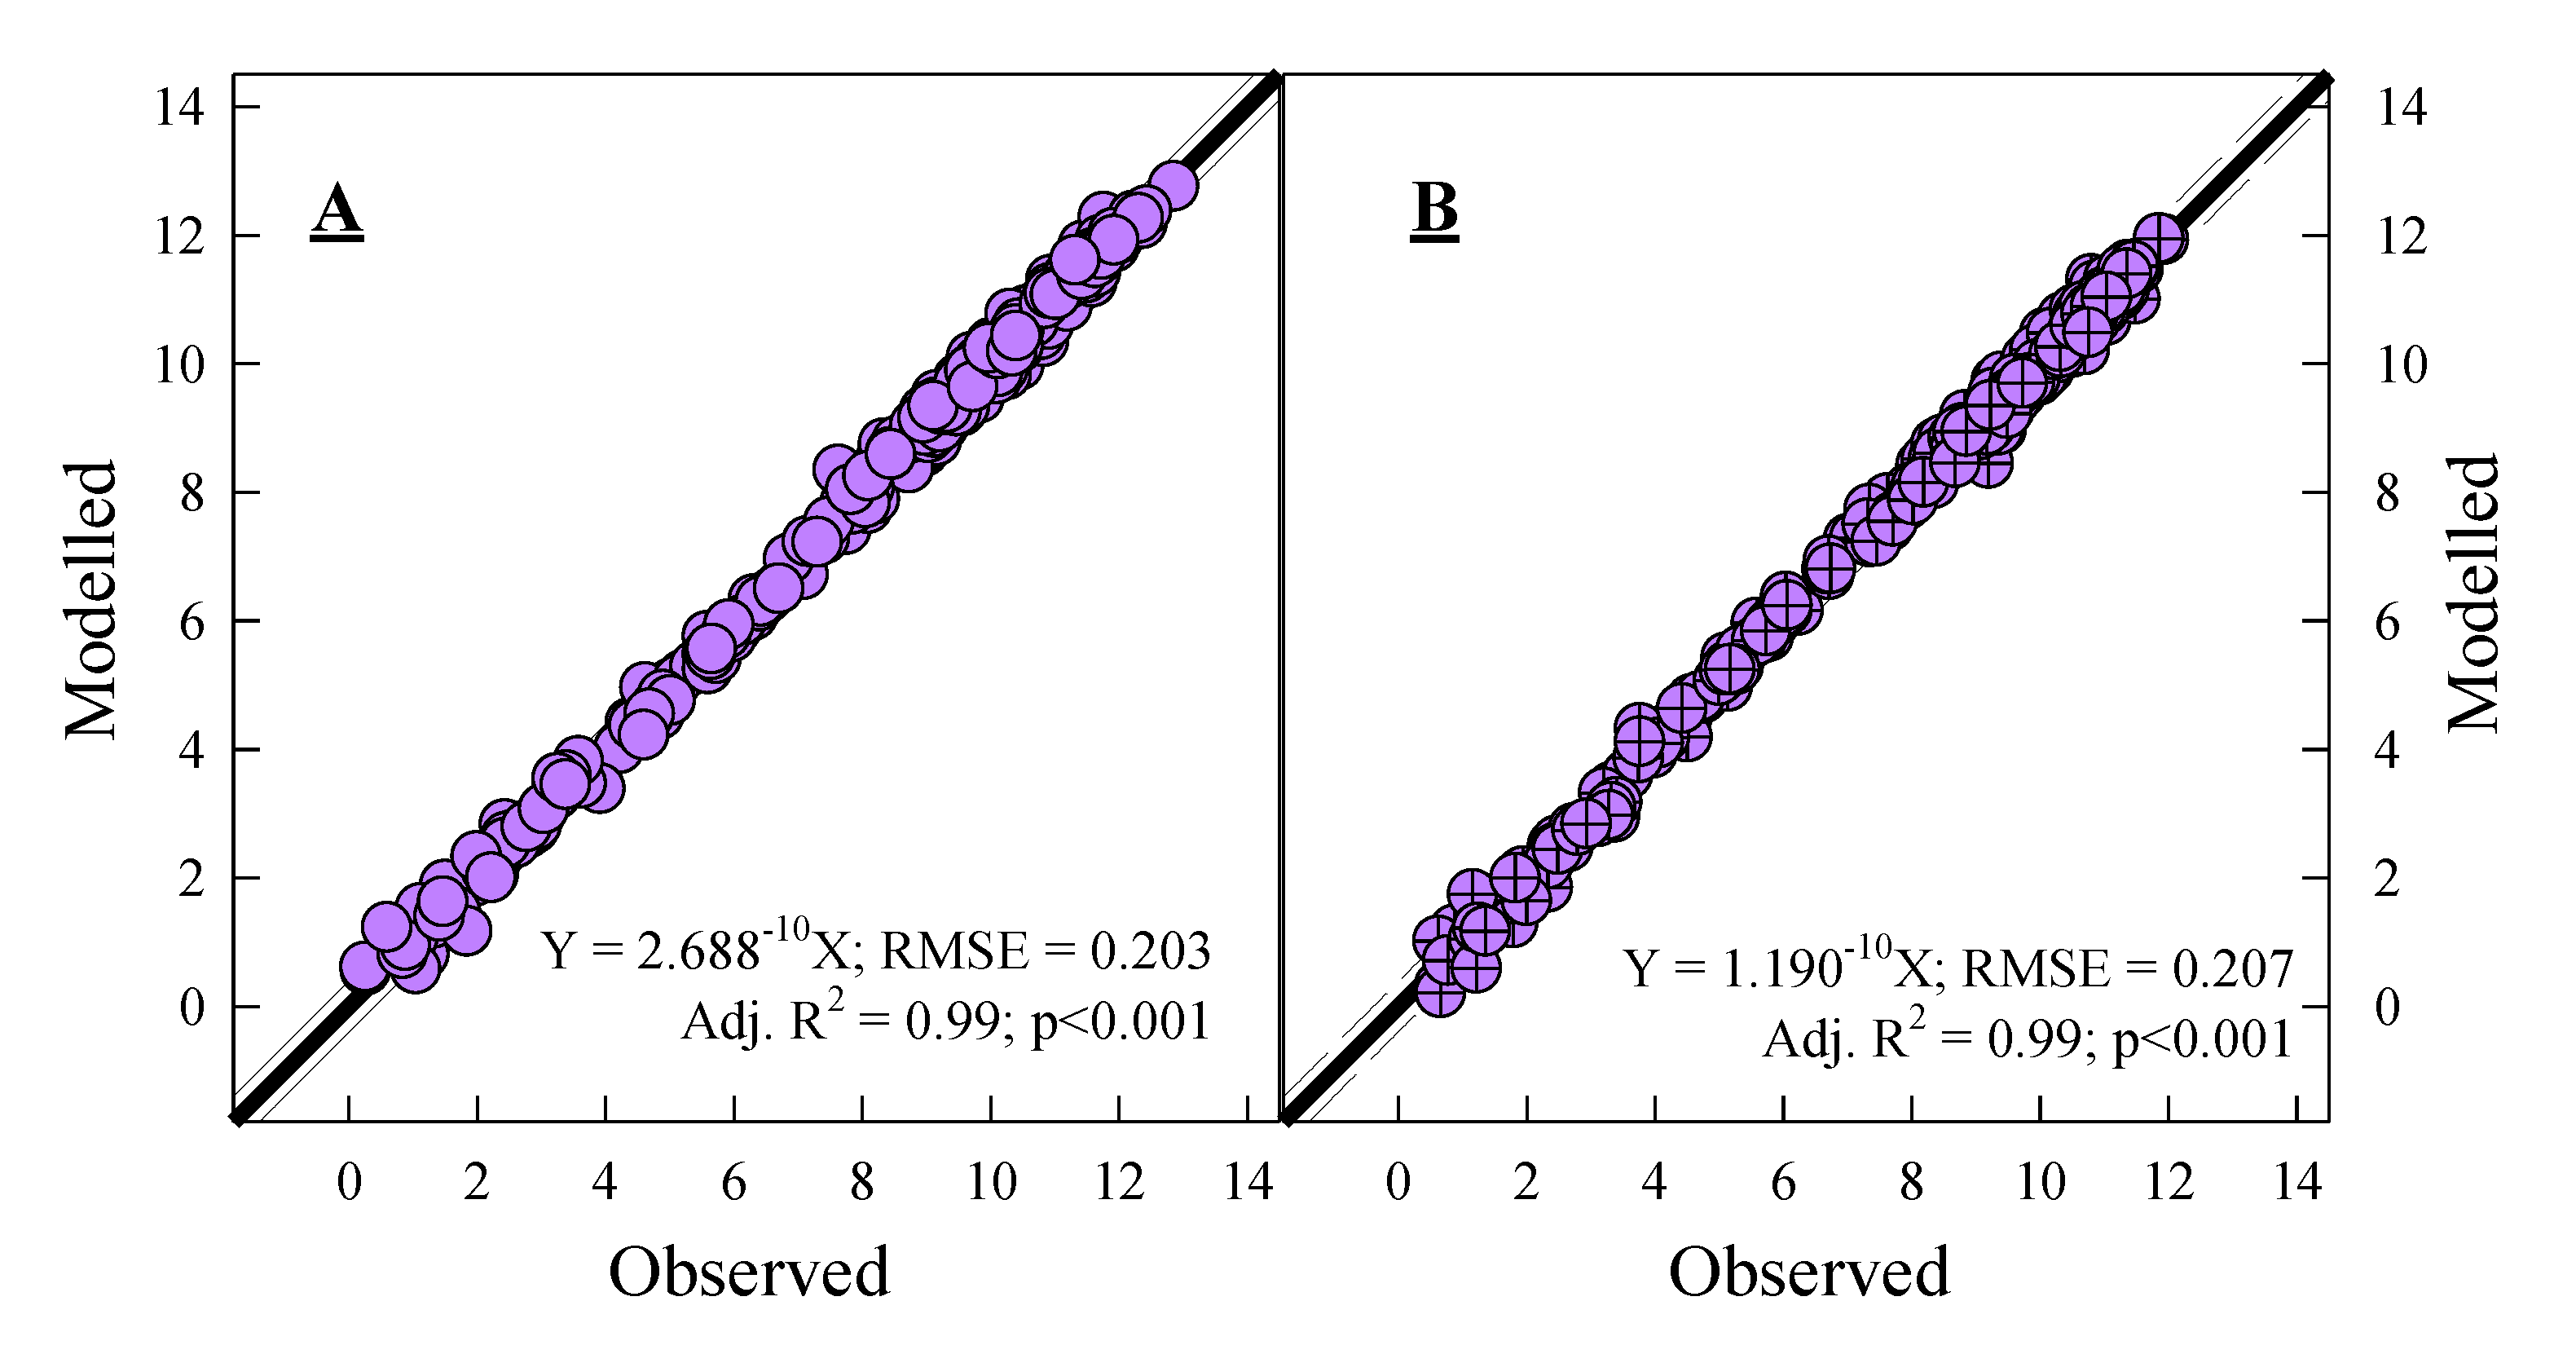
Results of a LMEM for stream temperature were also validated by a linear regression model for demonstrating how BDA configuration, stream discharge, rainfall and pond depth had controls on stream temperature (Figure 7A). The separate linear regression model demonstrated strong interrelationships among BDA configuration, stream discharge, rainfall, pond depth and pond temperature (Figure 7B).
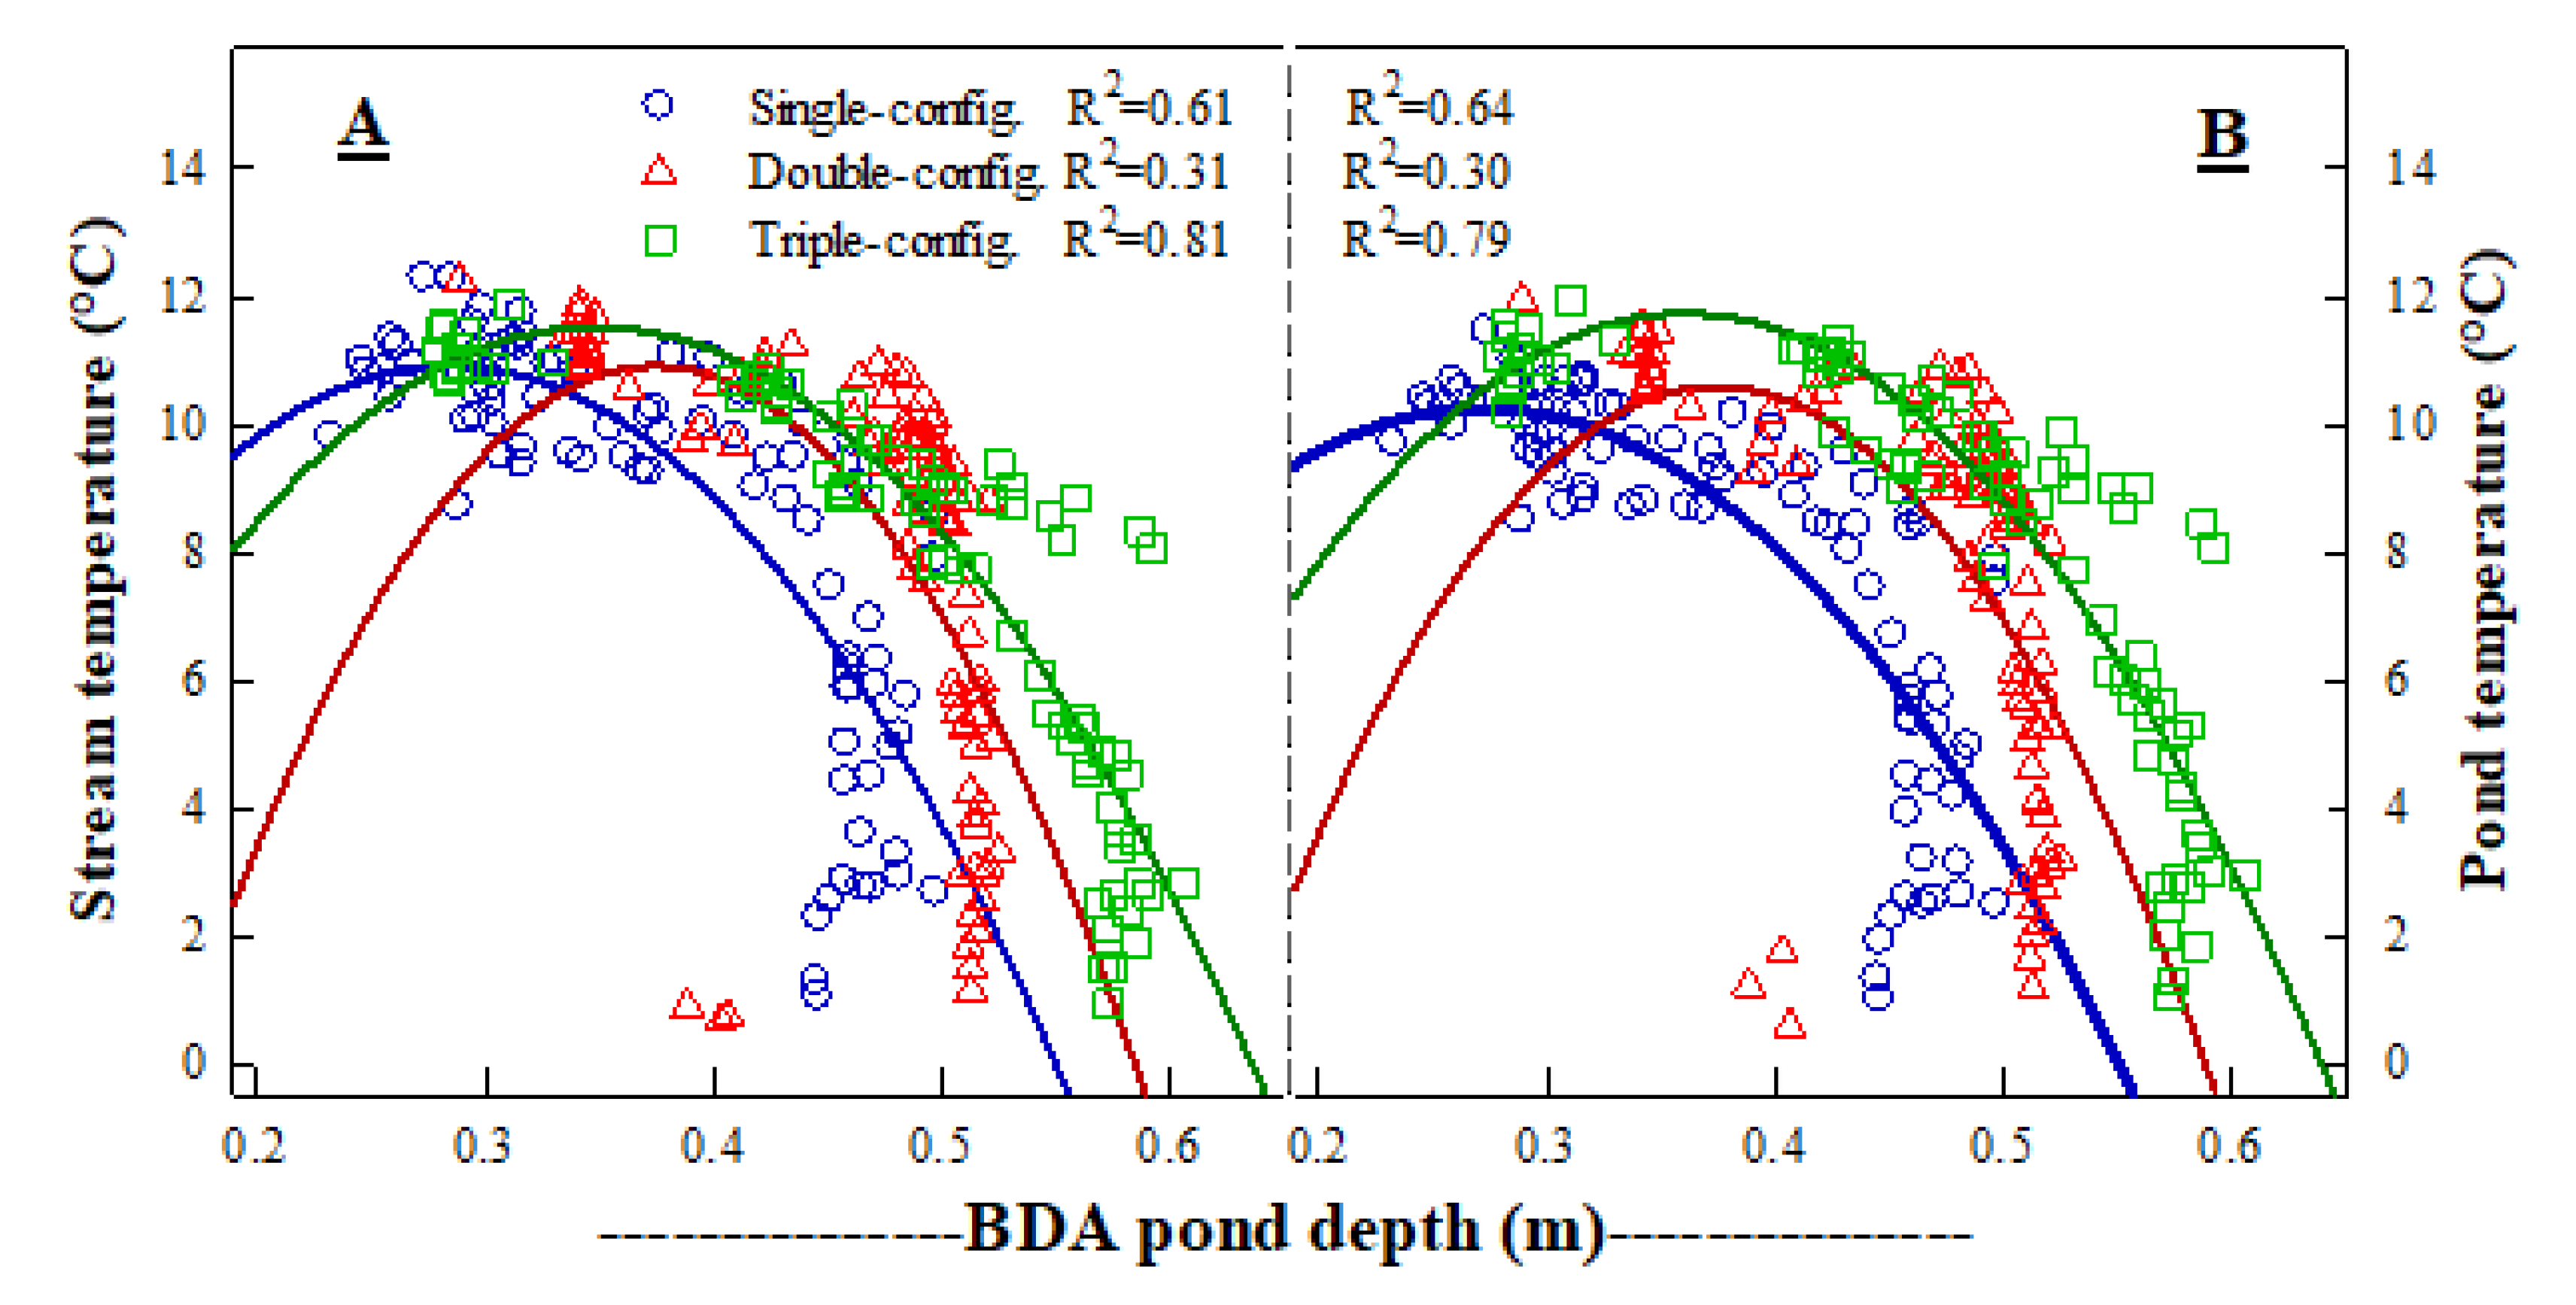
Overall, the changes in downstream temperature in response to upstream pond level were complex. For example, increases in pond level led to decreases in stream temperature. The relationship between pond depth-stream temperature was further investigated using quadratic curves (Figure 8). Temperatures downstream of the BDA structures showed a complex relationship with BDA pond depths: stream temperature increased non-linearly with increasing pond depths up to 0.27 m for single, and 0.37 m for double and triple configurations, and then decreased non-linearly for further pond increases (Figure 8A). Cooling of pond was concurrent to rising of the level that was directly related to rainfall (p < 0.001). Pond temperature also had a threshold response to upstream pond depth wherein pond temperature non-linearly increased with increasing pond depth up to the thresholds of 0.28 m for single, and 0.38 m for double and triple configurations, and then fell steeply at a rate identical to the cooling rate of downstream waters (Figure 8B).
4. Discussion
The BDAs modified stream and pond temperatures along the studied reach of Pine Creek in ways consistent with how beaver dams are known to modify stream temperatures. Having more BDAs installed in a sequence generally enhanced warming of stream and pond temperatures. However, we also noted that diffuse spring inputs to the stream at the location of the triple-configuration BDA counteracted the warming influence of it. Our findings have important implications for those in aquatic ecosystem management who may be considering the installation of BDAs for restoring downstream ecosystems for cold water fish species.
4.1. Stream and Pond Temperatures
Stream temperature modification is one of the effects of natural beaver dams and has been frequently reported; however, the literature describing how beaver dams influence the thermal regime is inconsistent, perhaps owing to study of different spatial and/or temporal scales. The BDA configurations we used altered downstream temperature regime compared to no changes in stream temperature for pre-installation years. Overall, mean temperature and Tmax increased and the thermal variation (Trange) decreased from upstream to downstream post-installation of BDAs or during 2018–2019. Our results are consistent with some studies of beaver dam and BDA impacts on stream temperature but contrary to the findings of other studies. As at Pine Creek, beaver dams studied by Andersen, Shafroth, Pritekel and O’Neill [26], Majerova, Neilson, Schmadel, Wheaton and Snow [27], Fuller and Peckarsky [31], Shetter and Whalls [29], report downstream warming of stream water. Other studies show only partially offsetting of daytime thermal extremes [12,20] or cooling [28,31] downstream of beaver dams. BDAs are intended to mimic similar functions of natural beaver dams [20]. However, few data on BDA-induced stream temperature alteration are available to compare our findings [12,20].
Ponding of stream water is a well-known effect of beaver dams [39]. Pond depth regulates the temperature/stratification of the pond e.g., [e.g., 28] and downstream thermal regime e.g., [e.g., 27,29]. Changing a free-flowing stream reach to one with pools and riffles by adding beaver dams affects the stream energy balance [40], and it is expected that BDA ponds would similarly affect on the stream energy balance. Generally, though, beaver ponds are known to be important places for heat storage [27] due to the lowering of the surface albedo. The resulting enhancements to short wave radiation absorption are equivalent to the southward shift of a site by 7° latitude [40] with a 0.73 °C increase in temperature and 4.04 decrease in precipitation per degree of latitude reported for Northern extratropical hemisphere 30–80° N [41]. In our study, changes in pond and stream temperatures in response to pond level were complex but consistent. For example, increases in pond height were reflected in decreases in pond and stream temperatures as demonstrated by our mixed-effects model. An additional robust investigation into the relationships was performed by using Gaussian curves; we found that ponds warmed with deepening up to the thresholds of 0.28 m for single, and 0.38 m for double and triple configurations, and then started cooling for further pond level increases. The downstream temperature was correlated to pond temperature, and driven by the pond depth. Shallow beaver ponds increase the stream surface to volume ratio more than deeper ponds with the smaller surface to volume ratios [19,42,43], which exposes shallow ponds to more radiant energy [19,42]. A threshold pond depth for heating, however, has not been previously reported. It is unlikely that although that residence time, which Schmadel, et al. [44] report as a main control over pond temperature, was the key factor regulating pond temperature at our site in that case deeper ponds with longer residence times would experience greater heating. Pond warming can be (transiently) reversed by the addition of cooler groundwater or rainfall inputs [20].
Alteration in daily temperature increased longitudinally downstream, and overall, more BDAs in sequence increasingly warmed stream water. While Munir and Westbrook [25] observed that pond depth (and potentially surface area) increased with more BDAs in sequence at this site, we found that overall pond temperature followed the suite from single to triple configuration, though diel thermal variation decreased in that order. These findings support the notion that increasing the number of BDAs increasingly influences downstream temperatures [12,20] by enhancing thermal groundwater exchanges and/or radiant heat fluxes [19,20] similar to the function of natural beaver dams. Our triple-configuration BDA did not warm the stream water as expected and instead cooled it by 0.24 °C. The cooling may be related to an influx of spring water rather than the BDA sequence itself. Munir and Westbrook [25] showed diffuse spring water entered the stream at the location of the triple configuration BDA. Lateral cold-water seeps can cool stream water [45], and may thus have obscured the warming influence of this BDA sequence. Since the cooling by triple configuration was consistently less in magnitude than the warmings created by the single (0.38 °C) and double (0.76 °C) configuration BDAs, net warming of this BDA equipped small reach may be expected when no diffuse springs are present. Further, downstream Tmax was highest below triple configuration followed by double and single configurations in that order. Greater cumulative positive ΔT (warming) of stream water as it passed through the single and double configurations compared to the negative ΔT (cooling) for water that passed through triple configuration also fits with our finding of overall increasing warming longitudinally downwards. Bimodal temperature distributions reflected the overall differences in air temperature across the study years: overall warmer 2018 and cooler 2019. We recommend future studies characterize groundwater inflows to stream reaches where BDAs are installed.
4.2. Mechanisms of Thermal Variation
One of the key controls on stream temperature below natural beaver dams or BDAs could be the local hydrogeomorphic setting and/or weather patterns [19,44]. For example, faster water and uneven and coarser substratum below beaver dams increased spatially variable hydraulics and the amount of fluvial habitat heterogeneity available to native fish in a stream network [46]. Spatially variable hydraulics [46] and residence time [44] determined the amount of surface heat fluxes or albedo [40] and, therefore, downstream temperatures for fish habitat heterogeneity. Warming downstream of natural beaver dams or BDAs is reported more frequently than buffering or cooling. Since surface heat flux influences pond and stream temperatures, downstream warming (to optimal temperature) below BDAs could be favourable to cold-water or stenothermal species in a cool climate [43] compared to downstream warming (to lethal temperatures) in moderate or warm climates [18]. McRae and Edwards [18] reported that streams containing beaver ponds in Wisconsin, USA, averaged 7.6 °C warmer than streams without ponds—most of the beaver streams exceeded thermal optima of 13–15 °C or fell into lethal range for westslope cutthroat and bull trout. BDAs installed in Bridge-Creek, Oregon, USA, are also reported to buffer daily thermal extremes or warm daily thermal minima during summer [20]. However, these studies were carried out in a semi-arid region (46° N and 44° N, respectively) with a moderately warm climate. In our study, stream warming downstream of BDAs was in safe range for westslope cutthroat and bull trout; no daily temperatures within their lethal temperature range were observed. While stream warming below natural beaver dams or BDAs occurring in moderate climates could exceed thermal maxima for cold-water fish species, warming the thermal regime below BDAs in cool climates of different hydrogeomorphic setting may bring streams closer to the thermal optima of these fish species.
4.3. Implications of Warmed Waters for Fish
The unique BDA configurations used in this study mimicked the stream temperature altering function of natural beaver dams. Overall, the BDAs we used increased the downstream temperatures, and warming increased with more BDAs in sequence. Noticeable is that the overall stream temperature of the study reach in the cool climate of Rocky Mountain was below 10 °C prior to BDA installations. Post-installation, the stream warmed closer to the optimal thermal regime (13–15 °C) reported for local westslope cutthroat and bull trout species. In comparison, beaver dams or BDAs installed in moderate climates have been reported to warm downstream and/or exceed the thermal refugia even to a lethal range of temperature. Therefore, in designing and installing BDAs, we need to consider their overall ecological and hydrogeomorphic impacts and make sure decisions on their installation balance both their positive and negative impacts. In terms of water temperatures being affected by BDAs, they do something not particularly desirable—warm the water. Furthermore, our results indicate that adding more BDAs in sequence warms the water more. In the stream we studied, the warming was not so much that it became too hot for the two threatened trout species. However, a lesson learned is that we need to understand the suite of ecosystem changes that adding BDAs to a stream makes so that we can take a holistic view of whether installing them will help meet overall restoration goal(s). For example, in installing multiple BDAs in sequence, we need to balance the number installed in sequence with their negative impact (warming) with the positive impacts on streamflow moderation [Munir and Westbrook] [25].
Author Contributions
T.M.M.: Conceptualization, formal analysis, visualization, writing–original draft preparation. C.J.W.: Conceptualization, methodology, supervision, funding acquisition, resources, writing–review and editing. All authors have read and agreed to the published version of the manuscript.
Funding
Grants from the Natural Sciences and Engineering Research Council of Canada (NSERC) Discovery (RGPIN-2017-05873) and CREATE (463960-2015) programs, the Global Water Futures program, and Alberta Innovates Water Innovation Program (G2020000036) supported this research.
Institutional Review Board Statement
Not applicable.
Informed Consent Statement
Not applicable.
Data Availability Statement
Data that support the findings of this study are publicly archived at: https://github.com/TariqMunir/Munir-Westbrook-Supplementary-Data_BDAs.git (accessed on 1 April 2021).
Acknowledgments
We thank Greg Lewallen, Amanda Ronnquist, Uswah Aziz, Stephanie Streich and Selena Schut for field assistance, and Greg Shyba and Reg Remple of the Ann and Sandy Cross Conservation Area for logistical support. Field support was provided by the University of Calgary Biogeosciences Institute.
Conflicts of Interest
The authors declare no conflict of interest.
References
- Janzen, K.; Westbrook, C.J. Hyporheic flows along a channelled peatland: Influence of beaver dams. Can. Water Resour. J. Rev. Can. Des Ressour. Hydr. 2011, 36, 331–347. [Google Scholar] [CrossRef]
- Westbrook, C.J.; Cooper, D.; Baker, B. Beaver assisted river valley formation. River Res. Appl. 2011, 27, 247–256. [Google Scholar] [CrossRef]
- Harvey, J.; Gooseff, M. River corridor science: Hydrologic exchange and ecological consequences from bedforms to basins. Water Resour. Res. 2015, 51, 6893–6922. [Google Scholar] [CrossRef] [Green Version]
- Stout, T.; Majerova, M.; Neilson, B. Impacts of beaver dams on channel hydraulics and substrate characteristics in a mountain stream. Ecohydrology 2017, 10, e1767. [Google Scholar] [CrossRef]
- Pollock, M.M.; Beechie, T.J.; Jordan, C.E. Geomorphic changes upstream of beaver dams in Bridge Creek, an incised stream channel in the interior Columbia River basin, eastern Oregon. Earth Surf. Process. Landf. 2007, 32, 1174–1185. [Google Scholar] [CrossRef]
- Butler, D.R.; Malanson, G.P. The geomorphic influences of beaver dams and failures of beaver dams. Geomorphology 2005, 71, 48–60. [Google Scholar] [CrossRef]
- Wolf, E.C.; Cooper, D.J.; Hobbs, N.T. Hydrologic regime and herbivory stabilize an alternative state in Yellowstone National Park. Ecol. Appl. 2007, 17, 1572–1587. [Google Scholar] [CrossRef] [PubMed] [Green Version]
- Green, K.C.; Westbrook, C.J. Changes in riparian area structure, channel hydraulics, and sediment yield following loss of beaver dams. J. Ecosyst. Manag. 2009, 10, 68–79. [Google Scholar]
- Bouwes, N.; Weber, N.; Jordan, C.E.; Saunders, W.C.; Tattam, I.A.; Volk, C.; Wheaton, J.M.; Pollock, M.M. Ecosystem experiment reveals benefits of natural and simulated beaver dams to a threatened population of steelhead (Oncorhynchus mykiss). Sci. Rep. 2016, 6, 1–12. [Google Scholar] [CrossRef] [PubMed]
- Pollock, M.; Wheaton, J.; Bouwes, N.; Jordan, C. Working with Beaver to Restore Salmon Habitat in the Bridge Creek Intensively Monitored Watershed; Nation Oceanic and Atmospheric Administration: Seattle, WA, USA, 2012.
- Pollock, M.M.; Beechie, T.J.; Wheaton, J.M.; Jordan, C.E.; Bouwes, N.; Weber, N.; Volk, C. Using beaver dams to restore incised stream ecosystems. Bioscience 2014, 64, 279–290. [Google Scholar] [CrossRef]
- National Marine Fisheries Service. Middle Columbia River Steelhead Distinct Population Segment ESA Recovery Plan; NMFS, Northwest Region: Portland, OR, USA, 2019; p. 260.
- Charnley, S. Beavers, Landowners, and Watershed Restoration: Experimenting with Beaver Dam Analogues in the Scott River Basin, California; U.S. Department of Agriculture, Forest Service: Portland, OR, USA, 2018; p. 38.
- Pilliod, D.S.; Rohde, A.T.; Charnley, S.; Davee, R.R.; Dunham, J.B.; Gosnell, H.; Grant, G.E.; Hausner, M.B.; Huntington, J.L.; Nash, C. Survey of beaver-related restoration practices in rangeland streams of the western USA. Environ. Manag. 2018, 61, 58–68. [Google Scholar] [CrossRef]
- Fullerton, A.H.; Burke, B.J.; Lawler, J.J.; Torgersen, C.E.; Ebersole, J.L.; Leibowitz, S.G. Simulated juvenile salmon growth and phenology respond to altered thermal regimes and stream network shape. Ecosphere 2017, 8, e02052. [Google Scholar] [CrossRef] [PubMed]
- Quinn, T.P. The Behavior and Ecology of Pacific Salmon and Trout; University of Washington Press: Seattle, WA, USA, 2018. [Google Scholar]
- Underwood, Z.; Myrick, C.; Rogers, K. Effect of acclimation temperature on the upper thermal tolerance of Colorado River cutthroat trout Oncorhynchus clarkii pleuriticus: Thermal limits of a North American salmonid. J. Fish Biol. 2012, 80, 2420–2433. [Google Scholar] [CrossRef] [PubMed]
- McRae, G.; Edwards, C.J. Thermal characteristics of Wisconsin headwater streams occupied by beaver: Implications for brook trout habitat. Trans. Am. Fish. Soc. 1994, 123, 641–656. [Google Scholar] [CrossRef]
- Poole, G.C.; Berman, C.H. An ecological perspective on in-stream temperature: Natural heat dynamics and mechanisms of human-causedthermal degradation. Environ. Manag. 2001, 27, 787–802. [Google Scholar] [CrossRef] [PubMed]
- Weber, N.; Bouwes, N.; Pollock, M.M.; Volk, C.; Wheaton, J.M.; Wathen, G.; Wirtz, J.; Jordan, C.E. Alteration of stream temperature by natural and artificial beaver dams. PLoS ONE 2017, 12, e0176313. [Google Scholar] [CrossRef] [PubMed] [Green Version]
- Pörtner, H.O.; Peck, M. Climate change effects on fishes and fisheries: Towards a cause-and-effect understanding. J. Fish Biol. 2010, 77, 1745–1779. [Google Scholar] [CrossRef] [PubMed]
- Cleator, H.; Earle, J.; Fitch, L.; Humphries, S.; Koops, M.; Martin, K.; Mayhood, D.; Petry, S.; Pacas, C.; Stelfox, J. Information Relevant to a Recovery Potential Assessment of Pure Native Westslope Cutthroat Trout, Alberta Population; Canadian Science Advisory Secretariat: Ottawa, ON, Canada, 2009; p. 26.
- Earle, J.E. Recovery planning for westslope cutthroat trout: A threatened species in Alberta. In Proceedings of the Wild Trout X Symposium Conserving Wild Trout, West Yellowstone, MT, USA, 28–30 September 2010; pp. 28–39. [Google Scholar]
- Bear, E.A.; McMahon, T.E.; Zale, A.V. Comparative thermal requirements of westslope cutthroat trout and rainbow trout: Implications for species interactions and development of thermal protection standards. Trans. Am. Fish. Soc. 2007, 136, 1113–1121. [Google Scholar] [CrossRef]
- Munir, T.M.; Westbrook, C.J. Beaver dam analogue configurations influence stream and riparian water table dynamics of a degraded spring-fed creek in the Canadian Rockies. River Res. Appl. 2020, 1–13. [Google Scholar] [CrossRef]
- Andersen, D.C.; Shafroth, P.B.; Pritekel, C.M.; O’Neill, M.W. Managed flood effects on beaver pond habitat in a desert riverine ecosystem, Bill Williams River, Arizona USA. Wetlands 2011, 31, 195–206. [Google Scholar] [CrossRef]
- Majerova, M.; Neilson, B.; Schmadel, N.; Wheaton, J.; Snow, C. Impacts of beaver dams on hydrologic and temperature regimes in a mountain stream. Hydrol. Earth Syst. Sci. 2015, 12. [Google Scholar] [CrossRef] [Green Version]
- Majerova, M.; Neilson, B.T.; Roper, B.B. Beaver dam influences on streamflow hydraulic properties and thermal regimes. Sci. Total Environ. 2020, 718, 134853. [Google Scholar] [CrossRef]
- Shetter, D.S.; Whalls, M.J. Effect of impoundment on water temperatures of Fuller Creek, Montmorency County, Michigan. J. Wildl. Manag. 1955, 19, 47–54. [Google Scholar] [CrossRef]
- Margolis, B.E.; Castro, M.S.; Raesly, R.L. The impact of beaver impoundments on the water chemistry of two Appalachian streams. Can. J. Fish Aquat. Sci. 2001, 58, 2271–2283. [Google Scholar] [CrossRef]
- Fuller, M.R.; Peckarsky, B.L. Ecosystem engineering by beavers affects mayfly life histories. Freshw. Biol. 2011, 56, 969–979. [Google Scholar] [CrossRef]
- Lautz, L.; Kelleher, C.; Vidon, P.; Coffman, J.; Riginos, C.; Copeland, H. Restoring stream ecosystem function with beaver dam analogues: Let’s not make the same mistake twice. Hydrol. Process. 2019, 33, 174–177. [Google Scholar] [CrossRef] [Green Version]
- Grasby, S.E.; Chen, Z.; Hamblin, A.P.; Wozniak, P.R.; Sweet, A.R. Regional characterization of the Paskapoo bedrock aquifer system, southern Alberta. Can. J. Earth Sci. 2008, 45, 1501–1516. [Google Scholar] [CrossRef]
- Shyba, G.; Rempel, R. Ann and Sandy Cross Conservation Area: Adaptive Managemen Plan 2015–2040; Calgary Foundation: Calgary, AB, Canada, 2015. [Google Scholar]
- Baayens, D.M.; Brewin, M.K. Fisheries Resources of the Fish Creek Watershed; Fisheries Management Enhancement Program, Alberta Conservation Association: Edmonton, AB, Canada, 1990; p. 41. [Google Scholar]
- Cahill, C.L.; Mogensen, S.; Wilson, K.L.; Cantin, A.; Sinnatamby, R.N.; Paul, A.J.; Christensen, P.; Reilly, J.R.; Winkel, L.; Farineau, A.; et al. Multiple challenges confront a high-effort inland recreational fishery in decline. Can. J. Fish. Aquat. Sci. 2018, 75, 1357–1368. [Google Scholar] [CrossRef]
- White, R. Beaver Reintroduction Project; Mary Nersessian: Calgary, AB, Canada, 2016. [Google Scholar]
- Landau, S.; Everitt, B. A Handbook of Statistical Analyses Using SPSS; CRC: Washington, DC, USA, 2004. [Google Scholar]
- Nyssen, J.; Pontzeele, J.; Billi, P. Effect of beaver dams on the hydrology of small mountain streams: Example from the Chevral in the Ourthe Orientale basin, Ardennes, Belgium. J. Hydrol. 2011, 402, 92–102. [Google Scholar] [CrossRef]
- Vowinckel, E.; Orvig, S. The heat and water budgets of a beaver pond. Atmosphere 1973, 11, 166–178. [Google Scholar] [CrossRef] [Green Version]
- De Frenne, P.; Graae, B.J.; Rodríguez-Sánchez, F.; Kolb, A.; Chabrerie, O.; Decocq, G.; De Kort, H.; De Schrijver, A.; Diekmann, M.; Eriksson, O.; et al. Latitudinal gradients as natural laboratories to infer species’ responses to temperature. J. Ecol. 2013, 101, 784–795. [Google Scholar] [CrossRef]
- Clark, E.; Webb, B.; Ladle, M. Microthermal gradients and ecological implications in Dorset rivers. Hydrol. Process. 1999, 13, 423–438. [Google Scholar] [CrossRef]
- Appleton, C. Observations on the thermal regime of a stream in the Eastern Transvaal, with reference to certain aquatic Pulmonata. S. Afr. J. Sci. 1976, 72, 20. [Google Scholar]
- Schmadel, N.M.; Neilson, B.T.; Heavilin, J.E. Spatial considerations of stream hydraulics in reach scale temperature modeling. Water Resour. Res. 2015, 51, 5566–5581. [Google Scholar] [CrossRef] [Green Version]
- Ebersole, J.L.; Liss, W.J.; Frissell, C.A. Cold water patches in warm streams: Physicochemical characteristics and the influence of shading 1. JAWRA J. Am. Water Resour. Assoc. 2003, 39, 355–368. [Google Scholar] [CrossRef]
- Smith, J.M.; Mather, M.E. Beaver dams maintain fish biodiversity by increasing habitat heterogeneity throughout a low-gradient stream network. Freshw. Biol. 2013, 58, 1523–1538. [Google Scholar] [CrossRef]
Figure 1.
Study stream fitted with beaver dam analogue (BDA) configurations, pond gauges (PG) and stream gauges (SG) at Ann and Sandy Cross Conservation Area, 30 km SW of Calgary in Alberta, Canada (50°51′ N, 114°13′ W). Six BDAs (BDA6–BDA1) from upstream to downstream are represented by beige bars along ~1070 m long reach. 1–3 beige bars show single-, double-, and triple-configurations, respectively. Each BDA is instrumented with an upstream PG (PG6–PG1). Four SGs (SG4–SG1, represented by red arrows) before or after each of the three configuration series monitored stream stage/discharge. One surface spring fed the creek (tele-blue line). Reach and the Instrumentations are not up to the scale.

Figure 2.
Daily stream thermograph at SG1 (black line is mean, grey area is range) and hyetograph for pre-BDA installation period (2017–2018).
Figure 2.
Daily stream thermograph at SG1 (black line is mean, grey area is range) and hyetograph for pre-BDA installation period (2017–2018).

Figure 3.
Daily ambient air temperature range (black line is mean, grey area is range) and hyetograph (top panel), and daily stream thermographs at SG4-SG1 (bottom four panels) across the pine creek study reach for the post-BDA installation period (2018–2019).
Figure 3.
Daily ambient air temperature range (black line is mean, grey area is range) and hyetograph (top panel), and daily stream thermographs at SG4-SG1 (bottom four panels) across the pine creek study reach for the post-BDA installation period (2018–2019).

Figure 4.
Difference in temperature (ΔT; downstream—upstream) for different BDA configurations used over the 2018–2019 post-BDA installation period (2018–2019).
Figure 4.
Difference in temperature (ΔT; downstream—upstream) for different BDA configurations used over the 2018–2019 post-BDA installation period (2018–2019).

Figure 5.
Differential stream temperature (downstream–upstream) densities for the BDA configurations over the post-BDA installation period (2018–2019).
Figure 5.
Differential stream temperature (downstream–upstream) densities for the BDA configurations over the post-BDA installation period (2018–2019).

Figure 6.
Daily pond temperatures for the three different BDA configurations over the 2019 post-BDA installation period.
Figure 6.
Daily pond temperatures for the three different BDA configurations over the 2019 post-BDA installation period.

Figure 7.
Impacts of BDA configuration, stream discharge, BDA pond level and rainfall on stream temperature (A) and BDA pond temperature (B) using a linear mixed model and compared to a 1:1 line. Goodness of model fit (R2) between modelled and observed values are shown in each case.
Figure 7.
Impacts of BDA configuration, stream discharge, BDA pond level and rainfall on stream temperature (A) and BDA pond temperature (B) using a linear mixed model and compared to a 1:1 line. Goodness of model fit (R2) between modelled and observed values are shown in each case.

Figure 8.
Relationships of daily BDA Pond depth with respective stream (A) and pond (B) temperatures to show the role of ponding on the respective temperature regimes above or below different BDA configurations.
Figure 8.
Relationships of daily BDA Pond depth with respective stream (A) and pond (B) temperatures to show the role of ponding on the respective temperature regimes above or below different BDA configurations.


Table 1.
Statistical analyses results of (1) paired t-comparisons between pre- and post-BDA treatment stream temperatures, (2) One-way analyses of variance (ANOVAs) for daily pond mean maximum temperatures (Tmax), and (3) two mixed-effects models with fixed effects of BDA configuration (single, double, triple), stream discharge, rainfall and BDA pond level, a random effect of BDA configuration, and an outcome variable of stream or pond temperature, over the 2017–2019 study periods †.
| Effect/Term | Stream Temp. (°C) | BDA Pondwater Temp. (°C) | ||||
|---|---|---|---|---|---|---|
| df | F or t-Ratio | p/ LogWorth (-log10(p)) | df | F or t-Ratio | p/ LogWorth (-log10(p)) | |
| PAIRED t-TESTS (Pre- vs. post-BDA installation) | ||||||
| T_1-config. (2018–2019; R2 = 0.57) | 107 | 5.36 | <0.001 | n/a | ||
| T_2-config. (2018–2019; R2 = 0.15) | 107 | 11.41 | <0.001 | |||
| T_2-config. (2017–2019; R2 = 0.11) | 107 | 12.31 | <0.001 | |||
| T_3-config. (2018–2019; R2 = 0.84) | 107 | 7.92 | <0.001 | |||
| Tmax one-way ANOVA (Holm–Sidak method) | ||||||
| (1-config. = 8.3 °C) vs. (2-config. = 9.0 °C) | 175 | −1.81 | 0.070 | 96 | 0.23 | 0.822 |
| (1-config. = 8.3 °C) vs. (3-config. = 9.9 °C) | 169 | −4.12 | <0.001 | 98 | −2.36 | 0.038 |
| (2-config. = 9.0 °C) vs. (3-config. = 9.9 °C) | 169 | −2.30 | <0.042 | 96 | −2.59 | 0.030 |
| MIXED-EFFECTS MODELS (Stepwise Regressions) | ||||||
| BDA configuration | 2,2 | 13.99 | <0.001/ 8.17 | 2,2 | 21.36 | <0.001/ 8.65 |
| (T_1-config.)-(T_2-config.) | - | −2.43 | 0.071 | - | −1.14 | 0.601 |
| (T_1-config.)-(T_3-config.) | - | −6.07 | <0.001 | - | −5.63 | <0.001 |
| (T_2-config.)-(T_3-config.) | - | −2.71 | 0.034 | - | −4.12 | <0.001 |
| Stream discharge | 1,1 | −10.51 | <0.001/ 23.56 | 1,1 | −6.13 | <0.001/ 8.53 |
| Rainfall | 1,1 | −0.58 | 0.565 | 1,1 | −2.06 | 0.041 |
| BDA pondwater level | 1,1 | −3.69 | <0.001/ 3.57 | 1,1 | −3.46 | <0.001/ 3.20 |
| Stream discharge × Rainfall | 1,1 | 4.43 | <0.001 | 1,1 | 3.79 | <0.001 |
| BDA-config. × Stream discharge × Rainfall | 2,2 | 4.80 | 0.003 | 2,2 | 2.25 | 0.025 |
† 1-config., 2-config., 3-config. represent single- double and triple configurations, respectively. Pre- and post-treatment periods are between 20 April and 5 August/2017, 2018, 2019. Tmax period is between 5 August 2018 and 5 August 2019 for stream temperature and 29 April and 5 August 2019 for pond temperatures. A LogWorth value of >2.0 signifies 0.01 level ((-log10(0.01) = 2) and provides strength of significance with greater the value more the strength. p values are significant at <0.05. The maximum of three-way interaction when significant is retained in the stepwise regression method to keep the brevity of model results.
Table 2.
Percent of hours summer stream temperatures fell into one of the five temperature ranges downstream of three BDA configuration series. Maximum growth temperature for bull trout is 13.2 °C with an acclimation temperature range of 8–19.6 °C. The optima zone for westslope cutthroat trout is 13–15 °C while consistent temperatures above 19.6 °C are lethal. Site locations are shown in Figure 1 †.
| Year | BDA Configuration | Total Hours Sampled | Percent of Total Hours in Temperature Range (°C) | ||||
|---|---|---|---|---|---|---|---|
| <10 | 10–12 | 13–15 | 16–19.5 | ≥19.6 | |||
| 2018 | Single | 2776 | 62 | 34 | 4 | 0 | 0 |
| Double | 3258 | 45 | 29 | 20 | 6 | 0 | |
| Triple | 2775 | 48 | 37 | 4 | 11 | 0 | |
| 2019 | Single | 2570 | 69 | 20 | 10 | 1 | 0 |
| Double | 2572 | 64 | 36 | 0 | 0 | 0 | |
| Triple | 2571 | 72 | 23 | 3 | 2 | 0 | |
† summer stream temperature dates ranged between 5 August 2018, and 5 August 2019 (post-BDA installation period).
Publisher’s Note: MDPI stays neutral with regard to jurisdictional claims in published maps and institutional affiliations. |
© 2021 by the authors. Licensee MDPI, Basel, Switzerland. This article is an open access article distributed under the terms and conditions of the Creative Commons Attribution (CC BY) license (https://creativecommons.org/licenses/by/4.0/).
Share and Cite
MDPI and ACS Style
Munir, T.M.; Westbrook, C.J. Thermal Characteristics of a Beaver Dam Analogues Equipped Spring-Fed Creek in the Canadian Rockies. Water 2021, 13, 990. https://doi.org/10.3390/w13070990
AMA Style
Munir TM, Westbrook CJ. Thermal Characteristics of a Beaver Dam Analogues Equipped Spring-Fed Creek in the Canadian Rockies. Water. 2021; 13(7):990. https://doi.org/10.3390/w13070990
Chicago/Turabian StyleMunir, Tariq M., and Cherie J. Westbrook. 2021. "Thermal Characteristics of a Beaver Dam Analogues Equipped Spring-Fed Creek in the Canadian Rockies" Water 13, no. 7: 990. https://doi.org/10.3390/w13070990
Note that from the first issue of 2016, this journal uses article numbers instead of page numbers. See further details here.