
Mountain Road-Culvert Maintenance Algorithm
by
 ,
,
Vladimir Mandić
1, 
Miloš Šešlija
2 ,
,
Slobodan Kolaković
2,*,
Srđan Kolaković
2,
Goran Jeftenić
2 and
Slaviša Trajković
3
1
Faculty of Mechanical and Civil Engineering in Kraljevo, University of Kragujevac, 36000 Kraljevo, Serbia
2
Faculty of Technical Sciences, University of Novi Sad, 21000 Novi Sad, Serbia
3
Faculty of Civil Engineering and Architecture, University of Niš, 18000 Niš, Serbia
*
Author to whom correspondence should be addressed.
Water 2021, 13(4), 471; https://doi.org/10.3390/w13040471
Submission received: 7 December 2020
/
Revised: 13 January 2021
/
Accepted: 26 January 2021
/
Published: 11 February 2021
(This article belongs to the Section Hydraulics and Hydrodynamics)
Abstract
:The objective of this research was to determine the probability of road overtopping occurrence for a road culvert caused by surface runoff from the upstream catchment. A hydrological–hydraulic model was used for the development of an algorithm for road culvert maintenance based on the overtopping occurrence probability (CMOOP algorithm) for small mountain catchments. The hydrological model defines the regression dependence between the runoff hydrograph peak values and the probability of occurrences, whereas the hydraulic model calculates the culvert flow capacity by including in the calculation the level of sediment that culvert is filled with. The relationship between occurrences of overtopping and peak runoff value was defined using the runoff hydrograph transformation model in the accumulation on the upstream side of the road. In addition to the calculation of overtopping occurrence probability for the existing culvert condition, the CMOOP algorithm was used to analyze the impact of rehabilitation and reconstruction works from the perspective of legally based safety criterion for road overtopping occurrence probability (SCROOP). The CMOOP algorithm was appled to 67 concrete culverts located in a mountain road section in the Republic of Serbia. The results show that the application of rehabilitation works on selected culverts will increase the percentage of culverts that satisfy SCROOP from 49.25% to 89.55%, which confirms that the accumulated stone sediment is the main reason for the SCROOP unfulfillment.
1. Introduction
Road culverts are specific engineering structures that, in addition to their primary role of conveying surface water under the road, have several functions such as providing passage for people and vehicles, or safe passage of wild animals under the road [1]. These secondary functions of culverts can sometimes be of such importance that their size is defined to meet these conditions [2]. The available literature offers recommendations for designing and sizing new road culverts according to the different criteria [3,4,5,6]. In contrast to road culvert design, the maintenance of the existing road culverts has been much less researched.
Road culverts are typically located in the lower part of the road embedment, so they are not easily accessible for inspection and maintenance [7]. The lack of maintenance inhibits the culvert’s primary function, which can consequently result in road overtopping and failure of the road culvert [8]. Road overtopping by floodwater is dangerous, affecting both traffic safety and the stability of the road structure. According to research data, around 75% of flood-related fatalities occur when people drive into or attempt to walk through floodwaters [9,10,11]. Consequential repairs of the road structure defects, caused by water overtopping over the road may require significant financial resources [12,13].
The significance of this problem has encouraged several authors [14] to estimate the risk of road culvert failure based on the assessment of multiple parameters of the culvert’s existing condition [15,16,17,18] or by applying artificial intelligence [19]. In contrast to these studies, which estimated the risk level based on parameters that gradually lead to culvert failure, we aimed to determine the probability of occurrence of road overtopping at culvert cross-section, which is a phenomenon that can lead to the immediate failure of a road culvert. We calculated the probability of road overtopping occurrence based on the hydrological–hydraulic model of the studied phenomenon. The studies that have analyzed the problem of road overtopping from the aspect of occurrence probability calculation, as well as studies based on the same assumptions and principles of problem analyses, will be presented in the next paragraphs.
Hydraulic modeling of the current culvert condition requires the inclusion of the accumulated sediment level inside the culvert in the flow capacity calculation. So far, this problem has been analyzed in several studies [20,21,22,23] from two different aspects: the friction coefficient change and the decreasing cross-sectional area of the culvert. Nwaogazie and Agiho [24] presented the possibilities of HY-8 software for hydraulically modeling road culverts, and their conclusions on the quality of the obtained calculations showed that this software should be used for calculation of flow capacity for the current condition of road culvert.
Hydraulic modeling of the passage of a 100-year flood through a box culvert filled with rock sediment was presented by Pelivanoski and Ivanoski [25]. They also analyzed the application of rehabilitation and reconstruction works on the culvert to meet the criterion of the passage of a 100-year flood. Their conclusions indicate the need for a check-up calculation of the current culverts’ hydraulics because some culverts may be hydraulically undersized, mainly because they were designed with limited field data in the first place.
The occurrence of road overtopping on a mountain ephemeral stream was analyzed according to the effectiveness of road culverts by Conesa-García and García-Lorenzo [26]. They emphasized the importance of stone sediment accumulated in the culverts, and concluded that in around 85% of the analyzed culverts, road overtopping was directly caused by the accumulated rock sediment.
A framework for the formation of the hydrological–hydraulic model was constructed by Soong et al. [27]. Although their main goal was to map the flood zones of the studied area, they demonstrated the application of their model for road overtopping modeling in the cross-section of road culverts for the floods with 1% and 0.2% occurrence probability. Günal et al. applied this framework for the calculation of box culverts [28], where guidelines for geographic information system (GIS) tools’ application can be found for the formation of a hydrological–hydraulic model.
Truhlar et al. [29] presented the algorithm for the selection of road culverts that need to be repaired or replaced due to a return period of overtopping, which is based on a hydrological–hydraulic model that was implemented as a GIS tool. The algorithm proposed by Truhlar et al. determines the maximum return period of the runoff hydrograph that can pass through road culvert by comparing the results of the hydrological model, which determines the return period of the runoff hydrograph peaks based on designed rainfalls, and the results of the hydraulic model, which determines the maximum flow capacity of the culvert for the water level before the overtopping starts. They did not use the legally defined limit value of the return period (or probability of occurrence) based on which the culverts can be divided into those that satisfy the criterion and those that need to be repaired or replaced. Although Truhlar et al. provided a methodologically suitable approach to the analyzed problem, the proposed algorithm does not calculate the probability of occurrence of road overtopping, and the hydraulic model does not consider the amount of sediment inside the culvert or the hydrograph transformation model of the runoff hydrograph in the accumulation on the upstream side of the road.
Our basic research hypothesis was that the main generator of the increase in road overtopping occurrence probability in small mountain catchments is stone sediment filling of a culvert cross-section, which is a consequence of poor culvert maintenance. The basic hypothesis formulated the objective of this research, which was the development of a practically applicable algorithm for road culvert maintenance based on the probability of road overtopping occurrence (CMOOP algorithm) for small mountain catchments (area < 1 km2), which adds to the existing research in this field as follows:
- the determination of the overtopping occurrence probability based on regression dependence between the peak runoff hydrograph value and the probability of occurrence of designed rainfall forming the runoff hydrograph on small mountain catchments that do not have a base water flow during the year;
- the inclusion of the accumulated stone sediment inside the culvert in the flow capacity calculation by combining the two aspects of the analyzed problem: the friction coefficient change and the decreasing cross-sectional flow area of the culvert;
- the inclusion of a model of runoff hydrograph transformation in the accumulation on the upstream side of the road, which determines the transformation coefficient of the hydrograph peak based on the relationship between the peak runoff hydrograph value and the maximum flow capacity of the road culvert, into the hydraulic model;
- the definition of a safety criterion of road overtopping occurrence probability (SCROOP) by legal regulations, which enables the application of the CMOOP algorithm in other countries;
- an algorithm that analyzes the impact of rehabilitation and reconstruction works on culverts with the aim of fulfilling the defined safety criterion; and
- the application of summary results of the CMOOP algorithm for the purpose of planning the culvert’s maintenance for the mountain road sections.
The application of the CMOOP algorithm was presented on a section of mountain road between Raška and Novi Pazar, Republic of Serbia, with 67 concrete culverts.
2. Materials and Methods
2.1. Study Area
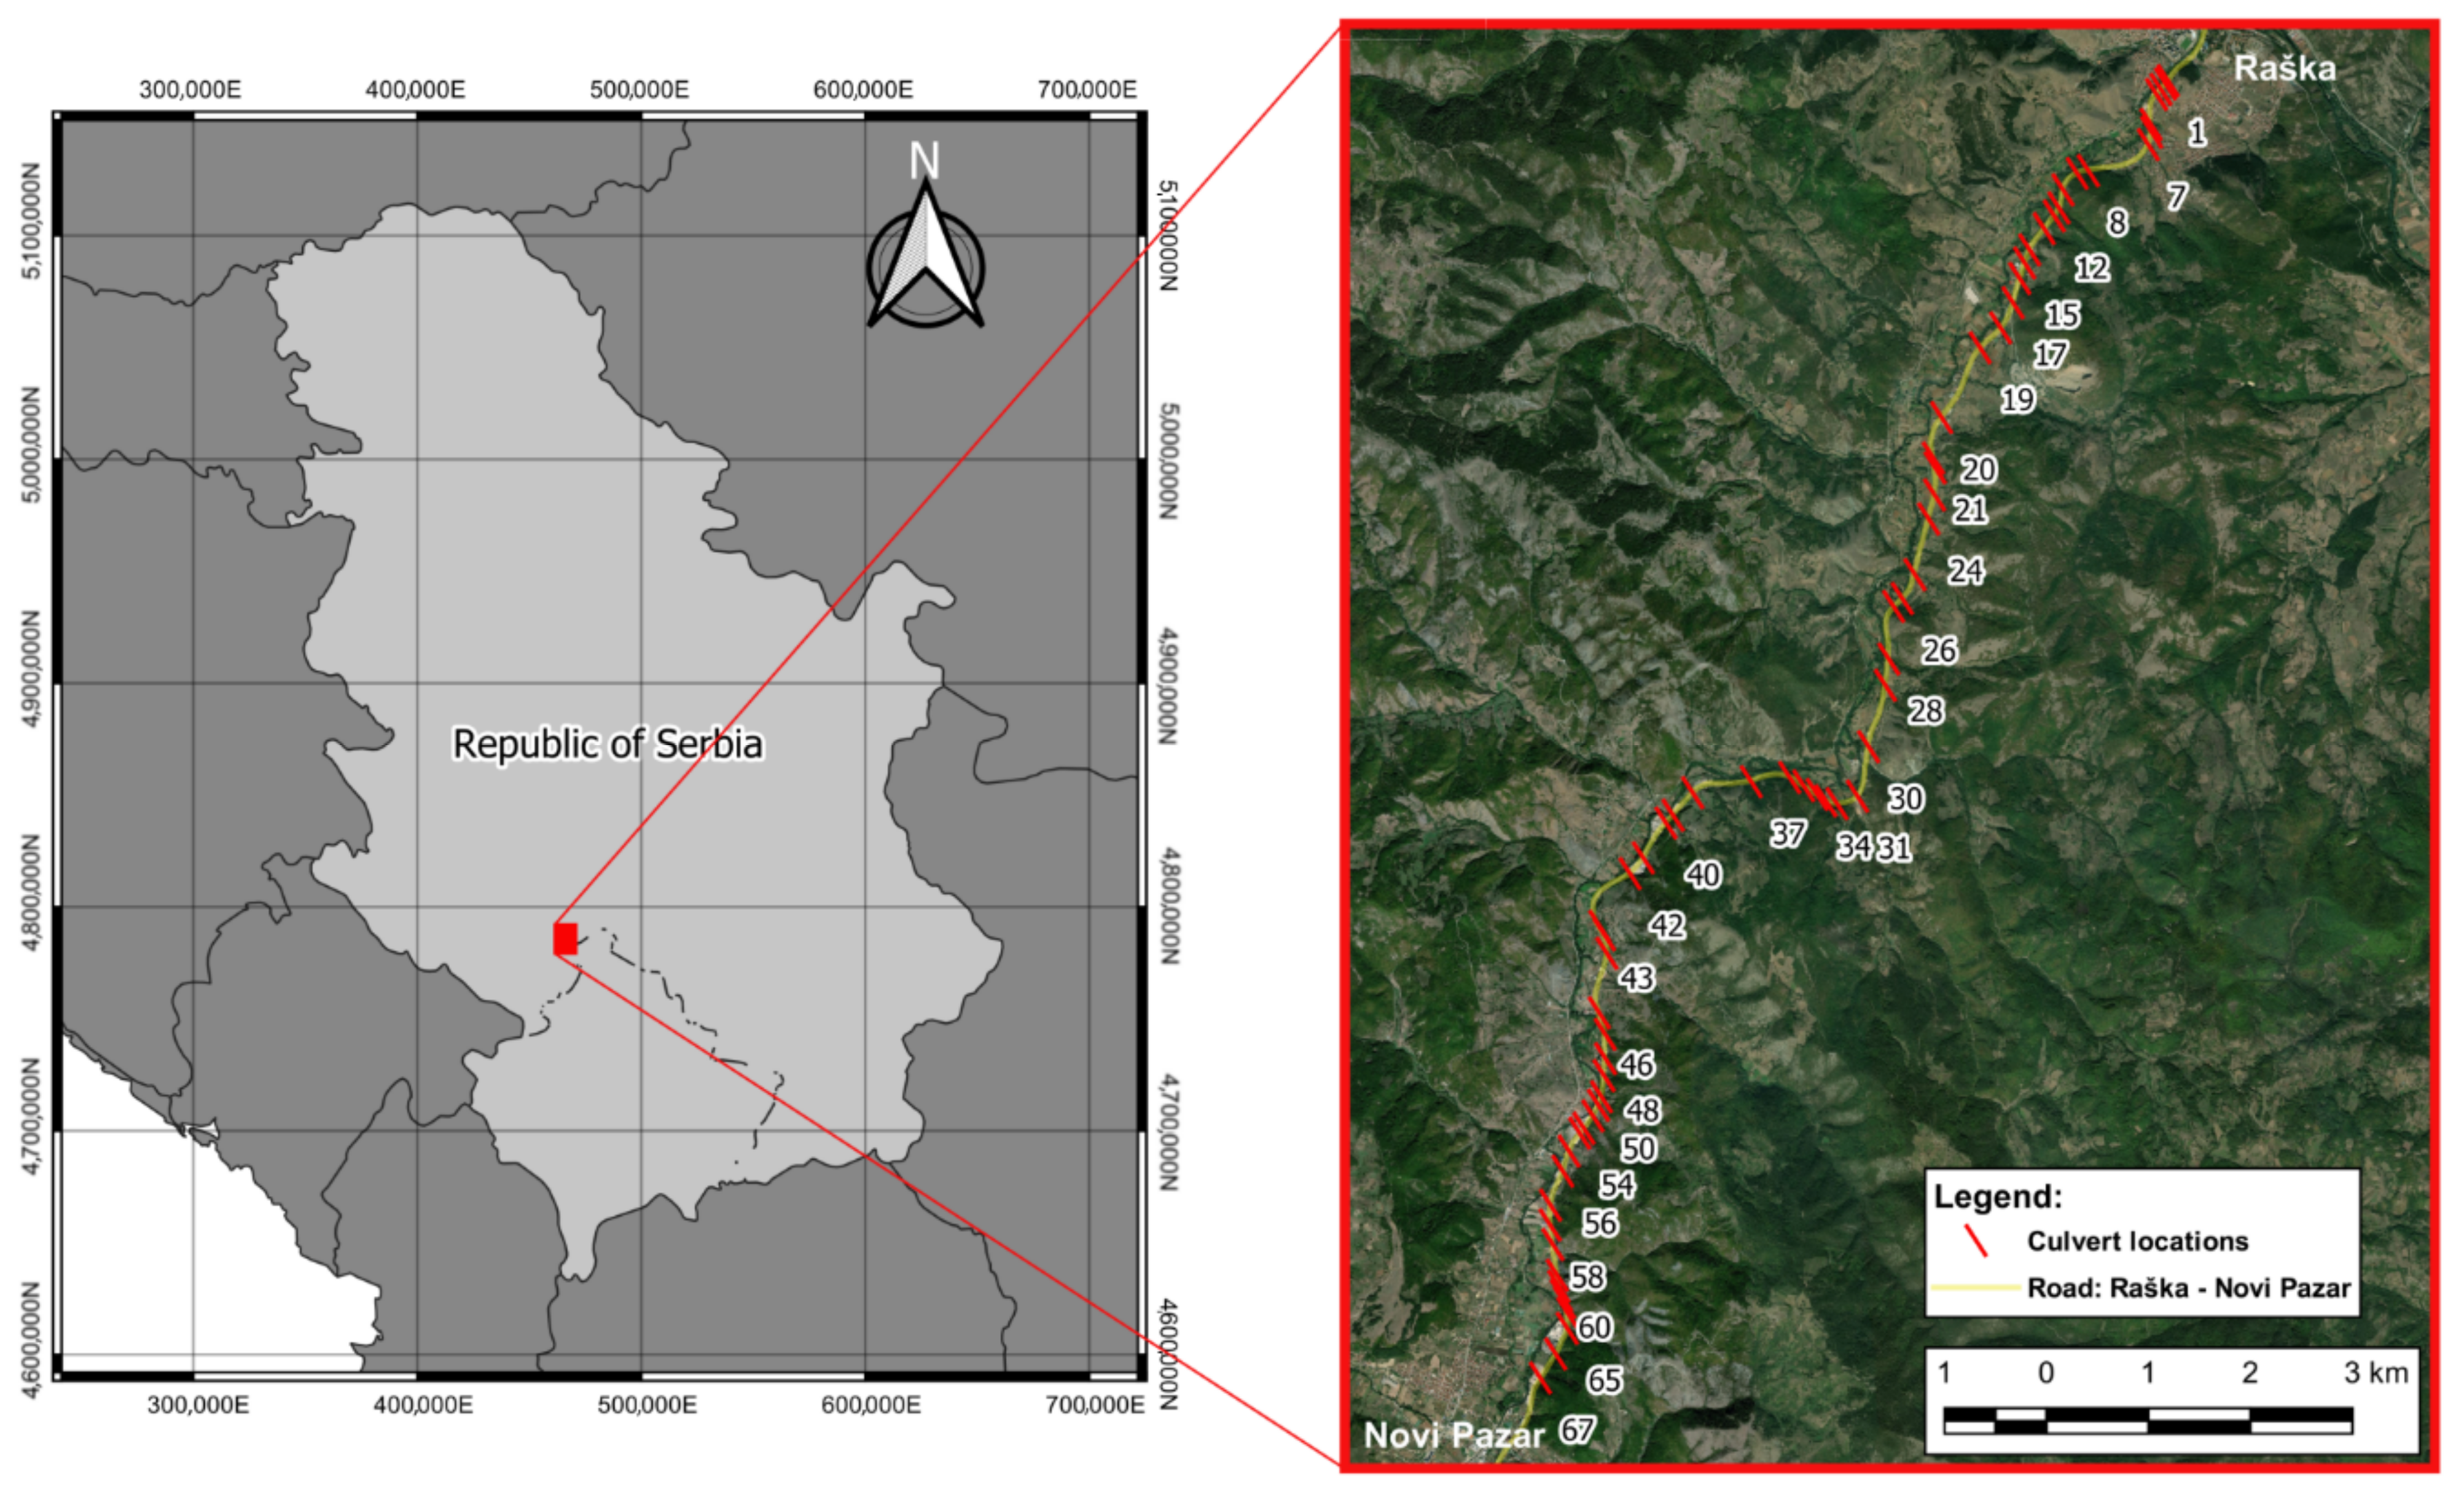
The proposed algorithm was applied on culverts located on a section of mountain road between Raška and Novi Pazar, in the Republic of Serbia, from stationing: km 236 + 001 to km 253 + 891, with a total length of 17.890 km (Figure 1).
The analyzed section of the road follows the course of the river Raška through a mountainous terrain where 67 concrete road culverts are located with three characteristic types of cross-sections: box, pipe, and pipe-arch (Figure 2).
Table 1 presents the most important data that characterize the analyzed culverts for the purpose of monitoring calculation results, while the complete table with all available data and calculation results can be downloaded from the open-source database referenced in the Supplementary Materials section of this paper. The authors support the principle of "open-source science" and allow all data used in calculations, as well as the results of analyses, to be publicly available, which, together with used methods and materials (Table 1), enables the repeatability of research.
2.2. Data Gathering and Preparation
The main assumption that the CMOOP algorithm was based on is as follows: “The road overtopping occurrence probability is equal to the occurrence probability of precipitation, which forms the runoff hydrograph that, after the peak transformation, increases the upstream water level to the level which is equal or higher of the road pavement”. This hypothesis, which has already been similarly formulated in literature [29,30,31,32], is based on the fact that rain of certain intensity and duration is the basic mechanism for generating a runoff from small mountain catchments with ephemeral or torrential streams, that do not have a base water flow during the year.
According to the main assumption, road overtopping begins when the level of water on the upstream side of the road reaches the level of final pavement layer. Therefore, the probability of overtopping occurrence is determined as the probability of water occurrence at the elevation of the final pavement layer due to the transformation of the upstream runoff hydrograph in the accumulation on the upstream side of the road. The CMOOP algorithm is based on a hydrological–hydraulic model of a small mountain catchment with a road culvert at its outlet profile. The methods and materials used for the development of the hydrological–hydraulic model, as well as the software used, are systematized in Table 2.
The digital elevation model (DEM), which can be developed from various data obtained from direct and remote observations, represents the basis of most of the hydrological analysis. The input data for the hydrological model were determined using the Global Digital Elevation Model (GDEM) from the publicly available database of NASA’s space mission: Advanced Spaceborne Thermal Emission and Reflection Radiometer (ASTER), version 3 of which has a resolution of 1 arc-second or approximately 30 x 30 m for 1 pixel [61,62]. The DEM was used for the determination of data necessary for the hydrological model: runoff flow directions, stream detection, delineation, and determination of physical parameters of the catchment (area, maximum and flattened slope, flow length, etc.). Soil type and land use data, which are necessary for hydrological modeling of the surface runoff, were taken from the public databases [44,45].
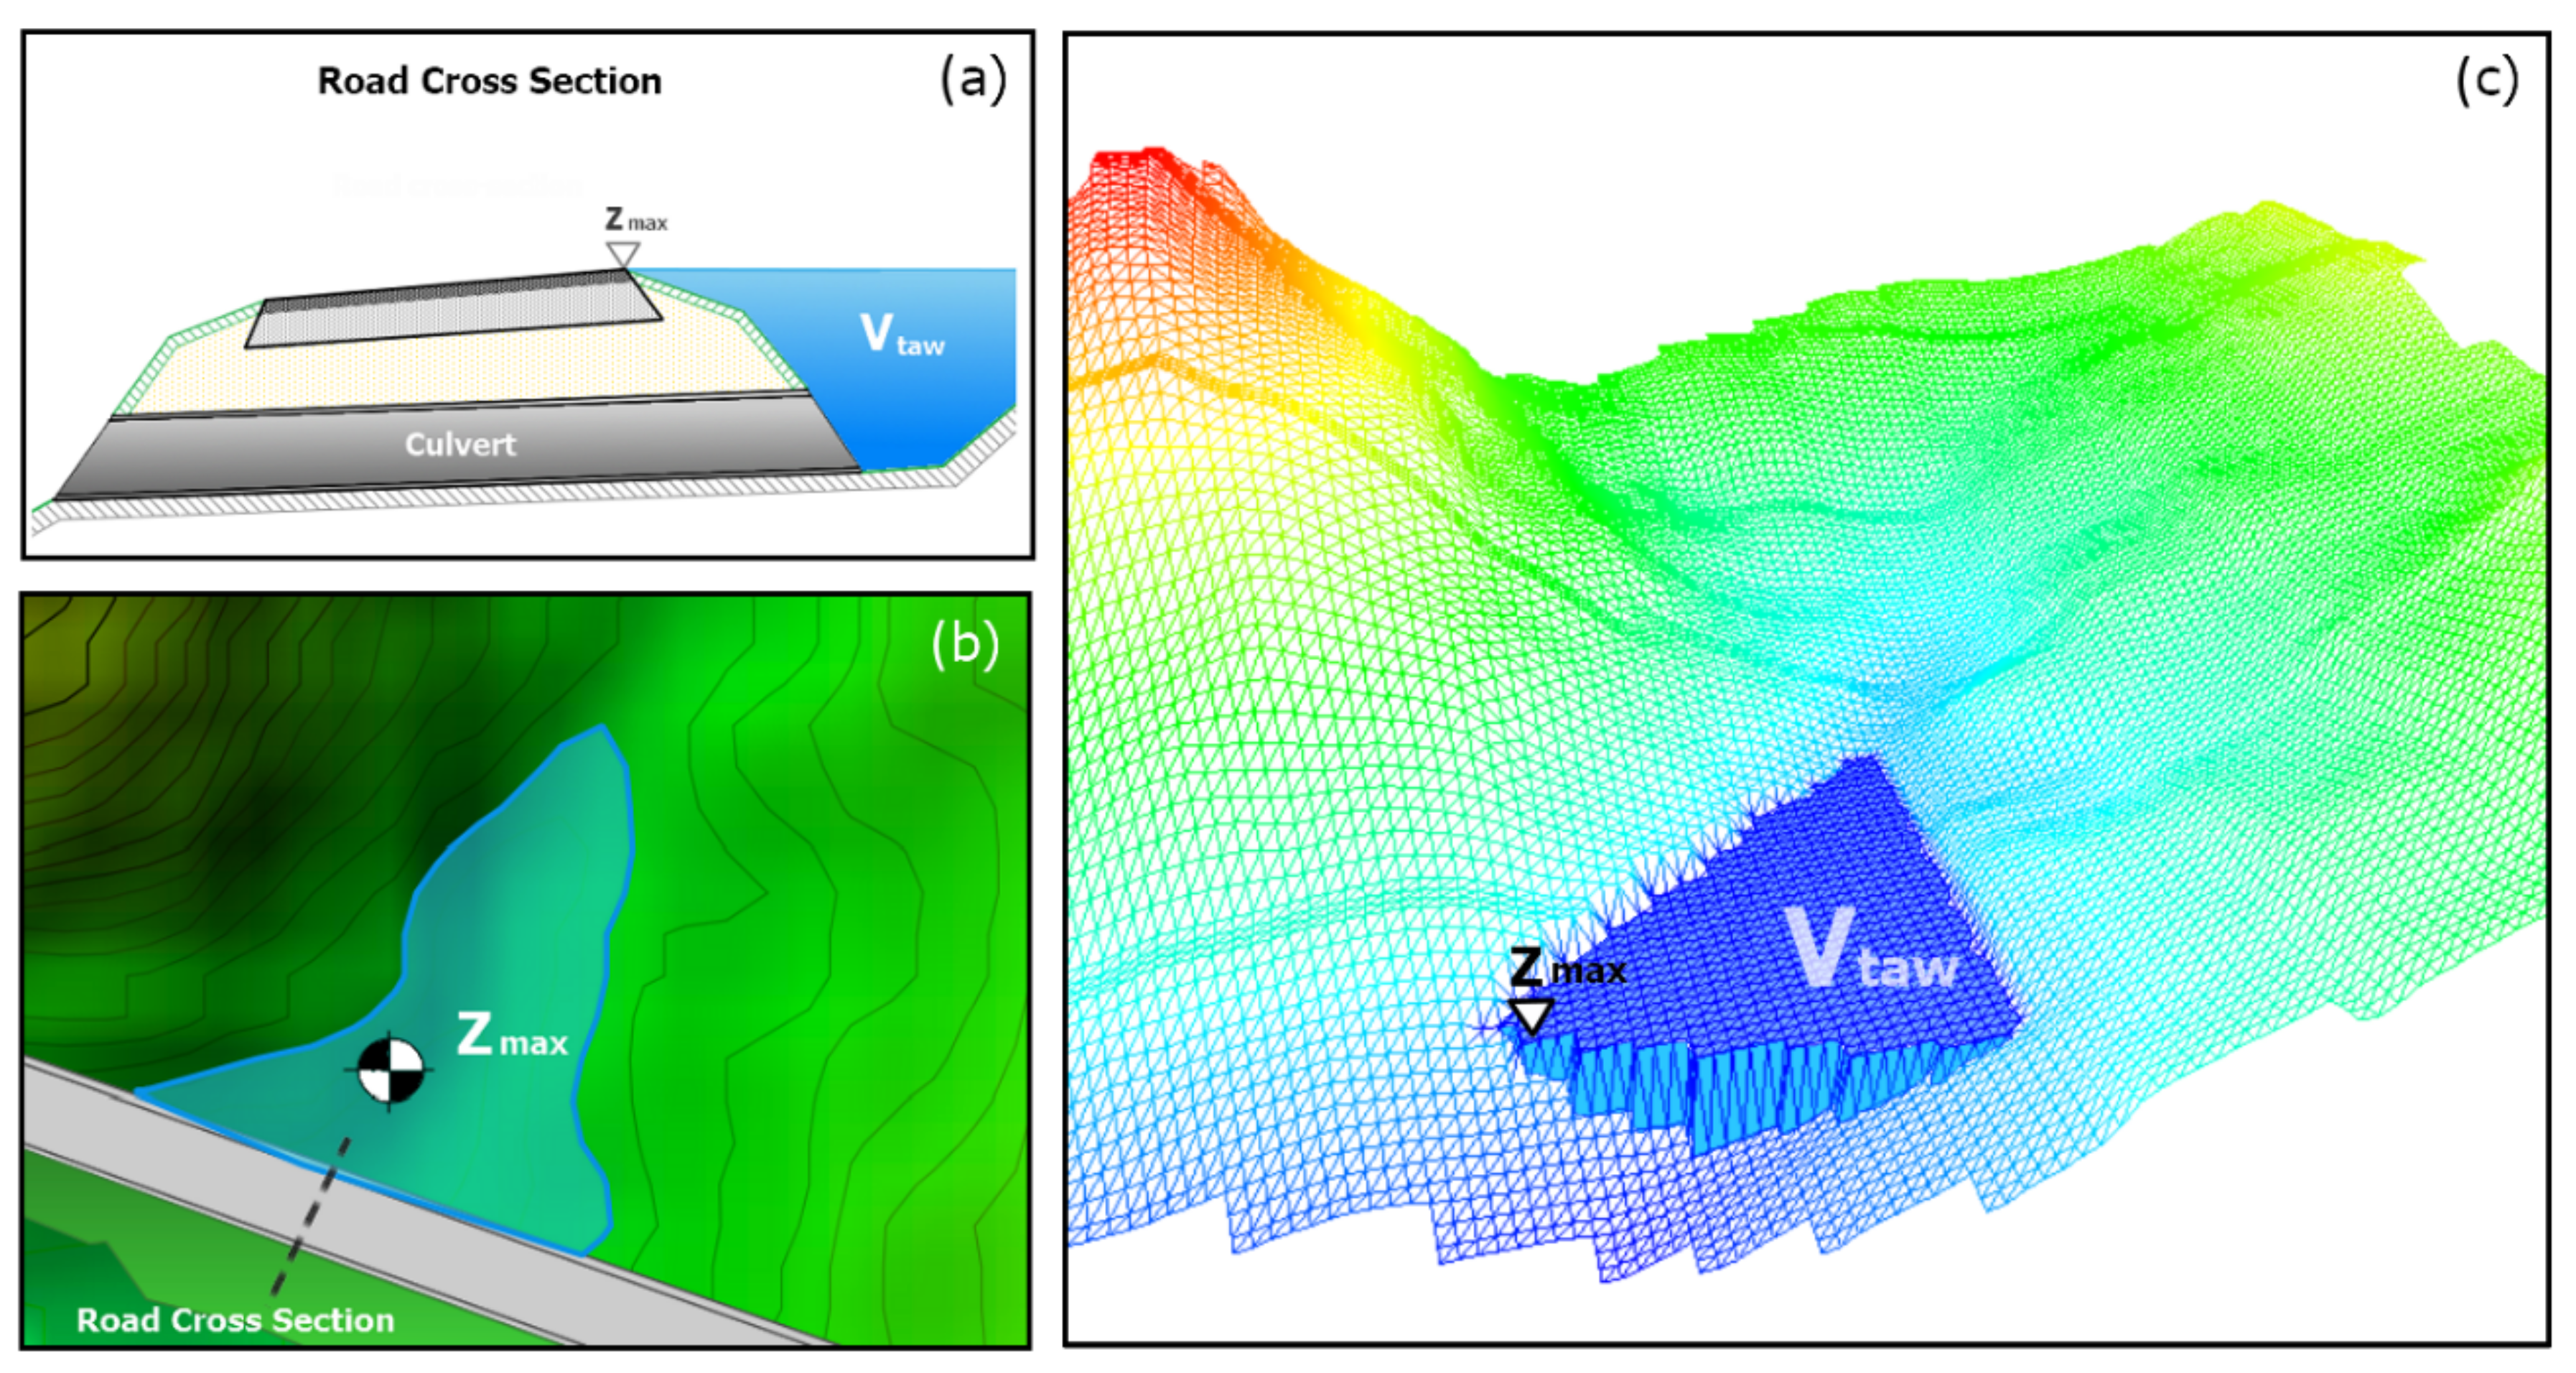
The input data for hydraulic modeling of the flow capacity of road culverts were determined by in-situ direct geodetic measurement of all required dimensions. For calculation of runoff hydrograph transformation, it was necessary to determine the volume of temporarily accumulated water on the upstream side of the road (Vtaw), which was determined by the volume between surfaces method, based on spatial triangulation, as shown in Figure 3.
2.3. Hydrological Model
The hydrological model was used for the calculations of runoff hydrographs from rainfalls with a defined probability of occurrence, based on which the regression dependence between the probability of occurrence and the peak value of the runoff hydrograph was defined. The HEC-HMS model [48,63], with the SCS unit hydrograph method [53], was used to transform precipitation into a runoff hydrograph. For small mountain catchments, instead of the HEC-HMS, the HEC-1 method can also be applicable.
The specificity of small mountain catchments is the fast hydrological response of the catchment to rainfall, which requires the precise determination of the duration of design rainfall [64,65]. The duration of design rainfall, as the rainfall duration that creates the highest peak value of runoff hydrograph, can be determined in an iterative procedure within the hydrological model by comparing several runoff hydrographs from the different duration rainfalls with the same occurrence probability.
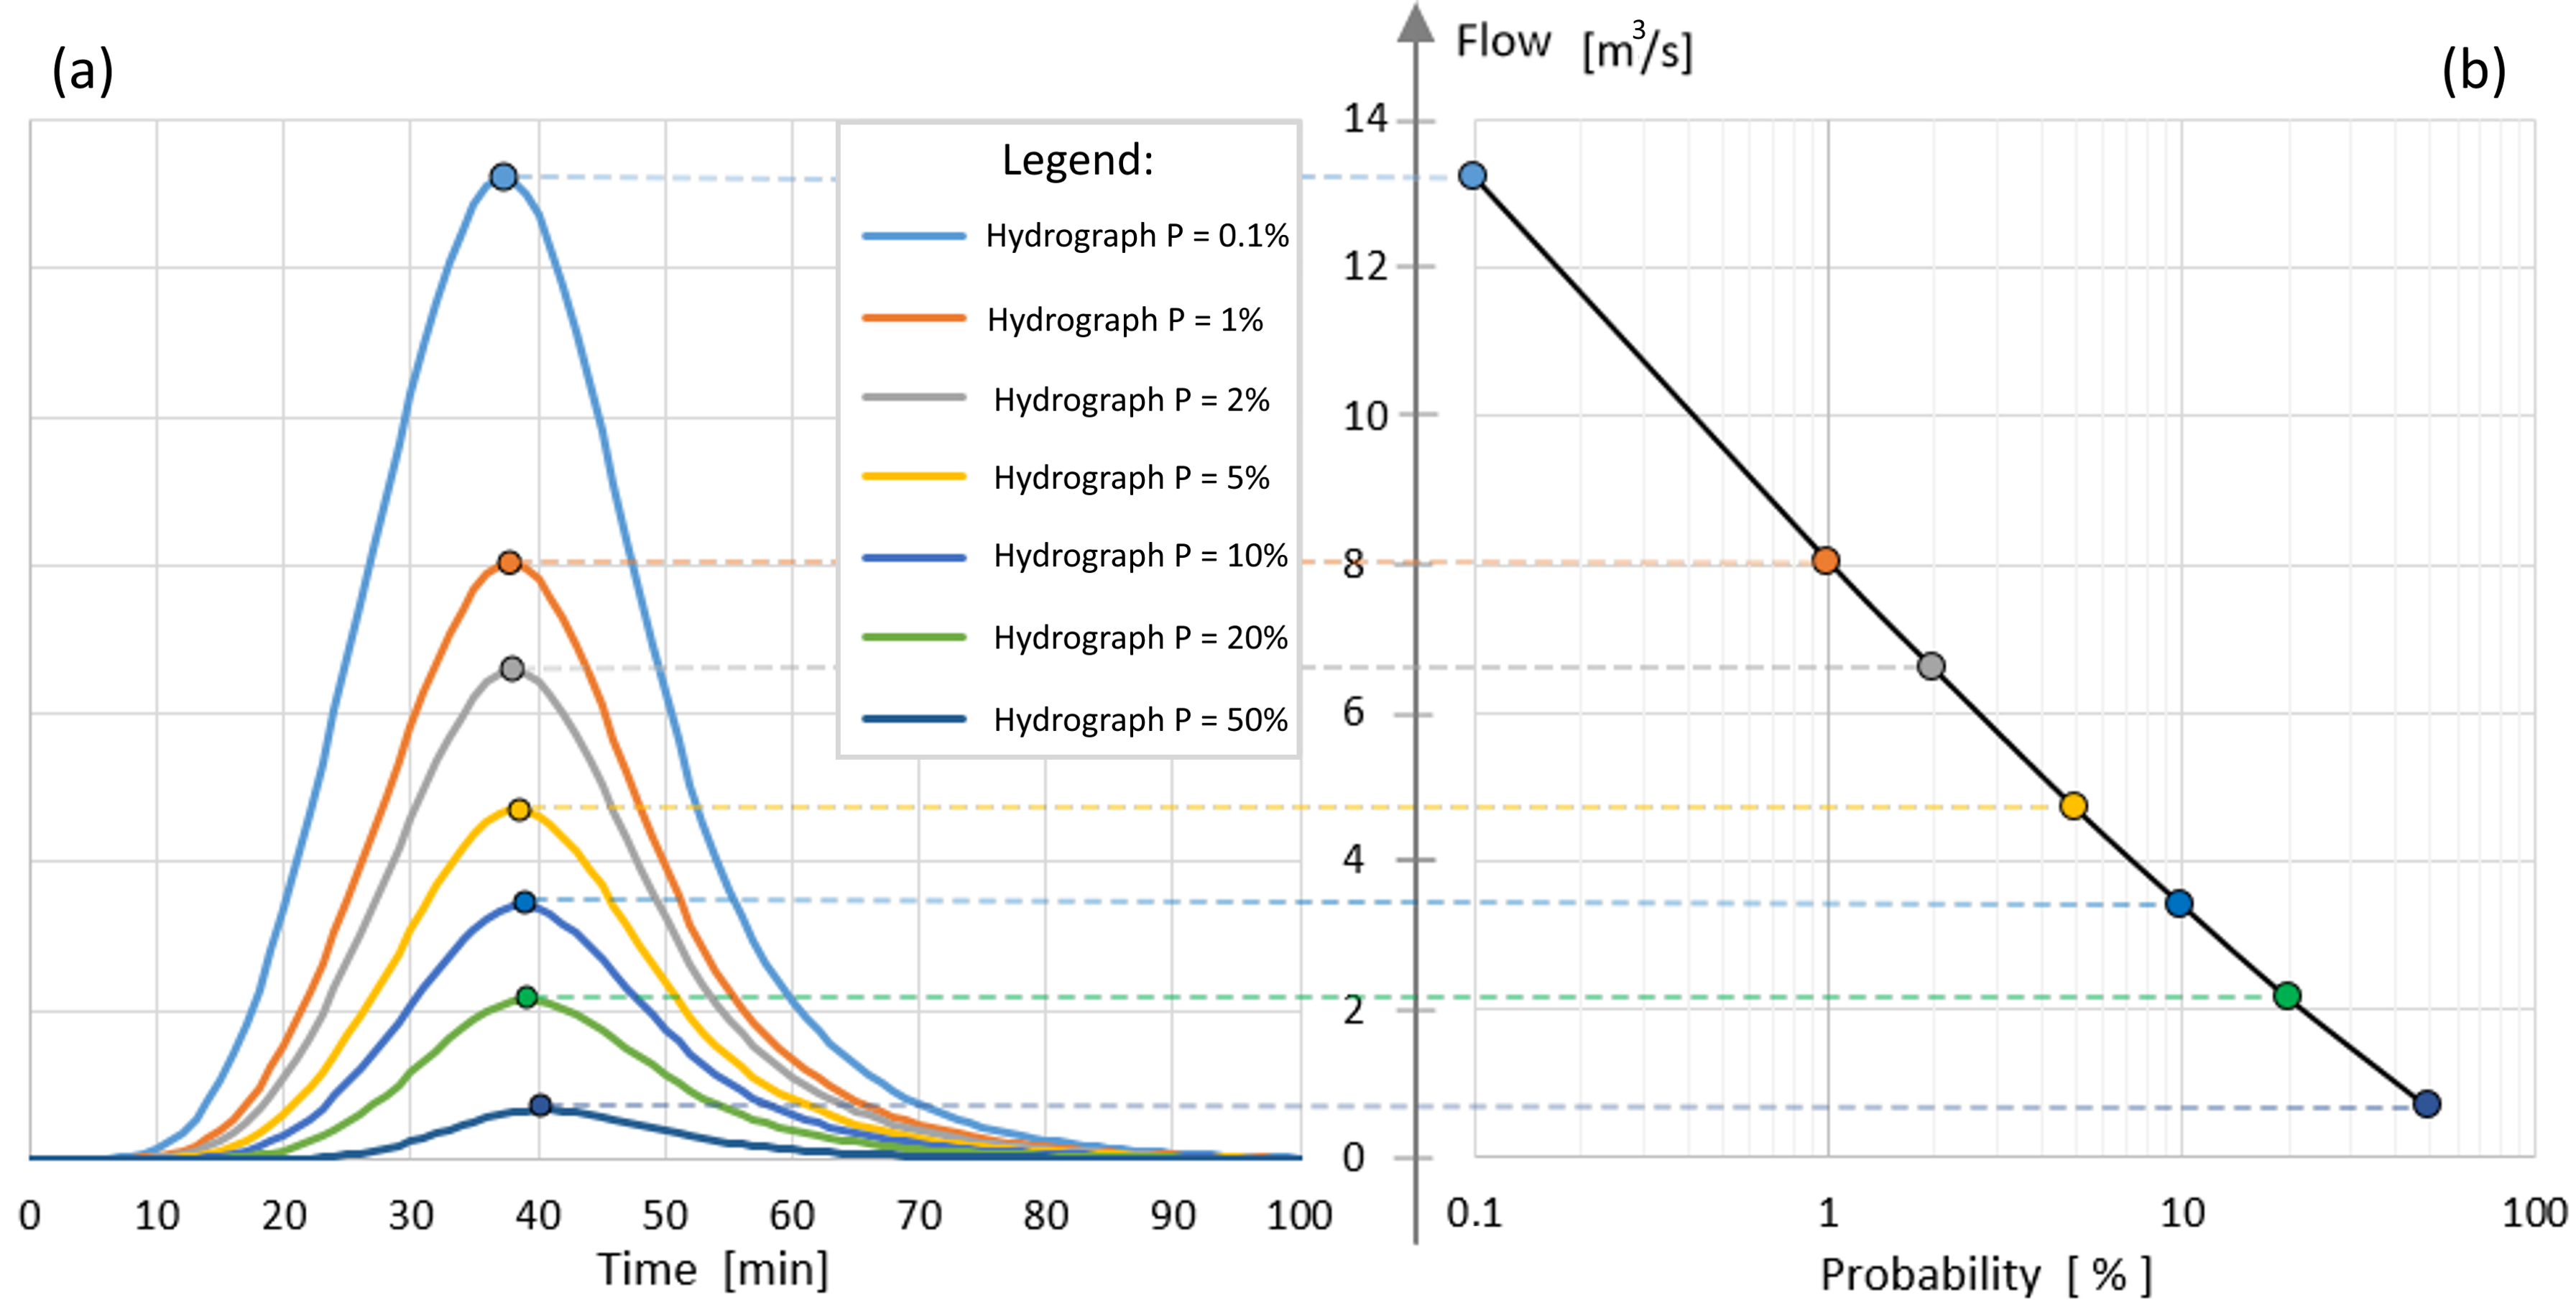
Based on the defined duration of design rainfall and IDF curves (intensity–duration–frequency curves) for the analyzed region [52], the hydrological model determines the runoff hydrographs from rainfalls of different probabilities of occurrence. The main assumption defines an equal relationship between the probability of the occurrence of road overtopping and the probability of the occurrence of the design rainfall that leads to the overtopping occurrence. Runoff hydrographs of the different probability of occurrence are shown in Figure 4a, while Figure 4b shows the regression dependence between the peak value of runoff hydrograph and the probability of occurrence of the design rainfall.
The conducted analysis showed that the exponential function (Equation (1)) describes the stated regression dependence with high values of the regression coefficient (R2 > 0.9):
where: P—probability of occurrence (%), Qmax—the peak value of the runoff hydrograph (m3/s), A and B—the parameters determined for each basin separately (/).
2.4. Hydraulic Model
The hydraulic model consists of two basic components: the first component is the culvert flow capacity calculation model, and the second one is the hydrograph transformation model of the runoff hydrograph in the accumulation on the upstream side of the road. The result of the first component of the hydraulic model is a culvert performance curve which was determined using the HY-8 software (Federal Highway Administration (FHWA), Washington, DC, USA) [57]. The main advantage of HY-8 software is its compatibility with the software Watershed Modeling System (WMS) [41], which has been used for hydrological modeling.
Hydraulic modeling of the current culvert condition requires the inclusion of the accumulated sediment level inside the culvert in the flow capacity calculation. The accumulation of large quantities of stone sediment at the inlet, outlet, and the culvert body is a result of a significant amount of sediment production on small mountain catchments, especially in the catchments with sparse vegetation. This process directly influences the probability of road overtopping occurrence, which is why the problem of calculating the capacity of culverts filled with sediment was analyzed by combining the two aspects: the friction coefficient change aspect and the aspect of decreasing the cross-sectional area of the culvert. The percentage of cross-sectional sediment filling in the culvert (Hsf) was defined as the ratio between the height of the culvert cross-section (h) and the average height of accumulated stone sediment inside the culvert (he). The average height of accumulated stone sediment was determined by comparing technical documentation of the constructed culvert and results of geodetic surveying of the current condition of the analyzed culvert.
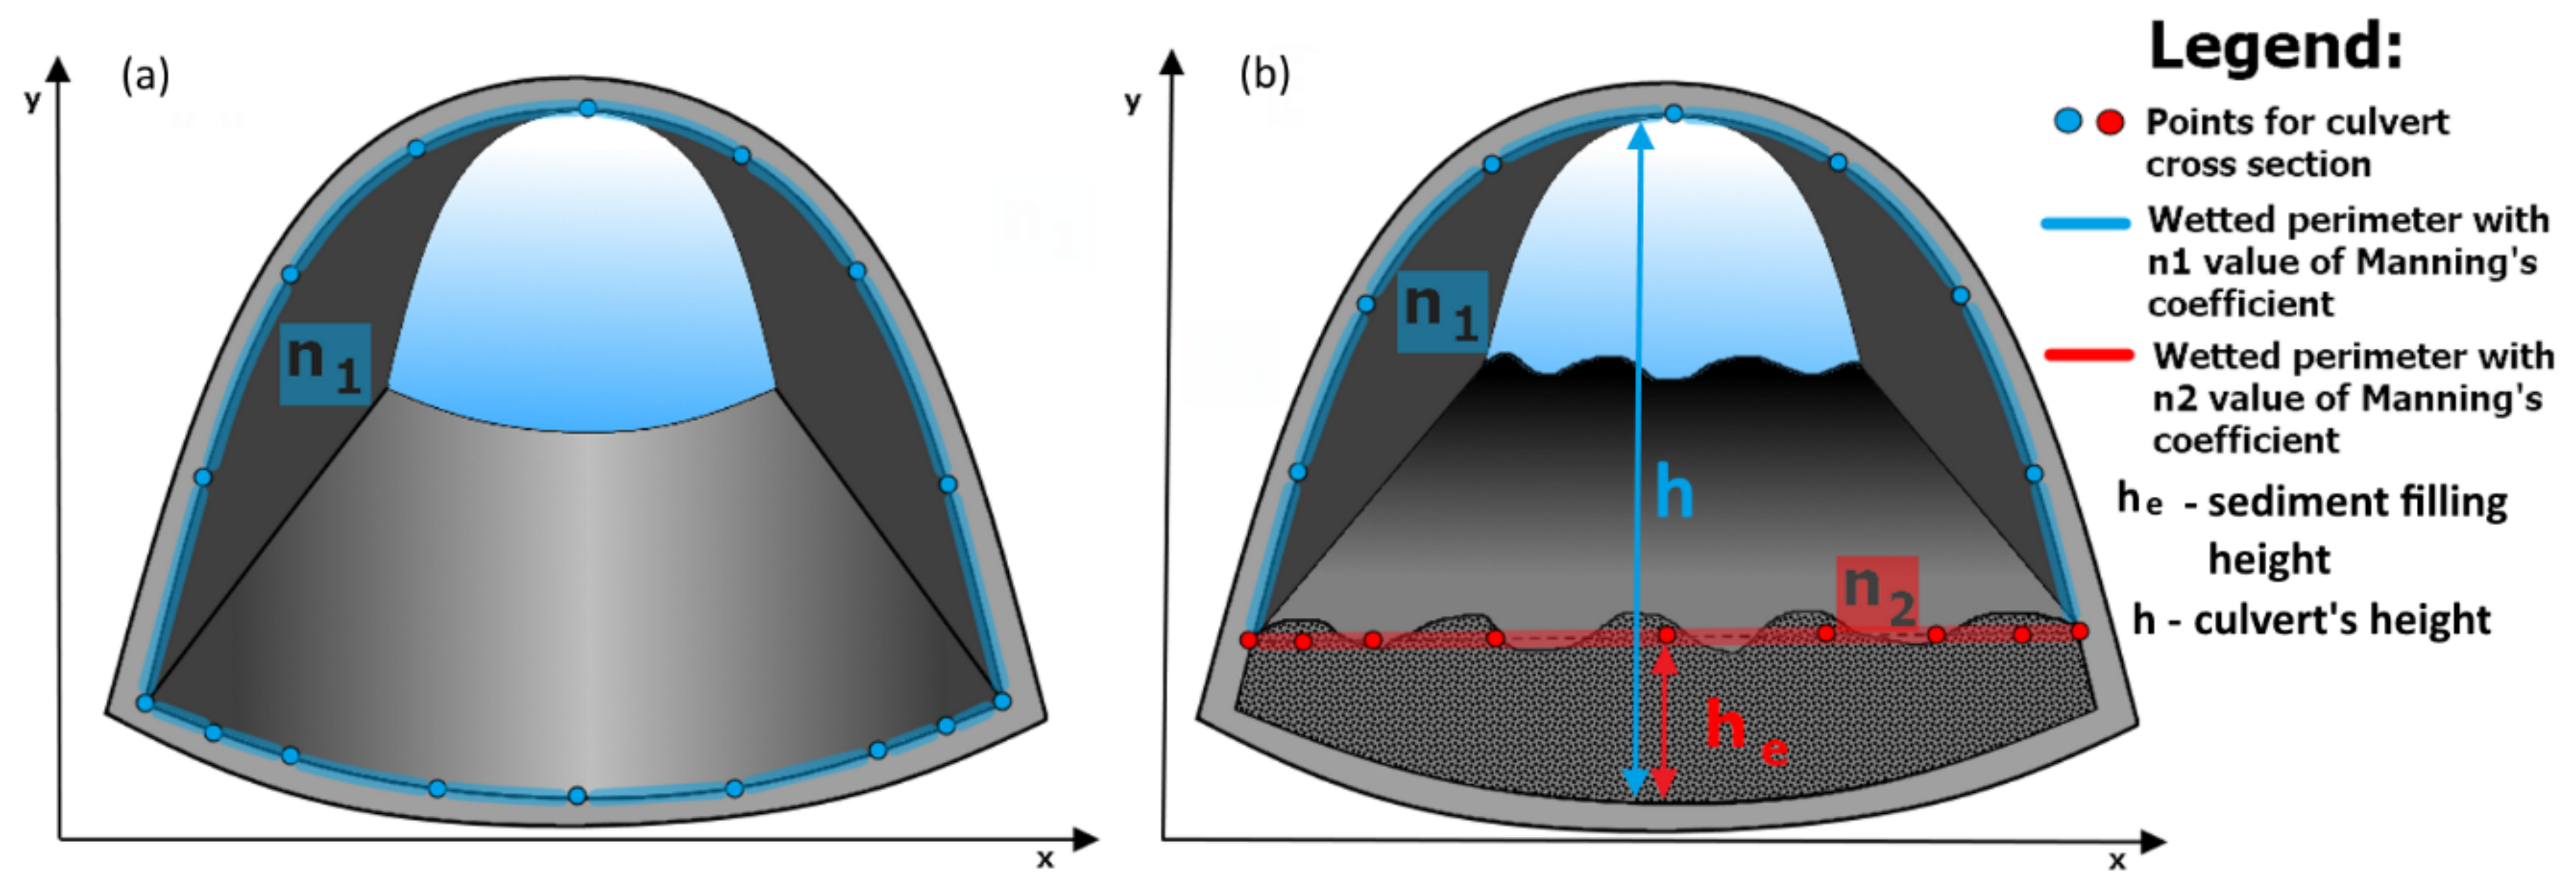
One of the main advantages of HY-8 software usage is the possibility of entering the complex geometry of culvert cross-section by entering the points of the upper and lower side of the culvert cross-section in the X–Y coordinate system (Figure 5a), as well as entering different coefficients of friction for the modeling of a culvert filled with stone sediment (Figure 5b).
The averaged value of Manning’s roughness coefficient for the cross-section of the culvert filled with stone sediment was determined using the equation by Yen [66,67]:
where: ne—equivalent (or averaged) Manning’s roughness coefficient (m−1/3s), ni—individual Manning’s roughness coefficient (m−1/3s) for each surface area with a wetted perimeter length Oi (m), where the total length of the wetted perimeter of cross-section is O (m).
The second component of the hydraulic model is the hydrograph transformation model of the runoff hydrograph in the accumulation on the upstream side of the road. Approximation of triangular hydrographs was used for the hydrograph transformation model for small mountain catchments, as shown in Figure 6.
The hydrograph transformation model calculates the transformation coefficient of the hydrograph peak (Ktr), based on the volume of temporarily accumulated water on the upstream side of the road (Vtaw) and the volume of the runoff hydrograph (V). The transformation coefficient of the hydrograph peak, Ktr (/), represents the ratio between the value of the peak of the inlet hydrograph, Qmaxin (m3/s), generated by the runoff due to a design rainfall, and the value of the peak of outlet hydrograph of culvert discharge, Qmaxout (m3/s). The triangular hydrograph approximation enables derivation of Equation (3), of which similar forms can be found in other literature [68], for the calculation of the transformation coefficient of the hydrograph peak:
2.5. Algorithm for Road Culvert Maintenance Based on the Overtopping Occurrence Probability
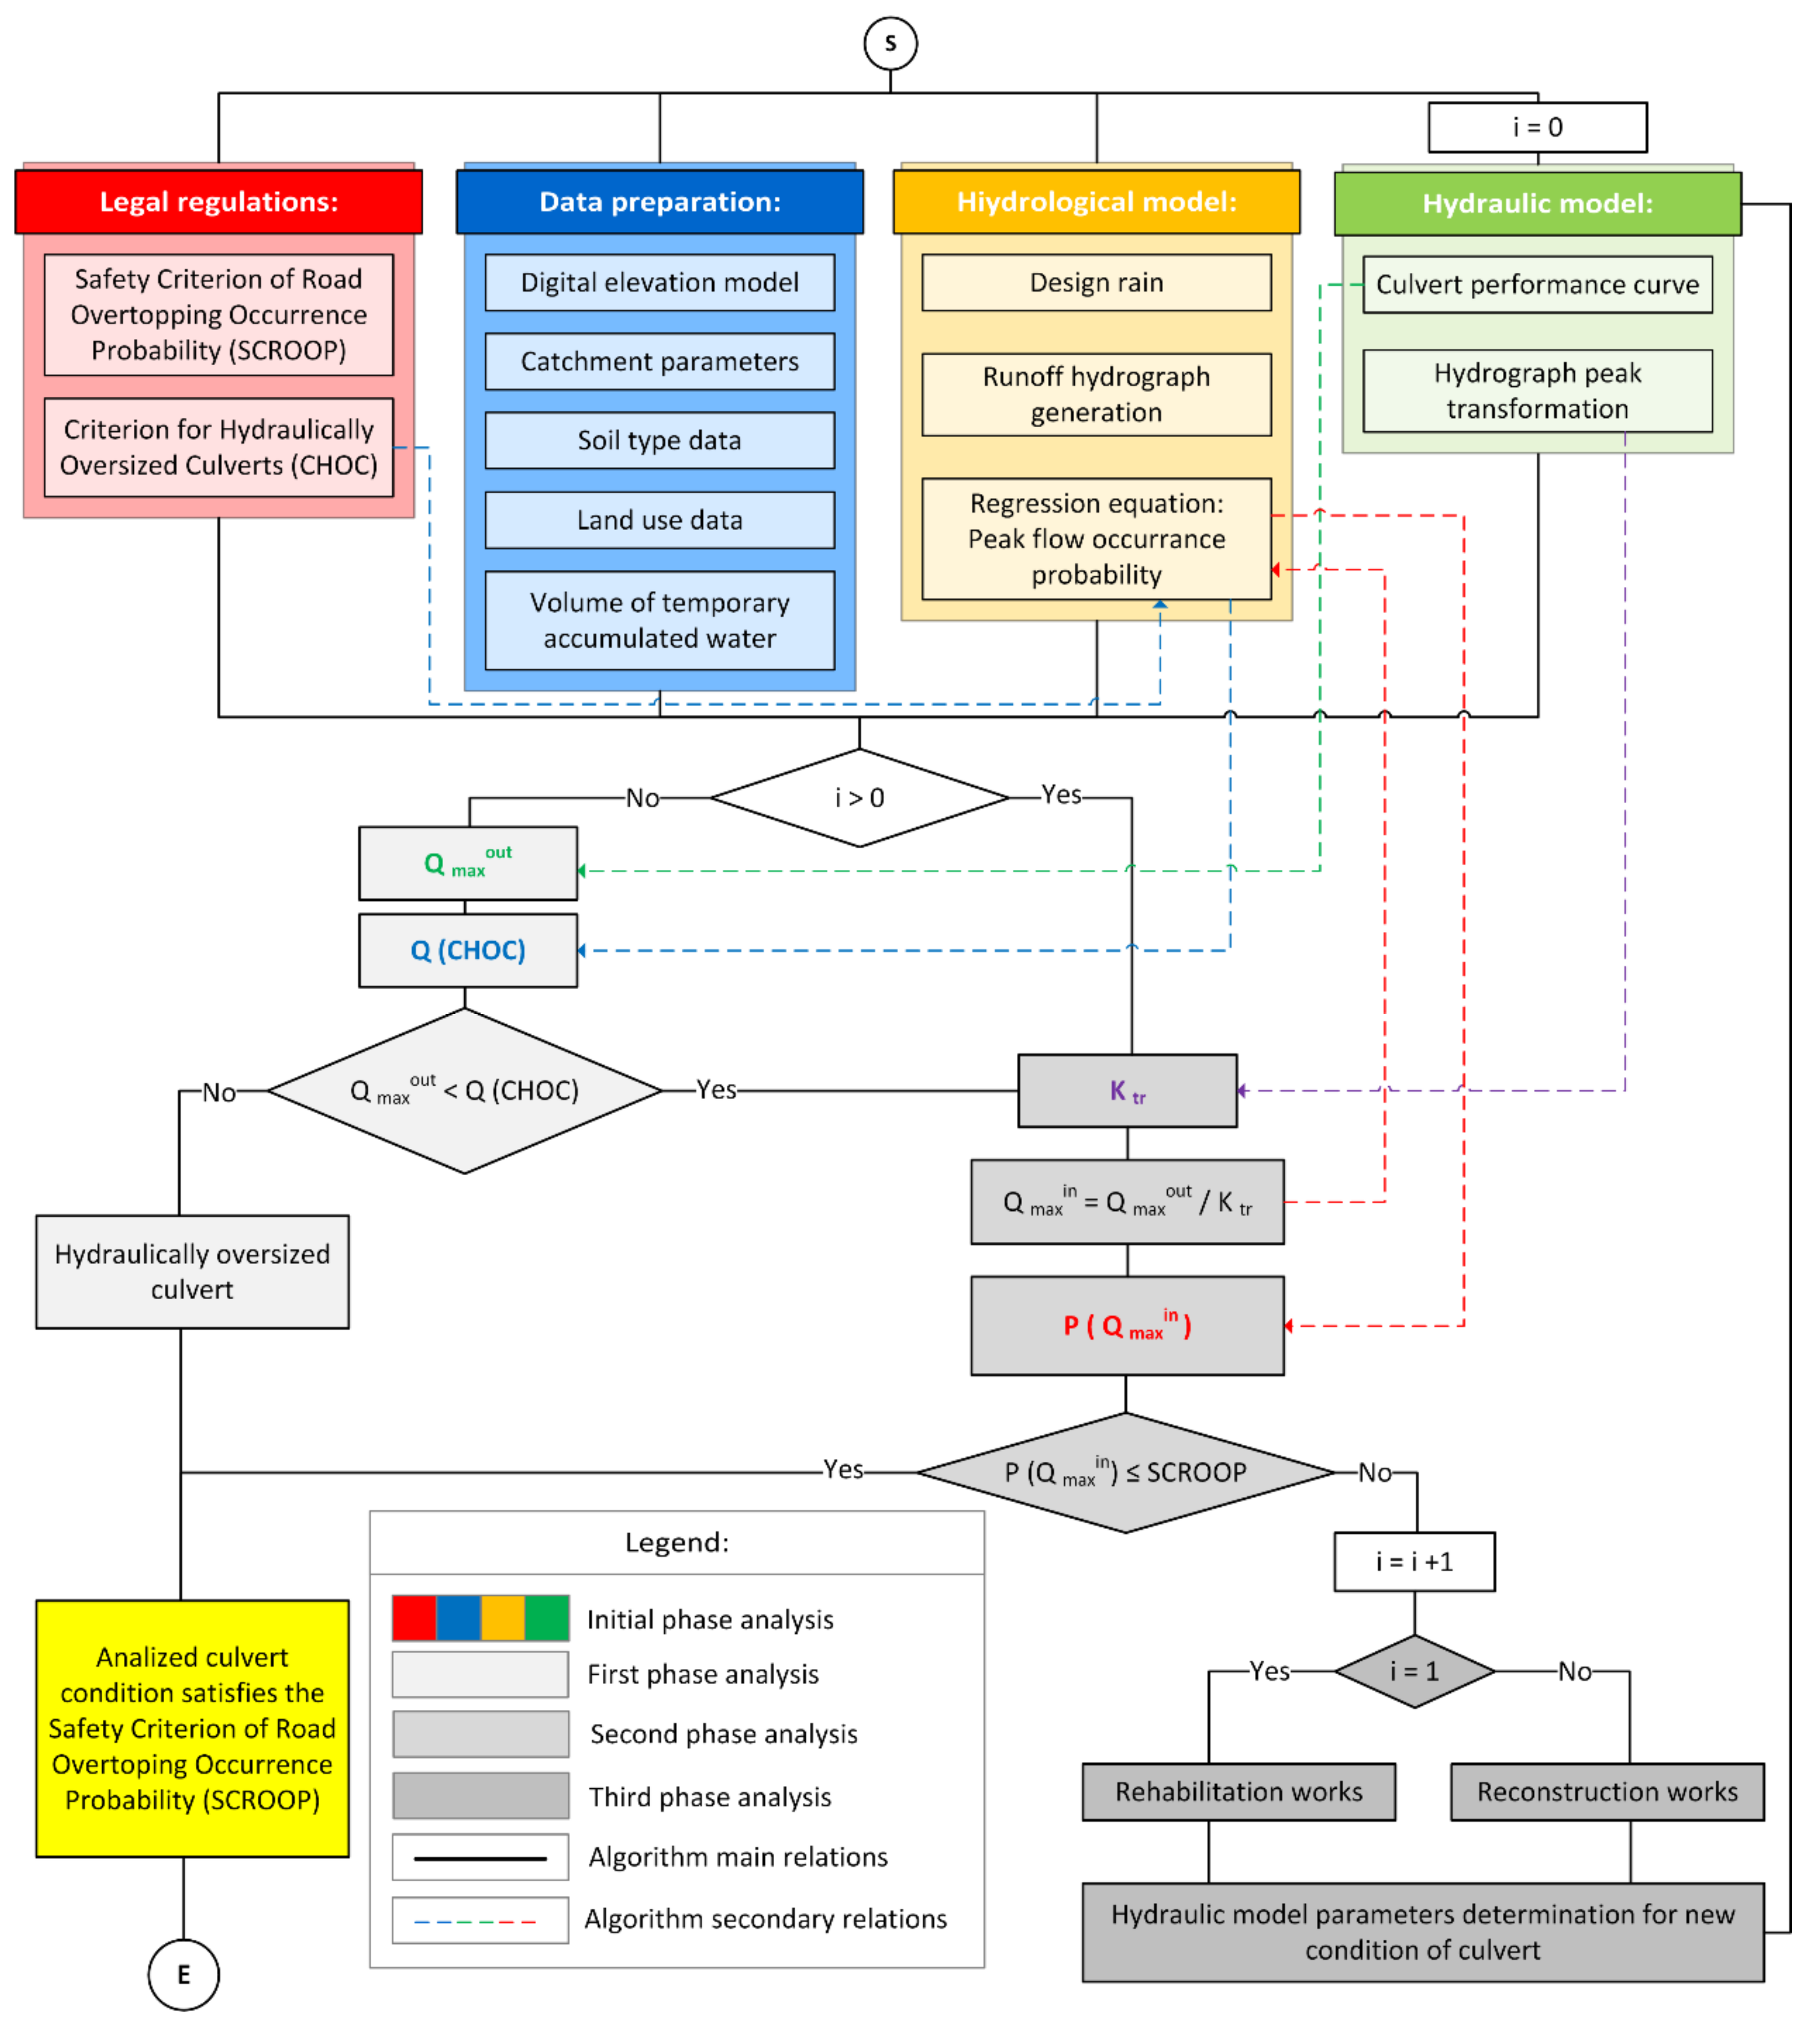
The CMOOP algorithm for small mountain catchment was formed to assess the current condition of the culvert, as well as effects of rehabilitation or reconstruction works, based on the legally defined safety criterion of the overtopping occurrence probability. The analyses of the CMOOP algorithm were systematized into initial, first, second, and third phase analyses, and this is presented in Figure 7.
The algorithm (Figure 7) gives a scheme of the main and secondary decision-making processes when assessing the current condition of the road culvert, as well as the effects of rehabilitation or reconstruction works, based on the probability of road overtopping occurrence. The initial phase of the algorithm analysis comprises the following domains: legal regulations, data preparation, hydrological model, and hydraulic model. In the domain of legal regulations, the safety criterion for road overtopping occurrence probability (SCROOP) was adopted according to the legal regulations and, based on this criterion, the criterion for hydraulically oversized culverts (CHOC) was defined. Based on the legal regulations relating to the design of new culverts, the return period of a flood that the culvert needs to convey was determined (TpSCROOP) [1,26,29]. The SCROOP is defined as a probability of occurrence (in percentage) corresponding to the legally determined return period (TpSCROOP in years) and it can be calculated according to Equation (4):
The CHOC can be determined based on the return period TpCHOC, which has twice the value of TpSCROOP, according to the formula equivalent to Equation (4). The remaining three domains of the initial phase of the CMOOP algorithm (data preparation, hydrological, and hydraulic model) have been explained in Section 2.2, Section 2.3 and Section 2.4 of this paper.
The CMOOP algorithm for small mountain catchments analyses all three possible conditions of the road culvert (existing, repaired, and reconstructed condition) for satisfaction of SCROOP. The implementation of three possible culvert conditions in the CMOOP algorithm was performed using an iterative counter (i), where i = 0 refers to existing culvert condition, i = 1 refers to rehabilitation works applied, and i > 1 refers to reconstruction works applied.
The first phase of the analysis checks if the existing condition of the culvert (i = 0) satisfies the CHOC. The existing condition of a culvert is evaluated by including in the hydraulic calculations all physical conditions that the culvert is operating in: the accumulated stone sediment, degraded concrete surfaces, vegetation blockage of inlet/outlet, etc. The comparison of values of culvert maximum flow (Qmaxout) and flow defined for CHOC value (Q (CHOC)), based on the regression equation (Equation (1)), determines if the culvert design is hydraulically oversized, in other words, whether the culvert has other primary purposes (to provide a passage for people or vehicles, or safe passage for wild animals). The culverts that meet the CHOC criterion also meet the SCROOP criterion.
The aim of the CMOOP algorithm’s second phase of analysis is to determine whether the existing condition of the culvert, which is not hydraulically oversized, satisfies the SCROOP criterion. Based on the value of maximum culvert outflow (Qmaxout) and the transformation coefficient of the hydrograph peak value (Ktr), the value of inlet hydrograph peak (Qmaxin) can be determined and its probability of occurrence (P(Qmaxin)) can be calculated from the regression equation (Equation (1)). The comparison of the value of the probability of occurrence of inlet hydrograph peak (P(Qmaxin)), to the value of SCROOP, determines the SCROOP fulfillment for the existing condition of the culvert.
The culverts whose condition does not meet the SCROOP criterion undergo the third phase of the CMOOP algorithm analysis in order to meet the safety criterion. The third phase of the algorithm analyzes the effects of rehabilitation and reconstruction works on the culvert’s flow capacity increase. Under the assumption of application of rehabilitation works on the culvert, which includes all necessary works for returning the current culvert state into a designed condition, the parameters of the hydraulic model for the rehabilitated culvert state (i = 1) are determined. The algorithm then returns the calculation to the hydraulic model of the initial phase, after which the algorithm performs the second phase analysis and determines the SCROOP fulfillment for the rehabilitated culvert state.
If the rehabilitation works on the culvert do not ensure the satisfaction of the SCROOP criterion, the CMOOP algorithm analyzes the impact of the works on the reconstruction of the culvert, according to the same evaluation system as for the rehabilitation works. Assuming the application of different types of works on the reconstruction of the culvert, which implies hydraulic shaping of the inlet structure, riverbed arrangement before and after the culvert, and construction of a new culvert next to the existing one, the parameters of the hydraulic model for the reconstructed culvert condition are determined (i > 1). The CMOOP algorithm suggests an iterative process of evaluation of different types of reconstruction works (for i > 1) where individual reconstruction works are analyzed according to the SCROOP fulfillment criterion, which makes this algorithm suitable for implementation in the techno-economic analysis.
3. Results ad Discussion
Based on the collected data, the CMOOP algorithm was applied for each of the 67 analyzed culverts on the studied section of the mountain road between Raška and Novi Pazar, in the Republic of Serbia (Figure 1). In this section, the results of all calculation phases of the CMOOP algorithm application, the results of the analysis for verifying basic research hypothesis, and the summary of the final results will be presented and discussed.
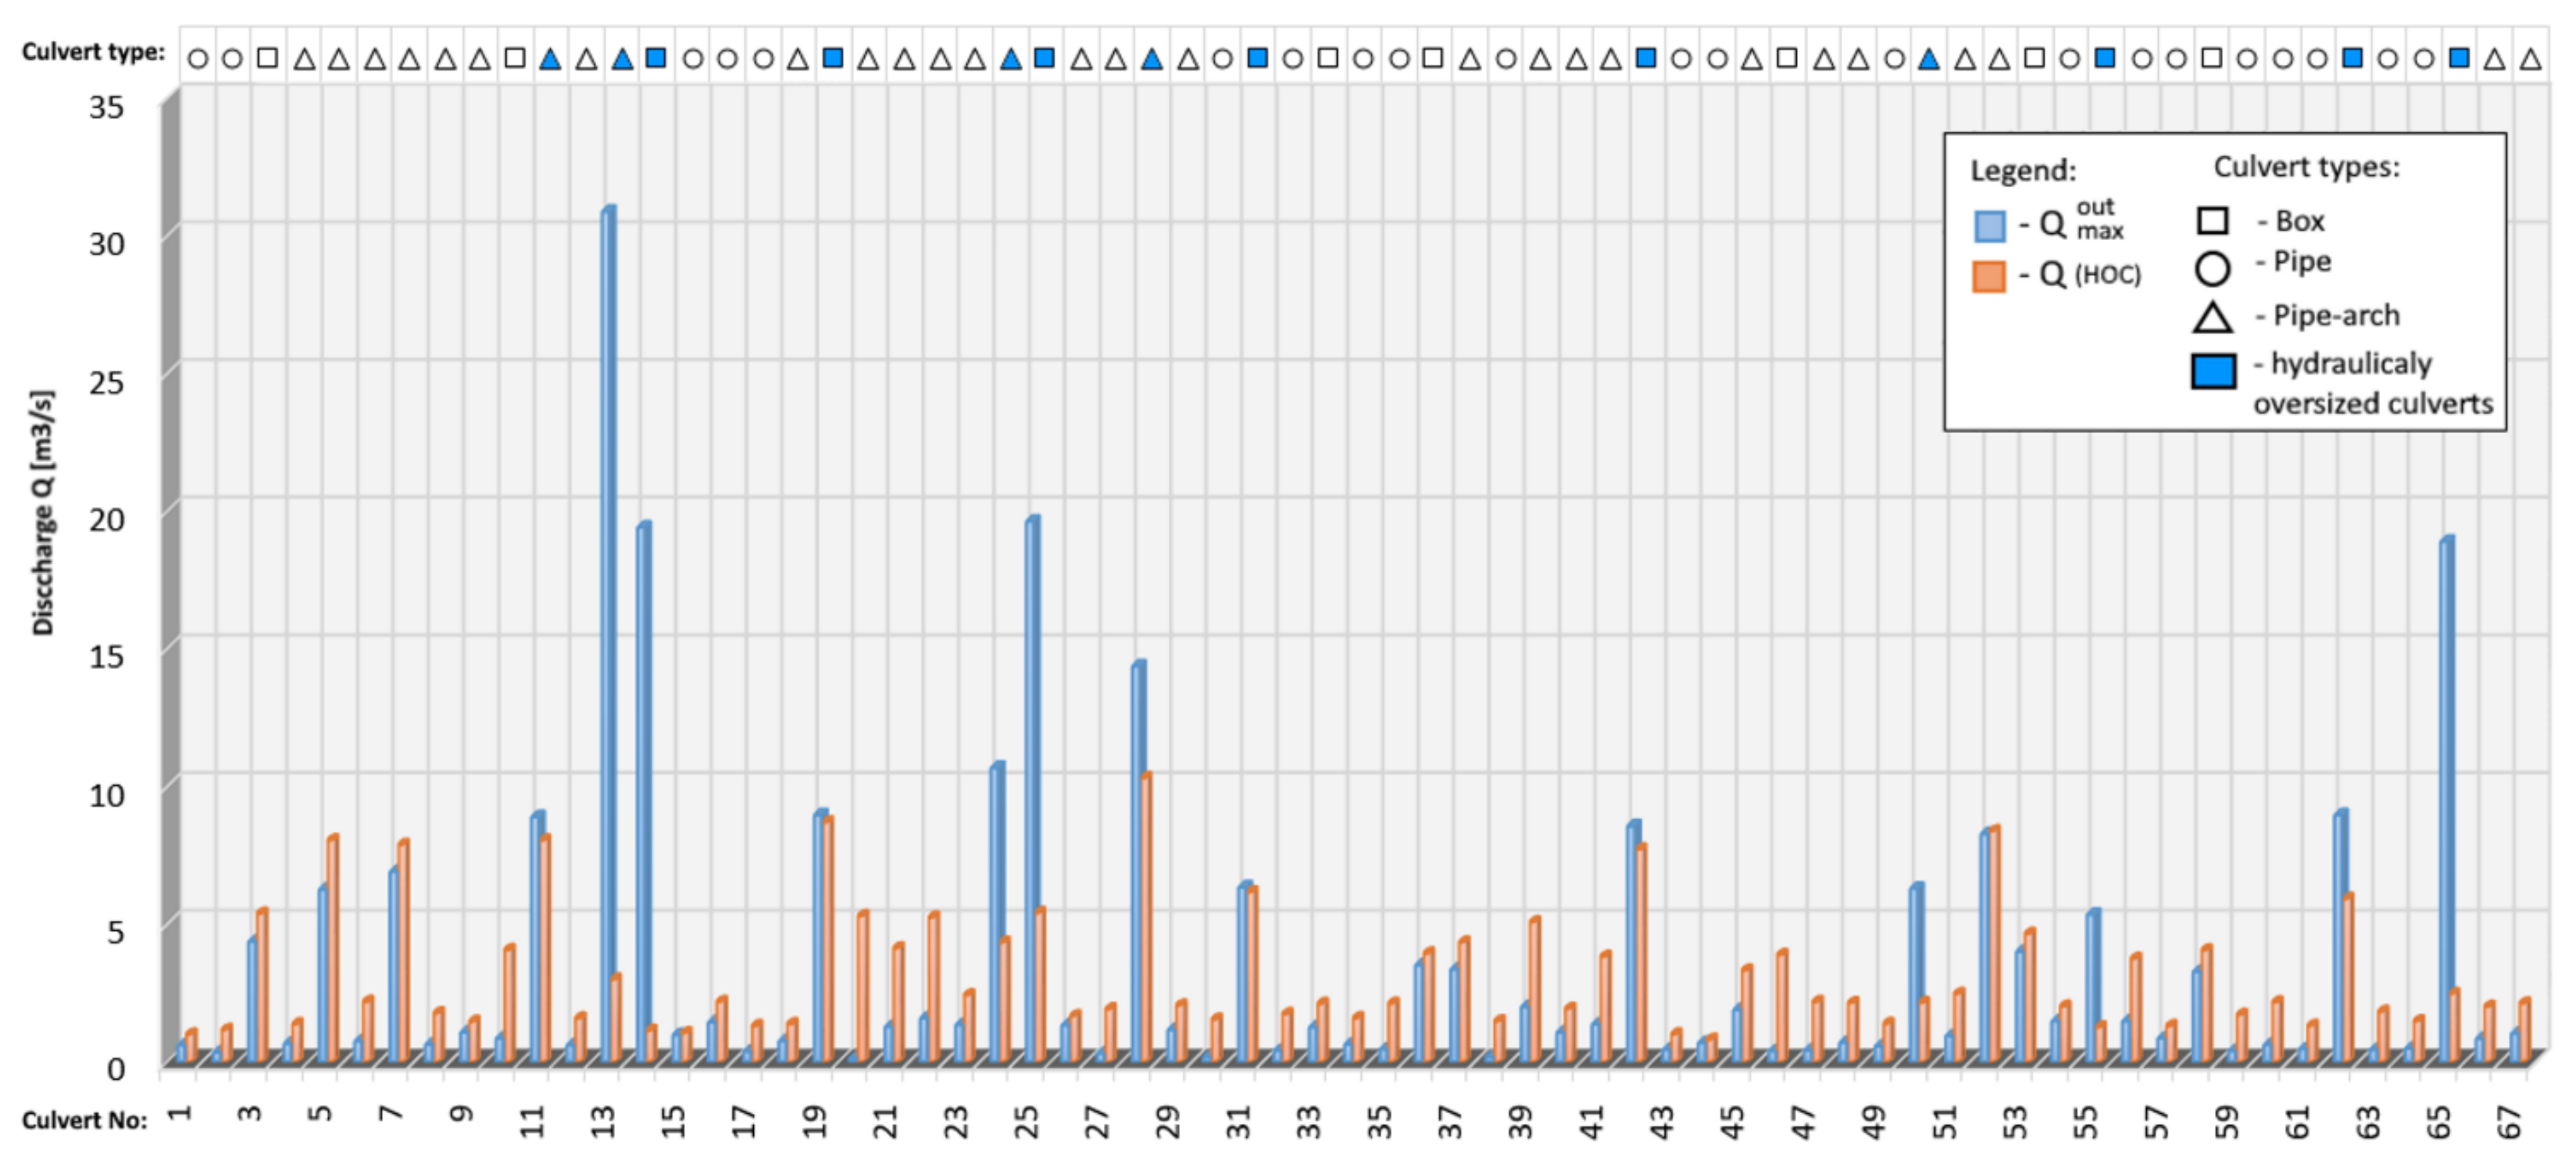
The application of the CMOOP algorithm for all culverts on a section of the road enables a comparative analysis of the obtained results, based on which general conclusions can be given on the probability of road overtopping occurrence on the analyzed road section. The first phase of analysis in the CMOOP algorithm selects the hydraulically oversized culverts, i.e., the culverts that are dimensioned by other primary criteria. According to the legal regulations, the return period of the flood that needs to be conveyed through the road culvert is TpSCROOP = 50 years, and, using Equation (4), the SCROOP = 2% was calculated. For the purpose of defining the second criterion, the return period TpCHOC = 100 years was determined as double the value of TpSCROOP, and, using the equation equivalent to Equation (4), the CHOC = 1% was calculated. Figure 8 shows a comparative presentation of the results of the first phase of the application of the CMOOP algorithm for the analyzed road section.
The first phase of the CMOOP algorithm application performs a selection of hydraulically oversized culverts, where Qmaxout > Q(CHOC), for which the cross-sectional shapes are painted blue in the row culvert type of Figure 8. According to the statistical results of the first phase of analysis, 19.4% of the analyzed culverts are hydraulically oversized. The obtained statistics correspond to the results of the research by Conesa-García and García-Lorenzo [26], which compared the maximum culvert flow capacity and the hydrograph peak values for a 100-year flood flow, which, in this case, corresponds to the return period of the CHOC criteria. As the CHOC has a lower probability value compared to SCROOP, it can be concluded that the existing-condition culverts that meet the CHOC also meet the SCROOP criterion.
The above-mentioned statistics correspond to the statement that hydraulically oversized culverts have been dimensioned for other primary purposes. Taking into account that the analyzed road section follows the river on a high embankment, which separates houses from agricultural farmland near the river, it can be concluded that hydraulically oversized culverts have been dimensioned for the passage of people and agricultural vehicles. The hydraulically oversized culverts include 61.54% box culverts; the remaining 38.46% are pipe-arch culverts, and there are no hydraulically oversized pipe culverts. The cross-sectional geometry of the box and pipe-arch culverts make them suitable to be sized for other primary functions. On the other hand, the geometry of pipe culverts is not suitable for the mentioned uses, which was confirmed by the statistics.
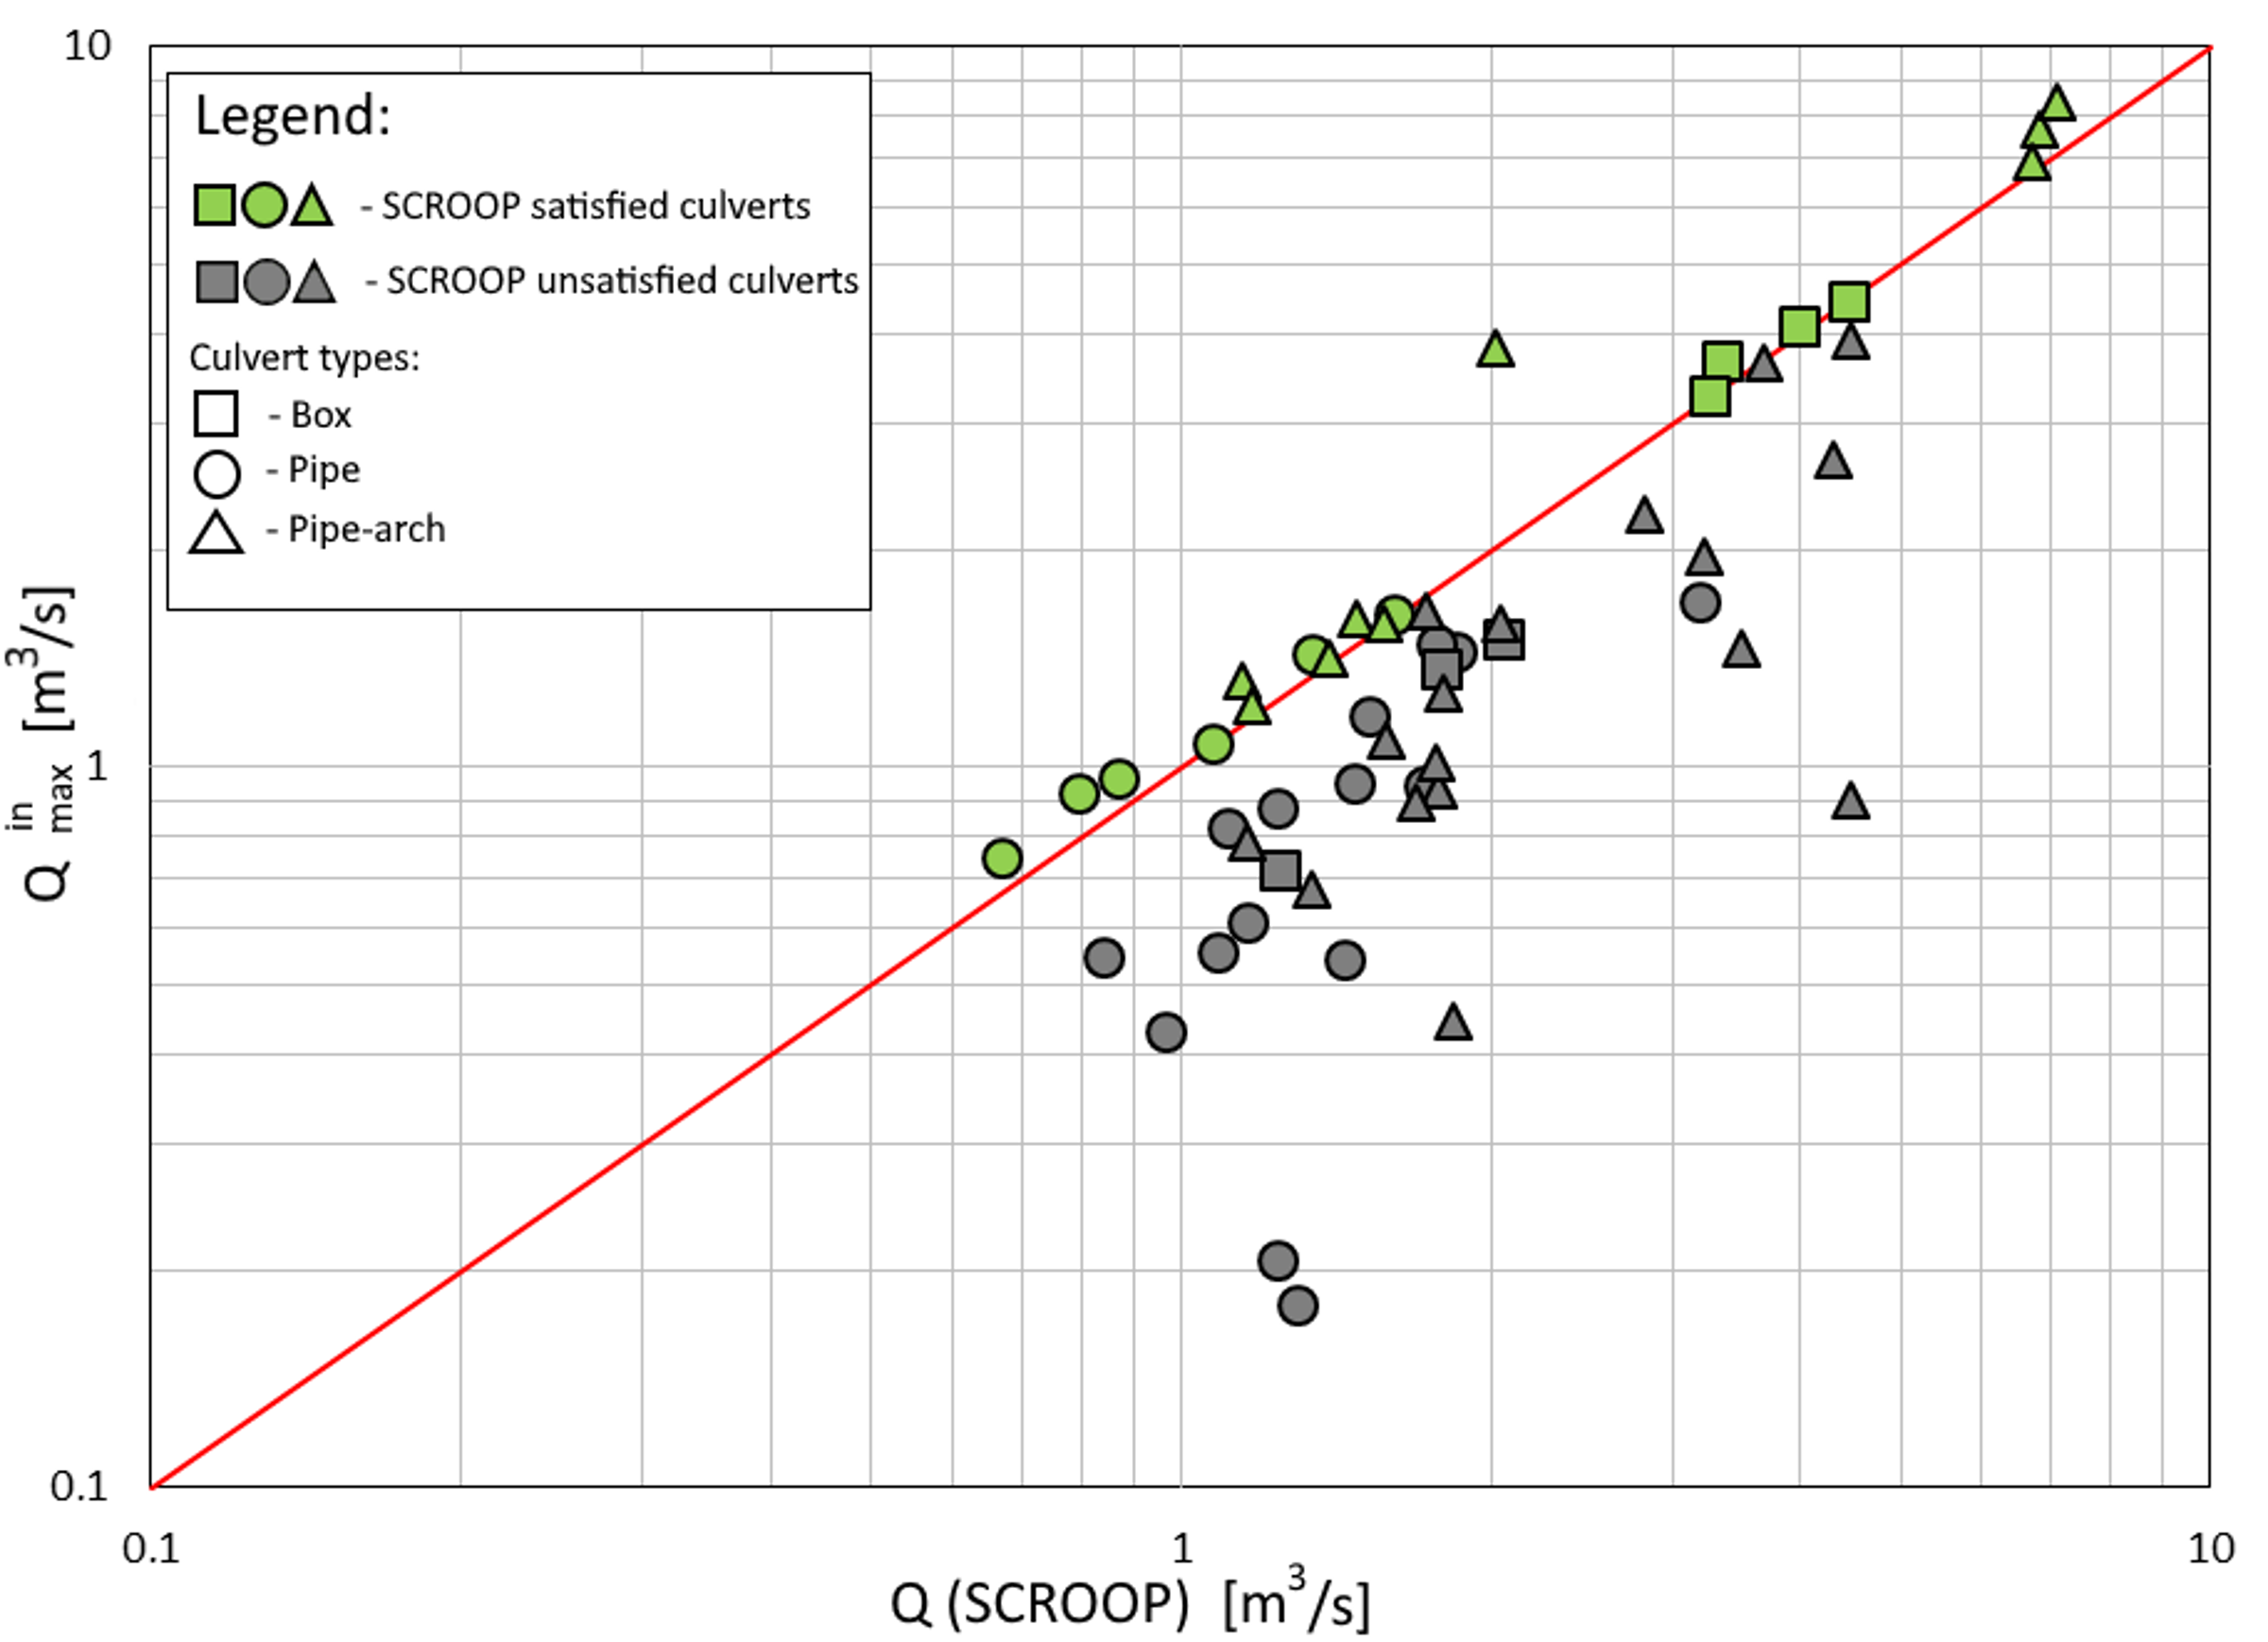
The results of the CMOOP algorithm’s second phase of analyses identify the culverts that, in their current condition, meet the SCROOP criterion by comparing the probabilities of occurrence of runoff hydrograph peak value, P(Qmaxin), and SCROOP. The summary of results of the second phase of analysis is presented in Figure 9 where the Qmaxin flow values are compared with the values of flow that correspond to the probability occurrence of the SCROOP, Q(SCROOP), defined based on the inversion of Equation (1) for each culvert that was not hydraulically oversized.
The culverts with Qmaxin higher than Q(SCROOP), or culverts positioned above the red line in Figure 9, are culverts with the existing condition that satisfies the SCROOP criterion. Grouping data around the division line implies that a great majority of culverts on the analyzed road section had satisfied the SCOOP in the designed condition. With the exclusion of hydraulically oversized culverts, a total of 37.03% of culverts meet the SCROOP criterion in their present state. By including the hydraulically oversized culverts in the calculation, then 49.25% of the analyzed culverts on the studied road section satisfy the SCROOP criterion which corresponds to the statistics obtained in similar research [26,69]. Statistical results produce a conclusion that culverts on the analyzed road section were properly designed, although the design of the complete road section was done almost fifty years ago with limited hydrological data. The current condition of culverts that do not satisfy the SCROOP can be improved by the application of rehabilitation or reconstruction works.
The third phase of the CMOOP algorithm analysis determines the impact of rehabilitation and reconstruction works on the fulfillment of SCROOP criterion for all culverts whose current condition did not meet the SCROOP. The presentation of summary results of the third phase of analysis (Figure 10) shows a distinction between the culverts that can satisfy the SCROOP criterion if rehabilitation works are applied and those culverts that need reconstruction works as they are hydraulically undersized. The impact of rehabilitation works is presented by the ratio between the probability of road overtopping occurrence for the current culvert condition and the rehabilitated culvert condition.
The analysis of the rehabilitation works application effects on the culverts which current condition does not satisfy the SCROOP (Figure 10) shows that application of the rehabilitation works can ensure that 82.35% of those culverts meet the SCROOP criterion. According to the CMOOP algorithm, for the remaining seven culverts, which are hydraulically undersized, the application of reconstruction works to satisfy the SCROOP criterion is needed. The reconstruction works can apply different techniques for satisfying the SCROOP criterion, from designing the new inlet/outlet structure to the complete replacement of the analyzed culvert.
The results (Figure 10) show that the rehabilitation works can ensure the SCROOP is met by 89.55% of culverts on the analyzed section of the road, which leads to the conclusion that the rehabilitation works, as part of the maintenance process, should be more frequent. Most of the rehabilitation works make regular maintenance works (cleaning up the sediment, removal of vegetation from the inlet and outlet of the culvert). The frequency of road culvert maintenance depends on the culvert inspection plan, which can be improved with the application of decision-making techniques and the CMOOP algorithm.
For the research hypothesis testing, the impact analysis of accumulated stone sediment removal on the culvert’s flow capacity increase has been done. This type of analysis needs the main assumption, which was defined as: Removal of accumulated sediment inside the culvert has the greatest impact on the increase of the flow capacity of existing culverts. The percentage of flow capacity increase (PFI) of the culvert before and after the rehabilitation works application can be calculated by Equation (5):
where: —maximum culvert flow capacity after the rehabilitation works, —maximum flow capacity of the culvert in its current condition, before the rehabilitation works.
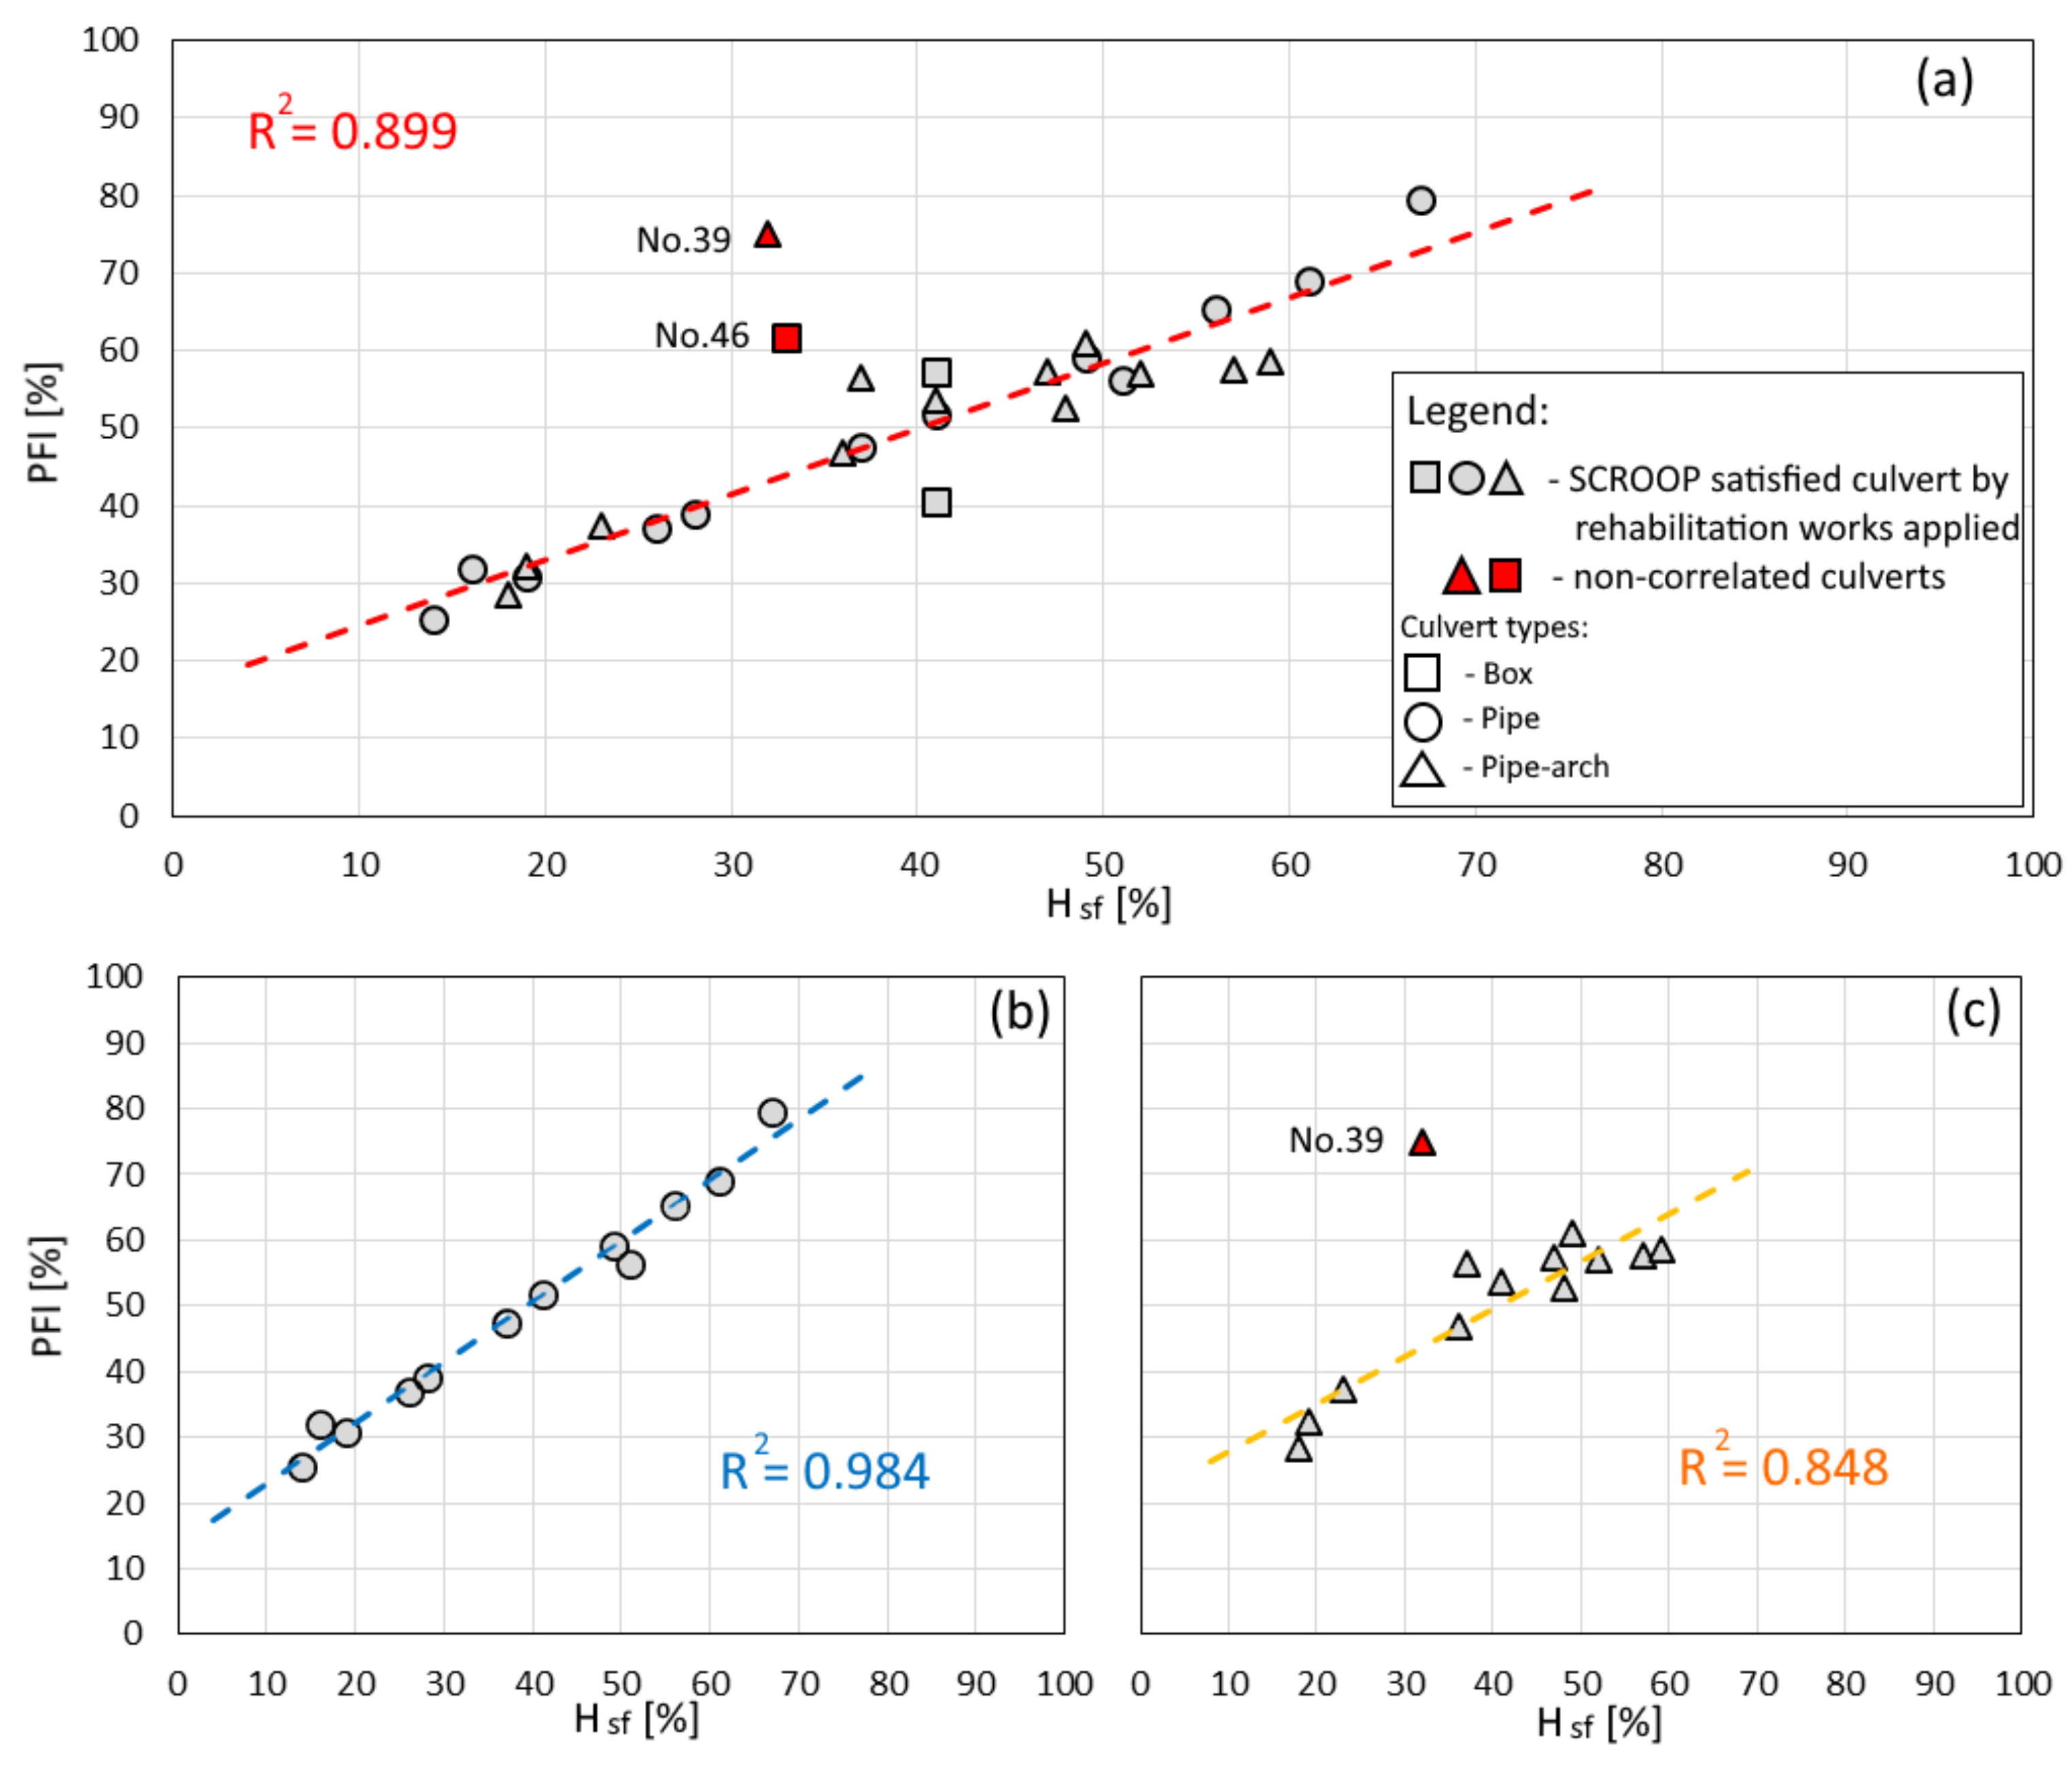
The correlations between the percentage of cross-sectional sediment filling (Hsf) of the culvert and the percentage of flow capacity increase (PFI) are shown in Figure 11 for all analyzed culverts which satisfy the SCROOP after the application of rehabilitation works.
For all road culverts that satisfy the SCROOP criterion after the application of rehabilitation works (Figure 11a), a correlation equation (Equation (6)) was determined:
The high correlation coefficient () confirms the view that removing the accumulated stone sediment from road culverts is the most significant activity within the rehabilitation works on the culverts. However, in the case of two culverts, i.e., culverts no. 39 and 46, this is not the case, because they require rehabilitation works of their inlet and outlet parts due to the extremely lush vegetation. The increase in the flow capacity due to the removal of stone sediment from the culvert (Figure 11b) most affects the pipe culverts (), which is confirmed by the value of the slope coefficient of the regression line in the correlation equation that is close to 1 (Equation (7)). The lower value of the correlation coefficient () for the pipe-arch culverts (Figure 11c) is a consequence of the greater impact of rehabilitation works on the inlet and outlet parts of the culvert, for which the correlation Equation (8) was determined. The correlation analysis was not performed for the box culverts that met the SCROOP after application of rehabilitation works because of the small number of samples (only three culverts, one of which is non-correlated in the correlation dependence for all culverts).
After conducting the correlation analyses, the accumulated stone sediment inside the culvert was identified as the main reason for not fulfilling the SCROOP criterion, which confirms the main assumption, and the basic hypothesis of this research.
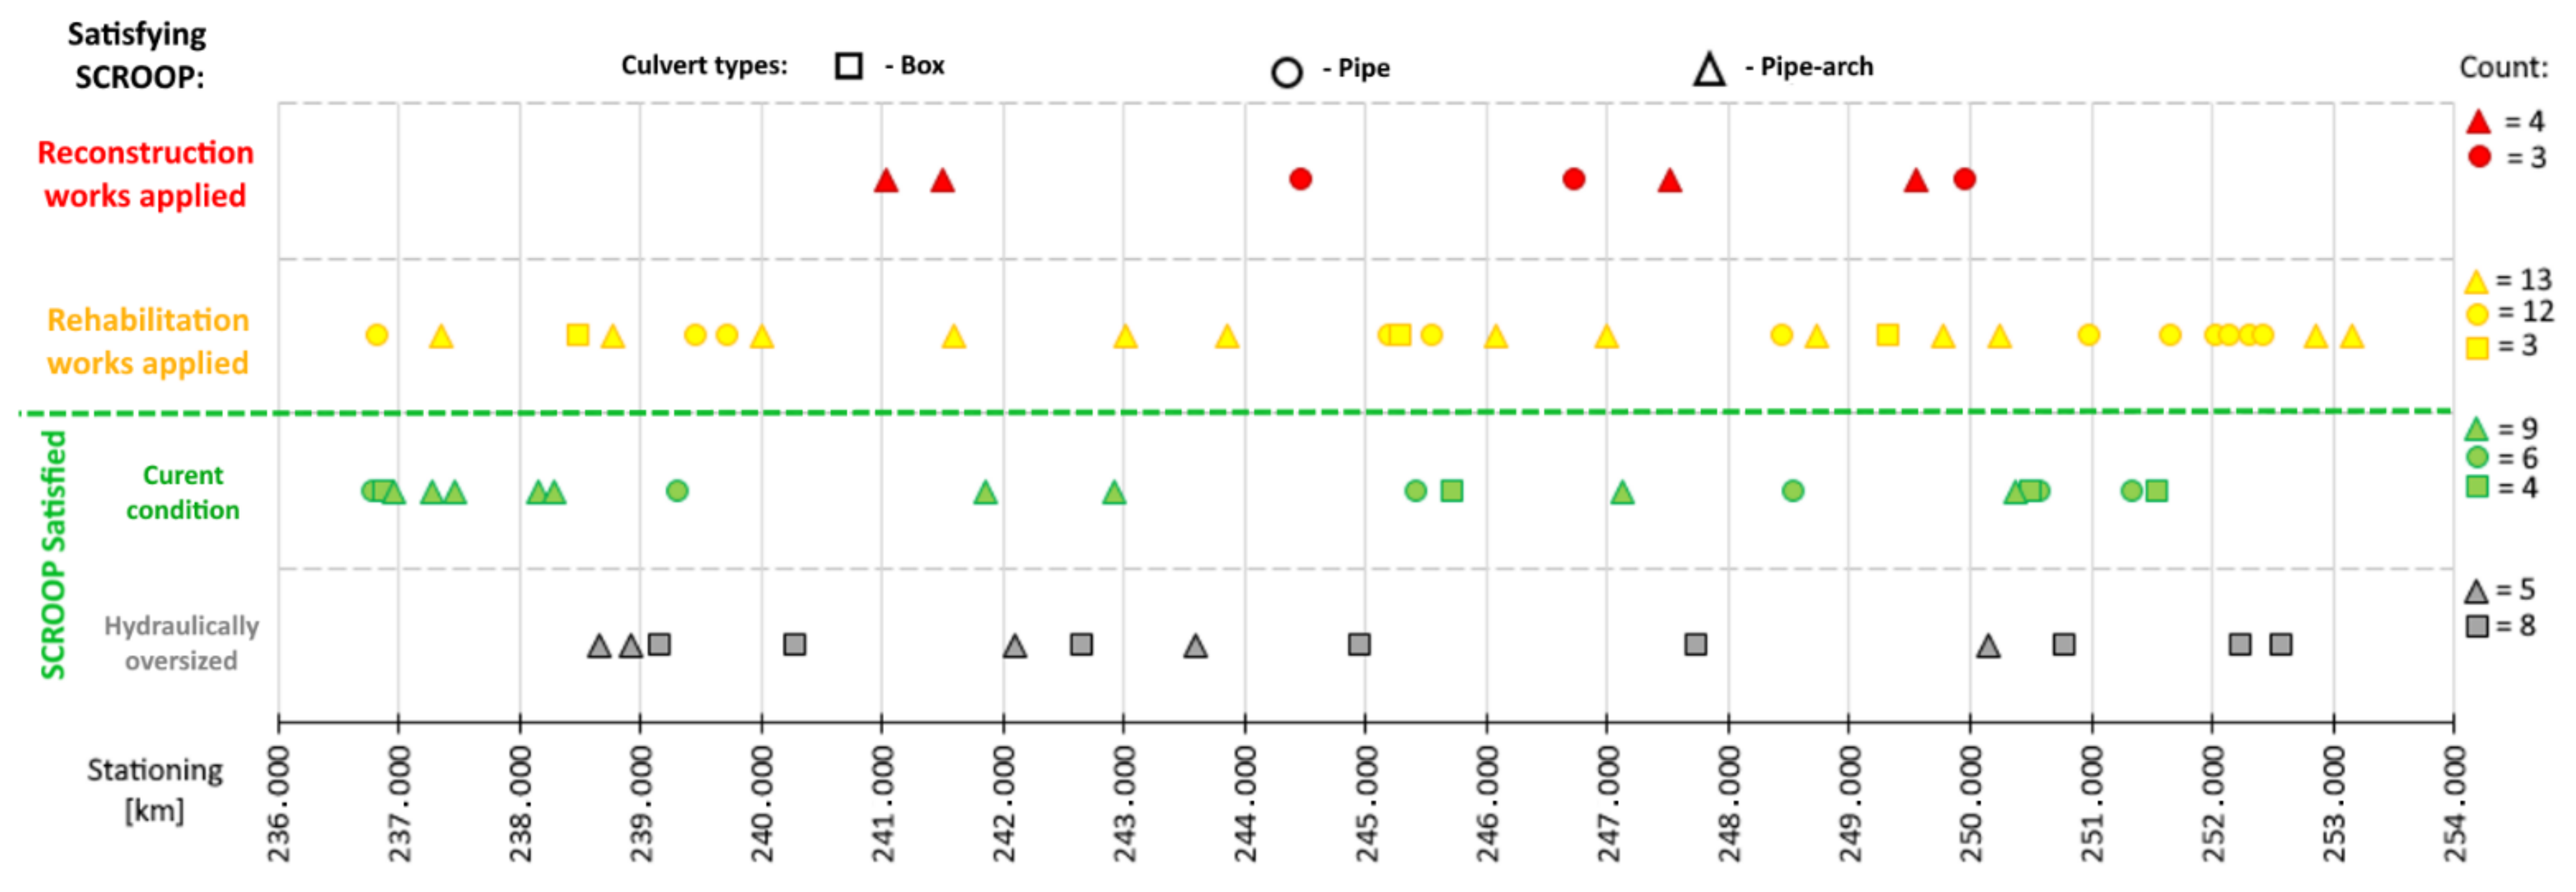
By applying the CMOOP algorithm for each of the 67 road culverts, the fulfillment of safety criteria was checked, first for CHOC (first phase of analysis), and then for SCROOP (second phase of analysis), for the existing culvert condition. For the culverts with existing conditions that do not meet the SCROOP criterion, analyses of the effects of rehabilitation and reconstruction work on the culverts (the third phase of the analysis) were performed in order to satisfy the SCROOP criterion. Figure 12 shows the summary of results of the application of the CMOOP algorithm for all culverts on the analyzed road section.
Although the CMOOP algorithm was applied for each road culvert separately, summary results of the algorithm application for all culverts on the analyzed road section (Figure 12) can provide important information for culvert maintenance. The summary classification of road culverts according to their fulfillment of the SCROOP criterion classifies culverts into those that satisfy the SCROOP criterion (hydraulically oversized and satisfied by existing condition) and the culverts that demand application of rehabilitation or reconstruction works in order to satisfy the SCROOP criterion.
The summary results of the SMPOO algorithm application presented in Figure 12, enables the identification of road sections with a larger number of culverts that need rehabilitation and reconstruction works in order to meet the SCROOP criterion. The study by Doll et al. [69] presents the results similarly, according to the location of the culvert on the river length, for the purpose of practical application. Maintenance of road culverts on mountain road sections can be planned based on the summary results of the CMOOP algorithm application (Figure 12), which is particularly valuable in practice.
According to the conducted analyses, it can be concluded that, on the analyzed road section, the road culvert’s level of maintenance needs to be increased. The obtained results are of significant importance for future planning of road culvert maintenance on the mountain road sections. The application of decision-making techniques and the CMOOP algorithm can improve the plans for culvert inspection, and consequently the frequency of road culvert maintenance [70].
4. Conclusions
The objective of this research was to develop a practically applicable algorithm for road culvert maintenance based on the probability of road overtopping occurrence (CMOOP algorithm) for small mountain catchments and validation of our basic hypothesis. By applying the CMOOP algorithm to the mountain road section between Raška and Novi Pazar, in the Republic of Serbia, the possible applications of the results of the proposed algorithm were presented. Based on the obtained results, the following conclusions for the analyzed road section were drawn:
- 19.4% of the analyzed culverts were hydraulically oversized, which means that they were designed using other primary criteria (passage of people and vehicles, or safe passage of wild animals), which is typical for mountain road sections;
- 49.25% of analyzed culverts satisfied the safety criterion (SCROOP) in their existing condition, which means that even though they are poorly maintained, most of the analyzed culverts were designed in compliance with the official legal regulations;
- if rehabilitation works are applied on the selected culverts, the percentage of culverts satisfying the SCROOP criterion would reach 89.55%, which confirms the poor culvert maintenance on the analyzed road section and confirms our research basic hypothesis;
- for 10.45% of the analyzed culverts that were hydraulically undersized, the application of reconstruction works to satisfy the SCROOP is needed; and
- the accumulated stone sediment inside the culvert was identified as the main reason for not meeting the SCROOP criterion, which was confirmed by the high correlation coefficients between the level of culvert sediment filling and the flow capacity increase rate of the culvert by application of rehabilitation works. This conclusion also indicates the poor maintenance of the road culverts on the analyzed road section.
Consider all the above-mentioned points, we concluded that the CMOOP algorithm analyzes the road culvert’s condition based on the road overtopping occurrence probability and that appying the results of the proposed algorithm can provide significant data for planning future maintenance works. The implementation of the CMOOP algorithm in systems for culvert inspection planning, which are based on artificial intelligence and decision-making techniques, can improve road culvert maintenance.
A potential direction of further research could be modifying the CMOOP algorithm so that it can be applied for the culvert’s condition analysis on streams with a base flow of water and lowland stream catchments or inclusion of the risk analysis in the algorithm.
Supplementary Materials
The following data is available online at https://www.mdpi.com/2073-4441/13/4/471/s1, Table Data: Culverts_Data_Suplementary_Materials.xlsx.
Author Contributions
Conceptualization, M.Š., V.M., S.T. and S.K. (Slobodan Kolaković); methodology, V.M. and M.Š.; software, V.M.; formal analysis, V.M.; investigation, V.M. and M.Š.; resources, V.M. and M.Š.; data curation, M.Š.; writing—original draft preparation, V.M. and M.Š.; writing—review and editing, V.M., M.Š. and S.K. (Slobodan Kolaković); visualization, V.M.; supervision, S.K. (Srdjan Kolaković) and S.T.; project administration, S.K. (Srdjan Kolaković), S.T. and G.J.; funding acquisition, S.K. (Srdjan Kolaković) and S.T. All authors have read and agreed to the published version of the manuscript.
Funding
This research received no external funding.
Institutional Review Board Statement
Not applicable.
Informed Consent Statement
Not applicable.
Data Availability Statement
The data presented in this study are openly available in Zenodo repository at https://doi.org/10.5281/zenodo.4310271.
Acknowledgments
This research paper has been supported by the Republic of Serbia, Ministry of Education, Science and Technological Development through the project 451-03-68/2020-14/200108.
Conflicts of Interest
The authors declare no conflict of interest.
Acronyms
| GIS | Geographic information system |
| SCROOP | Safety criterion for roadovertopping occurrence probability |
| WMS | Watershed modeling system |
| IDF | Intensity–duration–frequency |
| FCE | Flow calculation equations |
| DEM | Digital elevation model |
| NASA | National aeronautics and space administration |
| ASTER | Advanced spaceborne termal emission and reflection radiometer |
| SCS | Soil conservation service |
| CHOC | Criterion for hydraulically oversized culverts |
| PFI | Percentage of flow capacity increase |
References
- Schall, J.D.; Thomson, P.L.; Zerges, S.M.; Kilgore, R.T.; Morris, J.L. Hydraulic Design of Highway Culverts: Federal Highway Administration (FHWA-HIF-12-026), 3rd ed.; Federal Highway Administration (FHWA): Washington, DC, USA, 2012. [Google Scholar]
- Kilgore, R.T.; Bergendahl, B.; Hotchkiss, R.H. Culvert Design for Aquatic Organism Passage: Hydraulic Engineering Circular Number 26; Central Federal Lands Highway Division: Lakewood, CO, USA, 2010. [Google Scholar]
- American Association of State Highway and Transportation Officials (AASHTO). Chapter 4: Culverts. In Highway Drainage Guidelines; American Association of State Highway and Transportation Officials: Washington, DC, USA, 2007; p. 1188. ISBN 978-1560512929. [Google Scholar]
- Thompson, P.L.; Kilgore, R.T. Hydraulic Design of Energy Dissipators for Culverts and Channels: Federal Highway Administration (FHWA-NHI-06-086), 3rd ed.; Federal Highway Administration (FHWA): Washington, DC, USA, 2006. [Google Scholar]
- Balkham, M.; Fosbeary, C.; Kitchen, A.; Rickard, C. Culvert Design and Operation Guide; CIRIA: London, UK, 2010; Volume 1, ISBN 978-0-86017-689-3. [Google Scholar]
- Mark, A.; Marek, P. Chapter 8: Culverts. In Texas Department of Transportation: Hydraulic Design Manual; Texas Department of Transportation: Austin, TX, USA, 2019; pp. 293–351. [Google Scholar]
- Najafi, M.; Salem, O.M.; Bhattachar, D.; Salman, B.; Patil, R. An Asset Management Approach for Drainage Infrastructure and Culverts (CFDA 20.701); Midwest Regional University Transportation Center, University of Winsconsin-Madison, 1415 Engineering Drive: Madison, WI, USA, 2008. [Google Scholar]
- Mohamed, M.S. Characteristics and prediction of simultaneous flow over broad-crested weirs and through culverts. Egypt J. Eng. Sci. Technol. 2002, 6, 113–127. [Google Scholar] [CrossRef]
- Ashley, S.T.; Ashley, W.S. Flood fatalities in the United States. J. Appl. Meteorol. Climatol. 2008, 47, 805–818. [Google Scholar] [CrossRef]
- Haynes, K.; Coates, L.; Leigh, R.; Handmer, J.; Whittaker, J.; Gissing, A.; McAneney, J.; Opper, S. ‘Shelter-in-place’ vs. evacuation in flash floods. Environ. Hazards 2009, 8, 291–303. [Google Scholar] [CrossRef]
- Jaeger, R.; Tondera, K.; Pather, S.; Porter, M.; Jacobs, C.; Tindale, N. Flow control in culverts: A performance comparison between inlet and outlet control. Water 2019, 11, 11. [Google Scholar] [CrossRef] [Green Version]
- Perrin, J.J.; Dwivedi, R. Need for culvert asset management. Transp. Res. Rec. 2006, 1957, 8–15. [Google Scholar] [CrossRef]
- Gassman, S.L.; Sasanakul, I.; Pierce, C.E.; Gheibi, E.; Starcher, R.; Ovalle, W.; Rahman, M. Failures of pipe culverts from a 1000-year rainfall event in South Carolina. In Proceedings of the Geotechnical Frontiers, Orlando, FL, USA, 12–15 March 2017; pp. 114–124. [Google Scholar] [CrossRef]
- Lian, Y.; Yen, B.C. Comparison of risk calculation methods for a culvert. J. Hydraul. Eng. 2003, 129, 140–152. [Google Scholar] [CrossRef] [Green Version]
- Najafi, M.; Bhattachar, D.V. Development of a culvert inventory and inspection framework for asset management of road structures. J. King Saud. Univ. 2011, 23, 243–254. [Google Scholar] [CrossRef] [Green Version]
- Piratla, K.R.; Jin, H.; Yazdekhasti, S. A failure risk-based culvert renewal prioritization framework. Infrastructures 2019, 4, 43. [Google Scholar] [CrossRef] [Green Version]
- Yang, C. Predicting Deterioration Rate of Culvert Structures Utilizing a Markov Model. Ph.D. Thesis, Luisiana Tech University, Ruston, LA, USA, 27 June 2011. [Google Scholar]
- Salem, O.; Salman, B.; Najafi, M. Culvert asset management practices and deterioration modeling. Transp. Res. Rec. 2012, 2285, 1–7. [Google Scholar] [CrossRef] [Green Version]
- Stoner, M.; Pang, W.; Piratla, K. Predicting culvert deterioration using physical and environmental time-independent variables. J. Pipeline Syst. Eng. Pract. 2019, 10, 4019035. [Google Scholar] [CrossRef] [Green Version]
- Kamaka, M.; Cheng, E.; Teng, M.; Matsuda, C. Analytical and hydraulic model study of highway culvert sand-blockages. Comput. Methods Exp. Meas. XIII 2007, 46, 319–326. [Google Scholar] [CrossRef] [Green Version]
- Cafferata, P.; Cafferata, P.H. Designing Watercourse Crossings for Passage of 100 Year Flood Flows, Wood, and Sediment; State of California Department of Forestry and Fire Protection: Sacramento, CA, USA, 2004. [Google Scholar]
- Flanagan, S.A. Woody Debris Transport Through Low-Order Stream Channels of Northwest California: Implications for Road-Stream Crossing Failure. Master’s Thesis, Humboldt State University, Humboldt, CA, USA, 2004. [Google Scholar]
- Kehler, N.J. Hydraulic Characteristics of Fully Developed Flow in Circular Culverts. Master’s Thesis, Department of Civil Engineering, University of Manitoba, Winnipeg, MB, Canada, 2009. [Google Scholar]
- Nwaogazie, I.L.; Agiho, G.C. Performance analysis of box and circular culverts using HY 8 software for Aluu Clan, Port Harcourt. Niger. J. Technol. 2019, 38, 22–32. [Google Scholar] [CrossRef]
- Pelivanoski, B.; Ivanoski, D. Culvert hydraulics analysis for road flood protection. In Proceedings of the Water Observation and Information System for Balkan Countries (BALWOIS), Ohrid, North Macedonia, 25–29 May 2010; pp. 1–11. [Google Scholar]
- Conesa-García, C.; García-Lorenzo, R. Evaluating the effectiveness of road-crossing drainage culverts in ephemeral streams. Hydrol. Process. 2013, 27, 1781–1796. [Google Scholar] [CrossRef]
- Soong, D.T.; Murphy, E.A.; Straub, T.D.; Zeeb, H.L. Flood-Hazard Analysis of Four Headwater Streams Draining the Argonne National Laboratory Property, DuPage County, Illinois; (Report 2016-5132); US Geological Survey: Reston, VA, USA, 2016. [Google Scholar]
- Günal, M.; Ay, M.; Günal, A.Y. Cross-drainage culvert design by using GIS. Acta Phys. Pol. A 2017, 132, 595–598. [Google Scholar] [CrossRef]
- Truhlar, A.M.; Marjerison, R.D.; Gold, D.F.; Watkins, L.; Archibald, J.A.; Lung, M.E.; Meyer, A.; Walter, M.T. Rapid remote assessment of culvert flooding risk. J. Sustain. Water Built Environ. 2020, 6, 6020001. [Google Scholar] [CrossRef]
- Hotchkiss, R.H.; McCallum, B.E. Peak discharge for small agricultural watersheds. J. Hydraul. Eng. 1995, 121, 36–48. [Google Scholar] [CrossRef]
- Levy, B.; McCuen, R. Assessment of storm duration for hydrologic design. J. Hydrol. Eng. 1999, 4, 209–213. [Google Scholar] [CrossRef]
- Wang, X.; Liu, T.; Shang, S.; Yang, D.; Melesse, A.M. Estimation of design discharge for an ungauged overflow-receiving watershed using one-dimensional hydrodynamic model. Int. J. River Basin Manag. 2010, 8, 79–92. [Google Scholar] [CrossRef]
- NASA, ASTER Global Digital Elevation Model V003 [Data Set]. Available online: https://doi.org/10.5067/ASTER/ASTGTM.003 (accessed on 29 January 2021).
- O’Callaghan, J.F.; Mark, D.M. The extraction of drainage networks from digital elevation data. Comput. Vision Graph. Image Process. 1984, 28, 323–344. [Google Scholar] [CrossRef]
- QGIS Development Team. QGIS Geographic Information System. Available online: http://qgis.osgeo.org (accessed on 29 January 2021).
- Tarboton, D.G.; Bras, R.L.; Rodriguez-Iturbe, I. On the extraction of channel networks from digital elevation data. Hydrol. Process. 1991, 5, 81–100. [Google Scholar] [CrossRef]
- GRASS Development Team, Geographic Resources Analysis Support System (GRASS GIS) Software. Available online: http://grass.osgeo.org (accessed on 29 January 2021).
- Neteler, M.; Bowman, M.H.; Landa, M.; Metz, M. GRASS GIS: A multi-purpose open source GIS. Environ. Model. Softw. 2012, 31, 124–130. [Google Scholar] [CrossRef] [Green Version]
- Tarboton, D.G. A new method for the determination of flow directions and upslope areas in grid digital elevation models. Water Resour. Res. 1997, 33, 309–319. [Google Scholar] [CrossRef] [Green Version]
- Conrad, O.; Bechtel, B.; Bock, M.; Dietrich, H.; Fischer, E.; Gerlitz, L.; Wehberg, J.; Wichmann, V.; Böhner, J. System for Automated Geoscientific Analyses (SAGA) v. 2.1.4. Geosci. Model Dev. Discuss. 2015, 8, 2271–2312. [Google Scholar] [CrossRef] [Green Version]
- Watershed Modeling System Software. Available online: https://www.aquaveo.com/software/wms-watershed-modeling-system-introduction (accessed on 29 January 2021).
- Erturk, A.; Gurel, M.; Baloch, M.; Dikerler, T.; Varol, E.; Akbulut, N.; Tanik, A. Application of Watershed Modeling System (WMS) for integrated management of a watershed in Turkey. J. Environ. Sci. Health Part A Toxic Hazard. Subst. Environ. Eng. 2006, 41, 2045–2056. [Google Scholar] [CrossRef]
- Daniel, E.B.; Camp, J.V.; LeBoeuf, E.J.; Penrod, J.R.; Dobbins, J.P.; Abkowitz, M.D. Watershed modeling and its applications: A state-of-the-art review. Open Hydrol. J. 2011, 5, 26–50. [Google Scholar] [CrossRef] [Green Version]
- Wieder, W.R.; Boehnert, J.; Bonan, G.B.; Langseth, M. Regridded harmonized world soil database v1.2. Available online: https://daac.ornl.gov/cgi-bin/dsviewer.pl?ds_id=1247 (accessed on 29 January 2021).
- Bielecka, E.; Jenerowicz, A. Intellectual structure of CORINE land cover research applications in Web of Science: A Europe-wide review. Remote Sens. 2019, 11, 2017. [Google Scholar] [CrossRef] [Green Version]
- Zhang, H.; Yao, Z.; Yang, Q.; Li, S.; Baartman, J.E.M.; Gai, L.; Yao, M.; Yang, X.; Ritsema, C.J.; Geissen, V. An integrated algorithm to evaluate flow direction and flow accumulation in flat regions of hydrologically corrected DEMs. CATENA 2017, 151, 174–181. [Google Scholar] [CrossRef]
- Blue Marble Geographics. Global Mapper. Available online: http://www.bluemarblegeo.com/products/global-mapper.php (accessed on 29 January 2021).
- Chu, X.; Steinman, A. Event and continuous hydrologic modeling with HEC-HMS. J. Irrig. Drain. Eng. 2009, 135, 119–124. [Google Scholar] [CrossRef]
- Eric, R.; Todorovic, A.; Plavsic, J.; Djukic, V. Rainfall-runoff simulations in the Lukovska River Basin with the HEC-HMS model. Glasnik Sumarskog Fakulteta 2019, 119, 33–60. [Google Scholar] [CrossRef]
- Madsen, H.; Mikkelsen, P.S.; Rosbjerg, D.; Harremoës, P. Regional estimation of rainfall intensity-duration-frequency curves using generalized least squares regression of partial duration series statistics. Water Resour. Res. 2002, 38, 21-1–21-11. [Google Scholar] [CrossRef]
- Langousis, A.; Veneziano, D. Intensity-duration-frequency curves from scaling representations of rainfall. Water Resour. Res. 2007, 43, 1–12. [Google Scholar] [CrossRef]
- Mandić, V.; Šešlija, M.; Kolaković, S. Regional IDF Curves. Available online: https://zenodo.org/record/4429899#.YBSNzehKiMo (accessed on 12 January 2021).
- Chung, W.H.; Wang, I.T.; Wang, R.Y. Theory-based SCS-CN method and its applications. J. Hydrol. Eng. 2010, 15, 1045–1058. [Google Scholar] [CrossRef]
- Salami, A.W.; Bilewu, S.O.; Ibitoye, A.B.; Ayanshola, A.M. Runoff hydrographs using snyder and SCS synthetic unit hydrograph methods: A case study of selected rivers in south west Nigeria. J. Ecol. Eng. 2017, 18, 25–34. [Google Scholar] [CrossRef] [Green Version]
- Hoseini, Y.; Azari, A.; Pilpayeh, A. Flood modeling using WMS model for determining peak flood discharge in southwest Iran case study: Simili basin in Khuzestan Province. Appl. Water Sci. 2017, 7, 3355–3363. [Google Scholar] [CrossRef] [Green Version]
- Kiusalaas, J. Chapter 3: Interpolation and curve fitting. In Numerical Methods in Engineering with MATLAB ®; Cambridge University Press: Cambridge, UK, 2009; Volume 1, ISBN 9780511812200. [Google Scholar]
- Federal Highway Administration (FHWA), Washington, DC, USA, HY-8 Software. Available online: https://www.fhwa.dot.gov/engineering/hydraulics/software/hy8/ (accessed on 29 January 2021).
- Rowley, B.J.; Thiele, E.A.; Hotchkiss, R.H.; Nelson, E.J. Numerical modeling of culvert hydraulics: Modernization of existing HY8 software. In Proceedings of the World Environmental and Water Resource Congress 2006: Examining the Confluence of Environmental and Water Concerns, Omaha, Nebraska, 21–25 May 2006; American Society of Civil Engineers (ASCE): Reston, VA, USA, 2006; pp. 1–10. [Google Scholar]
- Hotchkiss, R.H.; Thiele, E.A.; Nelson, E.J.; Thompson, P.L. Culvert hydraulics. Transp. Res. Rec. J. Transp. Res. Board 2008, 2060, 141–149. [Google Scholar] [CrossRef]
- The Math Works, Inc. Matlab Version 9.2. 0 (r2017a) Software. Available online: https://www.mathworks.com/products/matlab.html (accessed on 29 January 2021).
- Gesch, D.; Oimoen, M.; Danielson, J.; Meyer, D. Validation of the ASTER global digital elevation model version 3 over the conterminous United States. Int. Arch. Photogramm. Remote Sens. Spat. Inf. Sci. 2016, 41, 143–148. [Google Scholar] [CrossRef]
- Abrams, M.; Crippen, R.; Fujisada, H. ASTER Global Digital Elevation Model (GDEM) and ASTER Global Water Body Dataset (ASTWBD). Remote Sens. 2020, 12, 1156. [Google Scholar] [CrossRef] [Green Version]
- Sui, J. Estimation of design flood hydrograph for an ungauged watershed. Water Resour. Manag. 2005, 19, 813–830. [Google Scholar] [CrossRef]
- Kastridis, A.; Stathis, D. Evaluation of hydrological and hydraulic models applied in typical mediterranean ungauged watersheds using post-flash-flood measurements. Hydrology 2020, 7, 12. [Google Scholar] [CrossRef] [Green Version]
- Kang, M.S.; Koo, J.H.; Chun, J.A.; Her, Y.G.; Park, S.W.; Yoo, K. Design of drainage culverts considering critical storm duration. Biosyst. Eng. 2009, 104, 425–434. [Google Scholar] [CrossRef]
- Yen, B.C. Open channel flow resistance. J. Hydraul. Eng. 2002, 128, 20–39. [Google Scholar] [CrossRef]
- Djajadi, R. Comparative study of equivalent Manning roughness coefficient for channel with composite roughness. Civ. Eng. Dimens. 2009, 11, 113–118. [Google Scholar]
- Hong, Y.-M. Graphical estimation of detention pond volume for rainfall of short duration. J. Hydro Environ. Res. 2008, 2, 109–117. [Google Scholar] [CrossRef]
- Doll, B.A.; Kurki-Fox, J.J.; Line, D.E. A framework for planning and evaluating the role of urban stream restoration for improving transportation resilience to extreme rainfall events. Water 2020, 12, 1620. [Google Scholar] [CrossRef]
- Gao, C.; Elzarka, H. The use of decision tree based predictive models for improving the culvert inspection process. Adv. Eng. Inform. 2021, 47, 101203. [Google Scholar] [CrossRef]
Figure 1.
The locations of culverts on the analyzed road section.

Figure 2.
The three characteristic types of road culvert cross-sections (schematic drawings and field photos): pipe (a), box (b), and pipe-arch (c).
Figure 2.
The three characteristic types of road culvert cross-sections (schematic drawings and field photos): pipe (a), box (b), and pipe-arch (c).

Figure 3.
Determination of the volume of temporarily accumulated water: (a) cross section of the road with culvert, (b) layout of the surface area under accumulated water for Zmax and (c) view of triangulated irregular network for determination of Vtaw.
Figure 3.
Determination of the volume of temporarily accumulated water: (a) cross section of the road with culvert, (b) layout of the surface area under accumulated water for Zmax and (c) view of triangulated irregular network for determination of Vtaw.

Figure 4.
(a) Hydrographs of different probability of occurrence and (b) regression dependence between the peak value of runoff hydrograph and probability of occurrence of designed rainfall.
Figure 4.
(a) Hydrographs of different probability of occurrence and (b) regression dependence between the peak value of runoff hydrograph and probability of occurrence of designed rainfall.

Figure 5.
Defining the points and friction coefficients for the cross-section profile of the culvert: (a) for the designed culverts and (b) existing culverts filled with sediments.
Figure 5.
Defining the points and friction coefficients for the cross-section profile of the culvert: (a) for the designed culverts and (b) existing culverts filled with sediments.

Figure 6.
(a) Schematization of the hydrograph transformation model and (b) the triangular approximation of the inlet and outlet hydrograph.
Figure 6.
(a) Schematization of the hydrograph transformation model and (b) the triangular approximation of the inlet and outlet hydrograph.

Figure 7.
The algorithm for road culvert maintenance based on the overtopping occurrence probability (the CMOOP algorithm).
Figure 7.
The algorithm for road culvert maintenance based on the overtopping occurrence probability (the CMOOP algorithm).

Figure 8.
Compared values of maximum culvert capacity Qmaxout and the flow value according to the CHOC, Q (CHOC), for each culvert on the analyzed road section.
Figure 8.
Compared values of maximum culvert capacity Qmaxout and the flow value according to the CHOC, Q (CHOC), for each culvert on the analyzed road section.

Figure 9.
Results of the second phase of analysis: checking if the existing condition of culverts meets the SCROOP.
Figure 9.
Results of the second phase of analysis: checking if the existing condition of culverts meets the SCROOP.

Figure 10.
Effects of the culvert rehabilitation works on the fulfillment of SCROOP.

Figure 11.
Correlation between Hsf and PFI for culverts that satisfy SCROOP after application of rehabilitation works: (a) for all culverts, (b) for pipe culverts, and (c) for pipe arch culverts.
Figure 11.
Correlation between Hsf and PFI for culverts that satisfy SCROOP after application of rehabilitation works: (a) for all culverts, (b) for pipe culverts, and (c) for pipe arch culverts.

Figure 12.
Summary of results of the CMOOP algorithm application for all culverts on the analyzed road section between Raška and Novi Pazar.
Figure 12.
Summary of results of the CMOOP algorithm application for all culverts on the analyzed road section between Raška and Novi Pazar.


Table 1.
Specific data of the analyzed road culverts.
| No. | Stationing (km) | Culvert Type: | Dimensions/Diameter (mm) | Culvert Length (m) | No. | Stationing (km) | Culvert Type: | Dimensions/Diameter (mm) | Culvert Length (m) | ||
|---|---|---|---|---|---|---|---|---|---|---|---|
| 1 | 236.78798 | Pipe | Ø500 | 10.15 | 35 | 245.54835 | Pipe | Ø1000 | 13.14 | ||
| 2 | 236.82351 | Pipe | Ø500 | 18.91 | 36 | 245.72752 | Box | 2200 | 1800 | 9.24 | |
| 3 | 236.89418 | Box | 2500 | 1500 | 8.76 | 37 | 246.07534 | Pipe-arch | 2000 | 2200 | 20.06 |
| 4 | 236.95647 | Pipe-arch | 1000 | 1000 | 13.70 | 38 | 246.72622 | Pipe | Ø1000 | 21.08 | |
| 5 | 237.27257 | Pipe-arch | 2000 | 1600 | 23.43 | 39 | 246.99919 | Pipe-arch | 2000 | 1700 | 20.67 |
| 6 | 237.34794 | Pipe-arch | 1000 | 1000 | 20.12 | 40 | 247.11827 | Pipe-arch | 1000 | 1000 | 19.68 |
| 7 | 237.47457 | Pipe-arch | 1600 | 2000 | 21.14 | 41 | 247.52423 | Pipe-arch | 1000 | 1000 | 22.09 |
| 8 | 238.15669 | Pipe-arch | 1000 | 1000 | 35.20 | 42 | 247.73666 | Box | 2500 | 2000 | 9.86 |
| 9 | 238.29219 | Pipe-arch | 1000 | 1000 | 27.42 | 43 | 248.45677 | Pipe | Ø900 | 27.25 | |
| 10 | 238.49045 | Box | 1200 | 1000 | 10.11 | 44 | 248.55084 | Pipe | Ø1000 | 24.19 | |
| 11 | 238.66913 | Pipe-arch | 2000 | 1600 | 25.56 | 45 | 248.72108 | Pipe-arch | 2000 | 2000 | 15.89 |
| 12 | 238.76617 | Pipe-arch | 1000 | 1000 | 28.33 | 46 | 249.32999 | Box | 1000 | 1100 | 8.77 |
| 13 | 238.91557 | Pipe-arch | 4000 | 3200 | 14.88 | 47 | 249.55194 | Pipe-arch | 1000 | 1000 | 15.65 |
| 14 | 239.17311 | Box | 3000 | 2850 | 9.79 | 48 | 249.78251 | Pipe-arch | 1000 | 1000 | 29.57 |
| 15 | 239.31967 | Pipe | Ø500 | 17.81 | 49 | 249.95408 | Pipe | Ø600 | 36.91 | ||
| 16 | 239.47249 | Pipe | Ø1000 | 16.56 | 50 | 250.15709 | Pipe-arch | 2000 | 1800 | 28.05 | |
| 17 | 239.71977 | Pipe | Ø500 | 36.52 | 51 | 250.24686 | Pipe-arch | 1000 | 1000 | 24.47 | |
| 18 | 239.99762 | Pipe-arch | 1000 | 1000 | 14.12 | 52 | 250.36582 | Pipe-arch | 2000 | 1500 | 30.96 |
| 19 | 240.27911 | Box | 2000 | 1900 | 10.18 | 53 | 250.50679 | Box | 1800 | 2000 | 10.55 |
| 20 | 241.02708 | Pipe-arch | 1000 | 1000 | 22.55 | 54 | 250.57528 | Pipe | Ø600 | 30.57 | |
| 21 | 241.49258 | Pipe-arch | 2000 | 2000 | 30.74 | 55 | 250.78730 | Box | 3000 | 1300 | 9.53 |
| 22 | 241.58683 | Pipe-arch | 1000 | 1000 | 25.58 | 56 | 250.99072 | Pipe | Ø1000 | 10.91 | |
| 23 | 241.85217 | Pipe-arch | 1000 | 1000 | 15.00 | 57 | 251.34695 | Pipe | Ø800 | 30.48 | |
| 24 | 242.09081 | Pipe-arch | 3000 | 2500 | 14.23 | 58 | 251.54172 | Box | 2300 | 1700 | 9.73 |
| 25 | 242.66435 | Box | 4000 | 2300 | 9.57 | 59 | 251.66778 | Pipe | Ø800 | 29.93 | |
| 26 | 242.91715 | Pipe-arch | 1000 | 1000 | 23.88 | 60 | 252.03890 | Pipe | Ø1000 | 18.12 | |
| 27 | 243.01846 | Pipe-arch | 1000 | 1000 | 20.58 | 61 | 252.15223 | Pipe | Ø500 | 20.30 | |
| 28 | 243.58744 | Pipe-arch | 3000 | 2400 | 23.47 | 62 | 252.24892 | Box | 2500 | 2200 | 9.01 |
| 29 | 243.84610 | Pipe-arch | 1000 | 1000 | 25.68 | 63 | 252.32288 | Pipe | Ø800 | 18.48 | |
| 30 | 244.47159 | Pipe | Ø500 | 14.43 | 64 | 252.42755 | Pipe | Ø600 | 10.65 | ||
| 31 | 244.96612 | Box | 2000 | 1600 | 9.51 | 65 | 252.56980 | Box | 3500 | 2400 | 12.05 |
| 32 | 245.19507 | Pipe | Ø600 | 10.74 | 66 | 252.85253 | Pipe-arch | 1000 | 1000 | 20.34 | |
| 33 | 245.29313 | Box | 2000 | 1200 | 10.62 | 67 | 253.16520 | Pipe-arch | 1000 | 1000 | 16.65 |
| 34 | 245.42235 | Pipe | Ø1000 | 32.89 | |||||||
Table 2.
Systematized presentation of methods and materials of the hydrological–hydraulic model.
| Methodological Groups: | Method/Data: | Software: | Reference(s) | ||
|---|---|---|---|---|---|
| 1. Data preparation: | |||||
| 1.1. | Digital Elevation Model (DEM) | Data: ASTER v3 | [33] | ||
| 1.2. | Catchment parameters: | ||||
| 1.2.1. | Flow direction calculation | Method: Deterministic 8 | QGIS | [34,35] | |
| 1.2.2. | Stream detection | Method: Strahle order | Grass GIS | [36,37,38] | |
| 1.2.3. | Catchment delineation | Method: Upslope area (D infinity) | SAGA-GIS | [39,40] | |
| 1.2.4. | Physical parameters | Method: Parametric equations | WMS | [41,42,43] | |
| 1.3. | Soil type data | Data: Harmonized World Soil Database | [44] | ||
| 1.4. | Land use data | Data: Copernicus Corine land cover | [45] | ||
| 1.5. | Volume of temporary accumulated water | Method: Volume between surfaces | Global Mapper | [46,47] | |
| 2. Hydrological model: | |||||
| 2.1. | Runoff hydrograph generation | Method: HEC-HMS * | WMS | [48,49] | |
| 2.2. | Design Rain: | ||||
| 2.2.1. | Rainfall intensity | Data: IDF curves | [50,51,52] | ||
| 2.2.2. | Effective rainfall | Method: SCS-CN | WMS | [53,54] | |
| 2.2.3. | Design rain duration | Method: Iterative procedure | WMS | [55] | |
| 2.3. | Peak flow occurrence probability | Method: Regression analysis | MatLAB | [56] | |
| 3. Hydraulic model: | |||||
| 3.1. | Culvert performance curve: | ||||
| 3.1.1. | Designed culvert performance | Method: Flow calculation equations (FCE) | HY-8 | [57,58] | |
| 3.1.2. | Current culvert performance | Method: Parameter estimation for FCE | HY-8 | [24,59] | |
| 3.2. | Transformation of hydrograph peak | Method: Hydrograph peak transformation | MatLAB | [60] | |
* For small mountain catchment (area ≤ 1 km2), the HEC-1 method is applicable.
Publisher’s Note: MDPI stays neutral with regard to jurisdictional claims in published maps and institutional affiliations. |
© 2021 by the authors. Licensee MDPI, Basel, Switzerland. This article is an open access article distributed under the terms and conditions of the Creative Commons Attribution (CC BY) license (http://creativecommons.org/licenses/by/4.0/).
Share and Cite
MDPI and ACS Style
Mandić, V.; Šešlija, M.; Kolaković, S.; Kolaković, S.; Jeftenić, G.; Trajković, S. Mountain Road-Culvert Maintenance Algorithm. Water 2021, 13, 471. https://doi.org/10.3390/w13040471
AMA Style
Mandić V, Šešlija M, Kolaković S, Kolaković S, Jeftenić G, Trajković S. Mountain Road-Culvert Maintenance Algorithm. Water. 2021; 13(4):471. https://doi.org/10.3390/w13040471
Chicago/Turabian StyleMandić, Vladimir, Miloš Šešlija, Slobodan Kolaković, Srđan Kolaković, Goran Jeftenić, and Slaviša Trajković. 2021. "Mountain Road-Culvert Maintenance Algorithm" Water 13, no. 4: 471. https://doi.org/10.3390/w13040471
Note that from the first issue of 2016, this journal uses article numbers instead of page numbers. See further details here.