Impact of Hydro-Climatic Changes on Coastal Dunes Landscape According to Normalized Difference Vegetation Index (The Case Study of Curonian Spit)

 , and
, and
Abstract
: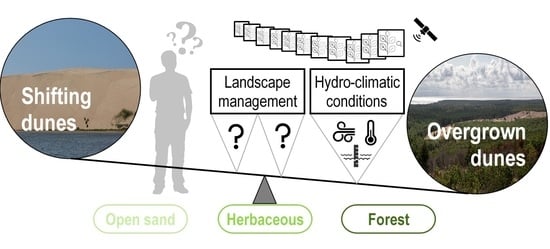
1. Introduction
2. Materials and Methods
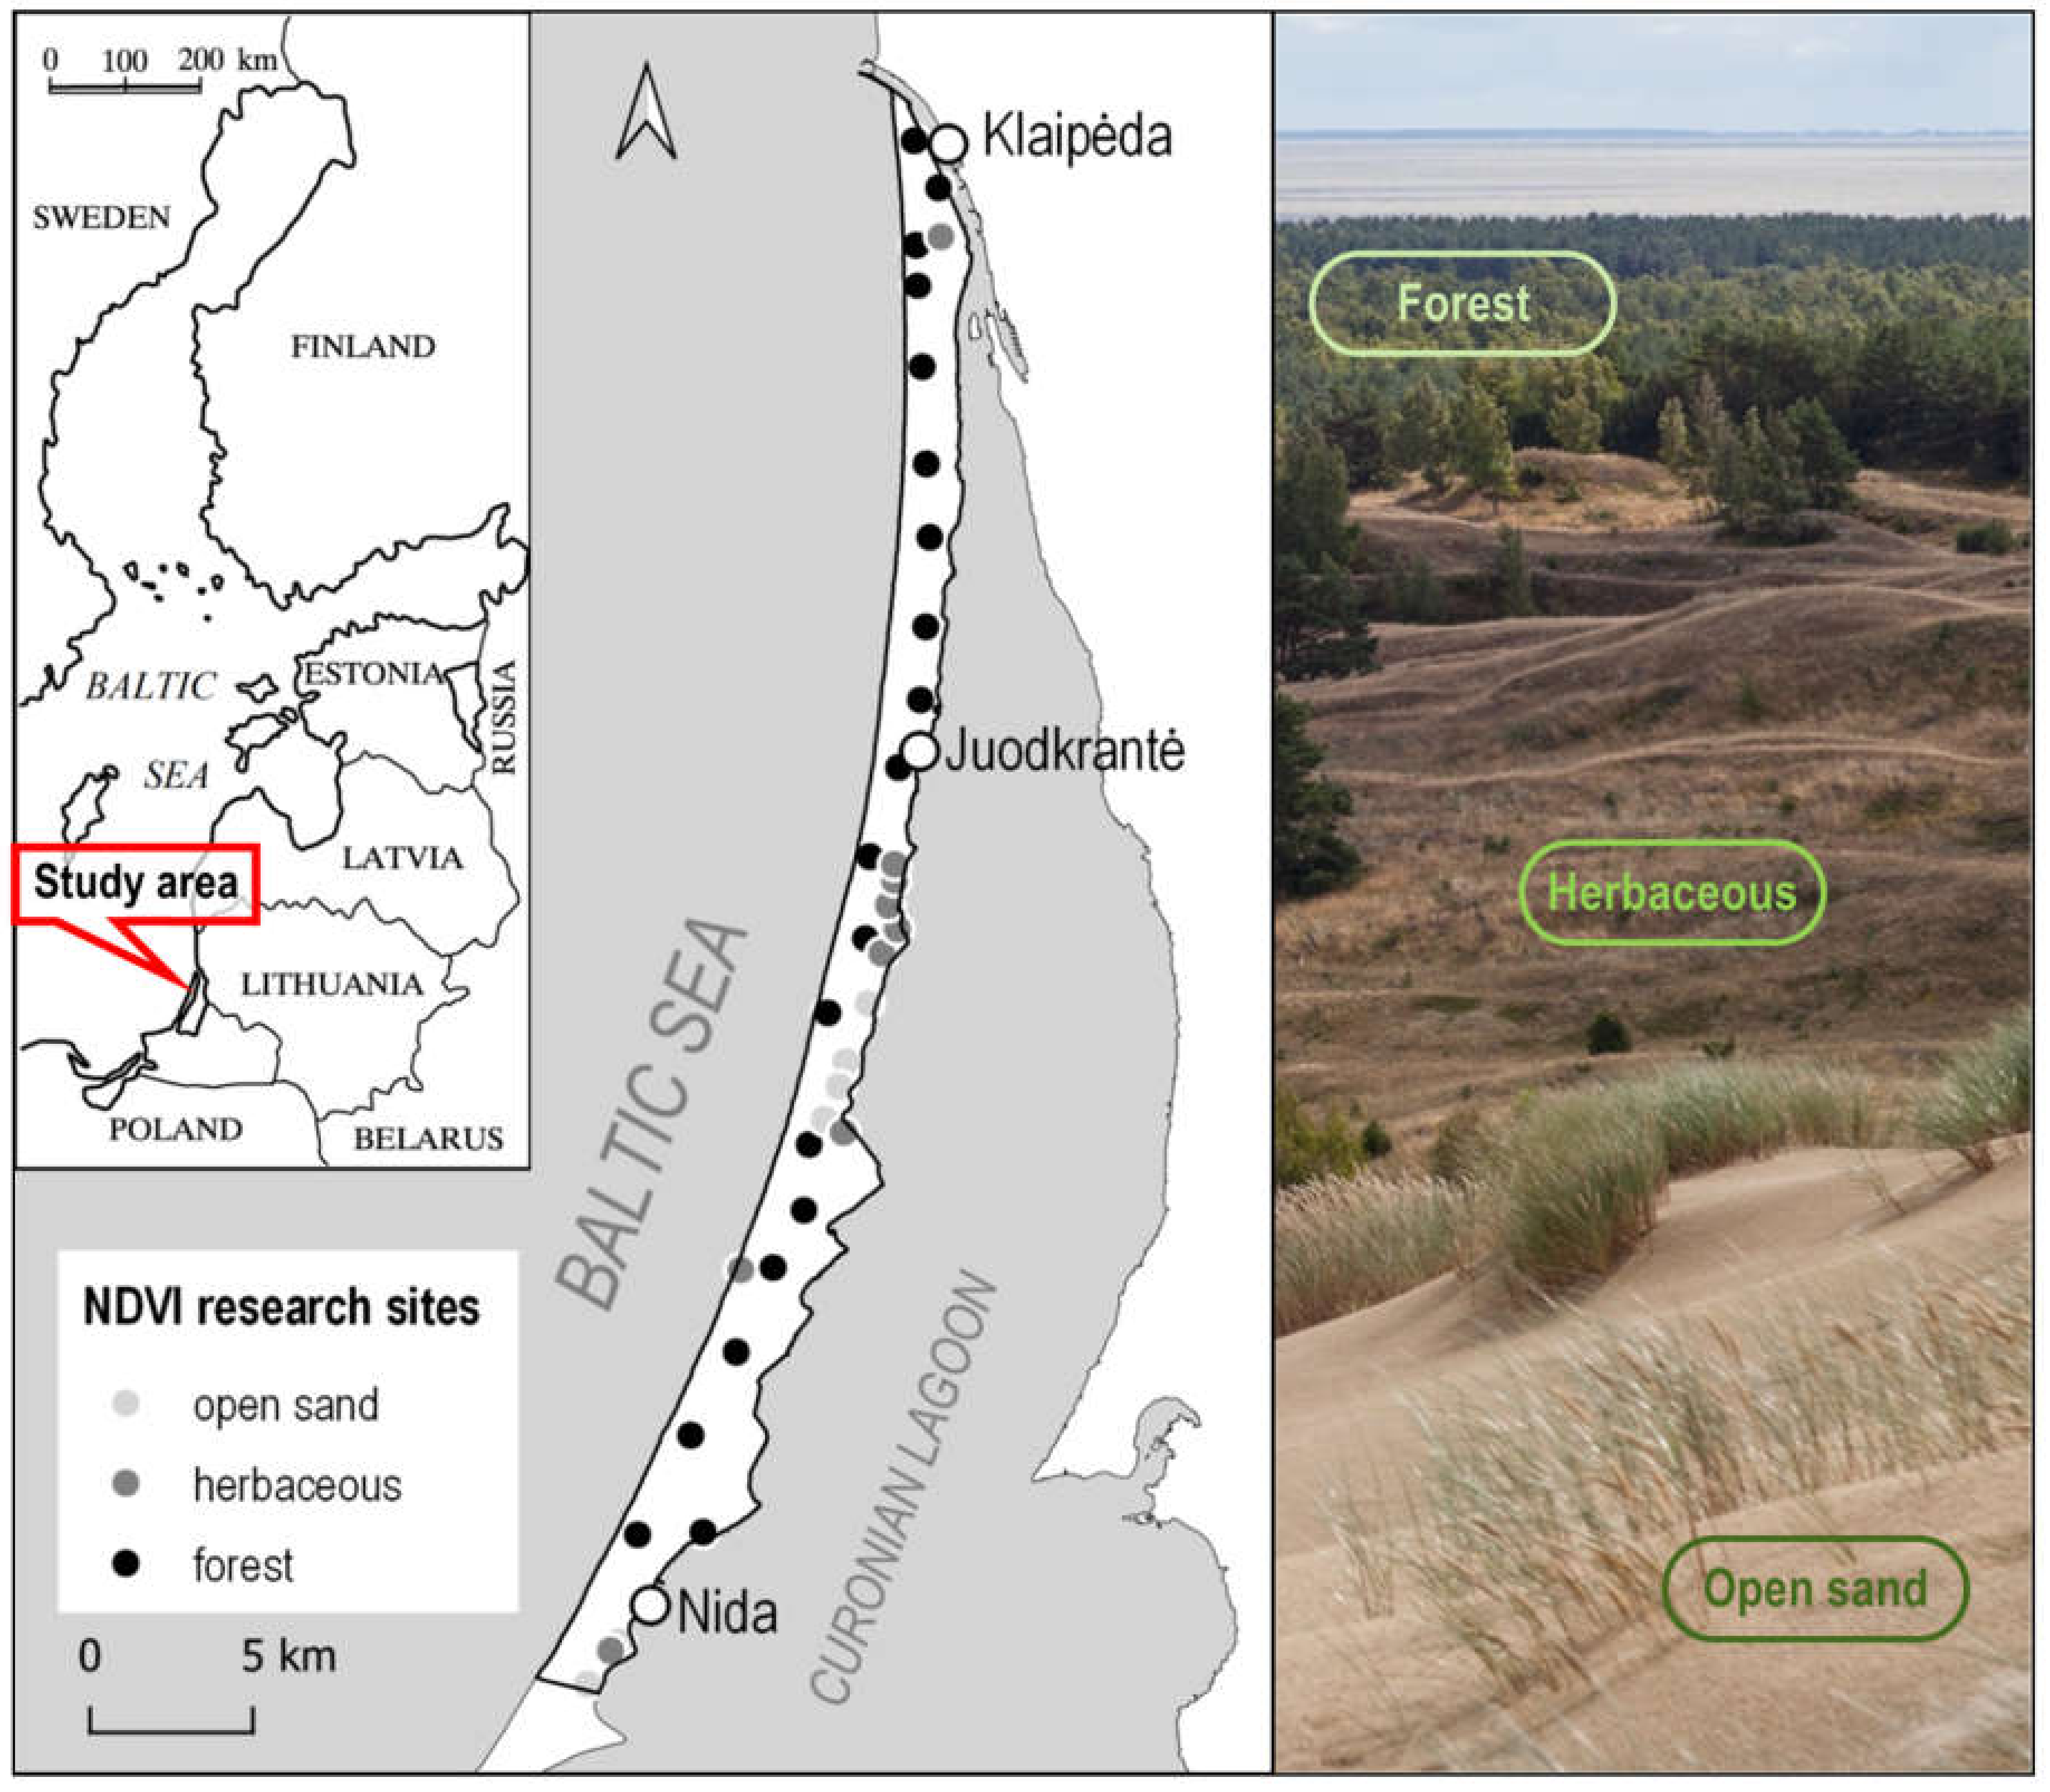
2.1. Study Area
2.2. Data and Methods
3. Results
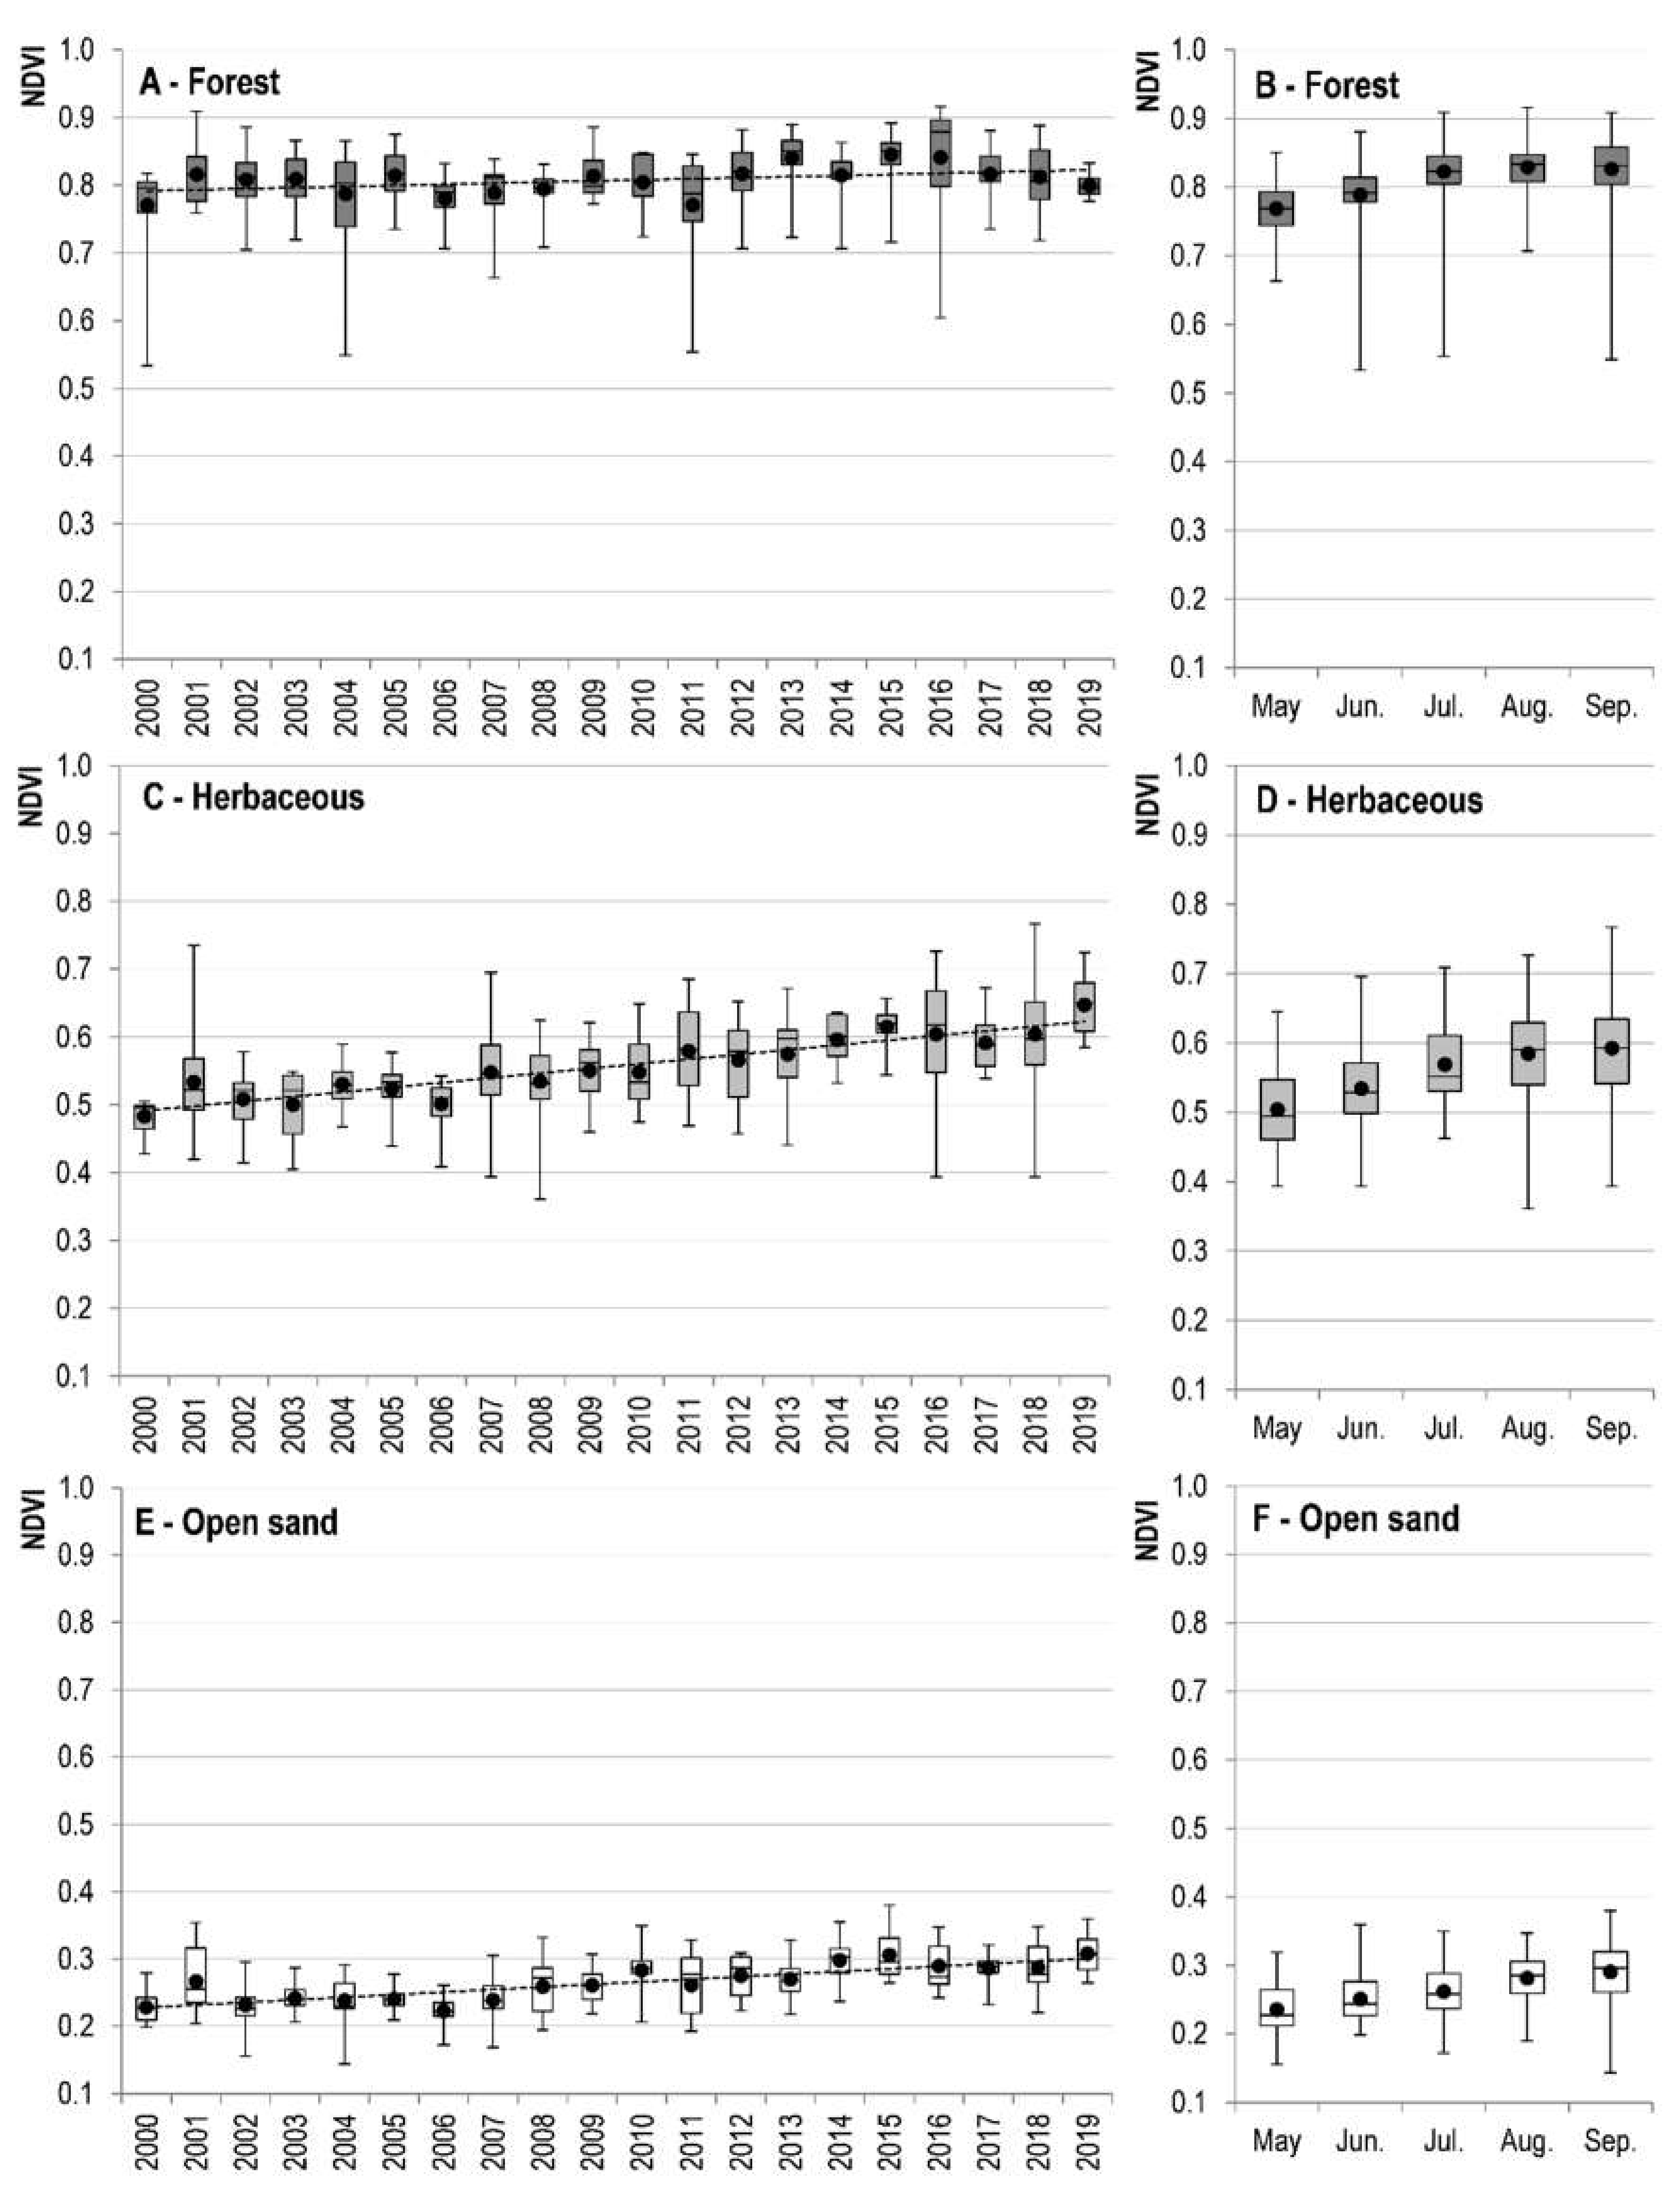
3.1. NDVI Variation in Different Ecosystems
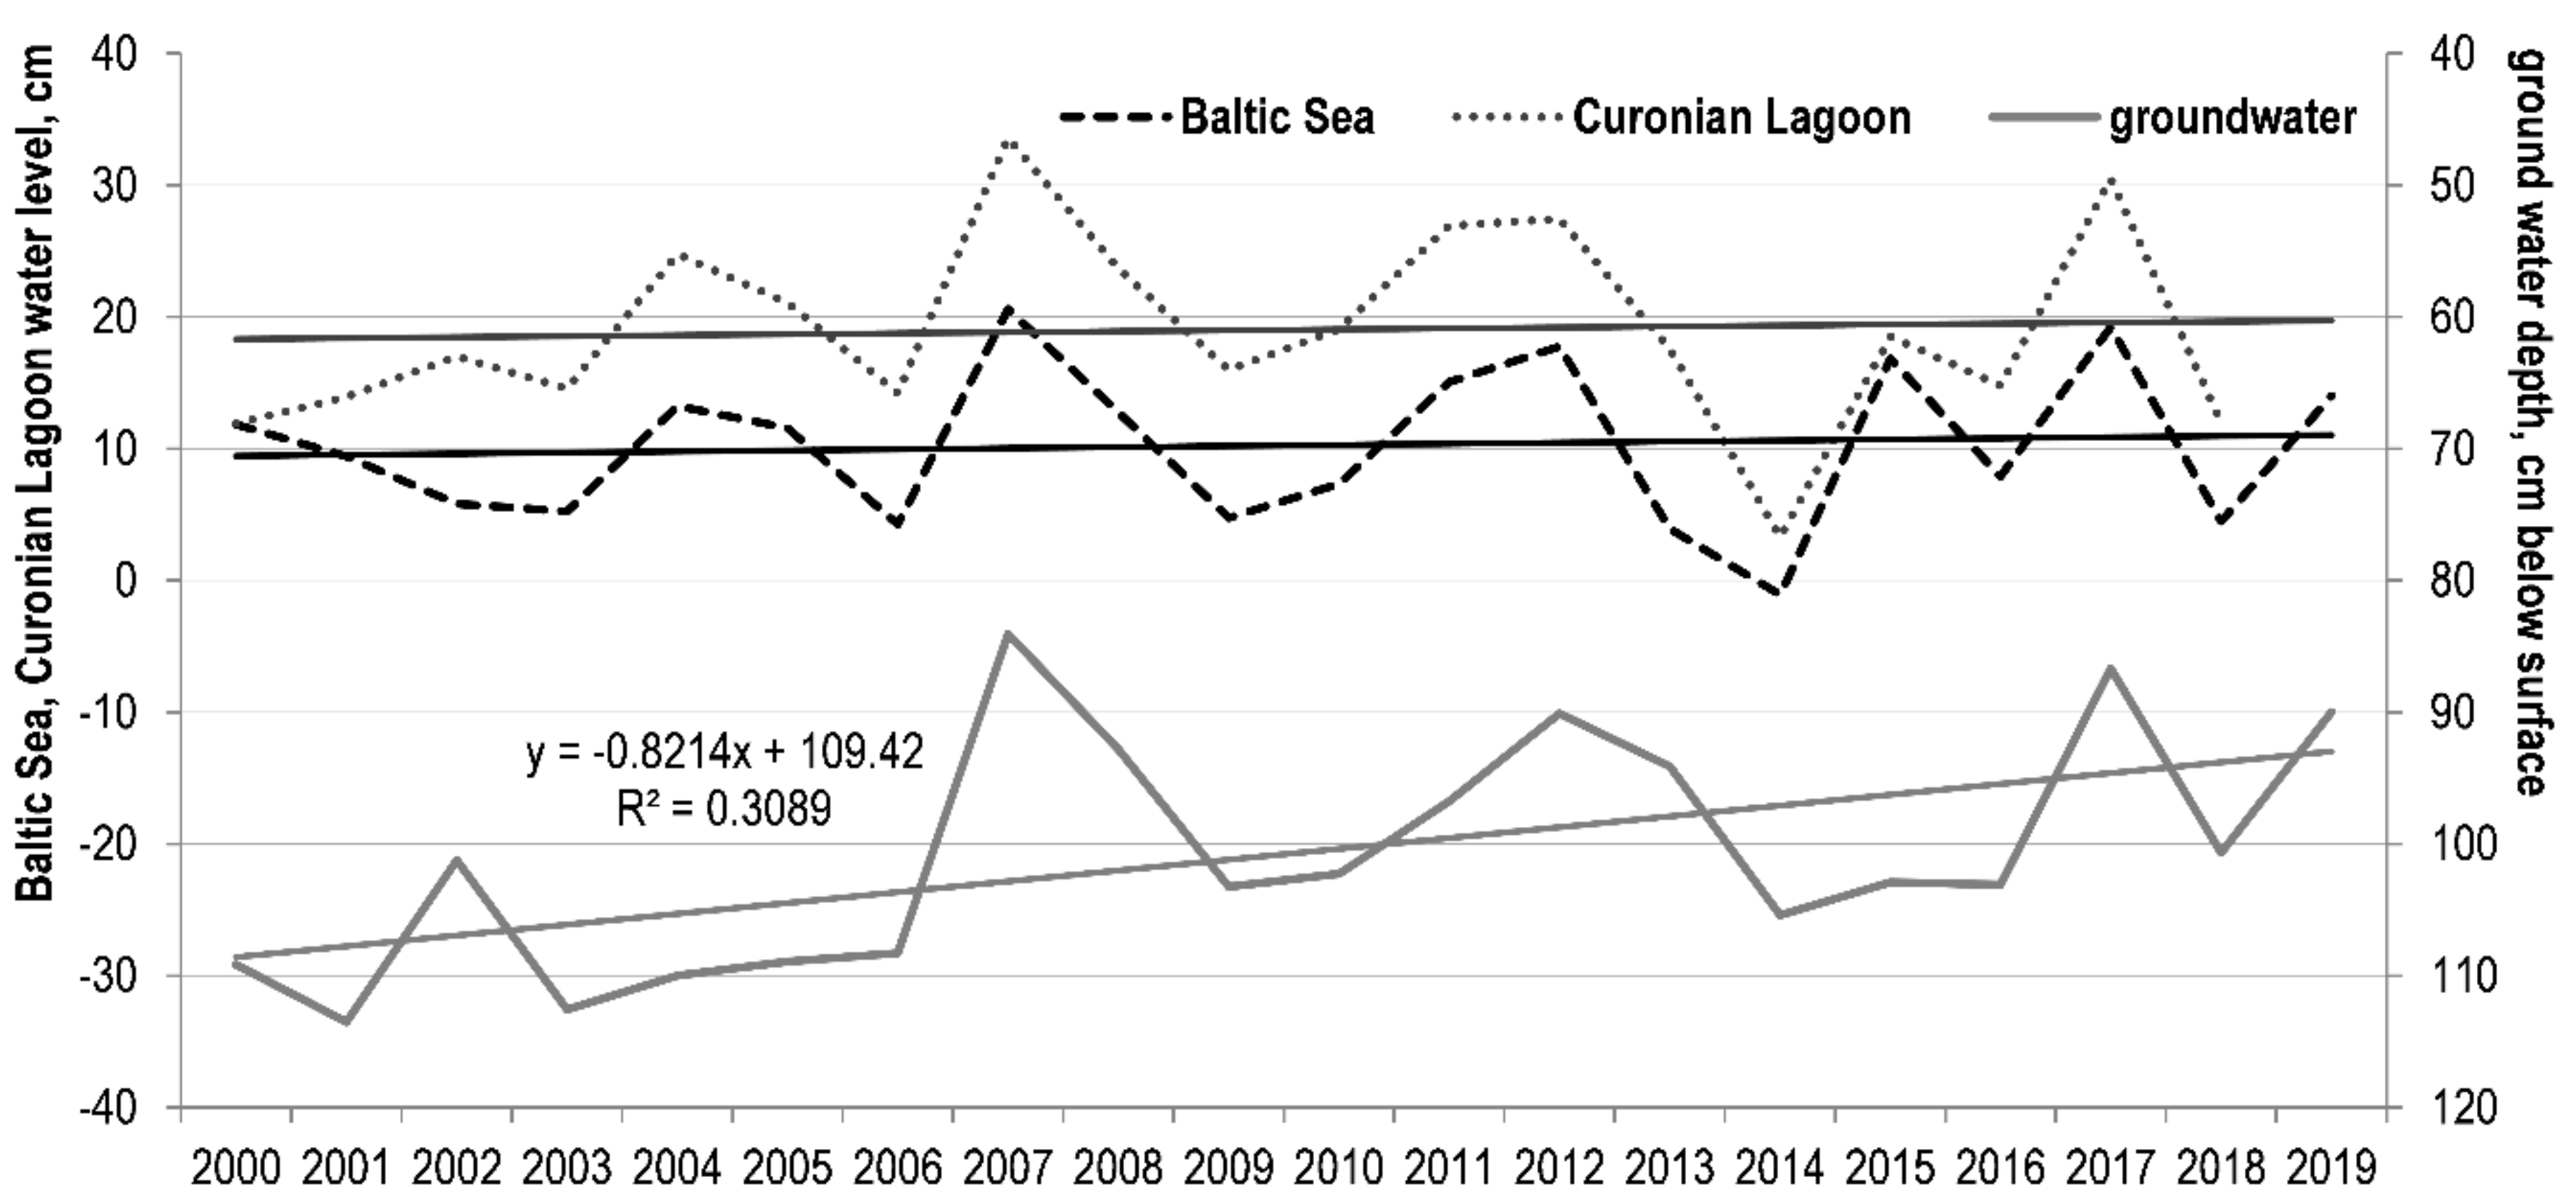
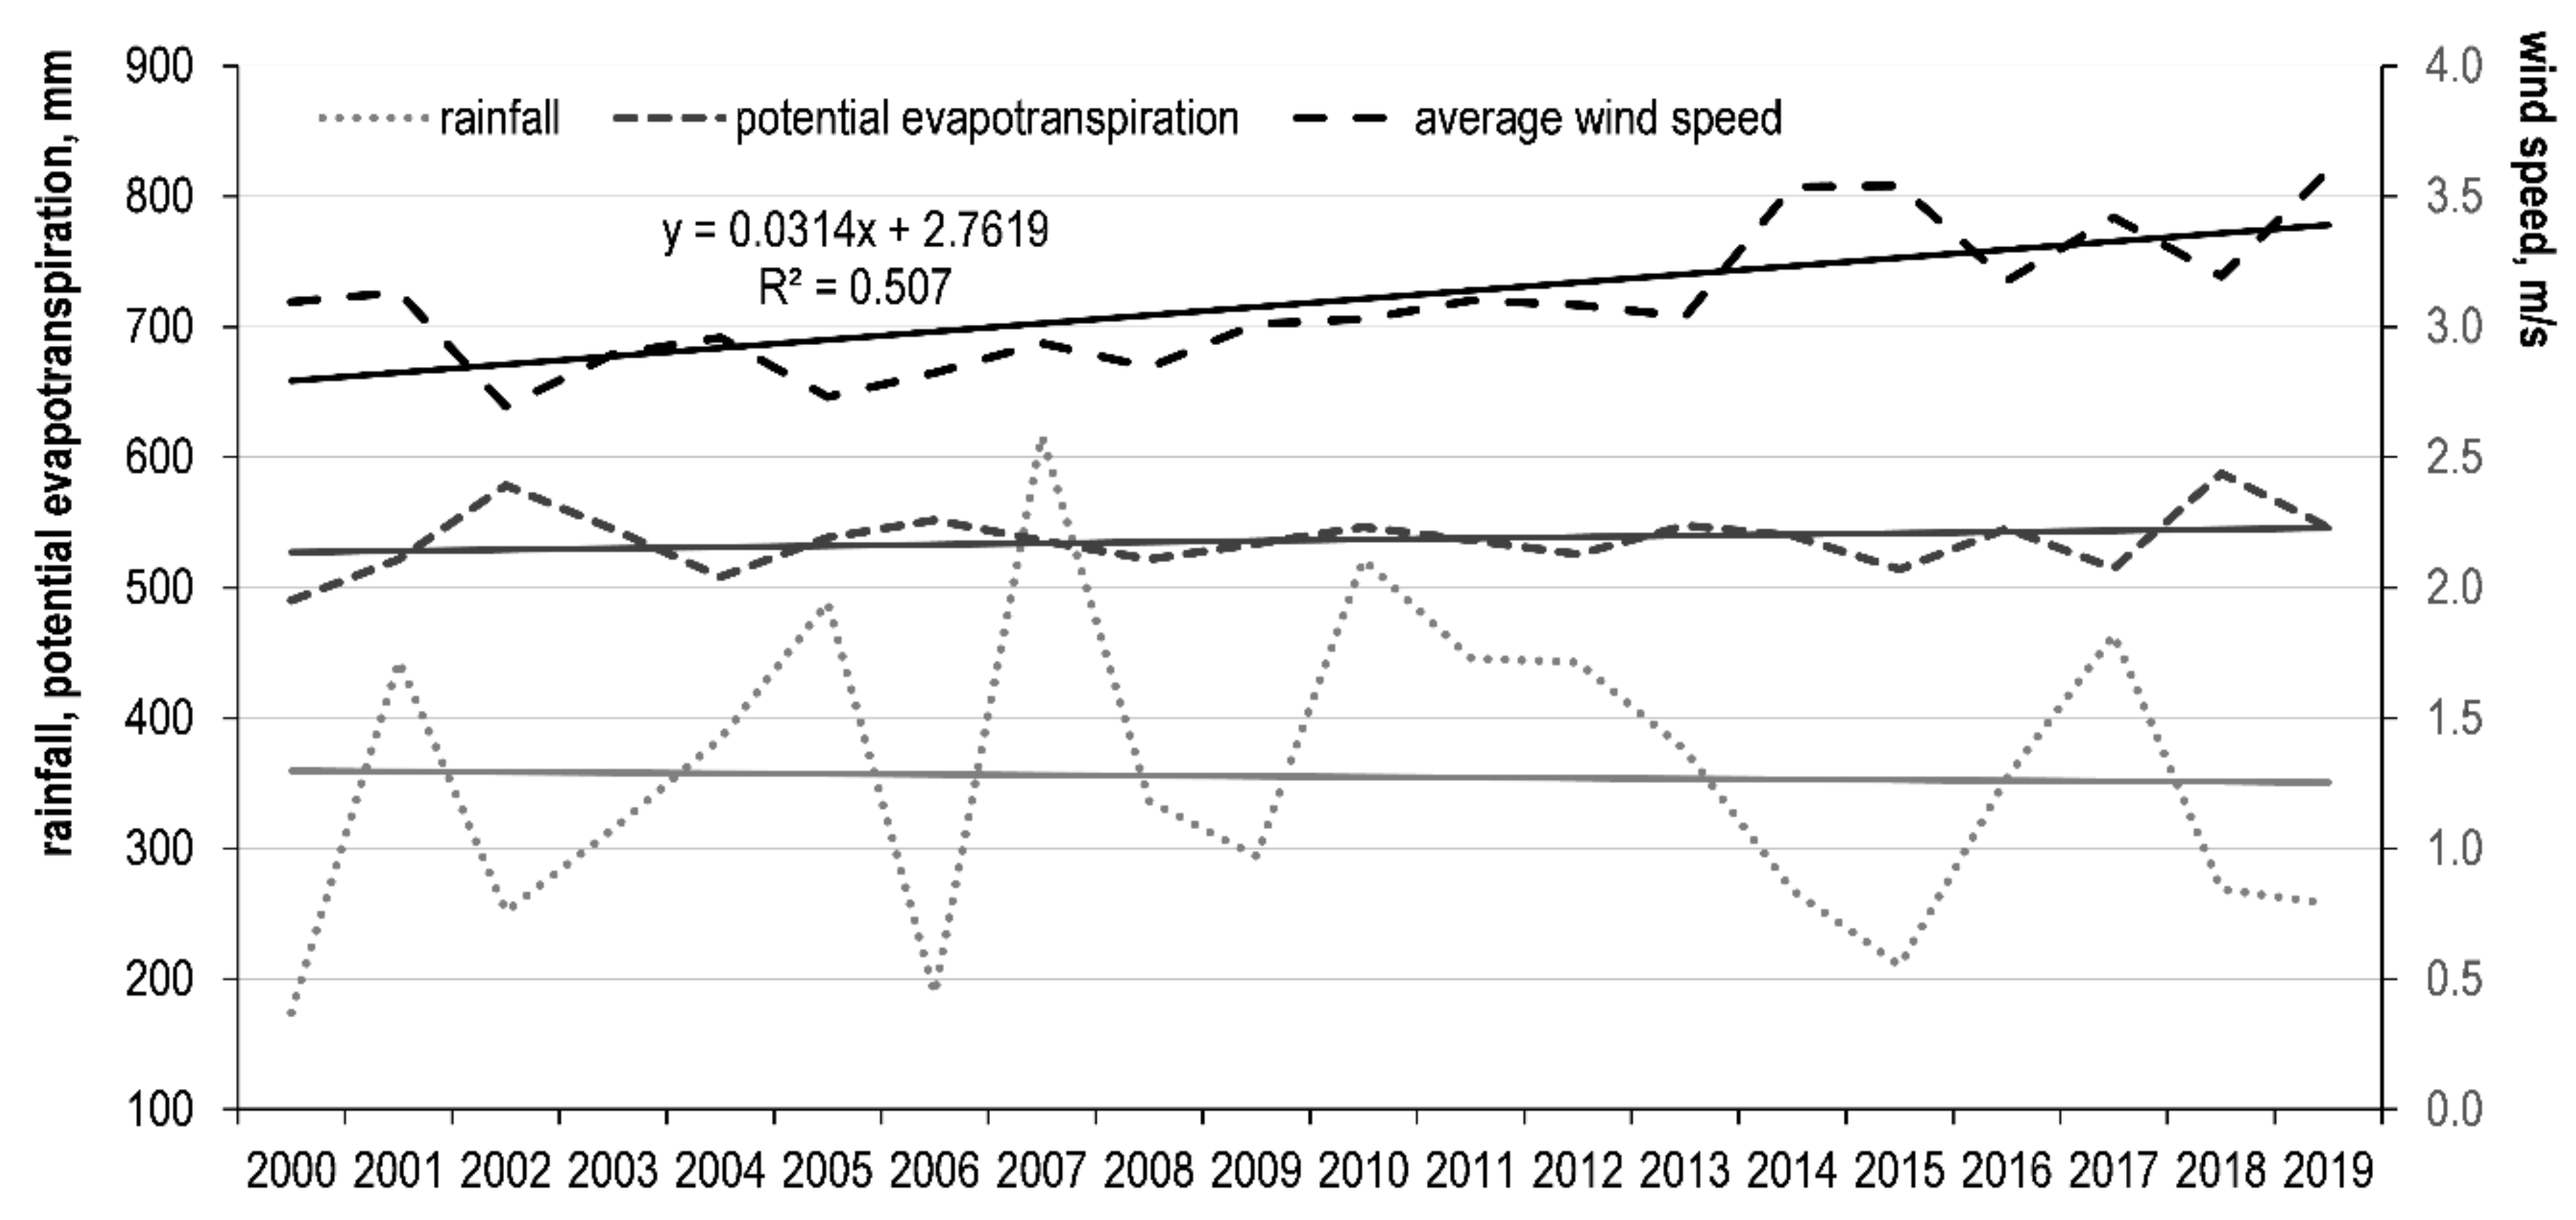
3.2. Trends of Hydrological Parameters Variation and Their Relationship with NDVI
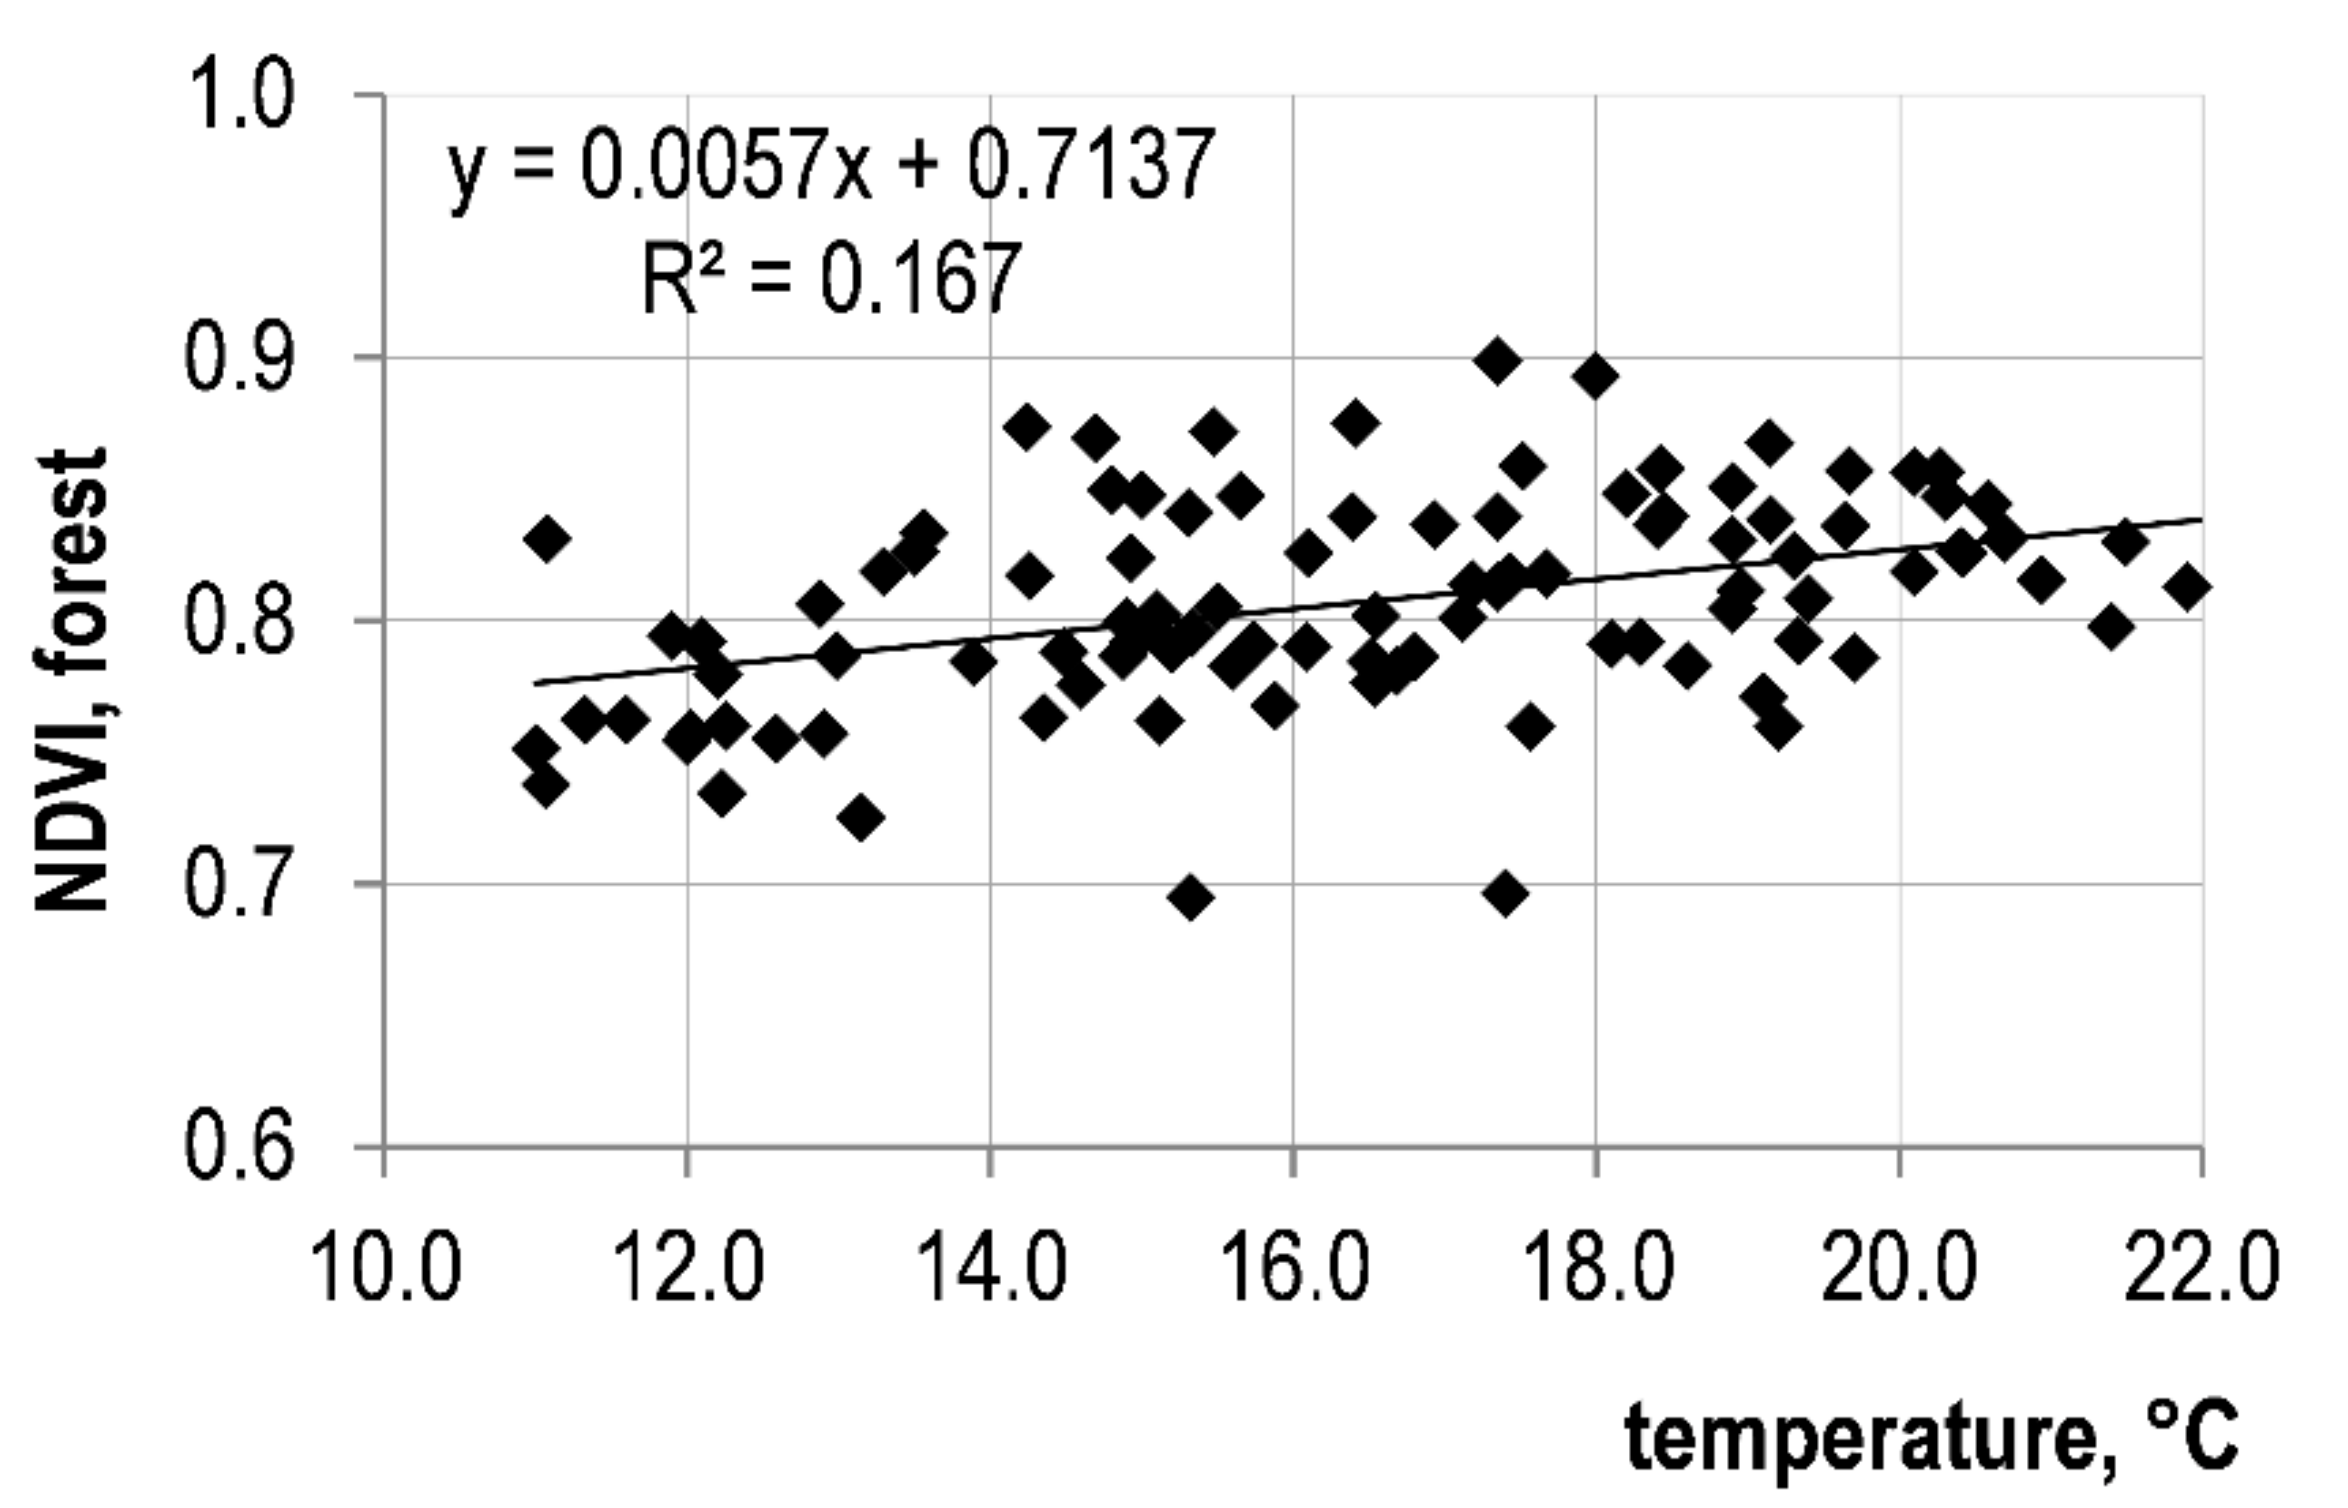
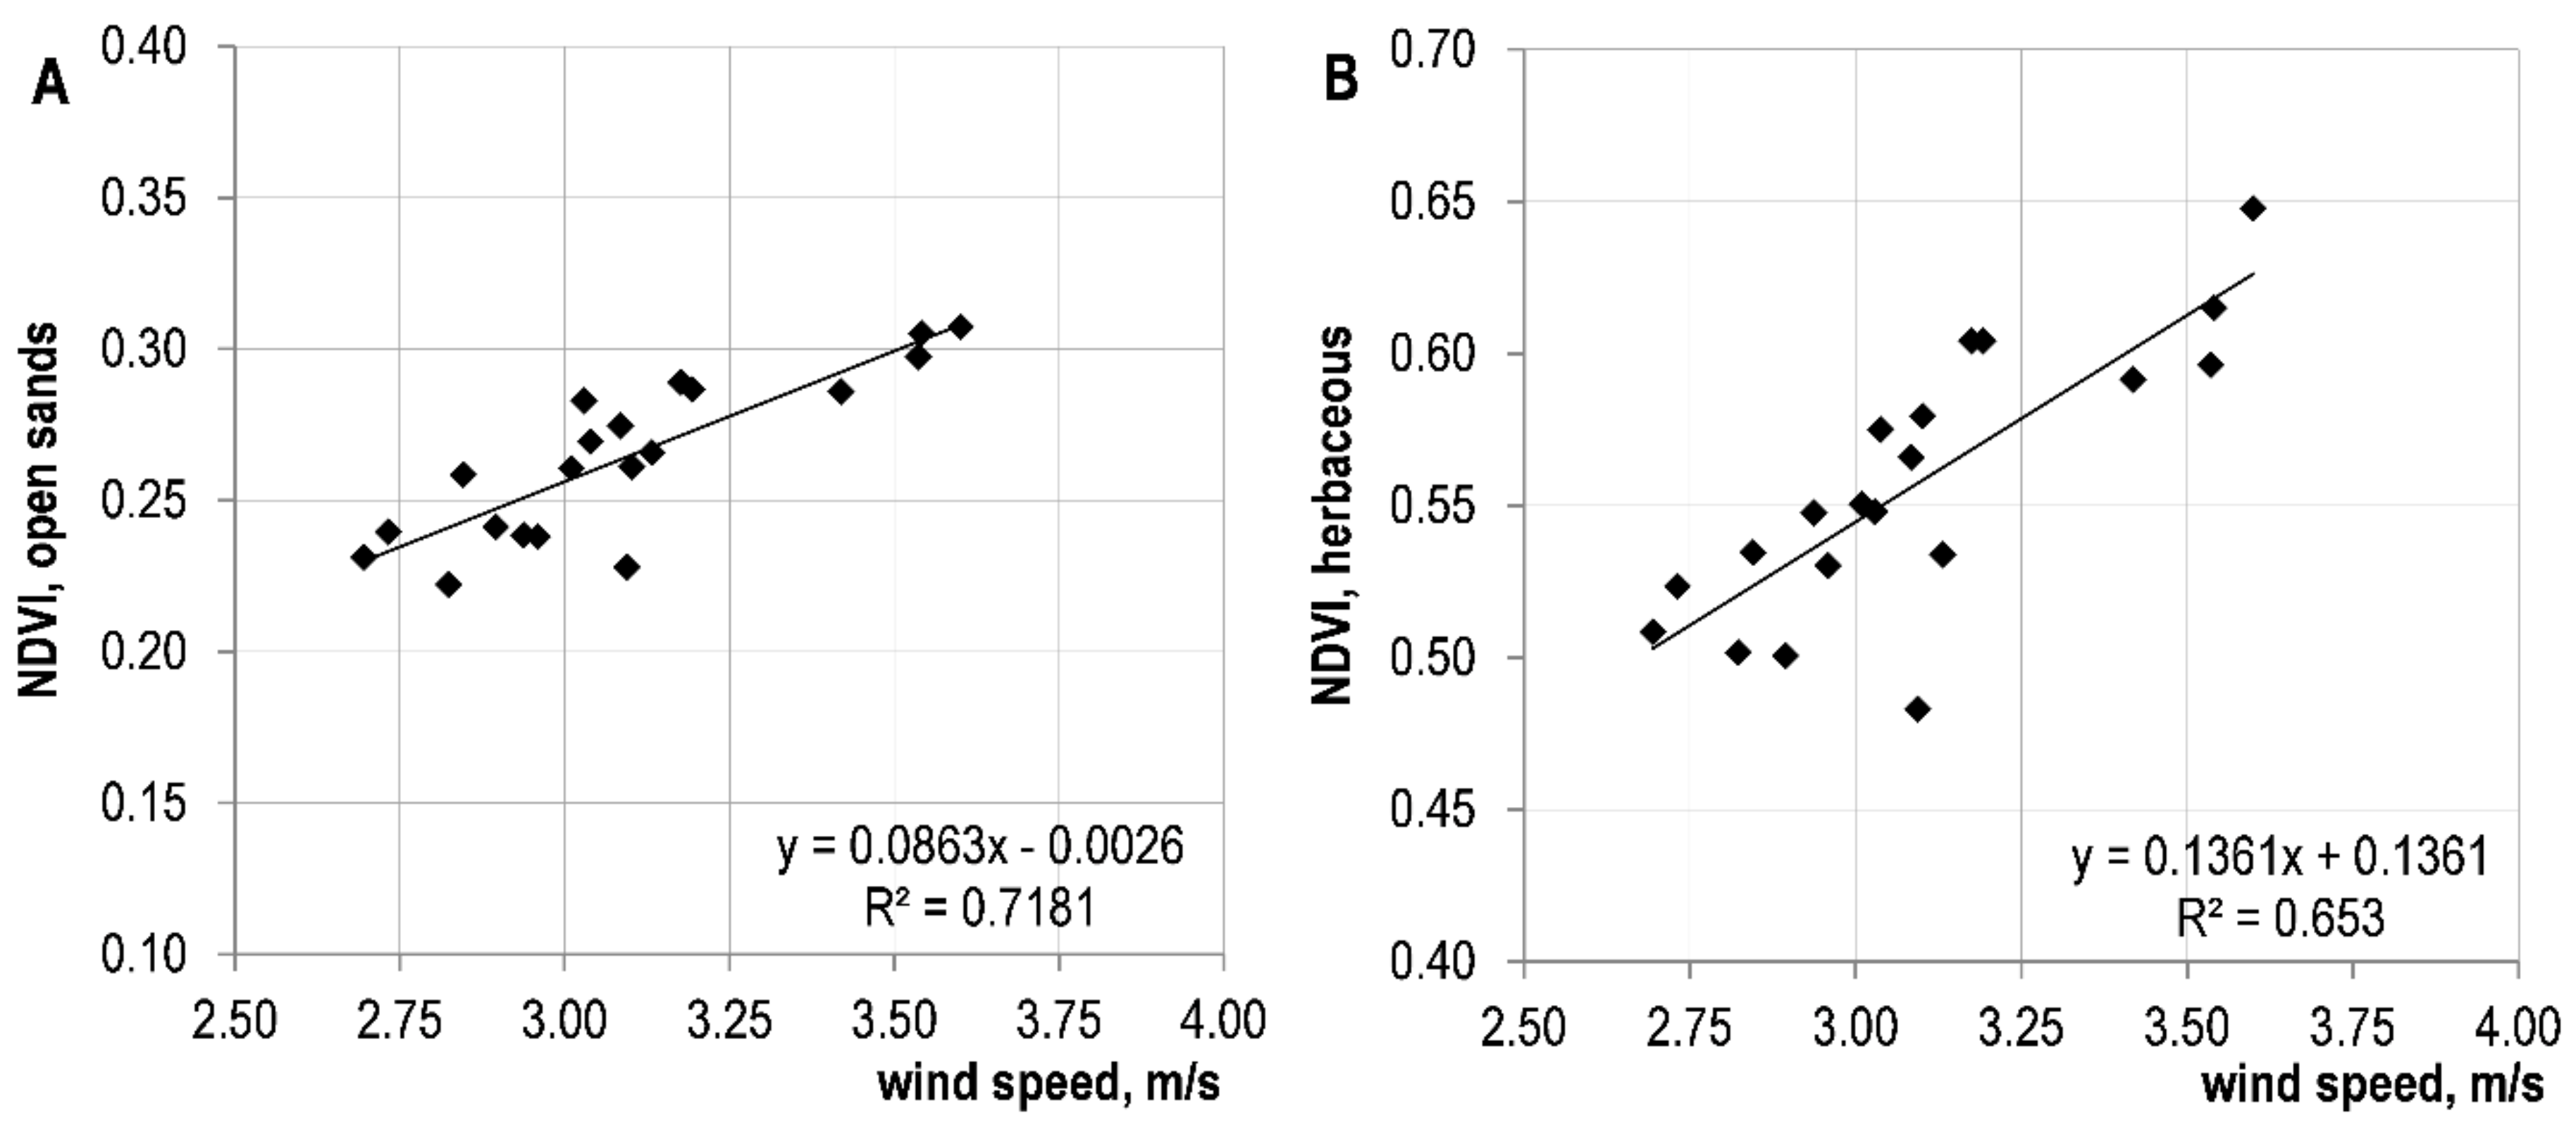
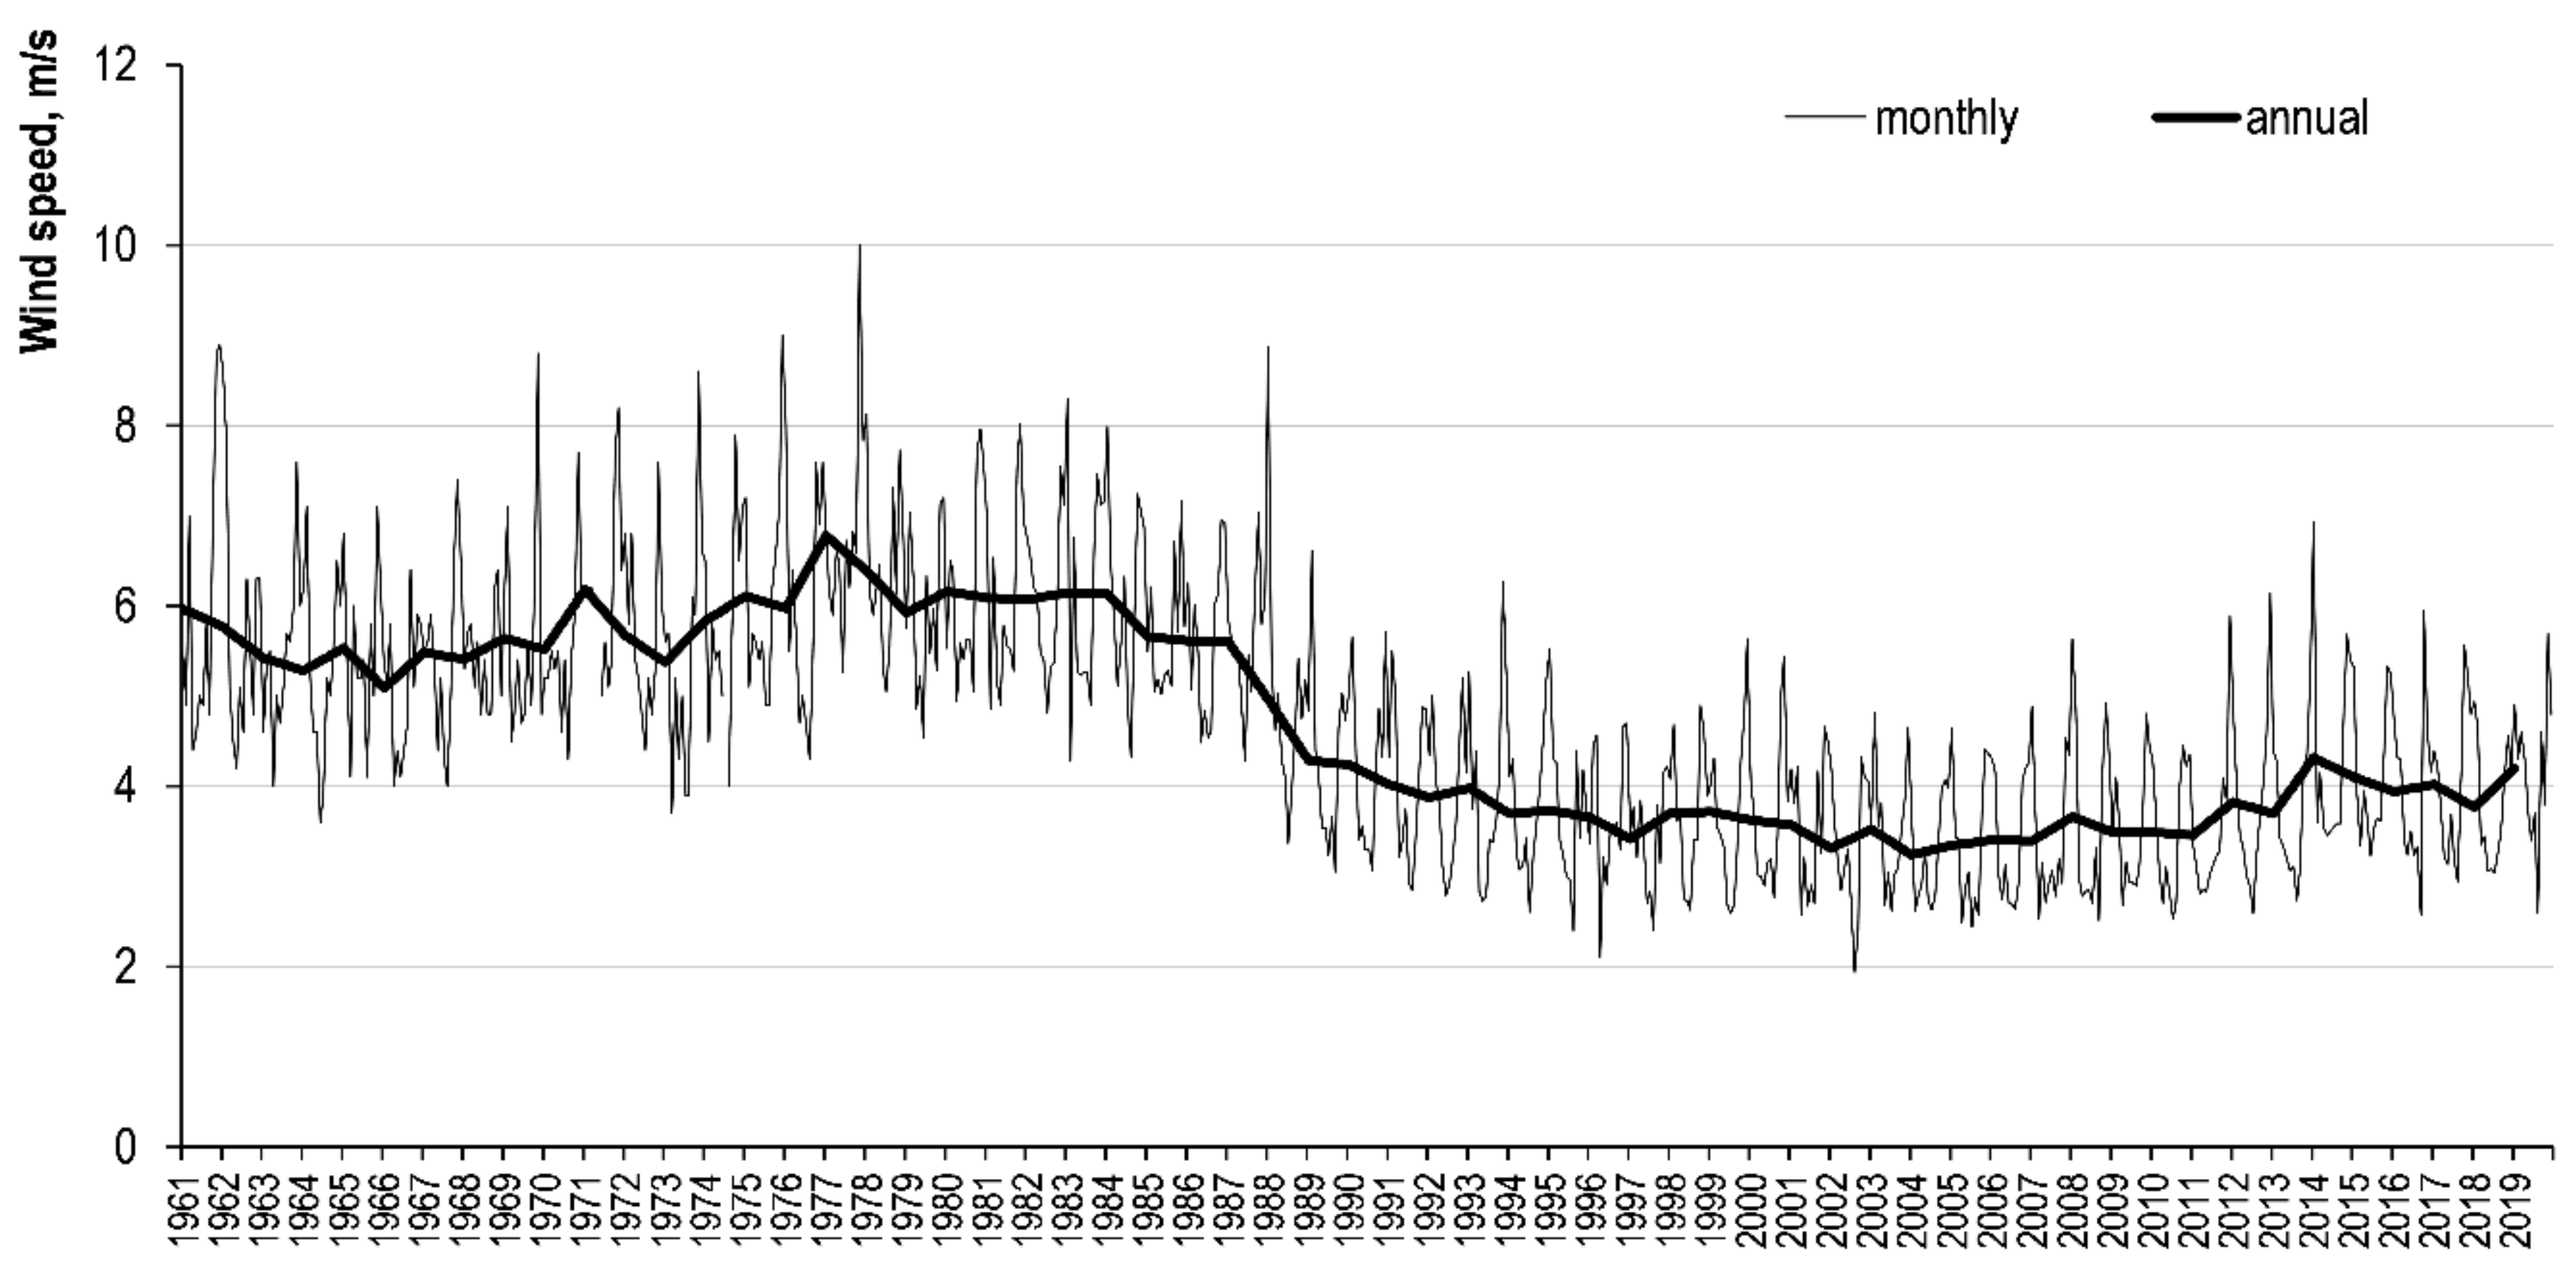
3.3. Variation Trends of Meteorological Parameters and Their Relationship with NDVI
4. Discussion
5. Conclusions
- The increase in NDVI in various ecosystems of the Curonian Spit has best relationship with the augmentation in average wind speed, water table (the Baltic sea, the Curonian Lagoon and groundwater) and air temperature.
- According to the correlations of NDVI and hydroclimatic parameters in different ecosystems, it is probable that the most important source of water in forest ecosystems is precipitation and groundwater, in herbaceous ecosystems-precipitation and condensation, in open sand ecosystems-condensation.
- Due to the changes in natural conditions the overgrowth trends prevailed in recent decades in the Curonian spit. They are mostly determined by processes in non-forested ecosystems. Thus, the protection of sand dunes, covered with herbaceous vegetation is not anti-successive management tool, as is the aim of the EU dune management policy. On the contrary, it is a successive measure that encourages the overgrowth of shifting dunes in Curonian spit.
Author Contributions
Funding
Acknowledgments
Conflicts of Interest
References
- Unesco World Heritage Nomination. Curonian Spit. 1999. Available online: https://whc.unesco.org/uploads/nominations/994.pdf (accessed on 18 November 2020).
- Buynevich, I.V.; Bitinas, A.; Pupienis, D. Aeolian Sand Invasion: Georadar Signatures from the Curonian Spit Dunes, Lithuania; Springer: Cham, Switzerland, 2015; pp. 67–78. [Google Scholar] [CrossRef]
- Jackson, D.W.T.; Costas, S.; González-Villanueva, R.; Cooper, A. A global ‘greening’ of coastal dunes: An integrated consequence of climate change? Glob. Planet. Chang. 2019, 182, 103026. [Google Scholar] [CrossRef]
- Povilanskas, R.; Baghdasarian, H.; Arakelyan, S.; Satkunas, J.; Taminskas, J. Secular morphodynamic trends of the Holocene dune ridge on the Curonian Spit (Lithuania/Russia). J. Coast. Res. 2009, 25, 209–215. [Google Scholar] [CrossRef]
- Povilanskas, R. Spatial diversity of modern geomorphological processes on a Holocene Dune Ridge on the. Curonian Spit in the South-East Baltic. Baltica 2009, 22, 77–88. [Google Scholar]
- Olšauskas, A.M. Woody and grassy vegetation development in different landscape elements of the Curonian Spit. Environ. Res. Eng. Manag. 2009, 50, 30–36. [Google Scholar]
- Galiniene, J.; Dailidiene, I.; Bishop, S.R. Forest management and sustainable urban development in the Curonian Spit. Europ. J. Remote Sens. 2019, 52, 42–57. [Google Scholar] [CrossRef] [Green Version]
- Jarmalavičius, D.; Žilinskas, G.; Pupienis, D. Geologic framework as a factor controlling coastal morphometry and dynamics. Curonian Spit, Lithuania. Int. J. Sediment Res. 2017, 32, 597–603. [Google Scholar] [CrossRef]
- Jarmalavičius, D.; Šmatas, V.; Stankūnavičius, G.; Pupienis, D.; Žilinskas, G. Factors controlling coastal erosion during storm events. J. Coast. Res. 2016, 75, 1112–1116. [Google Scholar] [CrossRef]
- Česnulevičius, A.; Izmailow, B.; Morkūnaitė, R. Defliacinių daubų dinamika Kuršių nerijos Didžiajame kopagūbryje. Geografija 2006, 42, 21–28. [Google Scholar]
- Žaromskis, R. Impact of different human acctivities on the development of the southeastern Baltic coasts. Ann. Geographicae 2001, 34, 59–72. [Google Scholar]
- Lamentowicz, M.; Milecka, K.; Gałka, M.; Cedro, A.; Pawlyta, J.; Piotrowska, N.; Lamentowicz, Ł.; van der Knaap, W.O. Climate and human induced hydrological change since AD 800 in an ombrotrophic mire in Pomerania (N Poland) tracked by testate amoebae, macro-fossils, pollen and tree rings of pine. Boreas 2009, 38, 214–229. [Google Scholar] [CrossRef]
- Van der Meij, W.M.; Temme, A.J.A.M.; Wallinga, J.; Sommer, M. Modelling soil and landscape evolution—The effect of rainfall and land use change on soil and landscape patterns. Soil 2020, 6, 337–358. [Google Scholar] [CrossRef]
- Kołaczek, P.; Karpińska-Kołaczek, M.; Marcisz, K.; Gałka, M.; Lamentowicz, M. Palaeohydrology and the human impact on one of the largest raised bogs complex in the Western Carpathians (Central Europe) during the last two millennia. Holocene 2017, 28, 595–608. [Google Scholar] [CrossRef]
- Silvestri, S.; Marani, M.; Marani, A. Hyperspectral remote sensing of salt marsh vegetation, morphology and soil topography. Phys. Chem. Earth 2003, 28, 15–25. [Google Scholar] [CrossRef]
- Marzialetti, F.; Giulio, S.; Malavasi, M.; Sperandii, M.G.; Acosta, A.T.R.; Carranza, M.L. Capturing coastal dune natural vegetation types using a phenology-based mapping approach: The potential of Sentinel-2. Remote Sens. 2019, 11. [Google Scholar] [CrossRef] [Green Version]
- Fu, B.; Burgher, I. Riparian vegetation NDVI dynamics and its relationship with climate, surface water and groundwater. J. Arid Environ. 2015, 113, 59–68. [Google Scholar] [CrossRef]
- Shalaby, A.; Tateishi, R. Remote sensing and GIS for mapping and monitoring land cover and land-use changes in the Northwestern coastal zone of Egypt. Appl. Geogr. 2007, 27, 28–41. [Google Scholar] [CrossRef]
- Peng, J.; Dong, W.; Yuan, W.; Zhang, Y. Responses of grassland and forest to temperature and precipitation changes in Northeast China. Adv. Atmos. Sci. 2012, 29, 1063–1077. [Google Scholar] [CrossRef]
- Groeneveld, D.P. Remotely-sensed groundwater evapotranspiration from alkali scrub affected by declining water table. J. Hydrol. 2008, 358, 294–303. [Google Scholar] [CrossRef]
- Ji, L.; Peters, A.J. Assessing vegetation response to drought in the northern Great Plains using vegetation and drought indices. Remote Sens. Environ. 2003, 87, 85–98. [Google Scholar] [CrossRef]
- Dabrowska-Zielinska, K.; Kogan, F.; Ciolkosz, A.; Gruszczynska, M.; Kowalik, W. Modelling of crop growth conditions and crop yield in Poland using AVHRR-based indices. Int. J. Remote Sens. 2010, 23, 1109–1123. [Google Scholar] [CrossRef]
- Aguilar, C.; Zinnert, J.C.; Polo, M.J.; Young, D.R. NDVI as an indicator for changes in water availability to woody vegetation. Ecol. Indic. 2012, 23, 290–300. [Google Scholar] [CrossRef]
- Petus, C.; Lewis, M.; White, D. Using MODIS normalized difference vegetation index to monitor seasonal and inter-annual dynamics of wetland vegetation in the great artesian basin: A baseline for assessment of future changes in a unique ecosystem. In Proceedings of the ISPRS—International Archives Photogrammetry Remote Sensing Spatial Information Sciences, Melbourne, Australia, 25 August–1 September 2012; pp. 187–192. [Google Scholar] [CrossRef] [Green Version]
- Šimanauskienė, R.; Linkevičienė, R.; Bartold, M.; Dąbrowska-Zielińska, K.; Slavinskienė, G.; Veteikis, D.; Taminskas, J. Peatland degradation: The relationship between raised bog hydrology and normalized difference vegetation index. Ecohydrology 2019, 12. [Google Scholar] [CrossRef]
- Páscoa, P.; Gouveia, C.M.; Kurz-Besson, C. A simple method to identify potential groundwater-dependent vegetation using NDVI MODIS. Forests 2020, 11. [Google Scholar] [CrossRef] [Green Version]
- Teodoro, A.C. Optical satellite remote sensing of the coastal zone environment—An overview. Environ. Appl. Remote Sens. 2016, 165–196. [Google Scholar] [CrossRef] [Green Version]
- Dobrotin, N. Evolution of the Curonian Spit Dunes. Ph.D. Thesis, Klaipėda University, Klaipėda, Lithuania, 2018. [Google Scholar]
- Bagdanavičiūtė, I.; Kelpšaitė-Rimkienė, L.; Galinienė, J.; Soomere, T. Index based multi-criteria approach to coastal risk assesment. J. Coas. Conserv. 2019, 23, 785–800. [Google Scholar] [CrossRef]
- Łabuz, T.A.; Grunewald, R.; Bobykina, V.; Chubarenko, B.; Česnulevičius, A.; Bautrenas, A.; Orkunaite, R.; Tõnisson, H. Coastal dunes of the Baltic Sea Shores: A Review; Adam Mickiewicz University Press: Poznan, Poland, 2018; Volume 37, pp. 47–71. [Google Scholar]
- Morkūnaitė, R.; Bautrėnas, A.; Česnulevičius, A.; Dobrotin, N.; Baubinienė, A.; Jankauskaitė, M.; Kalesnikas, A.; Mačiulevičiūtė-Turlienė, N. Changes in quantitative parameters of active wind dunes on the south-east Baltic Sea coast during the last decade (Curonian Spit, Lithuania). Geol. Q. 2017, 62, 38–47. [Google Scholar] [CrossRef] [Green Version]
- Semi-Natural Grasslands across Borders (Post-Conference Excursion 9–11 July 2017, Western Lithuania). 2017. Available online: https://edgg.org/sites/default/files/page/Post_Conference_Excursion_small_14EGC.pdf (accessed on 18 November 2020).
- Brukas, A.; Naureckaitė, V. Forests in the Curonian Spit: From the Beginning up to the 20th Century; Lithuanian State Forest Service: Kaunas, Lithuania, 2013. [Google Scholar]
- Dailidiene, I.; Davuliene, L.; Kelpšaite, L.; Razinkovas, A. Analysis of the climate change in lithuanian coastal areas of the baltic sea. J. Coast. Res. 2012, 28, 557–569. [Google Scholar] [CrossRef]
- Veteikis, D.; Sabanovas, S.; Jankauskaite, M. Landscape structure changes on the coastal plain of Lithuania during 1998–2009. Baltica: Int. J. Geosci. 2011, 24, 107–117. [Google Scholar]
- Aviziene, D.; Pakalnis, R.; Sendzikaite, J. Status of red-listed species Eryngium maritimum L on the Lithuanian coastal dunes. In Proceedings of the 7th International Conference on Environmental Engineering, ICEE, Boston, MA, USA, 18 September 2008; pp. 22–28. [Google Scholar]
- Morkūnaitė, R.; Česnulevičius, A. Changes in blowout segments of the main ridge in the curonian spit in 1999–2003. Acta Zool. Litu. 2005, 15, 145–150. [Google Scholar] [CrossRef]
- Galinienė, J. Change in Land use and land cover of coastal zone: Classification methods comparison and assessment. Ph.D. Thesis, Klaipeda University, Klaipeda, Lithuania, 2020. [Google Scholar]
- Mikėnas, J.; Pupienis, D. The change of rhythmic patterns on the sandy Baltic sea coasts. Vilnius Univ. Proc. 2020, 10, 40. [Google Scholar] [CrossRef]
- Vaitkus, G.; Vaitkuvienė, D. Land cover changes in the Lithuanian coastal zone during 1975–2000. Acta Zool. Litu. 2005, 15, 183–187. [Google Scholar] [CrossRef]
- Buivydaitė, V.; Vaičys, M.; Juodis, J.; Motuzas, A. Lithuanian Soil Classification (in Lithuanian); Mokslas: Vilnius, Lithuania, 2001; p. 137. [Google Scholar]
- FAO. International Soil Classification System for Naming Soils and Creating Legends for Soil Maps—Update 2015. In World Reference Base for Soil Resources 2014; FAO: Rome, Italy, 2015; p. 193. [Google Scholar]
- Huiskes, A.H.L. Ammophila Arenaria (L.) Link (Psamma Arenaria (L.) Roem. et Schult.; Calamgrostis Arenaria (L.) Roth). J. Ecol. 1979, 67, 363–382. [Google Scholar] [CrossRef]
- Trist, P.J.O. The distribution and status of Corynephorus canescens (L.) P. Beauv. (Poaceae) in Britain and the Channel Islands with particular reference to its conservation. Watsonia 1998, 2, 41–47. [Google Scholar]
- Smith, P.H. Corynephorus canescens (L.) P. Beauv. (Grey Hair-grass) on the Sefton Coast, Merseyside (v.c. 59). Watsonia 2008, 27, 149–157. [Google Scholar]
- Hartley, S.E.; Amos, L. Competitive interactions between Nardus stricta L. and Calluna vulgaris (L.) Hull: The effect of fertilizer and defoliation on above- and below-ground performance. J. Ecol. 1999, 87, 330–340. [Google Scholar] [CrossRef]
- Bruun, H.H. Biological flora of the British isles: Rosa Thunb. ex Murray. J. Ecol. 2005, 93, 441–470. [Google Scholar] [CrossRef]
- Crow, P. The Influence of Soils and Species on Tree Root Depth, Information Note; Forestry Comission: Edinburgh, UK, 2005; pp. 1–8. [Google Scholar]
- Usman, U.; Yelwa, S.A.; Gulumbe, S.U.; Danbaba, A.; Nir, R. Modelling relationship between NDVI and climatic variables using geographically weighted regression. J. Mat. Sci. Appl. 2013, 1, 24–28. [Google Scholar] [CrossRef]
- Volungevičius, J.; Jukna, L.; Tuskenytė, V. Ecogeographical Assessment of Curonian Spit Landscape Diversity in the Section Pervalka–Nida; Vilnius University: Vilnius, Lithuania, 2016; p. 114. [Google Scholar]
- Volungevičius, J.; Jukna, L. Ecogeographical Assessment of Curonian Spit Landscape Diversity in the Section Juodkrante–Smiltyne; Vilnius University: Vilnius, Lithuania, 2017; p. 98. [Google Scholar]
- Volungevičius, J. Landscape Diversity Ecogeographical Evaluation in the Zone of Nida—Alksnynė in Curonian Spit; Vilnius University: Vilnius, Lithuania, 2018. [Google Scholar]
- Volungevičius, J. Reference Sections of the Curonian Spit Landscape; Vilnius University: Vilnius, Lithuania, 2019; p. 42. [Google Scholar]
- Thornthwaite, C.W. An approach toward a rational classification of climate. Geogr. Rev. 1948, 38, 55. [Google Scholar] [CrossRef]
- Rašomavičius, V.; Sinkevičienė, Z.; Balsevičius, A.; Čiuplys, R.; Patalauskaitė, D.; Olenin, S.; Daunys, D. Europinės Svarbos Buveinės Lietuvoje; Daigai: Vilnius, Lithuania, 2001; p. 138. [Google Scholar]
- Gao, J.; Kennedy, D.M.; Konlechner, T.M. Coastal dune mobility over the past century: A global review. Prog. Phys. Geogr. 2020. [Google Scholar] [CrossRef]
- Jackson, D.; Cooper, A. Coastal dune fields in Ireland: Rapid regional response to climatic change. J. Coast. Res. 2011, SI 64, 293–297. [Google Scholar]
- Provoost, S.; Jones, M.L.M.; Edmondson, S.E. Changes in landscape and vegetation of coastal dunes in northwest Europe: A review. J. Coast. Conserv. 2011, 15, 207–226. [Google Scholar] [CrossRef]
- Pinto, L.H.T.; Fernandes, L.R. Multitemporal analyses of the vegetation cover of coastal sand dune ecosystems in Natal/RN, based on NDVI index. In Proceedings of the Anais XV Simpósio Brasileiro de Sensoriamento Remoto—SBSR, Curitiba, PR, Brasilia, Brazil, 30 April–5 May 2011; pp. 1895–1901. [Google Scholar]
- Acosta, A.; Carranza, M.L.; Izzi, C.F. Are there habitats that contribute best to plant species diversity in coastal dunes? Biodiv. Conserv. 2009, 18, 1087–1098. [Google Scholar] [CrossRef]
- Arens, S.M.; Slings, Q.L.; Geelen, H.; van der Hagen, H.G.J.M. Implications of environmental change for dune mobility in the Netherlands. In Proceedings of the International Conference on Management and Restoration of Coastal Dunes, Minist. de Medio Ambiente, Santander, Spain, 3–5 October 2007. [Google Scholar]
- Costas, S.; Alejo, I. Local and global influences on the evolution of a transgressive sand barrier: Cíes Barrier, Northwest Spain. In Proceedings of the 9th International Coastal Symposium, Queensland, Australia, 16–20 April 2007; pp. 1121–1125. [Google Scholar]
- Bailey, S.D.; Bristow, C.S. Migration of parabolic dunes at Aberffraw, Anglesey, north Wales. Geomorphology 2004, 59, 165–174. [Google Scholar] [CrossRef]
- Navrotskaya, S.E.; Chubarenko, B.V. Trends in the variation of the sea level in the lagoons of the Southeastern Baltic. Oceanology 2013, 53, 13–23. [Google Scholar] [CrossRef]
- Chen, M.; Parton, W.J.; Hartman, M.D.; del Grosso, S.J.; Smith, W.K.; Knapp, A.K.; Lutz, S.; Derner, J.D.; Tucker, C.J.; Ojima, D.S.; et al. Assessing precipitation, evapotranspiration, and NDVI as controls of U.S. Great Plains plant production. Ecosphere 2019, 10. [Google Scholar] [CrossRef]
- Baumbach, L.; Siegmund, J.F.; Mittermeier, M.; Donner, R.V. Impacts of temperature extremes on European vegetation during the growing season. Biogeosciences 2017, 14, 4891–4903. [Google Scholar] [CrossRef] [Green Version]
- Kim, J.Y.; Rastogi, G.; Do, Y.; Kim, D.K.; Muduli, P.R.; Samal, R.N.; Pattnaik, A.K.; Joo, G.J. Trends in a satellite-derived vegetation index and environmental variables in a restored brackish lagoon. Glob. Ecol. Conserv. 2015, 4, 614–624. [Google Scholar] [CrossRef] [Green Version]
- Piao, S.; Fang, J.; Liu, H.; Zhu, B. NDVI-indicated decline in desertification in China in the past two decades. Geophys. Res. Lett. 2005, 32, 1–4. [Google Scholar] [CrossRef]
- Wang, J.; Rich, P.M.; Price, K.P. Temporal responses of NDVI to precipitation and temperature in the central Great Plains, USA. Int. J. Remote Sens. 2003, 24, 2345–2364. [Google Scholar] [CrossRef]
- Yang, H.; Yang, X.; Heskel, M.; Sun, S.; Tang, J. Seasonal variations of leaf and canopy properties tracked by ground-based NDVI imagery in a temperate forest. Sci. Reports 2017, 7, 1–10. [Google Scholar] [CrossRef]
- McVicar, T.R.; Roderick, M.L.; Donohue, R.J.; Li, L.T.; van Niel, T.G.; Thomas, A.; Grieser, J.; Jhajharia, D.; Himri, Y.; Mahowald, N.M.; et al. Global review and synthesis of trends in observed terrestrial near-surface wind speeds: Implications for evaporation. J. Hydrol. 2012, 416–417. [Google Scholar] [CrossRef]
- Yousefi Lalimi, F.; Silvestri, S.; Moore, L.J.; Marani, M. Coupled topographic and vegetation patterns in coastal dunes: Remote sensing observations and ecomorphodynamic implications. J. Geophys. Res. Biogeosci. 2017, 122, 119–130. [Google Scholar] [CrossRef]
- Alphan, H. Comparing the utility of image algebra operations for characterizing landscape changes: The case of the Mediterranean coast. J. Environ. Manag. 2011, 92, 2961–2971. [Google Scholar] [CrossRef] [PubMed]
- Castanho, C.D.T.; Lortie, C.J.; Zaitchik, B.; Prado, P.I. A meta-analysis of plant facilitation in coastal dune systems: Responses, regions, and research gaps. PeerJ 2015, 2015, e768. [Google Scholar] [CrossRef] [PubMed] [Green Version]
- Houston, J. Management of Natura 2000 Habitats. 2130 *Fixed Coastal Dunes with Herbaceous Vegetation (‘Grey Dunes’); European Comission: Brussells, Belgium, 2008; p. 30. [Google Scholar]


| Humidity Conditions | Depth of Surplus Humidity Layer, cm | Plant Communities |
|---|---|---|
| Dry | >200 | Vaccinio-myrtillo Pinetum, Corynephoretea |
| Quite humid | 100–200 | |
| Humid | 50–100 | Nyrtillo-Pinetum, Myrtilo-oxalido-Pinetum/Betuletum, Nardetea |
| Wet | <50 | Urtico-Alnetum, Caric-irido-Alnetum, Calamagrostido-Betuletum pubescentis/Piceetum |
| Very wet | groundwater table < 50 cm |
| Year | 2000 | 2001 | 2002 | 2003 | 2004 | 2005 | 2006 | 2007 | 2008 | 2009 | 2010 | 2011 | 2012 | 2013 | 2014 | 2015 | 2016 | 2017 | 2018 | 2019 |
|---|---|---|---|---|---|---|---|---|---|---|---|---|---|---|---|---|---|---|---|---|
| Forests | 10 | 9 | 13 | 6 | 9 | 15 | 10 | 10 | 10 | 12 | 6 | 11 | 11 | 9 | 12 | 15 | 12 | 12 | 13 | 7 |
| Herbaceous | 11 | 9 | 13 | 7 | 8 | 13 | 11 | 13 | 10 | 12 | 6 | 11 | 10 | 9 | 12 | 15 | 12 | 12 | 13 | 7 |
| Open sands | 10 | 9 | 12 | 6 | 9 | 14 | 10 | 14 | 10 | 12 | 6 | 11 | 11 | 9 | 12 | 15 | 12 | 12 | 13 | 7 |
| Index | Ecosystem | May | June | July | August | September |
|---|---|---|---|---|---|---|
| p-value | forest | 0.03496 | 0.02125 | 0.72118 | 0.87113 | 0.04780 |
| herbaceous | 0.00041 | 0.00255 | 0.00007 | 0.00032 | 0.00165 | |
| open sand | 0.00009 | 0.00132 | 0.00025 | 0.00066 | 0.00165 | |
| Sen’s slope | forest | 0.00220 | 0.00290 | −0.00033 | 0.00027 | 0.00272 |
| herbaceous | 0.00686 | 0.00530 | 0.00684 | 0.00724 | 0.00922 | |
| open sand | 0.00386 | 0.00371 | 0.00387 | 0.00371 | 0.00479 |
| Hydrological Index | Forests | Herbaceous | Open Sands | |||
|---|---|---|---|---|---|---|
| R | p | R | p | R | p | |
| The Baltic seas water level | 0.303 | <0.01 | 0.466 | <0.0001 | 0.314 | <0.01 |
| The Curonian lagoon water level | 0.272 | <0.01 | 0.360 | <0.001 | 0.196 | <0.1 |
| The Curonian spit groundwater depth | −0.201 | <0.05 | −0.252 | <0.05 | −0.166 | <0.1 |
| Meteorological Parameter | Forest | Herbaceous | Open Sand | |||
|---|---|---|---|---|---|---|
| R | p | R | p | R | p | |
| NDVI monthly average | ||||||
| Average monthly air temperature | 0.409 | <0.0001 | 0.296 | <0.01 | 0.242 | <0.05 |
| Monthly precipitation | 0.318 | <0.01 | 0.292 | <0.01 | 0.259 | <0.01 |
| Monthly PET | 0.207 | <0.05 | 0.253 | <0.05 | ||
| Average monthly wind speed | 0.468 | <0.00001 | 0.476 | <0.00001 | ||
| NDVI growing season average | ||||||
| Average wind speed in the growing season | 0.808 | <0.0001 | 0.847 | <0.00001 | ||
| Average annual wind speed | 0.379 | <0.1 | 0.767 | <0.0001 | 0.846 | <0.00001 |
| Average spring wind speed | 0.409 | <0.1 | 0.709 | <0.001 | 0.759 | <0.001 |
| Average winter wind speed | 0.465 | <0.05 | 0.416 | <0.1 | 0.507 | <0.05 |
Publisher’s Note: MDPI stays neutral with regard to jurisdictional claims in published maps and institutional affiliations. |
© 2020 by the authors. Licensee MDPI, Basel, Switzerland. This article is an open access article distributed under the terms and conditions of the Creative Commons Attribution (CC BY) license (http://creativecommons.org/licenses/by/4.0/).
Share and Cite
Taminskas, J.; Šimanauskienė, R.; Linkevičienė, R.; Volungevičius, J.; Slavinskienė, G.; Povilanskas, R.; Satkūnas, J. Impact of Hydro-Climatic Changes on Coastal Dunes Landscape According to Normalized Difference Vegetation Index (The Case Study of Curonian Spit). Water 2020, 12, 3234. https://doi.org/10.3390/w12113234
Taminskas J, Šimanauskienė R, Linkevičienė R, Volungevičius J, Slavinskienė G, Povilanskas R, Satkūnas J. Impact of Hydro-Climatic Changes on Coastal Dunes Landscape According to Normalized Difference Vegetation Index (The Case Study of Curonian Spit). Water. 2020; 12(11):3234. https://doi.org/10.3390/w12113234
Chicago/Turabian StyleTaminskas, Julius, Rasa Šimanauskienė, Rita Linkevičienė, Jonas Volungevičius, Gintarė Slavinskienė, Ramūnas Povilanskas, and Jonas Satkūnas. 2020. "Impact of Hydro-Climatic Changes on Coastal Dunes Landscape According to Normalized Difference Vegetation Index (The Case Study of Curonian Spit)" Water 12, no. 11: 3234. https://doi.org/10.3390/w12113234