Simulation of Soil Water Evaporation during Freeze–Thaw Periods under Different Straw Mulch Thickness Conditions


1
College of Water Resources and Engineering, Taiyuan University of Technology, Taiyuan 030024, China
2
Taigu Water Balance Experimental Field, Bureau of Hydrology and Water Resources Survey of Shanxi Province, Taigu 030800, China
*
Author to whom correspondence should be addressed.
Water 2020, 12(7), 2003; https://doi.org/10.3390/w12072003
Submission received: 29 May 2020
/
Revised: 11 July 2020
/
Accepted: 13 July 2020
/
Published: 15 July 2020
(This article belongs to the Section Water Resources Management, Policy and Governance)
Abstract
:Straw mulching is an effective agricultural technology to reduce soil water loss in arid and semi-arid areas. Herein, the soil temperature and soil water content of bare land (LD) and 5 cm (JG5), 10 cm (JG10), 15 cm (JG15), 20 cm (JG20) and 30 cm (JG30) straw mulch thicknesses were measured through field experiments performed to assess the soil water evaporation using the simultaneous heat and water model during a freeze–thaw period. The results showed that the inhibiting effect of straw mulching on soil water evaporation during the freeze-thaw period reached 24–56.7%, and straw mulch reduced the range of daily soil water evaporation by 2.02–2.48 mm, the effects of random factors on the daily soil water evaporation were significantly decreased. The highest soil water evaporation rate occurs during the unstable freezing stage, and the lowest occurs during the stable freezing stage. When the straw mulch thickness exceeded 10 cm, the effect of increasing straw mulch thickness on daily soil water evaporation was reduced. The straw mulch layer could not completely inhibit the effect of the external environment on soil water evaporation even when the straw mulch thickness was increased to 30 cm. This research results can provide a basis for the scientific evaluation and prevention of soil water evaporation in arid and semi-arid areas.
1. Introduction
Water resource serves as the essential natural factor which can limit the expansion and development of agriculture; soil water evaporation is vital in the balance of water resource in arid and semiarid areas [1,2]. It is estimated that the water loss caused by soil water evaporation may account for 50% or more of the total soil water in the normal growing season [3]. Hence, it is essential to estimate soil water evaporation accurately, detect the factors affecting soil water evaporation, and take measures to control soil water evaporation for the quantification of water availability and water resources management in arid and semi-arid areas. Generally, soil properties [4], groundwater level [5,6], irrigation methods [7,8], and meteorological conditions [9,10] can affect soil water evaporation. Soil mulching is the proven techniques for managing water resources in arid and semiarid areas to reduce soil water evaporation, and the effect of various soil mulches on controlling soil water evaporation has been recorded in several studies [11,12,13,14,15].
Owing to its accessibility, biodegradability, and environmental friendliness [16], straw mulching is a significant method used to decrease soil water evaporation [17], conserve water and alleviate drought [18,19], increase production and income [20,21,22], and improve the ecological environment [23,24] in agricultural production in arid and semiarid areas. Straw mulch reduced soil water evaporation by 35 mm and 40 mm during crop growing seasons in relatively high and low rainfall years [25]. Rice paddies added straw mulching in the first 60 days could reduce soil water evaporation and improve water productivity [26]. Wheat straw mulching made soil water lost from 30.2% to 24.5% during the maize-growing season [27]. However, most recent studies on soil water evaporation control through straw mulching were conducted during nonfreezing periods. The water and heat transfers of soil are more complicated during the freeze–thaw period than during the nonfreezing period, which modifies the soil water evaporation process. Flerchinger et al. [28] studied the effects of crop stover cover and architecture on soil water and heat transport, soil water evaporation, and freezing depth. Fu et al. [29] investigated soil water evaporation of the thawing period under three straw mulch quantities. Chen et al. [30] measured soil water evaporation under three straw mulch modes and determined the factors which can influence the soil water evaporation at different freeze–thaw stages. However, due to the cold winter climate, soil evaporates as water vapor after the ground is frozen, and the quantity of soil water evaporation is small, which makes it impossible to observe the daily soil water evaporation continually. Additionally, field experiments performed in winter are easily affected by extreme weather, which may lead to inaccurate monitoring results.
Thus, some estimation methods are used to calculate the evaporation of frozen soil. Surface energy balance and empirical formulas such as the Penman–Monteith equation [31] can be used to calculate the evaporation of bare and cropped land in winter [32]. Additionally, some simulation software, such as Hydrus-1D [33], SHAW model [34], and CoupModel [35], have been used in recent years to simulate soil water evaporation, water, heat, and solute transport in cold regions. The SHAW model is one of the most powerful and comprehensive models on the analysis of freeze–thaw soil. The SHAW model can simulate heat and water movement to examine the effects of residues layer on soil freezing, soil temperature, soil water, and soil water evaporation [36,37,38,39,40,41]. Li et al. [42] studied soil water and heat transport in winter through the combination of the RZ-SHAW model and the SHAW model. Flerchinger and Saxton [43,44] described and calibrated evaporation and convective water vapor transport in the residual layer. Therefore, the SHAW model is suitable for simulating soil water evaporation processes under different straw mulching methods. The study results can provide theoretical and practical bases for the efficient utilization of water resources.
The purposes of this study are to: (1) determine soil water evaporation under different straw mulch thicknesses during freeze–thaw periods, (2) quantify and investigate daily soil water evaporation and cumulative soil water evaporation under different straw mulch thicknesses, and (3) reveal the effect of different straw mulch thickness on soil water evaporation in different stages.
2. Field Test Conditions
2.1. Experimental Site
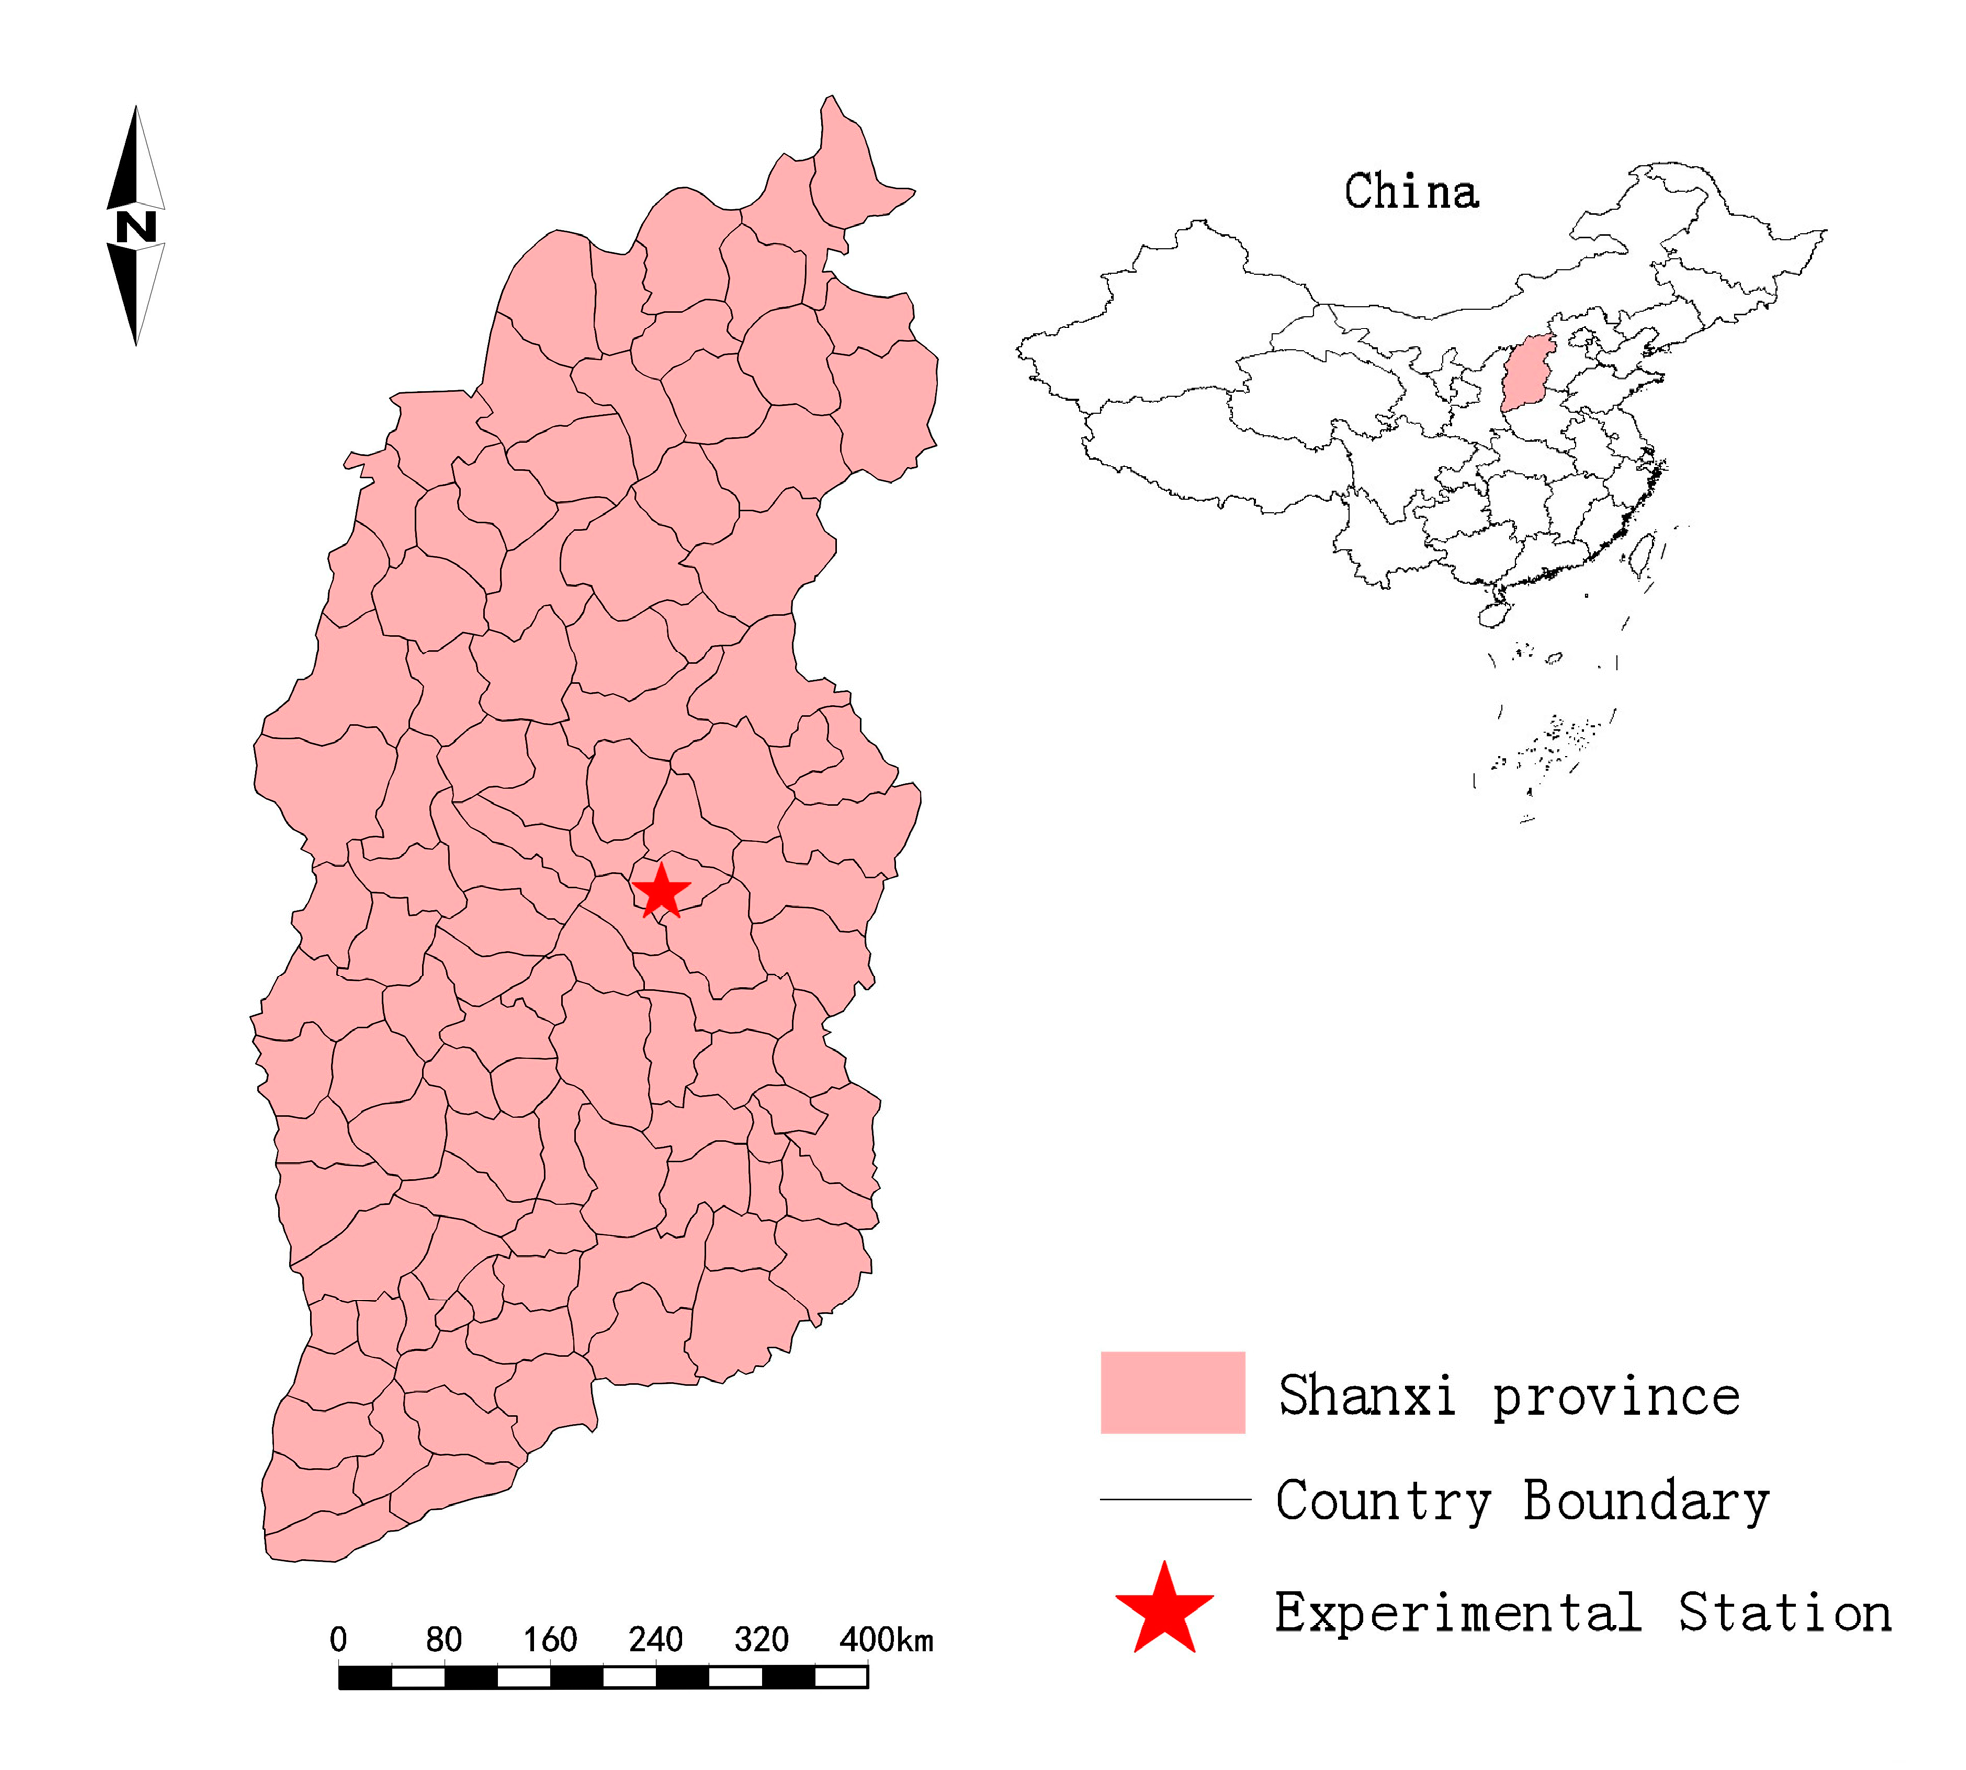
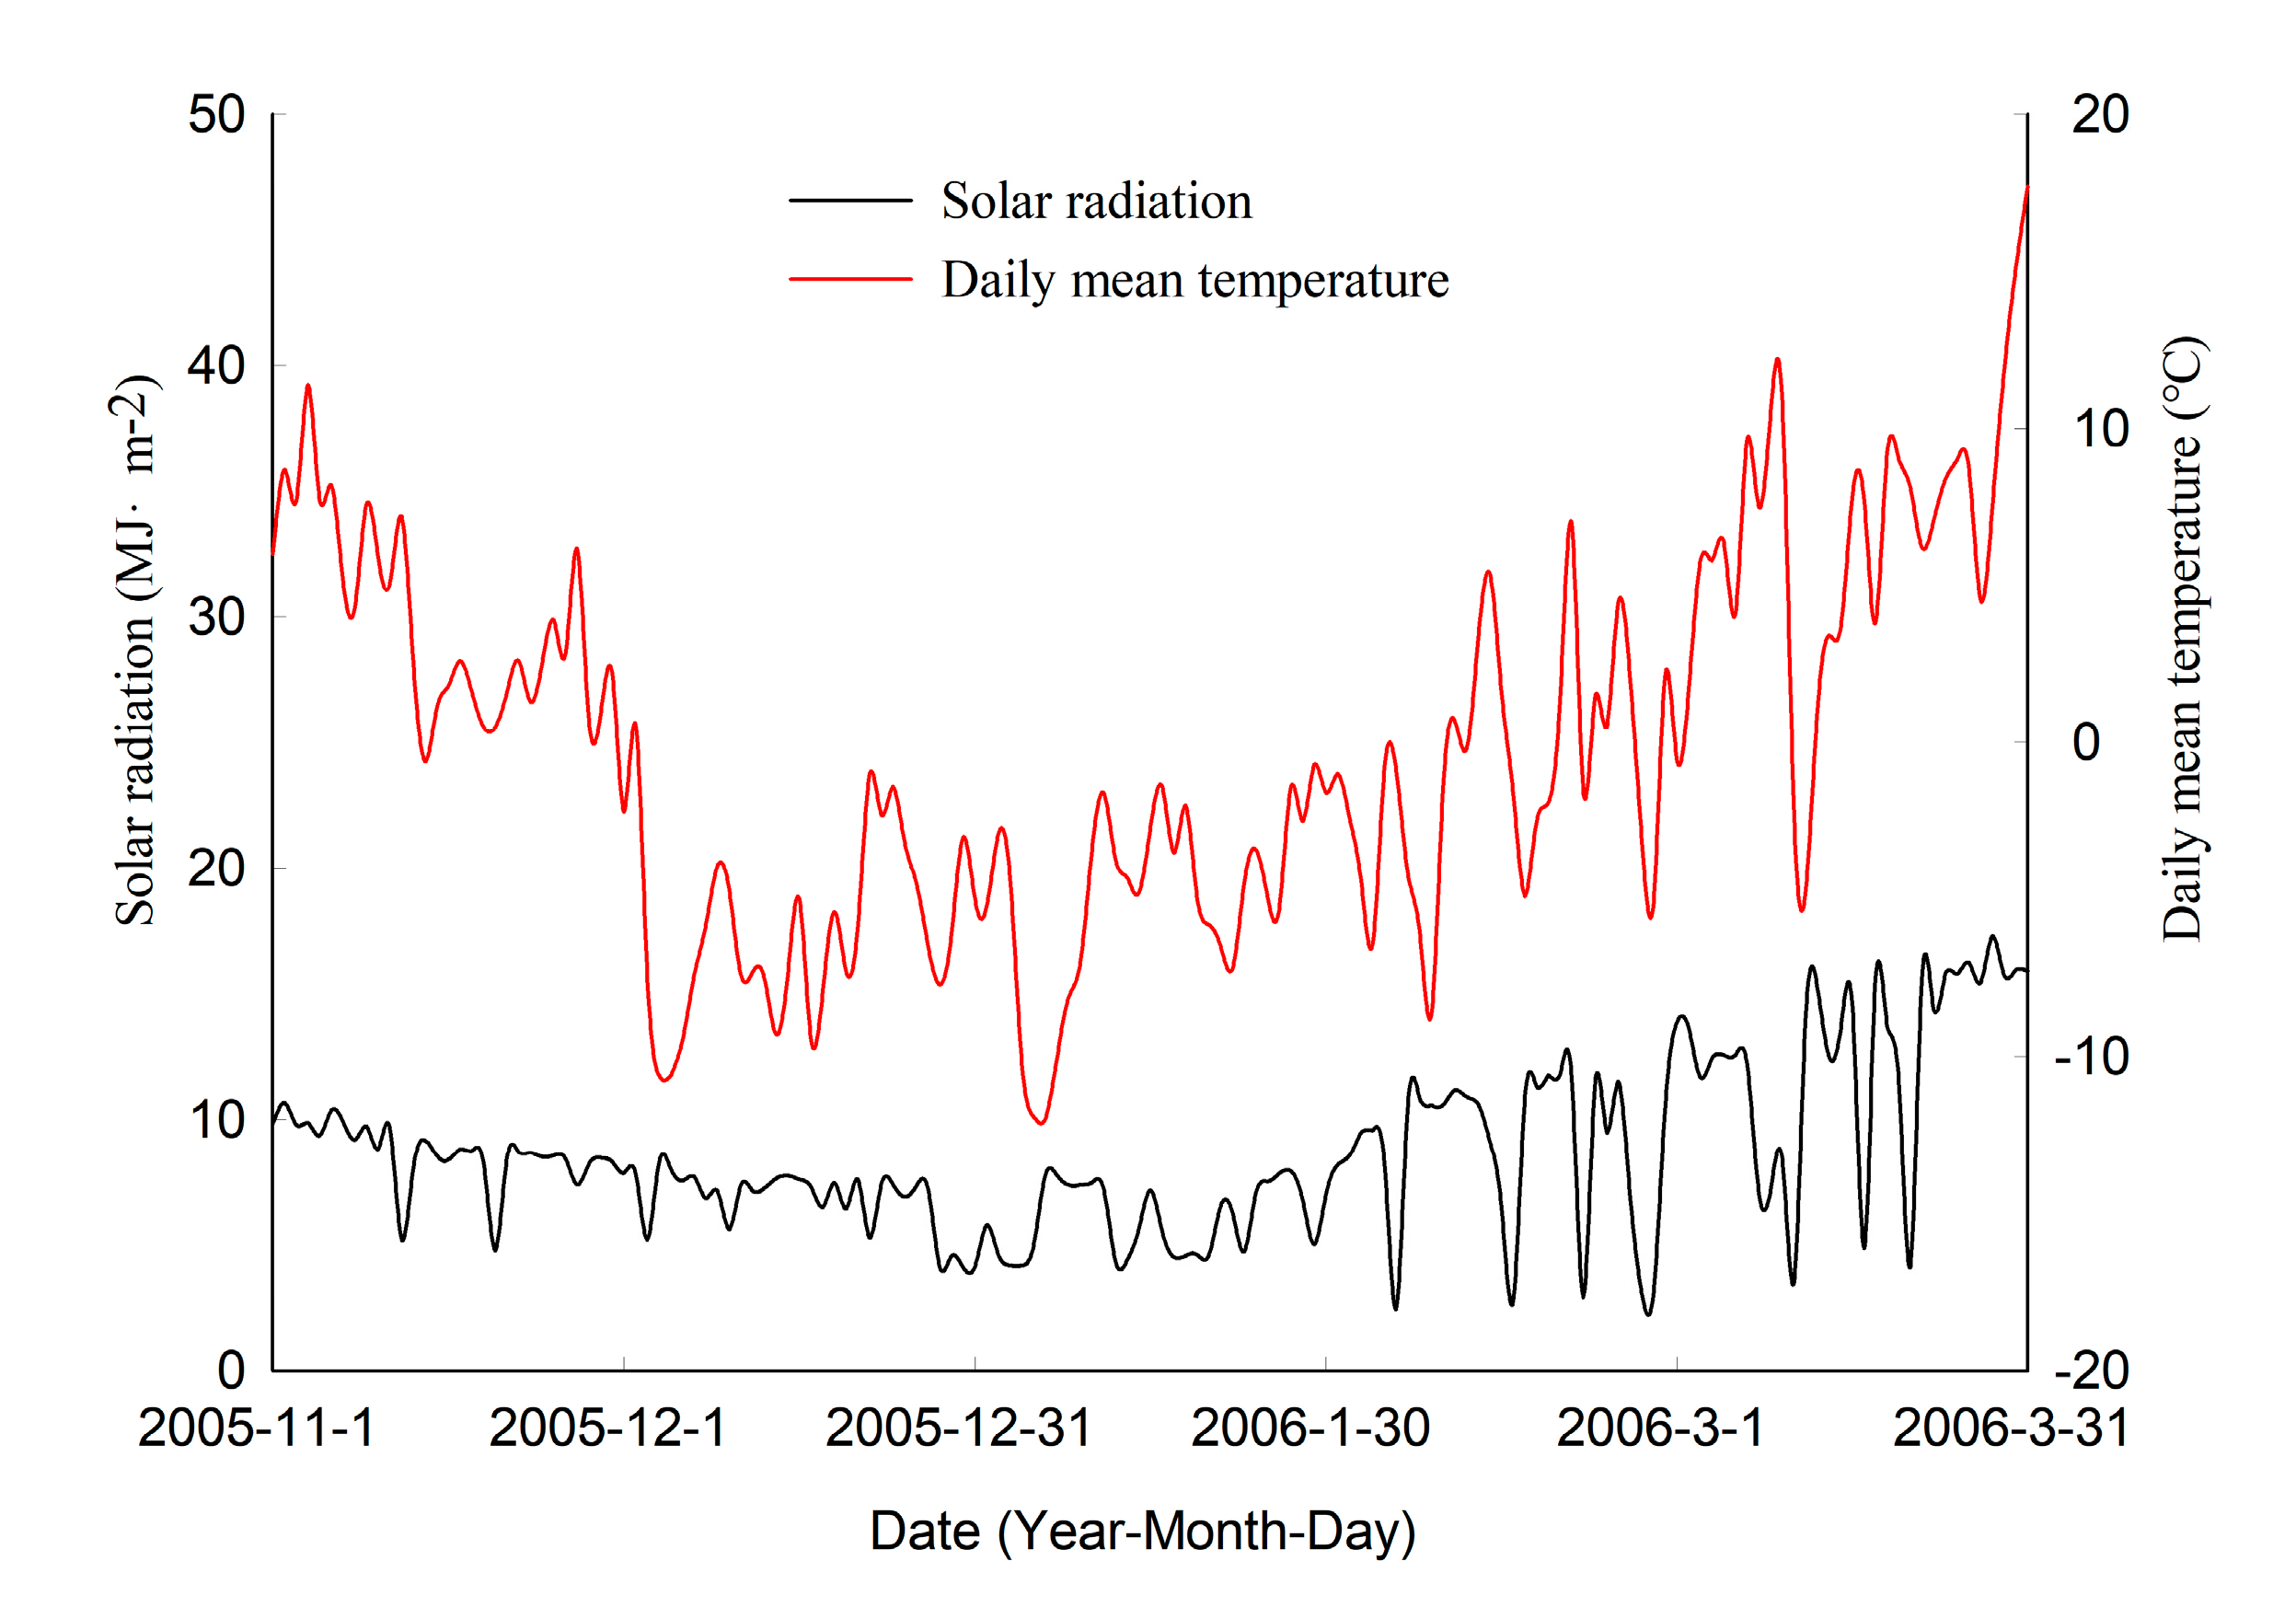
Field experiments were conducted at the Taigu Water Balance Experimental Station in (37°26′ N, 112°30′ E, Shanxi Province, China), as shown in Figure 1. The average altitude is 777.0 m [45]. The experimental field is in the continental semiarid climate zone. The annual average precipitation is 397.3 mm. The annual average wind speed is 1.8 m·s−1, and the annual average frost-free duration lasts for around 220 days. The variation characteristics of solar radiation and air temperature during the experiment (from 1 November 2005 to 31 March 2006) are shown in Figure 2. The total solar radiation was 1290.8 MJ·m−2, and the lowest value of 189.3 MJ·m−2 was observed in December. With an average air temperature of −4.9 °C, January was the coldest month, and the lowest temperature (−21.0 °C) was recorded on 7 January. During the experiment period, the average wind speed was 2.2 m·s−1, and the maximum was 9.8 m·s−1; the average relative humidity was 51%, and the maximum was 81%; there were five times of precipitation, and the total precipitation was 76 mm.
2.2. Measurements
The size of the test plots was 3 m × 3 m, and the test plots were mulched with six different corn straw thicknesses: 0 cm, i.e., the bare land (LD), 5 cm (JG5), 10 cm (JG10), 15 cm (JG15), 20 cm (JG20) and 30 cm (JG30). Correspondingly, the straw coverage weights were 0, 2100, 4300, 6500, 8600 and 12,900 kg·hm−2, respectively. Each treatment was replicated thrice to improve the accuracy of the experiments. The soil type of the experimental field was loam, and the main parameters are shown in Table 1.
The soil temperature and soil water content were monitored at 8:00–9:00 a.m. synchronously at intervals of five days from 1 November 2005 to 31 March 2006. The soil water content was measured by sampling with drills, drying in an oven, and weighing. The soil temperature was measured by thermistors, which buried in the test field plots at the depths of 0, 5, 10, 15, 20, 40 and 80 cm. The calculation method for soil temperature is shown as below:
where R25 is the resistance value measured at 25 °C; Rx is the measured resistance value; T is the soil temperature.
On November 1, the soil water content in the tillage layer (0–20 cm) was 15.3%, and the soil temperature at 5 cm depth was 0.1 °C. All the plots were irrigated at 750 m3·hm−2 on November 2. Corn straw of 3–5 cm long (3.4% water content) was evenly laid on the surface of different field plots on the next day.
3. Materials and Methods
3.1. SHAW Model Description
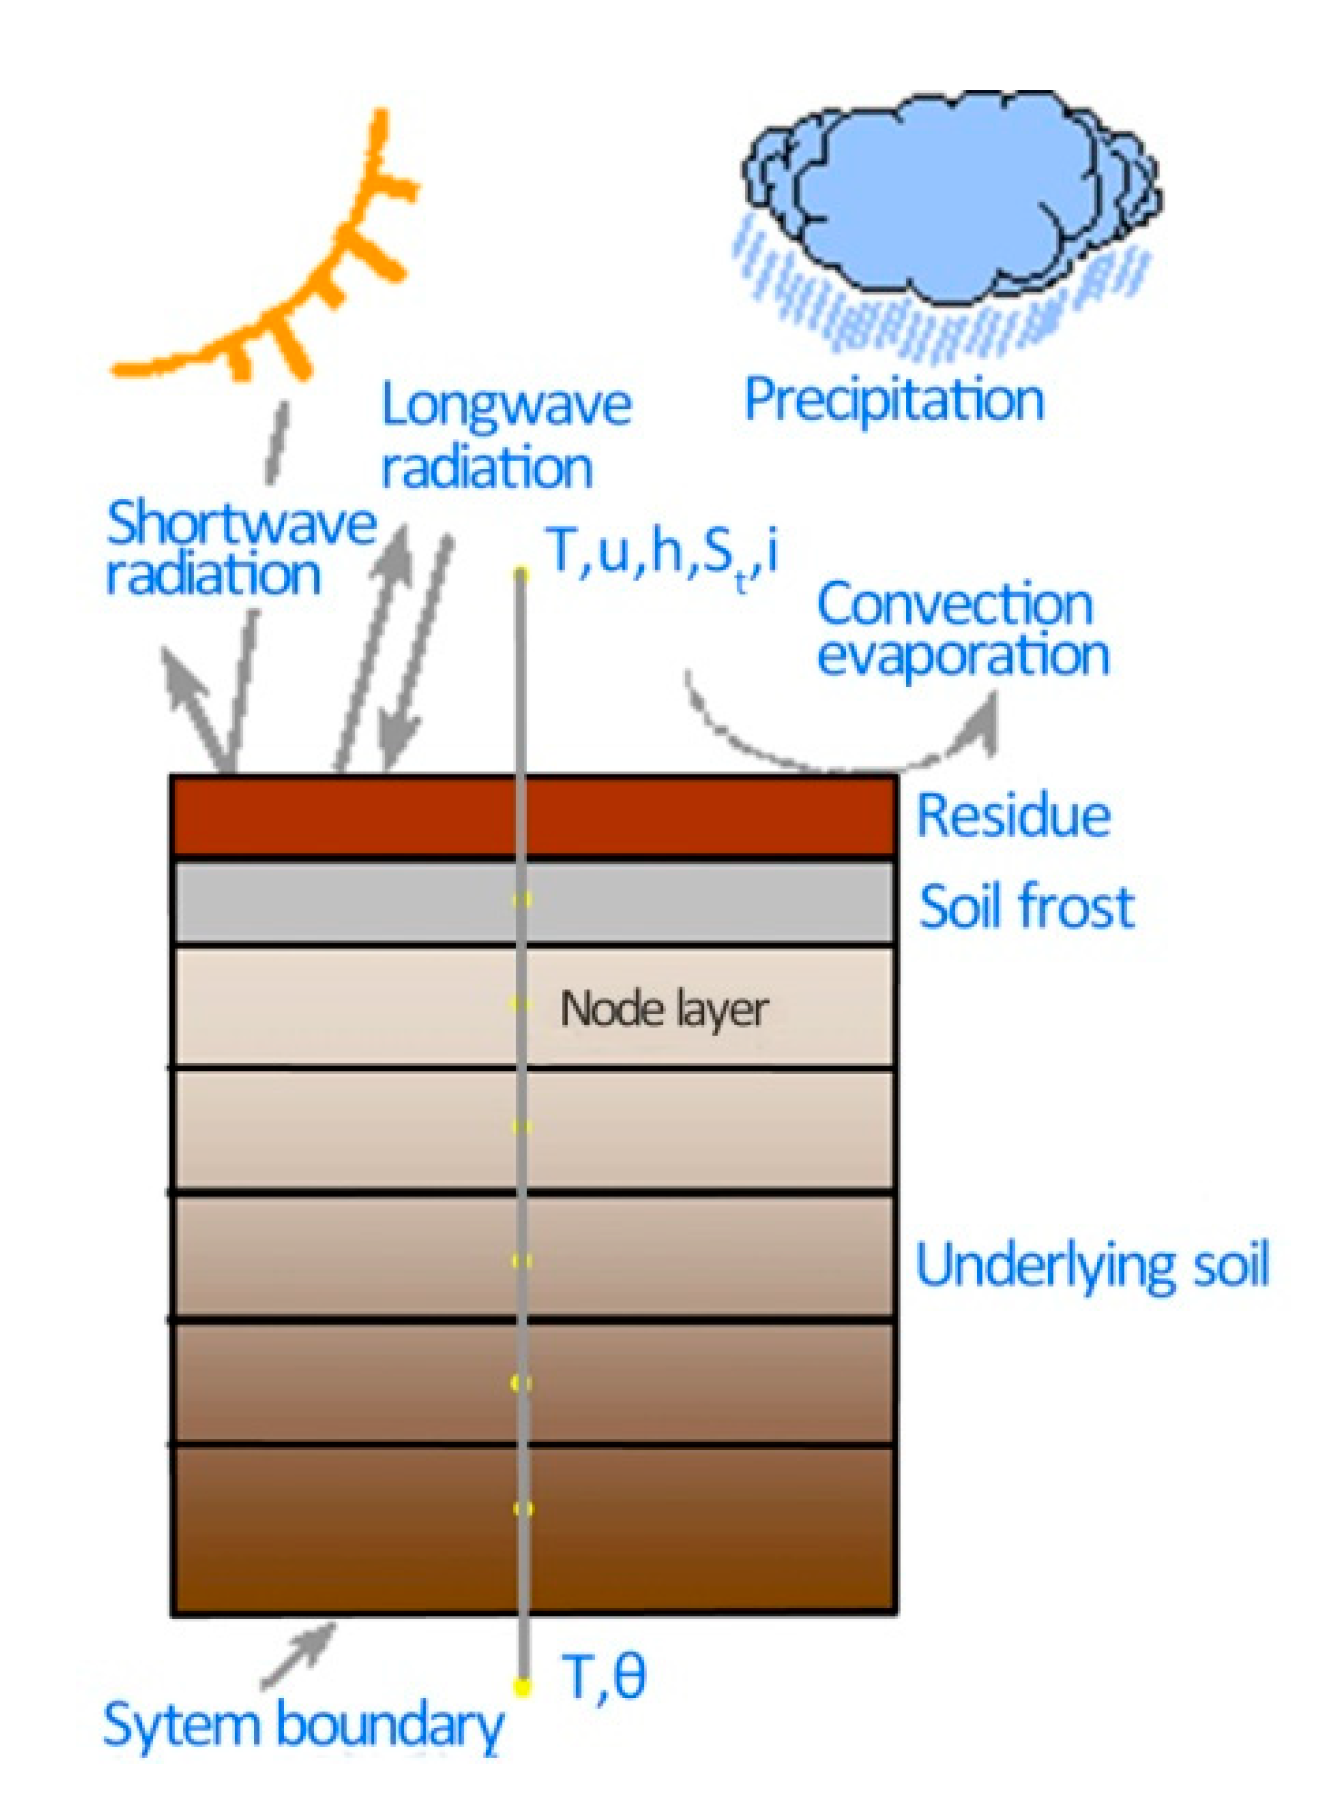
The Simultaneous Heat and Water (SHAW) model was established by Flerchinger and Saxton in 1989 to describe the detailed physical processes of coupled water, heat, and salt transport in a snow-residue-soil system [43,44]. Subsequently, the model was developed to make it for various applications that mainly include the ability to address the interaction effect of the multi-species plant canopy, snow, and residue on soil freezing [36,37], soil water, heat, and salt dynamics [42,46], surface energy, and water balance [47,48]. In this paper, the SHAW model simulated the water transport, heat transport, and soil water evaporation in a 1-D soil layer from the residue to the simulated depth. The model integrated the detailed physical quantities of residue and soil into a complete system (as shown Figure 3).
The model is sufficiently flexible to represent various conditions, and the system may or may not include vegetation canopy, snow, or residue layers. The meteorological conditions at the upper boundary, and the soil moisture and temperature conditions at the lower boundary, decide the water and heat fluxes. Liquid water, water vapor, and heat flux between the layers are calculated in hour steps and balanced with changing conditions within the layers. The flux equations written in the implicit finite-difference form are solved iteratively [40]. The SHAW model can be employed to selectively provide the output water balance, surface energy balance, soil water evaporation, and soil frost depth as well as the soil temperature, content of water and ice in the soil.
3.2. Model Evaluation Methods
Root mean square error (RMSE, also known as standard error) may quantify the matching degree between simulated value and measured value:
where yi is the measured value, ŷi is the simulated value, and n is the number of measured samples.
3.3. Statistical Analyses Methods
The experiments compute the range R, variation coefficient Cv, and average ӯ of the daily soil water evaporation, and Fisher’s least significant difference (LSD) test finished mean comparison of daily soil water evaporation [21]. Among all coefficients, the range R indicates the variation of daily soil water evaporation under varying processing measures, while variation coefficient Cv reflects the dispersion of variables excluding the influence of the variable average level. The experiment cites Cv to assess the dispersion degree of daily soil water evaporation amount during the freeze-thaw period:
4. Results
4.1. Model Evaluation Result
The SHAW model introduces few parameters including average particle size, bulk density, particle composition, and percent organic matter to first estimated soil hydraulic parameters like saturated water content, saturated conductivity, air entry potential, and pore size index [38]. The soil hydraulic parameters were calibrated by matching the simulated value with measured values. The calibrated soil hydraulic parameters are shown in Table 2.
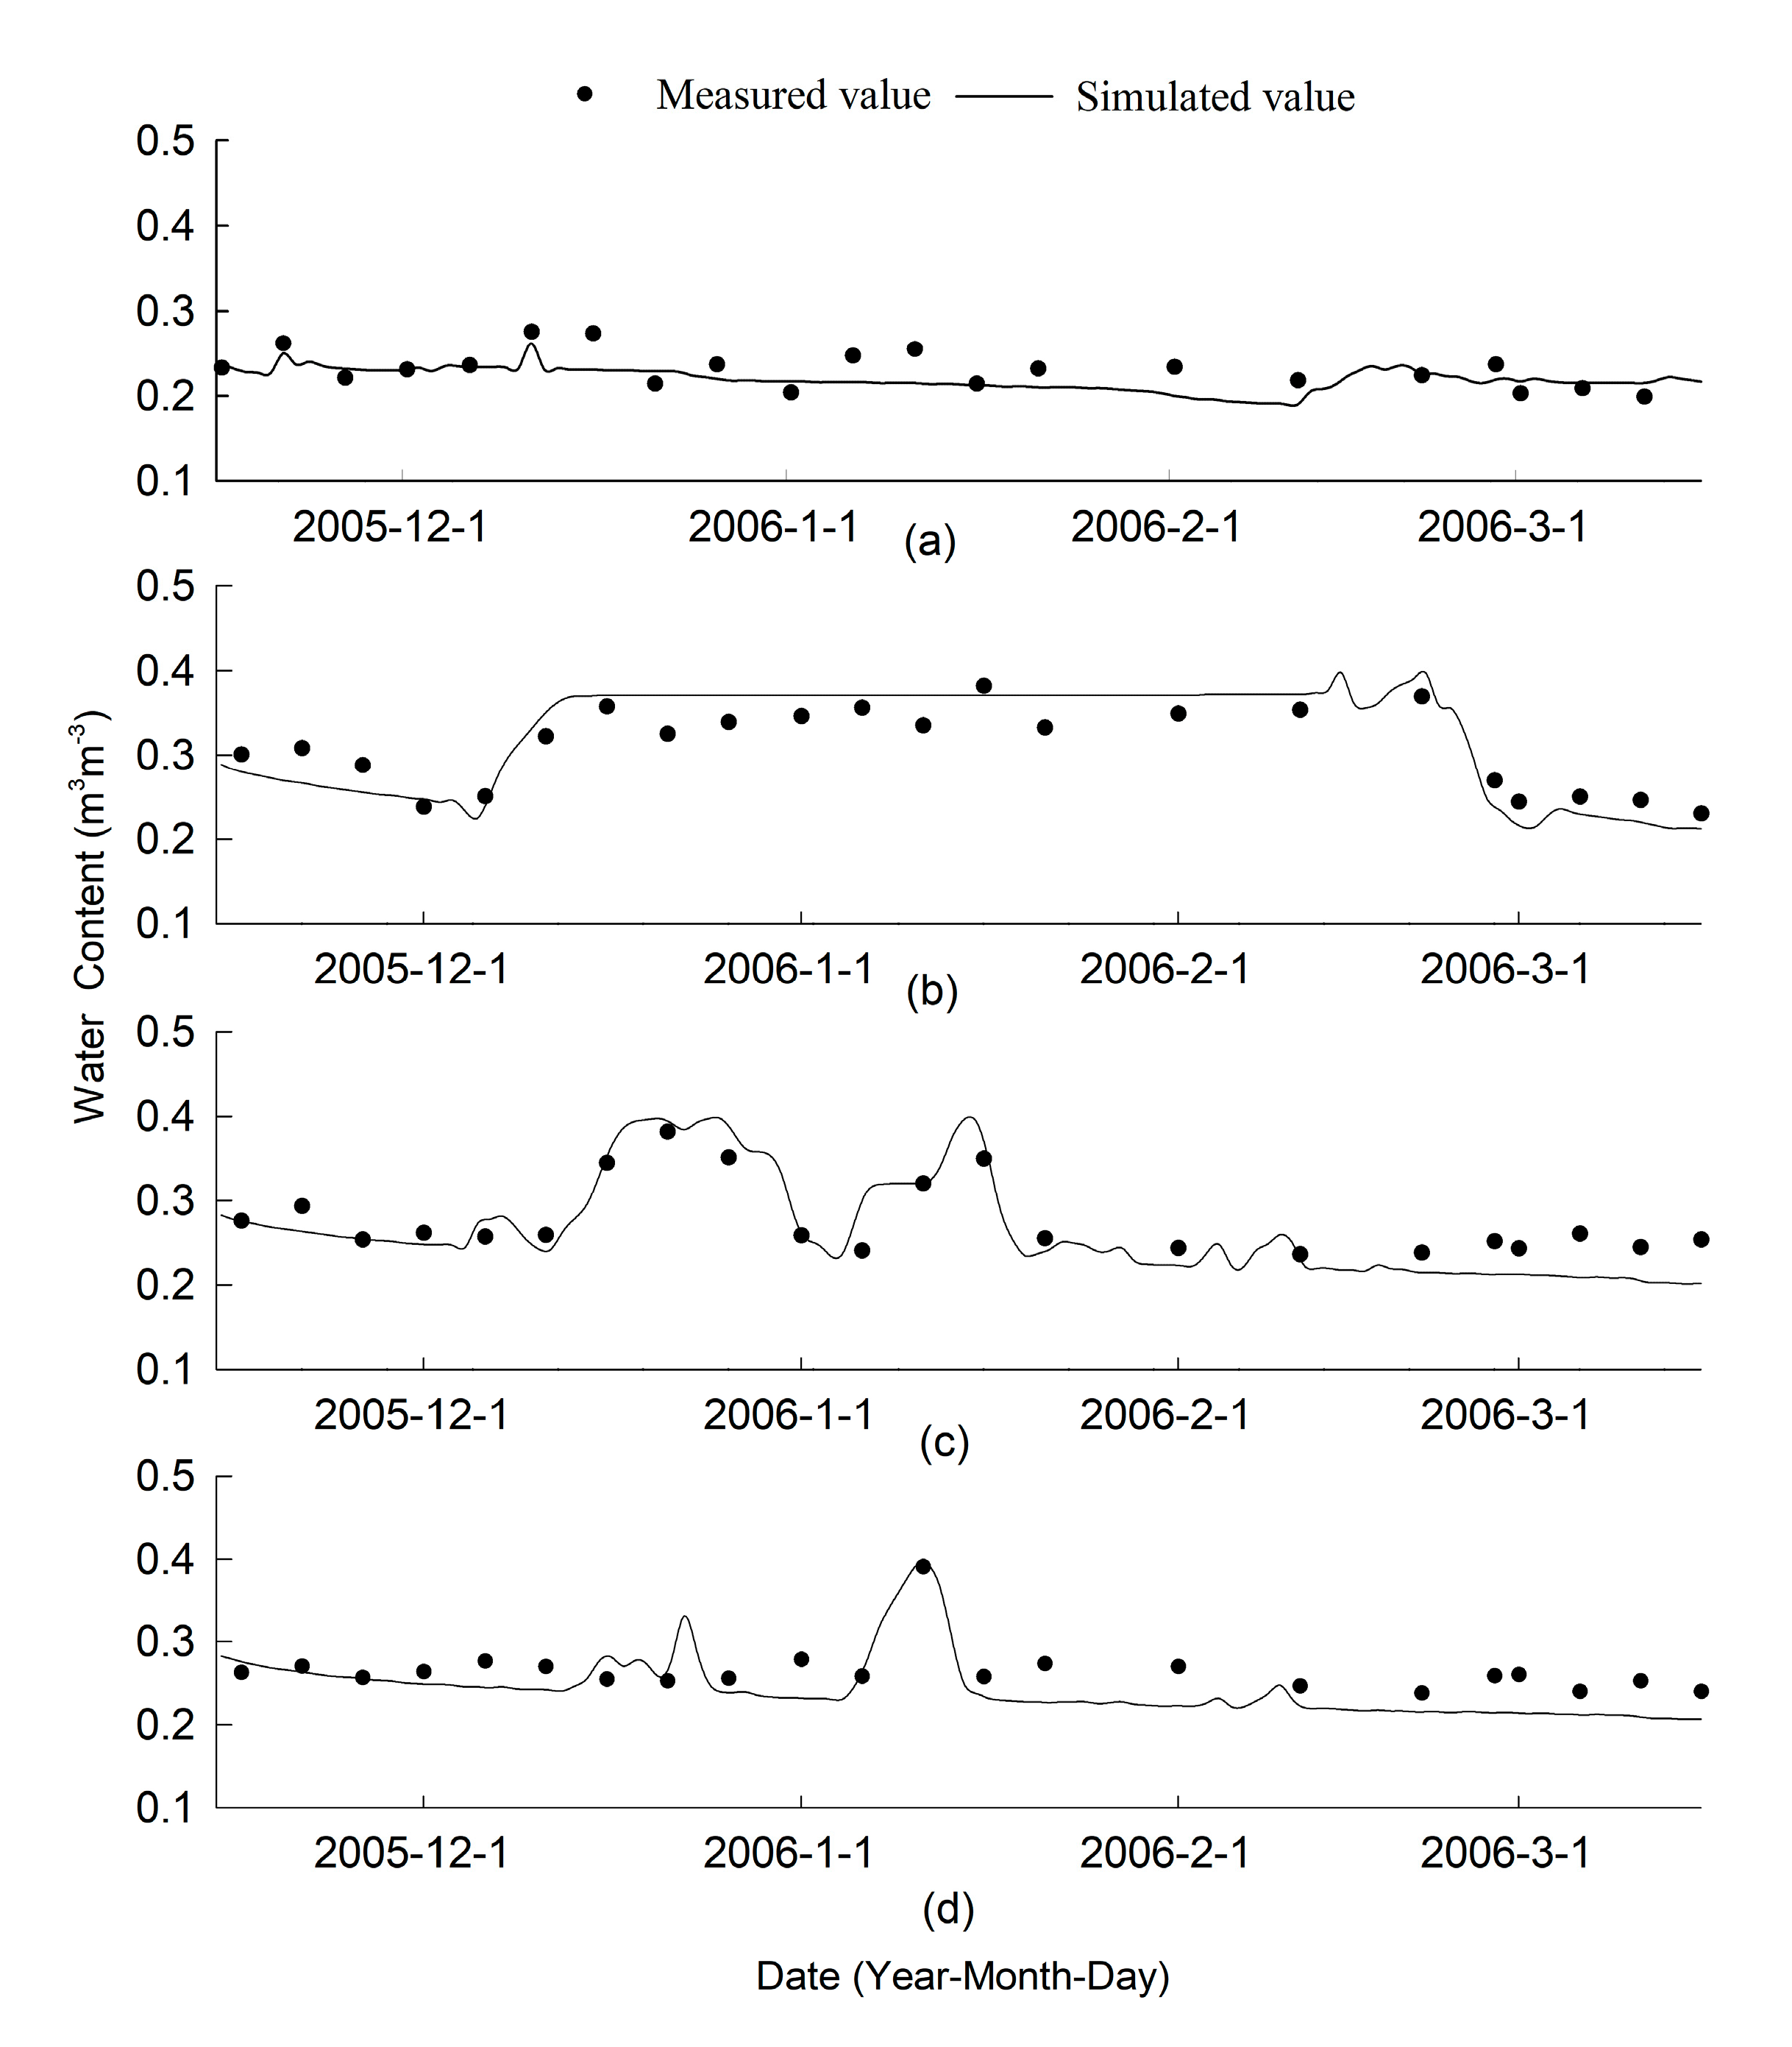
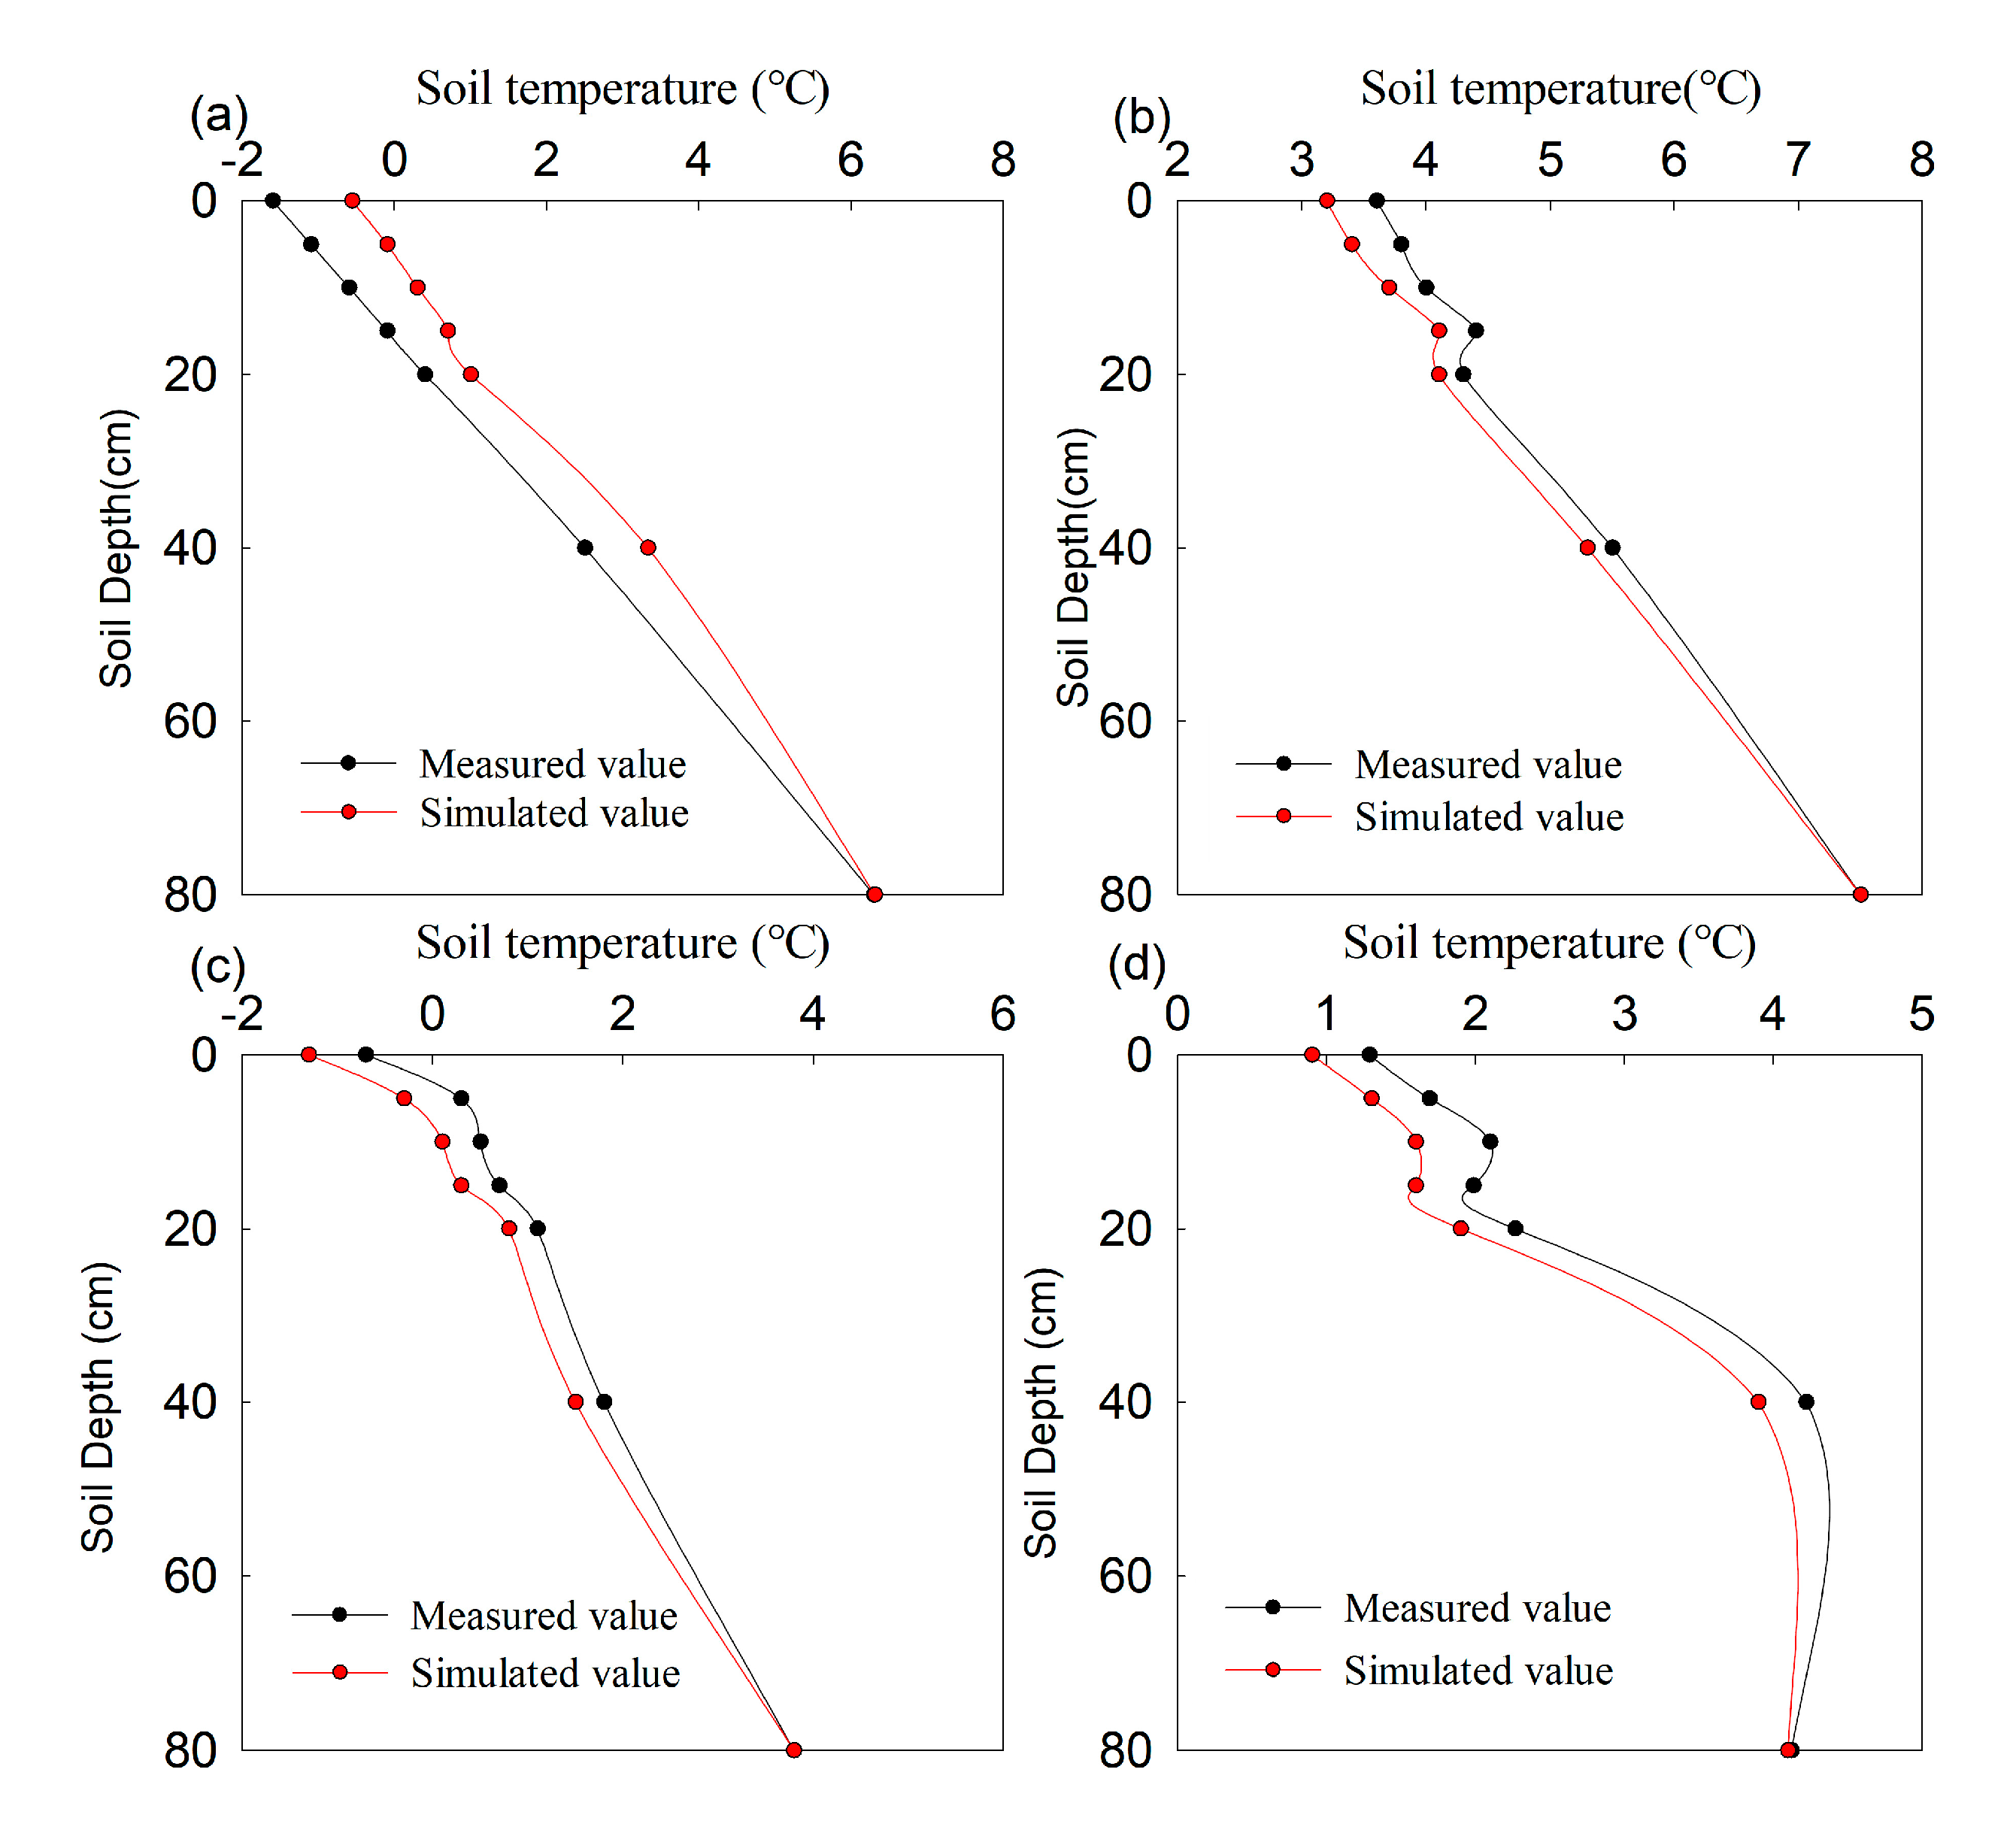
As shown in Figure 4 and Figure 5, the results of simulated are quite approximate to that measured practically in respect of soil temperature and soil water content.
The RMSE between simulated and measured soil temperature is 1.07–2.00 °C, while that of soil water content is 0.003–0.08 m3·m−3. The results suggest a good match between simulated value and measured value, and the rationality of model parameters.
4.2. Soil Freezing and Thawing Processes
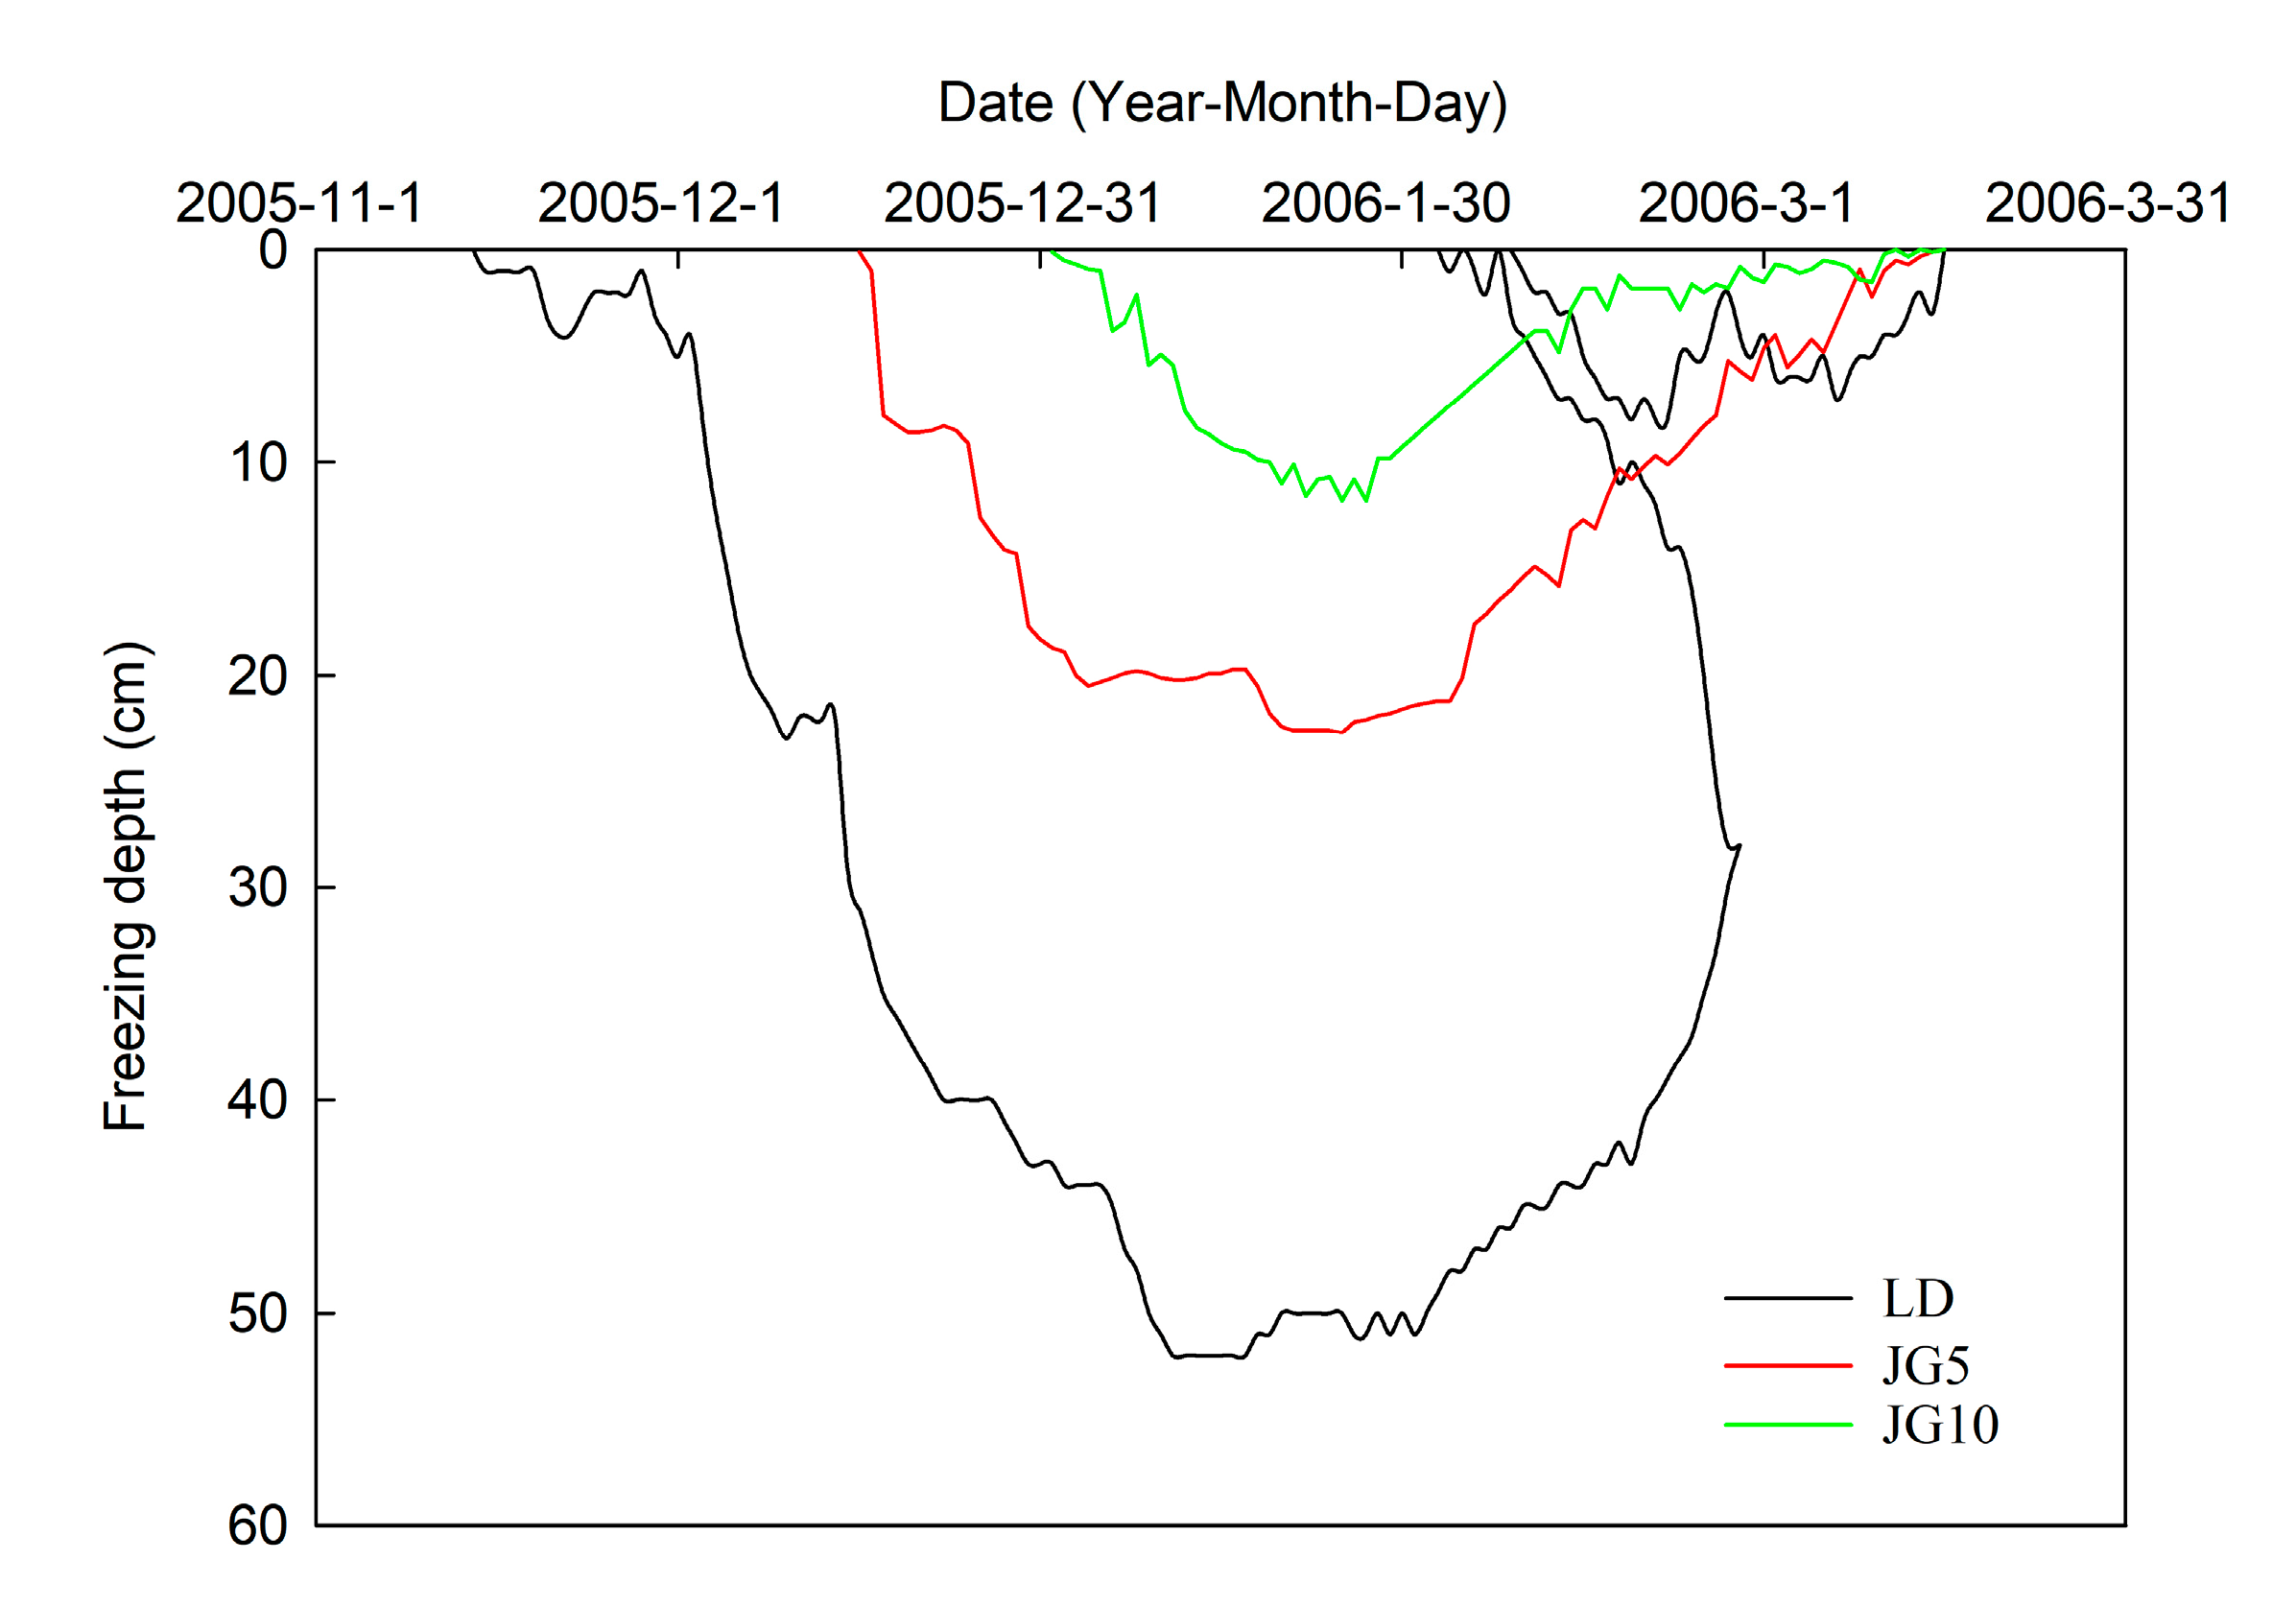
According to the freezing and thawing features of LD in the experiment, the freeze-thaw period could be divided into three stages, i.e., the unstable freezing stage (P1), stable freezing stage (P2) and thawing stage (P3). On 14 November 2005, the soil entered the unstable freezing stage (P1), and the soil surface of LD began to freeze. The daily average air temperature was still above 0 °C, and the soil surface thawed during the day but froze at night; soil freezing did not occur on the soil surface of LD for straw mulching.
The soil entered the stable freezing stage (P2) on 3 December 2005. The air temperature and solar radiation decreased rapidly; the depth of the soil frozen layer on the LD continued to increase. The maximum freezing rate of this stage was 3.0 cm day−1, and the maximum freezing depth was 52 cm (17 January). The initial soil freezing time for straw mulching lagged, and the depth of the frozen soil significantly decreased with the increase in straw mulch thickness. The maximum freezing depth of the soil in JD5 and JD10 appeared 15 days later than the LD; the other plots did not freeze (show in Table 3).
The soil of LD later entered the thawing stage (P3) on 2 February 2006. The solar radiation and air temperature during this stage began to increase; the thawing of the frozen layer occurred in two directions: downward thawing on the frozen layer surface, and upward thawing at the bottom. As the air temperature difference between day and night is very large, the soil surface thawed in the daytime, the soil surface frozen again in the evening, which resulted in the appearance of a double frozen layer in LD, as shown in Figure 6. However, this phenomenon did not occur in the straw mulching plots, and these plots were thawed slowly downward from the soil surface. All soil layers thawed totally by 16 March 2006.
4.3. Effect of Straw Mulching on Soil Water Evaporation during the Freeze–Thaw Period
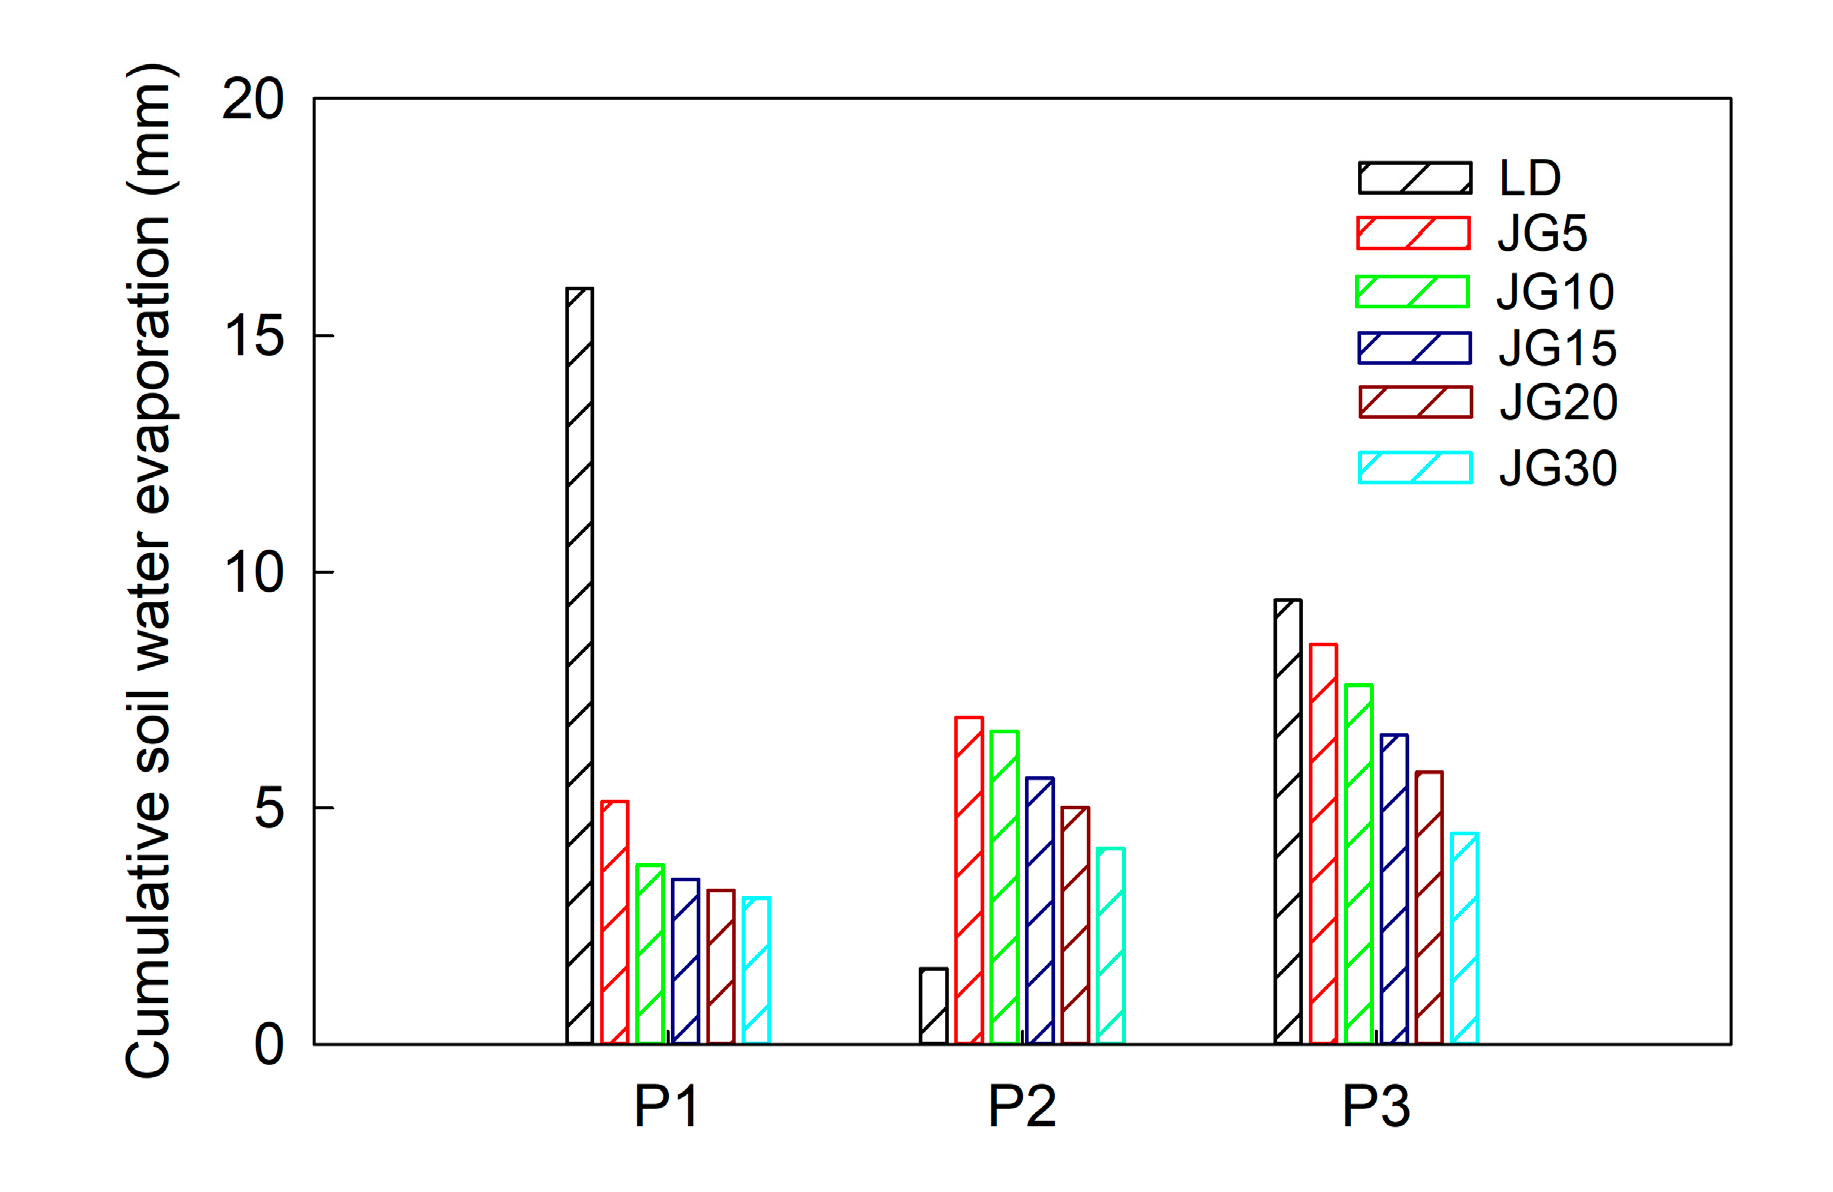
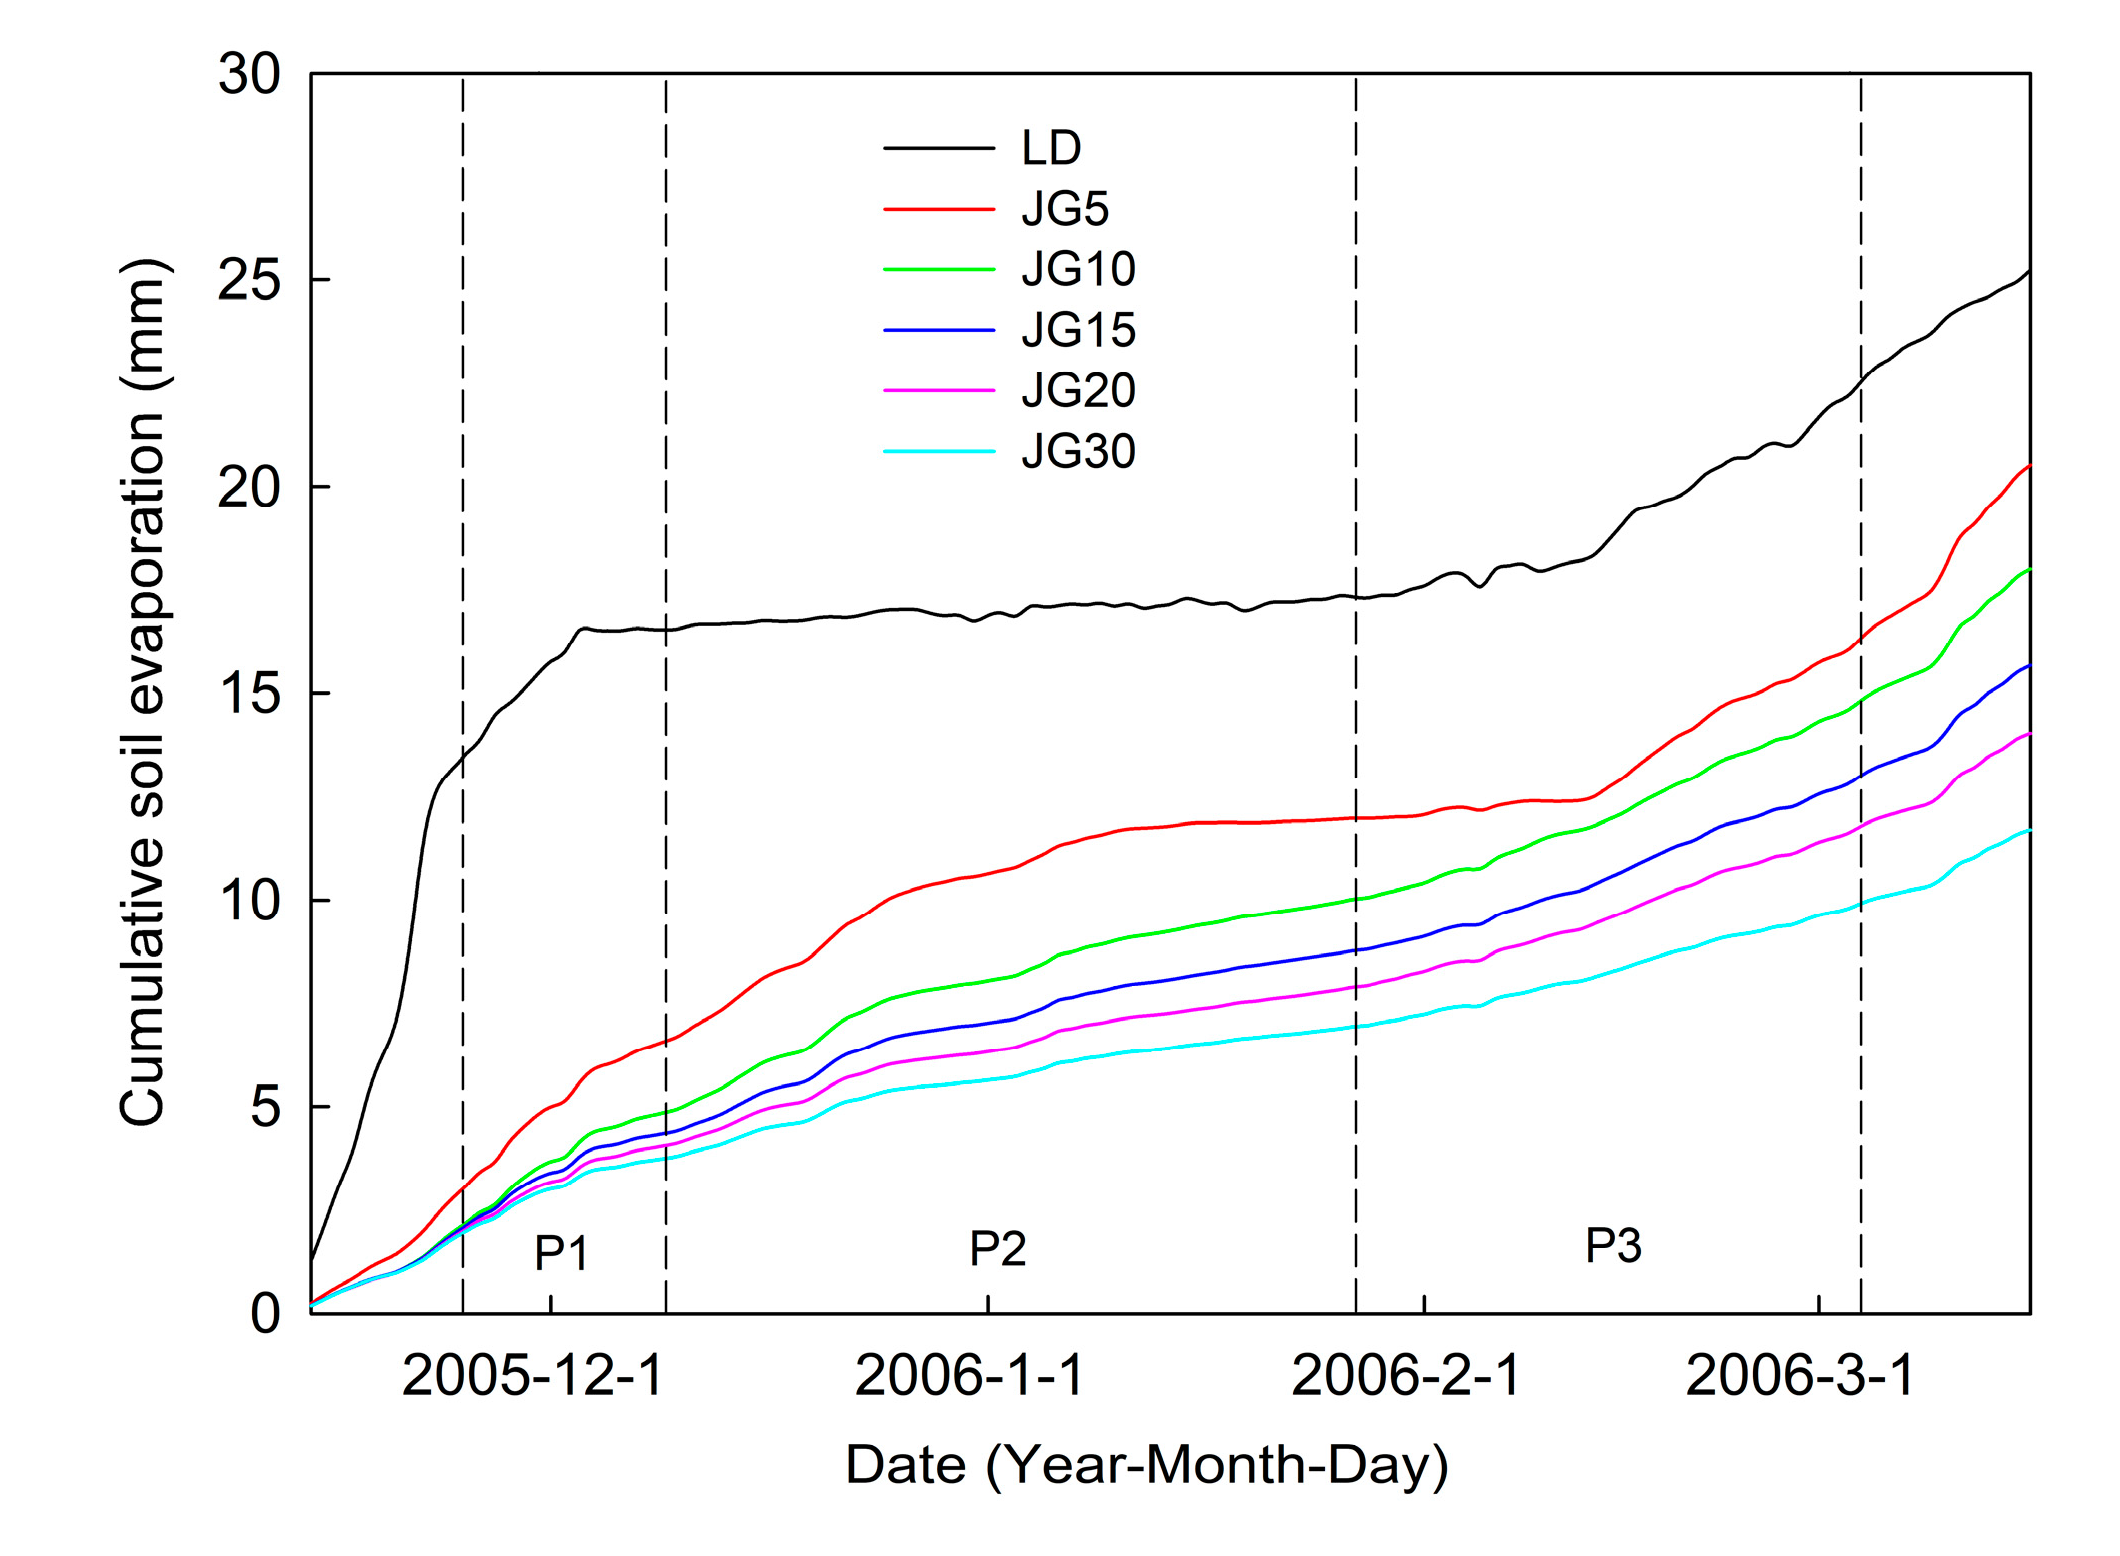
The straw mulch layer changed the water-heat exchange between the soil and the exterior surroundings, soil water evaporation under straw mulching decreased during the freeze-thaw period. The cumulative soil water evaporation of JG5, JG10, JG15, JG20 and JG30 was 20.52, 18.01, 15.67, 14.03 and 11.69 mm, indicating reductions of 24%, 33.30%, 41.96%, 48.04% and 56.70% compared to that of LD during the freeze–thaw period, respectively. The difference of cumulative soil water evaporation decreased with the increase of straw mulch thickness, which decreased by 4.71, 2.51, 2.34, 1.64 and 1.17 mm when the mulch thickness increased with interval of 5 cm, respectively.
The statistical analyses of daily soil water evaporation during the freeze-thaw period are shown in Table 4. Statistical analyses reveal the changing law of daily soil water evaporation amount under different straw mulch thicknesses during the freeze-thaw period. Straw mulching reduced the R of the daily soil water evaporation from 2.76 to 0.28, and Cv from 1.86 to 0.57, respectively (shown in Table 4), which indicates that the effects of random factors on the daily soil water evaporation were significantly reduced. These effects were more effective comparatively when the mulch thickness was increased. When the straw mulch thickness was less than 10 cm, for each additional 5 cm thickness, the R decrease from 0.192 to 1.072, and Cv decrease from 0.230 to 2.020, respectively. When the straw mulch thickness exceeded 10 cm, for each additional 5 cm thickness, the decreases in R and Cv were less than 0.1. As a result, when the straw mulch thickness exceeded 10 cm, the Cv and R of the daily soil water evaporation only varied slightly, and the effect of the increase in straw mulch on the daily soil water evaporation decreased. The effect of straw mulch on inhibiting soil evaporation may not be as significant as when straw was initially covered, with the increase of straw mulch thickness.
The results of Fisher’s LSD test at p < 0.05 shown that the significant difference still occurred in daily soil water evaporation under varying straw mulch thickness, the external environment still affected the soil water evaporation even if the thickness increased up to 30 cm.
4.4. Soil Water Evaporation Characteristics during the Three Freeze–Thaw Stages
4.4.1. Unstable Freezing Stage
Each plot was irrigated on 2 November 2005. The initial soil water content was higher at this stage, and the soil thermal conductivity improved with the increase in soil water content. Consequently, irrigation increased the energy exchange between the soil and the atmosphere, and then enhanced soil water evaporation. Cumulative soil water evaporation in LD was much higher than that under straw mulching, as shown in Figure 7. Due to the large soil water evaporation of LD in the early stage of P1, surface soil water content progressively decreased accompanied by the sharp fall of daily soil water evaporation in the later stage of P1.
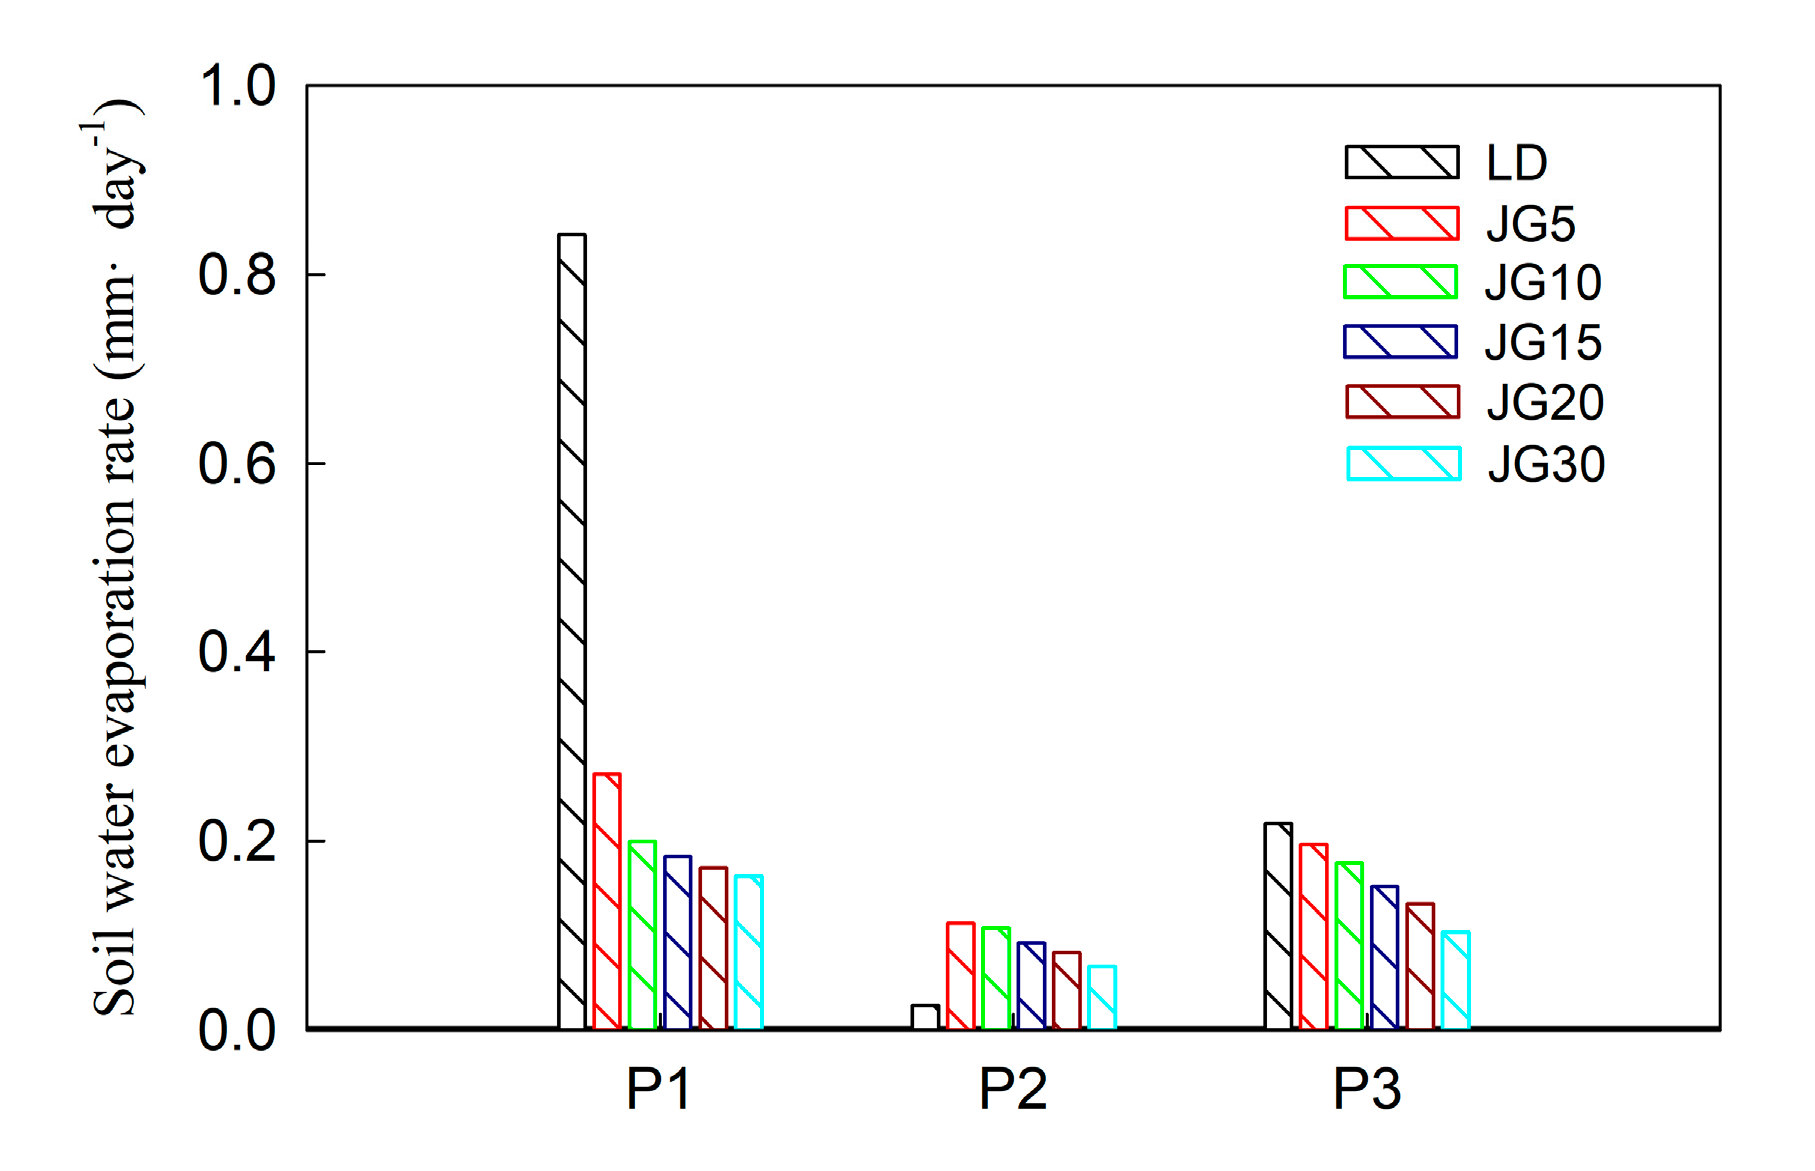
The soil water evaporation rate of each treatment plot was maximum in P1, as shown in Figure 8. The soil water evaporation rate of LD, JG5, JG10, JG15, JG20 and JG30 were 0.842, 0.271, 0.199, 0.184, 0.172 and 0.163 mm·day−1, respectively. The soil water evaporation rate of JG5, JG10, JG15, JG20 and JG30 were 32.2%, 23.6%, 21.9%, 20.4% and 19.4%, of the soil water evaporation rate in LD. The R of the daily soil water evaporation for the straw mulching decreased from 2.228 to 0.17 and Cv from 0.589 to 0.048, respectively. Straw mulching had the most significant effect on soil water evaporation at P1. With the increase of straw mulch thickness, the soil water evaporation rate decreased by 0.571, 0.072, 0.015, 0.012 and 0.009 mm·day−1; the R of daily soil water evaporation decreased by 1.970, 0.070, 0.030, 0.030 and 0.010; the Cv of daily soil water evaporation decreased by 0.505, 0.015, 0.009, 0.008 and 0.004. The change in soil water evaporation decreased when the straw mulch thickness increases.
When the frozen layer appeared on the soil surface, the water in the lower part of the soil layer moved upward, owing to the decrease in the soil water potential of the surface [49]. During P1, only LD and JG5 appeared in extremely thin frozen layers, and the soil water content at a depth of 5–10 cm on the LD increased by approximately 1%. Therefore, water content in soil profile changed little and had a negligible effect on soil water evaporation.
4.4.2. Stable Freezing Stage
December and January were the months with the least solar radiation and lowest average air temperature, and the effect on soil water evaporation decreased. Owing to the high rate of soil water evaporation during the P1 on LD, the soil water evaporation of LD only occurred as gasification of the surface solid water at low temperatures. Therefore, the soil water evaporation rate of LD at P2 was significantly lower than that of straw mulching (shown in Figure 8), and it is only 25.1–38.7% of the soil water evaporation under straw mulching. The soil water evaporation rates of JG5, JG10, JG15, JG20, and JG30 were 0.113, 0.109, 0.092, 0.082 and 0.068 mm·day−1, respectively (shown in Table 4). With the increase in straw mulch thickness, the soil water evaporation rate decreased by 0.004, 0.017, 0.010 and 0.014 mm·day−1; as the soil water evaporation rate decreased uniformly with the increase in straw mulch thickness, straw mulch thickness was the main factor influencing soil water evaporation at P2, and the effect of external factors on the soil water evaporation was minimized. Meanwhile, the soil water evaporation rate at P2 was the least, both for LD and JG. The soil water evaporation rate during this stage under straw mulching was from 41.7% to 65.4% of the other two stages. The R of the daily soil water evaporation decreased by 0.130, 0.040, 0.030, and 0.040, and the Cv decreased by 0.032, 0.010, 0.008, and 0.008. Although the change in soil water evaporation continued to decrease, the reduction was not as significant as in those of the other stages.
4.4.3. Thawing Stage
When the air temperature and solar radiation increased, the surface frozen layer began to thaw which in turn increased the soil water evaporation rate of LD. The soil water evaporation rates of JG5, JG10, JG15, JG20, and JG30 were 0.197, 0.177, 0.152, 0.134 and 0.104 mm·day−1, respectively (shown in Table 4), indicating reductions of 10%, 19.15%, 30.32%, 38.72% and 52.55%, respectively, compared with the LD. Hence, the effect of straw mulching on soil water evaporation was significant. The decrease of soil water evaporation rate from LD to JG5 and from JG5 to JG10 was more uniform, with decreases of 0.022 and 0.02 mm·day−1, respectively. When the straw mulch thickness exceeded 10 cm, the change in soil water evaporation rate was similar to that during P1, and the soil water evaporation rate decreased by 0.024, 0.018 and 0.015 mm·day−1, respectively, with increasing straw mulch thickness interval of 5 cm.
The Cv and R of the daily soil water evaporation for straw mulching at P3 were the highest among the three stages (shown in Table 4). Because of the low water content on the soil surface of LD, the Cv and R of the LD were not the highest among the three stages. At the later stage of P3, the daily soil water evaporation for straw mulching increased because of the increase of solar radiation and air temperature (shown in Figure 9). However, this increase was not observed on LD with low surface water content.
5. Discussion
The effect of straw mulching on the reduction of soil water evaporation was significant during the freeze–thaw period, similar to the effect during the non-freezing period [26,27]. Average daily soil water evaporation under straw mulching was reduced by 16–37% than that under non-mulching conditions during the non-freezing period [50]. The straw mulching decreased the soil water evaporation during crop growth season by 35–40 mm [25]. The relative efficiency of straw mulch treatments on soil water evaporation control was consistent with other mulched materials. The effect of straw mulch on soil water evaporation was significant in the unstable freezing stage, while that was not obvious in the stable freezing stage [30]. Other mulching materials also proved to be the most effective to reduce soil water evaporation in the early mulching stage, and that will be weakened in the later mulching stage. [15]. However, the straw mulching layer had little impact on soil water evaporation in the laboratory experiment [51,52]. One reason could be that the indoor experimental investigations were not subjected to climatological variables [9,10], such as solar radiation, wind, and rainfall. The other reason was that the soil did not have access to a water supply from the in-depth soil and surrounding soil [6,11]. Fisher’s LSD test is performed to compare the influence of different straw mulching thicknesses on soil water evaporation, and the results indicated that the straw mulching layer could not completely remove the influence of the exterior environment on soil water evaporation. Similar evidence could also be found from other gravel mulching-related materials, proving that though porous materials delayed the transport of vapor to the atmosphere, they did not completely obstruct soil water evaporation [14].
Due to the difference in experimental conditions, it was impossible to ascertain the sole and absolute simulated outcome of all straw mulching treatment irrigated before the soil was frozen. Soil mulching had been proven could effectively control soil water evaporation in the irrigation system [8,15], and the high soil water evaporation of LD compared to that of straw mulching plots. Soil water evaporation is subject to solar radiation, wind speed, and other climatic factors [9,10]. Moreover, soil water evaporation, heat, and vapor transport are probably affected by diverse residue architecture [53,54]. Although 3–5 cm long corn straw was evenly placed on the surface of different fields in this study, it was not guaranteed that the architectures of the straw mulch layers were consistent. The complex interactions of different residue architectures with different climatic conditions make it challenging to identify the impact of different straw mulch thicknesses on soil water evaporation.
6. Conclusions
With the increase of straw mulch thickness, soil water evaporation during the freeze–thaw period was inhibited effectively. The cumulative soil water evaporation of JG5, JG10, JG15, JG20 and JG30 were 27.0, 20.5, 18.0, 15.7, 14.0 and 11.7 mm, respectively, indicating reductions of 24%, 33.30%, 41.96%, 48.04% and 56.70%, respectively, compared to that of LD. The change of cumulative soil water evaporation decreased with the increase of straw mulching thickness; the inhabiting effect of straw mulch on soil water evaporation may not be as significant as when it was initially covered. The straw mulch decreased the R of the daily soil water evaporation from 2.76 mm to 0.28 mm, which indicated that the effects of random factors on the daily soil water evaporation were significantly decreased. The inhabiting effect was more effective when the mulch thickness was increased. When the straw mulch thickness was over 10 cm, the effect of straw mulch thickness on the variation of daily soil water evaporation was significantly reduced. Even when the straw mulch thickness was increased up to 30 cm, the straw mulch layer could not completely eliminate the influence of the external environment on soil water evaporation.
During the unstable freezing stage, the highest average daily soil water evaporation occurred, the effect of straw mulching was the most significant at the period, the soil water evaporation under straw mulching was from 19.4% to 32.2% of LD soil water evaporation. The lowest soil water evaporation was observed for the stable freezing stage, and the soil water evaporation under straw mulching at the stage was from 41.7% to 65.4% of the other two stages. Overall, soil water evaporation under bare land or straw mulch mainly occurred during the unstable freezing stage and thawing stage.
Author Contributions
Conceptualization, J.C.; data duration, J.C.; formal analysis, J.C. and Y.W.; investigation, J.X. and Q.D.; methodology, J.C. and J.X.; resources, J.C. and J.X.; supervision, J.C.; writing—original draft, J.C., Y.W. and X.Z.; writing—review and editing, X.Z., Y.W. and S.X. All authors have read and agreed to the published version of the manuscript.
Funding
This research was supported by the National Natural Science Foundation of China (Grant No. 41572239); the National Natural Youth Science Foundation of China (Grant No. 41502243), and the Natural Science Foundation of Shanxi Province, China (Grant No. 201901D111053).
Acknowledgments
Thanks Taigu Water Balance Experimental Station for supplying field experimental site and meteorological data.
Conflicts of Interest
The authors declare no conflicts of interest.
References
- Abu-Awwad, A.M. Effect of mulch and irrigation water amounts on soil evaporation and transpiration. J. Agron. Crop. Sci. 1998, 181, 55–59. [Google Scholar] [CrossRef]
- Saito, H.; Simuneka, J.; Mohantyb, B.P. Numerical analysis of coupled water, vapor and heat transport in the Vadose zone. Vadose Zone J. 2006, 5, 784–800. [Google Scholar] [CrossRef] [Green Version]
- Zhu, Y.; Shao, M.; Shao, H. Evaporation process in soil surface containing calcic nodules on the Northern Loess Plateau of China by simulated experiments. Clean (Weinh) 2010, 37, 866–871. [Google Scholar] [CrossRef]
- An, N.; Tang, C.; Xu, S.; Gong, X.; Shi, B.; Inyang, H.I. Effects of soil characteristics on moisture evaporation. Eng. Geol. 2018, 239, 126–135. [Google Scholar] [CrossRef]
- Chen, J.; Zheng, X.; Zhang, Y.; Qin, Z.; Sun, M. Simulation of soil moisture evaporation under different groundwater level depths during seasonal freeze-thaw period. Trans. Chin. Soc. Agric. Mach. 2015, 46, 131–140. [Google Scholar]
- Wu, M.; Huang, J.; Wu, J.; Tan, X.; Jansson, P. Experimental study on evaporation from seasonally frozen soils under various water, solute and groundwater conditions in Inner Mongolia, China. J. Hydrol. 2016, 535, 46–53. [Google Scholar] [CrossRef]
- Rousseaux, M.C.; Figuerola, P.I.; Correatedesco, G.; Searles, P.S. Seasonal variations in sap flow and soil evaporation in an olive (Olea europaea L.) grove under two irrigation regimes in an arid region of Argentina. Agric. Water Manag. 2009, 96, 1037–1044. [Google Scholar] [CrossRef]
- Tarjuelo, J.M.; Ortega, J.F.; Montero, J.; Juan, J.A.D. Modelling evaporation and drift losses in irrigation with medium size impact sprinklers under semi-arid conditions. Agric. Water Manag. 2000, 43, 263–284. [Google Scholar] [CrossRef]
- Li, F.; Yong, Z. Estimation of open water evaporation using land-based meteorological data. Theor. Appl. Climatol. 2017, 134, 1–13. [Google Scholar] [CrossRef]
- Mcmahon, T.; Peel, M.; Lowe, L.; Srikanthan, R.; McVicar, T. Estimating actual, potential, reference crop and pan evaporation using standard meteorological data: A pragmatic synthesis. Hydrol. Earth Syst. Sci. Discuss. 2012, 17, 1331–1363. [Google Scholar] [CrossRef] [Green Version]
- Diaz, F.; Jimenez, C.C.; Tejedor, M. Influence of the thickness and grain size of tephra mulch on soil water evaporation. Agric. Water Manag. 2005, 74, 55. [Google Scholar] [CrossRef]
- Feng, H.; Chen, J.; Zheng, X.; Xue, J.; Miao, C.; Du, Q.; Xu, Y. Effect of sand mulches of different particle sizes on soil evaporation during the freeze—Thaw period. Water 2018, 10, 536. [Google Scholar] [CrossRef] [Green Version]
- Hou, X.Y.; Wang, F.X.; Han, J.J.; Kang, S.Z.; Feng, S.Y. Duration of plastic mulch for potato growth under drip irrigation in an arid region of Northwest China. Agric. Meteorol. 2010, 150, 115–121. [Google Scholar] [CrossRef]
- Yuan, C.; Lei, T.; Mao, L.; Han, L.; Yang, W. Soil surface evaporation processes under mulches of different sized gravel. Catena 2009, 78, 117–121. [Google Scholar] [CrossRef]
- Zribi, W.; Aragüés, R.; Medina, E.; Faci, J.M. Efficiency of inorganic and organic mulching materials for soil evaporation control. Soil Till. Res. 2015, 148, 40–45. [Google Scholar] [CrossRef] [Green Version]
- Chen, H.; Liu, J.; Zhang, A.; Chen, J.; Cheng, G.; Sun, B.; Pi, X.; Dyck, M.; Si, B.; Zhao, Y.; et al. Effects of straw and plastic film mulching on greenhouse gas emissions in Loess Plateau, China: A field study of 2 consecutive wheat-maize rotation cycles. Sci. Total Environ. 2017, 579, 814–824. [Google Scholar] [CrossRef] [PubMed]
- Gill, B.S.; Jalota, S.K. Evaporation from soil in relation to residue rate, mixing depth, soil texture and evaporativity. Soil Technol. 1996, 8, 293–301. [Google Scholar] [CrossRef]
- Ruiz Corrêa, S.T.; Barbosa, L.C.; Menandro, L.M.S.; Scarpare, F.V.; Reichardt, K.; de Moraes, L.O.; Hernandes, T.A.D.; Franco, H.C.J.; Carvalho, J.L.N. Straw removal effects on soil water dynamics, soil temperature, and sugarcane yield in South-Central Brazil. Bioenergy Res. 2019, 12, 749–763. [Google Scholar] [CrossRef]
- Du, J.; He, W.; Nangia, V.; Yan, C.; Ahmad, M.; Liu, S.; Liu, Q. Effects of conservation tillage on soil water content in northern arid regions of China. Trans. Chin. Soc. Agric. Eng. 2008, 24, 25–29. [Google Scholar]
- Zhang, S.; Zhong, X.; Huang, N.; Lu, G. Effect of straw-mulch-incorporation on nitrogen uptake and N fertilizer use efficiency of rice (Oryza sativa L.). Chin. J. Eco-Agric. 2010, 18, 611–616. [Google Scholar] [CrossRef]
- Mitchell, J.P.; Shrestha, A.; Horwath, W.R.; Southard, R.J.; Madden, N.; Veenstra, J.; Munk, D.S. Tillage and cover cropping affect crop yields and soil carbon in the San Joaquin Valley, California. Agron. J. 2015, 107, 588. [Google Scholar] [CrossRef]
- Bi, Y.; Cai, S.; Wang, Y.; Xia, Y.; Zhao, X.; Wang, S.; Xing, G. Assessing the viability of soil successive straw biochar amendment based on a five-year column trial with six different soils: Views from crop production, carbon sequestration and net ecosystem economic benefits. J. Environ. Manag. 2019, 245, 173–186. [Google Scholar] [CrossRef] [PubMed]
- Wang, J.; Tang, H. Comprehensive utilization status and development analysis of crop straw resource in Northeast China. Trans. Chin. Soc. Agric. Mach. 2017, 48, 1–21. [Google Scholar]
- Dong, Q.G.; Yang, Y.; Yu, K.; Feng, H. Effects of straw mulching and plastic film mulching on improving soil organic carbon and nitrogen fractions, crop yield and water use efficiency in the Loess Plateau, China. Agric. Water Manag. 2018, 201, 133–143. [Google Scholar] [CrossRef]
- Balwinder, S.; Eberbach, P.; Humphreys, E.; Kukal, S.S. The effect of rice straw mulch on evapotranspiration, transpiration and soil evaporation of irrigated wheat in Punjab, India. Agric. Water Manag. 2011, 98, 1847–1855. [Google Scholar] [CrossRef]
- Vial, L.K.; Lefroy, R.D.B.; Fukai, S. Application of mulch under reduced water input to increase yield and water productivity of sweet corn in a lowland rice system. Field Crops Res. 2015, 171, 120–129. [Google Scholar] [CrossRef]
- Li, S.X.; Wang, Z.H.; Li, S.Q.; Gao, Y.J.; Tian, X.H. Effect of plastic sheet mulch, wheat straw mulch, and maize growth on water loss by evaporation in dryland areas of China. Agric. Water Manag. 2013, 116, 39–49. [Google Scholar] [CrossRef]
- Flerchinger, G.N.; Sauer, T.J.; Aiken, R.A. Effects of crop stover cover and architecture on heat and water transfer at the soil surface. Geoderma 2003, 116, 217–233. [Google Scholar] [CrossRef]
- Fu, Q.; Yan, P.; Li, T.; Cui, S.; Peng, L. Effects of straw mulching on soil evaporation during the soil thawing period in a cold region in northeastern China. J. Earth Syst. Sci. 2018, 127, 33. [Google Scholar] [CrossRef] [Green Version]
- Chen, J.; Xie, X.; Zheng, X.; Xue, J.; Miao, C.; Du, Q.; Xu, Y. Effect of straw mulch on soil evaporation during freeze–Thaw periods. Water 2019, 11, 1689. [Google Scholar] [CrossRef] [Green Version]
- Allen, R.G.; Pereira, L.S.; Smith, M.; Raes, D.; Wright, J.L. FAO-56 dual crop coefficient method for estimating evaporation from soil and application extensions. J. Irrig. Drain Div. Am. Soc. Civ. Eng. 2005, 131, 2–13. [Google Scholar] [CrossRef] [Green Version]
- Lewan, E. Evaporation and discharge from arable land with cropped or bare soils during winter. Measurements and simulations. Agric. For. Meteorol. 1993, 64, 131–159. [Google Scholar] [CrossRef]
- Hansson, K.Š.N.J. Water flow and heat transportin frozen soil: Numerical solution and freeze-thaw applications. Vadose Zone J. 2004, 3, 693–704. [Google Scholar] [CrossRef] [Green Version]
- Flerchinger, G.N.; Hanson, C.L.; Wight, J.R. Modeling evapotranspiration and surface energy budgets across a watershed. Water Resour. Res. 1996, 32, 2539–2548. [Google Scholar] [CrossRef]
- Jansson, P.-E.; Moon, D.S.; Tidigare, I.F. A coupled model of water, heat and mass transfer using object orientation to improve flexibility and functionality. Environ. Model. Softw. 2001, 16, 37–46. [Google Scholar] [CrossRef]
- Li, R.; Shi, H.; Flerchinger, G.N.; Akae, T.; Wang, C. Simulation of freezing and thawing soils in Inner Mongolia Hetao Irrigation District, China. Geoderma 2012, 173–174, 28–33. [Google Scholar] [CrossRef]
- Flerchinger, G.N.; Hanson, C. Modeling soil freezing and thawing on a rangeland watershed. Trans. ASAE 1989, 32, 1551–1554. [Google Scholar] [CrossRef]
- Flerchinger, G.N. Simultaneous heat and water (SHAW) model: Model use, calibration, and validation. Trans. ASABE 2012, 55, 1395–1411. [Google Scholar] [CrossRef]
- Flerchinger, G.N.; Reba, M.L. Measurement of surface energy fluxes from two rangeland sites and comparison with a multilayer canopy model. J. Hydrometeorol. 2012, 13, 1038–1051. [Google Scholar] [CrossRef]
- Flerchinger, G.N.; Pierson, F.B. Modelling plant canopy effects on variability of soil temperature and water: Model calibration and validation. J. Arid. Environ. 1997, 35, 653. [Google Scholar] [CrossRef] [Green Version]
- Chen, J.; Gao, X.; Zheng, X.; Miao, C.; Zhang, Y.; Du, Q.; Xu, Y. Simulation of soil freezing and thawing for different groundwater table depths. Vadose Zone J. 2019, 18, 1539–1663. [Google Scholar] [CrossRef] [Green Version]
- Li, Z.; Ma, L.; Flerchinger, G.N.; Ahuja, L.R.; Wang, H.; Li, Z. Simulation of overwinter soil water and soil temperature with SHAW and RZ-SHAW. Soil Sci. Soc. Am. J. 2012, 76, 1548. [Google Scholar] [CrossRef] [Green Version]
- Flerchinger, G.N.; Saxton, K.E. Simultaneous heat and water model of a freezing snow-residue-soil system, I. Theory and development. Trans. ASAE 1989, 32, 565–571. [Google Scholar] [CrossRef]
- Flerchinger, G.N.; Saxton, K.E. Simultaneous heat and water model of a freezing snow-residue-soil system Ⅱ. Field veriflcation. Trans. ASAE 1989, 32, 573–578. [Google Scholar] [CrossRef]
- Cai, H.; Yang, H.; Liu, J.; Niu, L.; Ren, L.; Liu, F.; Ou, S.; Yang, Q. Quantifying the impacts of human interventions on relative mean sea level change in the Pearl River Delta, China. Ocean Coast Manag. 2019, 173, 52–64. [Google Scholar] [CrossRef]
- Nassar, I.N.; Horton, R.; Flerchinger, G.N. Simultaneous heat and mass transfer in soil columns exposed to freezing/thawing conditions 1. Soil Sci. 2000, 165, 208–216. [Google Scholar] [CrossRef] [Green Version]
- Fang, Q.X.; Ma, L.; Flerchinger, G.N.; Qi, Z.; Ahuja, L.R.; Xing, H.T.; Li, J.; Yu, Q. Modeling evapotranspiration and energy balance in a wheat–maize cropping system using the revised RZ-SHAW model. Agric. For. Meteorol. 2014, 194, 218–229. [Google Scholar] [CrossRef]
- Li, R.; Shi, H.; Flerchinger, G.N.; Zou, C.; Li, Z. Modeling the effect of antecedent soil water storage on water and heat status in seasonally freezing and thawing agricultural soils. Geoderma 2013, 206, 70–74. [Google Scholar] [CrossRef]
- Guo, D.; Yang, M.; Wang, H. Characteristics of land surface heat and water exchange under different soil freeze/thaw conditions over the central Tibetan Plateau. Hydrol Process. 2011, 25, 2531–2541. [Google Scholar] [CrossRef]
- Chen, S.Y.; Zhang, X.Y.; Pei, D.; Sun, H.Y.; Chen, S.L. Effects of straw mulching on soil temperature, evaporation and yield of winter wheat: Field experiments on the North China Plain. Ann. Appl. Biol. 2007, 150, 261–268. [Google Scholar] [CrossRef]
- Bond, J.J.; Willis, W.O. Soil water evaporation: Surface residue rate and placement effects. Soil Sci. Soc. Am. J. 1969, 33, 445–448. [Google Scholar] [CrossRef]
- Bond, J.J.; Willis, W.O. Soil water evaporation: First stage drying as influenced by surface residue and evaporation potential. Soil Sci. Soc. Am. J. 1970, 34, 924–928. [Google Scholar] [CrossRef]
- Sharratt, B.S. Corn stubble height and residue placement in the northern US Corn Belt-II. Spring microclimate and wheat development. Soil Till. Res. 2002, 64, 253–261. [Google Scholar] [CrossRef]
- Sharratt, B.S.; Benoit, G.R.; Voorhees, W.B. Winter soil microclimate altered by corn residue management in the northern Corn Belt of the USA. Soil Till. Res. 1998, 49, 243–248. [Google Scholar] [CrossRef]
Figure 1.
Area location map.

Figure 2.
Daily average temperature and solar radiation during the experimental period.

Figure 3.
Physical description of the SHAW model (T: temperature; u: wind speed; h: relative humidity; St: solar radiation; i: precipitation; T: soil temperature; θ: soil water content).
Figure 3.
Physical description of the SHAW model (T: temperature; u: wind speed; h: relative humidity; St: solar radiation; i: precipitation; T: soil temperature; θ: soil water content).

Figure 4.
Comparison between the measured and simulated values of soil water content when (a) the soil depth of LD is 10 cm, (b) the soil depth of JG5 is 10 cm, (c) the soil depth of JG20 is 5 cm, and (d) the soil depth of JG30 is 5 cm.
Figure 4.
Comparison between the measured and simulated values of soil water content when (a) the soil depth of LD is 10 cm, (b) the soil depth of JG5 is 10 cm, (c) the soil depth of JG20 is 5 cm, and (d) the soil depth of JG30 is 5 cm.

Figure 5.
Comparison between the measured and simulated values of soil temperature when (a) the straw mulch thickness (SMT) was 5 cm on 11 December 2005, (b) the SMT was 15 cm on 11 December 2005, (c) the SMT was 10 cm on 21 January 2006, and (d) the SMT was 15 cm on 21 January 2006.
Figure 5.
Comparison between the measured and simulated values of soil temperature when (a) the straw mulch thickness (SMT) was 5 cm on 11 December 2005, (b) the SMT was 15 cm on 11 December 2005, (c) the SMT was 10 cm on 21 January 2006, and (d) the SMT was 15 cm on 21 January 2006.

Figure 6.
Soil freezing and thawing processes during the experimental period.

Figure 7.
Soil water evaporation with different straw mulch thicknesses during the three freeze–thaw stages.
Figure 7.
Soil water evaporation with different straw mulch thicknesses during the three freeze–thaw stages.

Figure 8.
Soil water evaporation rate with different straw mulch thicknesses during the three freeze–thaw stages.
Figure 8.
Soil water evaporation rate with different straw mulch thicknesses during the three freeze–thaw stages.

Figure 9.
Cumulative soil water evaporation with different straw mulch thicknesses during the freeze–thaw period.
Figure 9.
Cumulative soil water evaporation with different straw mulch thicknesses during the freeze–thaw period.


Table 1.
Main physical parameters of soils.
| Soil Depth | Mass Fraction of Different Soil Particle Sizes/% | Dry Bulk Density (g·cm−3) | ||
|---|---|---|---|---|
| Clay (<0.002 mm) | Silt (0.002–0.02 mm) | Sand (>0.02 mm) | ||
| ≤20 cm | 24.95 | 65.15 | 9.9 | 1.55 |
| ≥20 cm | 19.88 | 69.76 | 10.36 | 1.52 |
Table 2.
Optimized soil profile parameters.
| Simulation Depth (cm) | Saturated Water Content (m3·m−3) | Saturated Conductivity (cm·h−1) | Air entry Potential (m) | Pore Size Index (b) | Bulk Density (g·cm−3) |
|---|---|---|---|---|---|
| 0 | 0.503 | 0.862 | 0.042 | 4.615 | 1.55 |
| 5 | 0.503 | 0.862 | 0.042 | 4.615 | 1.55 |
| 10 | 0.503 | 0.862 | 0.042 | 4.615 | 1.55 |
| 15 | 0.503 | 0.862 | 0.042 | 4.615 | 1.55 |
| 20 | 0.503 | 0.862 | 0.042 | 4.615 | 1.55 |
| 40 | 0.491 | 1.332 | 0.048 | 4.098 | 1.52 |
| 80 | 0.491 | 1.332 | 0.048 | 4.098 | 1.52 |
Table 3.
Freezing and thawing characteristics of different test plots.
| Test Plots | Unstable Freezing Stage | Stable Freezing Stage | Thawing Stage |
|---|---|---|---|
| LD | From 14 November 2005 to 2 December 2005 | From 3 November 2005 to 1 February 2006 | From 2 February 2006 to 16 March 2006 |
| JG5 | From16 November 2005 to 3 February 2006 | From 4 February 2006 to 16 March 2006 | |
| JG10 | From 1 January 2006 to 5 February 2006 | From 6 February 2006 to 16 March 2006 |
Table 4.
Difference in the daily soil water evaporation during the freeze–thaw period.
| Unstable Freezing Stage | Stable Freezing Stage | Thawing Stage | Freeze–Thaw Period | |||||||||
|---|---|---|---|---|---|---|---|---|---|---|---|---|
| R (mm) | Cv | Ӯ (mm) | R (mm) | Cv | Ӯ (mm) | R (mm) | Cv | Ӯ (mm) | R (mm) | Cv | Ӯ (mm) | |
| LD | 2.280 | 0.589 | 0.842 | 0.690 | 0.091 | 0.026 | 0.640 | 0.151 | 0.219 | 2.760 | 1.857 | 0.205 |
| JG5 | 0.310 | 0.084 | 0.271 | 0.430 | 0.099 | 0.113 | 0.740 | 0.148 | 0.197 | 0.740 | 0.785 | 0.167 |
| JG10 | 0.240 | 0.069 | 0.199 | 0.300 | 0.067 | 0.109 | 0.510 | 0.093 | 0.177 | 0.510 | 0.593 | 0.146 |
| JG15 | 0.210 | 0.060 | 0.184 | 0.260 | 0.057 | 0.092 | 0.410 | 0.076 | 0.152 | 0.410 | 0.574 | 0.127 |
| JG20 | 0.180 | 0.052 | 0.172 | 0.230 | 0.049 | 0.082 | 0.350 | 0.064 | 0.134 | 0.350 | 0.571 | 0.114 |
| JG30 | 0.170 | 0.048 | 0.163 | 0.190 | 0.041 | 0.068 | 0.280 | 0.052 | 0.104 | 0.280 | 0.569 | 0.101 |
© 2020 by the authors. Licensee MDPI, Basel, Switzerland. This article is an open access article distributed under the terms and conditions of the Creative Commons Attribution (CC BY) license (http://creativecommons.org/licenses/by/4.0/).
Share and Cite
MDPI and ACS Style
Chen, J.; Wei, Y.; Zhao, X.; Xue, J.; Xu, S.; Du, Q. Simulation of Soil Water Evaporation during Freeze–Thaw Periods under Different Straw Mulch Thickness Conditions. Water 2020, 12, 2003. https://doi.org/10.3390/w12072003
AMA Style
Chen J, Wei Y, Zhao X, Xue J, Xu S, Du Q. Simulation of Soil Water Evaporation during Freeze–Thaw Periods under Different Straw Mulch Thickness Conditions. Water. 2020; 12(7):2003. https://doi.org/10.3390/w12072003
Chicago/Turabian StyleChen, Junfeng, Yizhao Wei, Xiping Zhao, Jing Xue, Shuyuan Xu, and Qi Du. 2020. "Simulation of Soil Water Evaporation during Freeze–Thaw Periods under Different Straw Mulch Thickness Conditions" Water 12, no. 7: 2003. https://doi.org/10.3390/w12072003
Note that from the first issue of 2016, this journal uses article numbers instead of page numbers. See further details here.