Hydrologic and Pollutant Removal Performance of Media Layers in Bioretention
by
 ,
,
Feikai Yang
1,2 ,
,
Dafang Fu
1,2,*,
Shuang Liu
1,2,
Chris Zevenbergen
3 and
Rajendra Prasad Singh
1,2,* 1
School of Civil Engineering, Southeast University, Nanjing 210096, China
2
Southeast University-Monash University Joint Research Centre for Future Cities, Nanjing 210096, China
3
Institute for Water Education, IHE-Delft, 2611 DA Delft, The Netherlands
*
Authors to whom correspondence should be addressed.
Water 2020, 12(3), 921; https://doi.org/10.3390/w12030921
Submission received: 4 January 2020
/
Revised: 12 March 2020
/
Accepted: 16 March 2020
/
Published: 24 March 2020
(This article belongs to the Special Issue Urban Rainwater and Flood Management)
Abstract
:The current study was aimed to investigate the filler layer structure in modified bioretention systems. Three different structural layers in bioretention were proposed to evaluate their hydrologic performance and pollutant removal efficiency under different rainfall intensities. These layers were as follows: all three layers (filter, transition, and drainage layers), without transition layer, and without drainage layer. Synthetic stormwater was used for experimental purpose in current work. Results revealed that compared with “all three layers”, runoff control rate of “without transition layer” and “without drainage layer” was reduced by 0 to 7.4%, 0 to 10.1%, and outflow start time was advanced by 6 to 8 min and 1.5 to 4.5 min, respectively. Moreover, CODcr (chemical oxygen demand), NH4+-N (ammonium nitrogen), TN (total nitrogen) and TP (total phosphorus) removal rates were 86.0%, 85.4%, 71.8%, and 68.0%, respectively. Particle size distribution of the fillers revealed that during operation, particle moved downward were mainly within 0.16–0.63 mm size. Findings showed that transition and drainage layer played an important role in runoff control, and total height of the filler layer should not be less than 800 mm. Filter layer effectively reduce runoff pollution but the thickness of the filter layer should not be less than 500 mm. Whereas, transition layer has the function of preventing the filler loss of the filter layer; therefore, proper measures must be taken into consideration during structural optimization.
1. Introduction
With the rapid economic development and urbanization process in China, the urban landscape is rapidly expanding and associated with a series of problems, such as urban waterlogging and deterioration of water quality. The suspended solids, organic matter, nitrogen, phosphorus, heavy metals, oils, and other pollutants directly enter to the rivers and lakes by rainwater runoff, which are predominant causing agents of water pollution [1]. The US Environmental Protection Agency found that the urban stormwater runoff is the third largest source of pollution in US lakes and rivers [2]. More than 90% of the freshwater bodies in China are highly polluted, and have black odor or algal blooms, which is reducing the livability of cities [3]. The urban design and infrastructure are guided by “fast transportation”; stormwater is directed away from urban areas. Recently, China gave high priority to the retention of rainwater, drainage by natural forces, and the construction of sponge cities with natural accumulation, infiltration, and purification [4]. In 2014, the "Technical Guidelines for Sponge city Construction of the Ministry of Housing and Construction—Construction of Rainwater System for Low Impact Development" (hereinafter referred to as "Guidelines") was officially introduced in China [4]. At present, China is vigorously promoting the construction of sponge cities to solve the problem of urban waterlogging, reduce the non-point source of urban pollution, create a good landscape effect, and improve the livability of the city.
Bioretention systems are one of the most common technical measures for sponge city construction and urban low impact development [5]. It is widely used in various terrain and soil conditions, aiming to store and purify runoff rainwater through plants, soil, and microbial systems [4,5,6]. However, the construction of bioretention units require to fill, compact, level, and control the elevation—layer by layer—with many processes and specific times. Hence, it is very complex to design and construct bioretention units. Studying and developing a simple bioretention unit structure without reducing performance and increasing cost is an important developmental direction for bioretention technology in the future, which will promote a larger range of bioretention system utilization. Bioretention can effectively remove various pollutants from runoff, including suspended solids, nitrogen, phosphorus, oil, heavy metals, pathogens etc. Bioretention units can remove more than 90% of suspended matter and are not affected by temperature [7,8] and the removal rate of nitrogen can exceed up to 60% [9]. The particulate phosphorus is mostly retained in the filler by means of interception, while the dissolved phosphorus can be taken up by plants and microorganisms, and the phosphorus ions can be blocked by fillers by ion exchange, adsorption, complexation, etc. [10]. The oils and fats in rainwater runoff include oil, antifreeze, corrosion inhibitor, pesticide, etc., which are classified as hydrophobic organic matter, are removed through microbial absorption degradation [11]. The removal of heavy metals in rainwater is mainly caused by sedimentation and filtration. In addition, some plants can remove certain metals through enrich and fix processes [12]. The bioretention facilities are configured with different vegetation from the traditional greening to create a unique color and aesthetic feeling, complemented by a high and low layout, to achieve a multi-element of vitality. The combination makes the whole green landscape more vibrant [13].
Earlier research studies mainly focus on the hydrological effects under different climates and seasons [14,15]; water quality improvement for suspended solids (SS), chemical oxygen demand (CODcr), total phosphorus (TP), ammonium nitrogen (NH4+-N), and especially total nitrogen (TN) [16,17,18]; and bioretention model, to evaluate and predict the performance of real or designed bioretention systems [19,20]. Similarly, Ayers [21] emphasized the importance of bioretention soil and ecosystems, and noted that their impact on bioretention performance may be significant. Gao et al. [22] have used a numerical simulation method to study the effects of structural layer parameters of bioretention systems on the effects of water accumulation, runoff, and runoff regulation under four rainfall events. The results showed that the runoff control level of the retaining zone was significantly affected by the depth of the aquifer. Pan et al. [23] and Zhang et al. [24] analyzed the problems related to the filling structure and influencing factors on the hydrological performance of bioretention. They obtained the optimum data of the filling mix ratio, the filling depth, and the pollutant removal effect, and proposed that the hydrological effect was related to the structure, depth, filler composition, and the proportion between bioretention and catchment area.
At present, all types of bioretention systems revealed high performance for pollutant reduction and runoff control. However, during the construction of the sponge city facilities in China (Kunshan and Lianyungang cities), it was found that the drainage, transition, and filtration layers of the bioretention system should be filled, compacted, leveled, and controlled by a layer depth, and the drainage pipeline should be installed before filling the filler. The construction procedure was unmanageable with the long construction time and high construction requirements. Such situation can increase the construction cost and reduce the construction efficiency. Therefore, there is a need to carry out research on the performance of bioretention systems with simple structure, less construction time, low cost, and improve the construction efficiency. At the same time, it should not reduce the hydrological performance and increase the construction cost of bioretention systems.
Moreover, the function of each structural layer is not clear, especially about the role of the transition and drainage layers for the hydrological performance and effect of the transition layer in preventing loss of filler material to keep the structural stability. It is also unclear what kind of changes occur and their influence on the structural layers during the operation period. Which structural layer is better functional, and what kind of functions should be strengthened, also requires proper investigation. Moreover, the technical and theoretical support required to optimize the structural form of the bioretention system is not enough at present, and there are still many challenges in design and development of bioretention systems with a simple structure. Therefore, the current study focuses on the functions of the filter, transition, and drainage layers to control runoff, to reduce pollution, and to prevent filter material loss in bioretention.
2. Materials and Methods
2.1. Experimental Site
This study was conducted in the laboratory of the Kunshan Construction Engineering Quality Testing Center, Kunshan city, China, which is located in the core of the Yangtze River delta, adjacent to Shanghai and Suzhou cities. Kunshan is also one of the first pilot cities selected for the implementation of sponge city construction and development projects in Jiangsu Province, China.
2.2. Bioretention Units
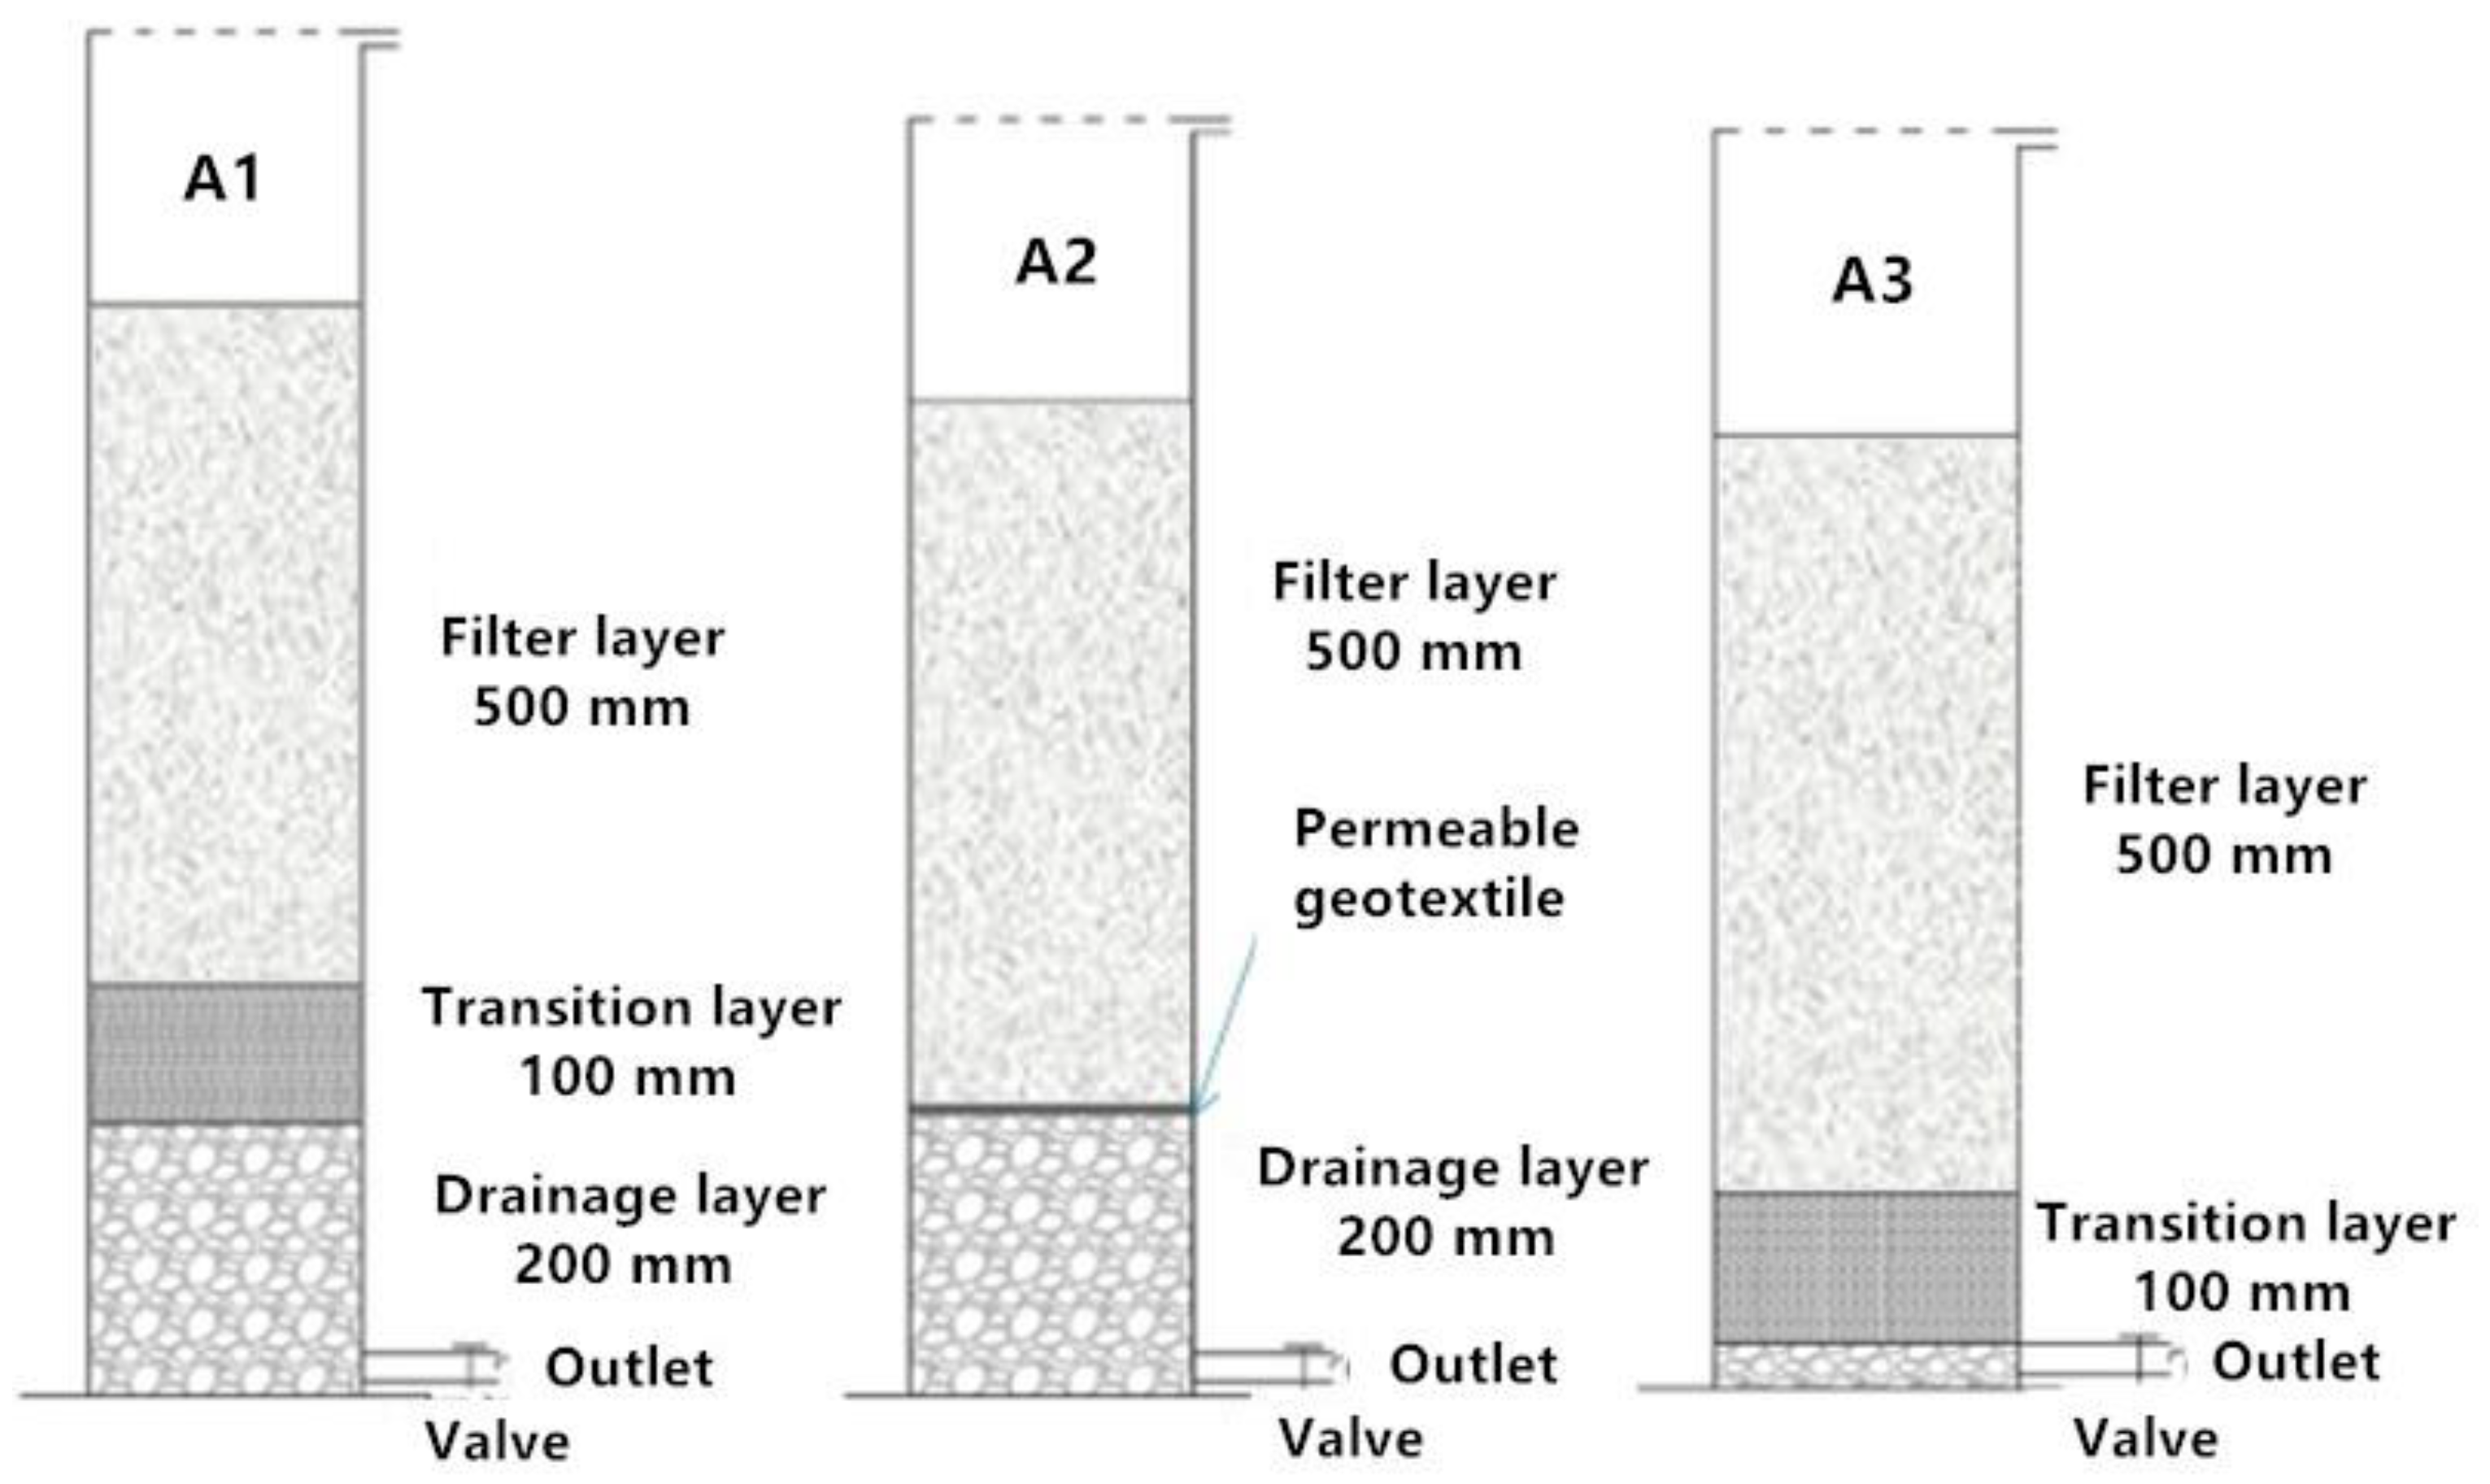
Three lab-scale bioretention units A1, A2, and A3 with an inner diameter of 200 mm were constructed according to the conventional bioretention structure at the experimental site in Kunshan city, as presented in Figure 1. A1 was a conventional structure comprising a 200 mm drainage layer, a 100 mm transition layer, and a 500 mm filter layer. A2 was not provided with a transition layer, only a 200 mm drainage layer, and a 500 mm filter layer, and a layer of permeable geotextile was placed between filter and drainage layers. A3 did not have a drainage layer, only a 100 mm transition layer, and a 500 mm filter layer, and a 50 mm thick gravel was placed under the transition layer for smoothly discharge the runoff. The experiment used a peristaltic pump to enter the water. The effluent and overflow were caught by a plastic bucket. The mass and the water temperature were measured to calculate the water volume, the overflow start time and the runoff time were measured by using a code table. The filler consist graded filter material, mixture of coarse, fine, and ultrafine sand in 5:2:3 ratio, with 3% of the nutrient soil. The transition layer filler was coarse sand, and the drainage layer filler was gravel, which had a particle diameter of 3–5 mm. The 200 mm perforated drain pipe at the bottom of the bioretention system made of DN20 PVC pipe.
2.3. Hydrological Effects of Each Structural Layer
Experimental conditions for rainfall return period and rainfall duration were as follows:
- Rainstorm return period of 0.5 a, 2 a, 10 a, 50 a, and the rainfall duration of 60 min were selected to carry out for different rainfall intensity, set rainfall intermittent periods as 1 day, and compared the hydrological effect of different bioretention systems under different rainfall intensities.
- Rainstorm return period of 0.5 a, and the rainfall duration of 60 min were selected as the experimental rainfall intensity. The rainfall intermittent periods was 1 day, and the rainfall duration was set to 60 min, 30 min, and 15 min. Hydrological effect of different bioretention systems was compared under different rainfall durations, and sum up the contribution of transition layer and drainage layer in runoff control.
- Rainstorm return period of 0.5 a, and the rainfall duration of 60 min were selected as the experimental rainfall intensity. The rainfall intermittent periods was set to 1 day, 3 days, and 7 days. Hydrological effect of different bioretention systems was compared under different rainfall intervals, and sum up the contribution of transition layer and drainage layer in runoff control.
2.4. Water Quality Effects of Each Structural Layer
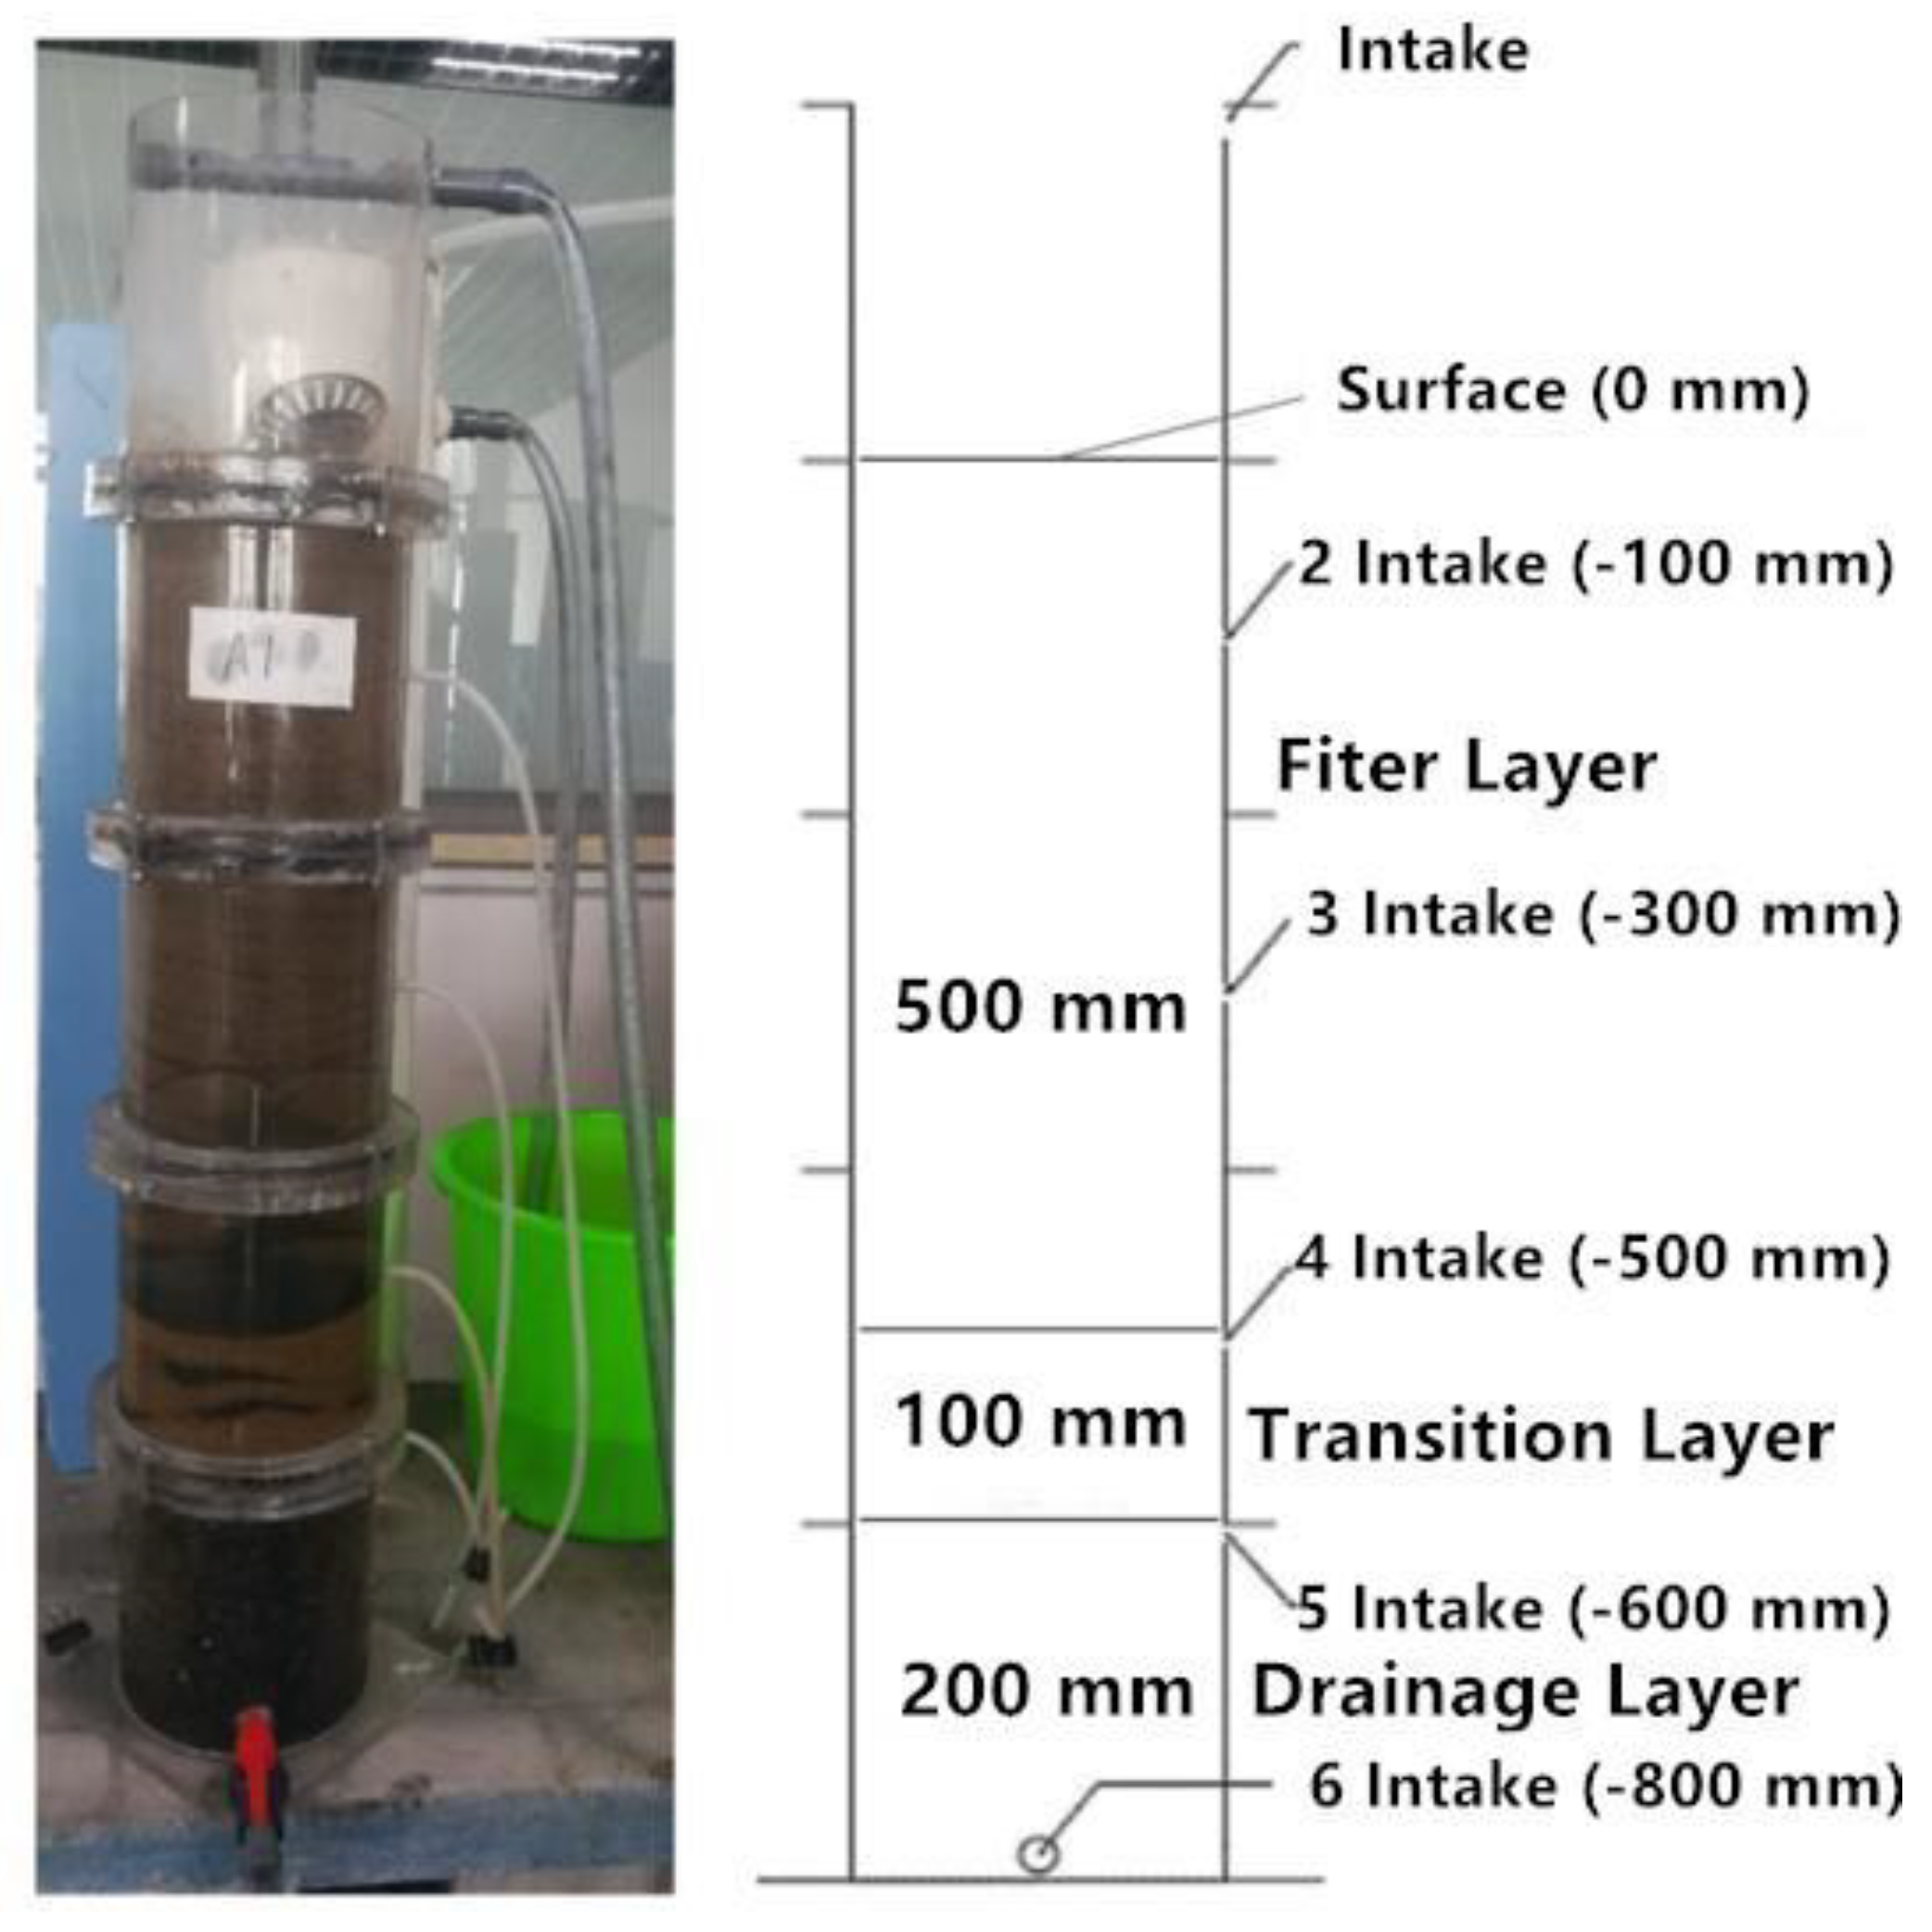
A separate bioretention unit with 200 mm diameter size (Figure 2) was set up to simulate the initial stormwater runoff (CODcr 200 mg/L, NH4+-N 5 mg/L, TN 7 mg/L and TP 0.5 mg/L). Many previous research studies revealed that total suspended solids (TSS) mainly removed within the very top layers (surface to 50–200 mm depth) [25,26], but it will lead to the clogging of surface media [27], with a decline of hydrologic conductivity. A pretreatment chamber of suspended solid showed a high removal rate of TSS [28] and it can be a good solution to control the clogging problem in future research. Additionally, the current study mainly focused on the function of different layers, especially the transition layer and drainage layer, and suspended solids have no influence on these two layers. Therefore, investigation on TSS was not involved in this study.
After the completion of the filling, the bioretention unit was continuously fed with tap water for 10 hours to stabilize the internal structure. Inlet water period of 5 days was 1 cycle, and the water was continuously fed for 2 hours at the same time every day for 4 days before each cycle. The water was suspended on the 5th day, and the water was fed for 8 cycles. On the first and third days of each cycle, the effluent quality of the outlets at different heights of the bioretention system was measured, the pollutant removal efficiency was calculated, the distribution of pollutant concentration in the vertical direction of the bioretention system was studied, and the effect of the structural layers of the bioretention on the water quality effect was analyzed.
2.5. Particle Size Distribution of Each Structural Layer Filler during Operation
Four conventional bioretention systems with an inner diameter of 200 mm were set, and the flow was continuously flowed for 2 hours at a flow rate of 0.0126 m3/h for one hour, and suspended for 1 day from every 4 days. Each bioretention system was split every 10 days, and the filler was taken out for screening. The particle size distribution of each structural layer filler was analyzed during the operation, and the role of the transition layer in the conventional structural bioretention cell was discussed.
2.6. Evaluation Methods for Hydrologic and Water Quality Parameters
2.6.1. Hydrologic Effect
Hydrological effects of bioretention systems were evaluated by using five indicators: outflow start time, overflow start time, peak flow reduction rate, runoff control rate, and runoff reduction rate:
- Outflow start timeThis indicator is the time for the outflow of the bioretention system; it is also the time when the bioretention outflow lags behind the runoff in the small-scale test. It can be read by the chronograph, and in the pilot-scale test it can be directly read out in the flow curve of the bioretention.
- Overflow start timeThis indicator is the time when the bioretention system overflows, which can be read by the chronograph in the small-scale test, and can be directly read by the electromagnetic flowmeter, or read by the chronograph.
- Peak flow reduction rateThe index is mainly used to characterize the reduction of runoff peak value by the bioretention system, which is the ratio of the difference between the runoff peak flow minus the outflow peak flow and the runoff peak flow.Runoff control rate
- This indicator is mainly used to characterize the runoff controlled by the bioretention system under a single rainfall event. It was calculated according to Equation (1).where: = runoff control rate (%); P = runoff (m3); R = total overflow (m3).
- Runoff reduction rateThis indicator is mainly used to characterize the runoff absorbed by bioretention under a single rainfall event. Its value is equal to the difference of runoff P minus total outflow F minus total overflow R divided by total runoff. It was calculated according to Equation (2).where: = runoff reduction rate (%); P = runoff (m3); F is the total overflow (m3); and R = total overflow (m3).
2.6.2. Water Quality Analysis
The experimental water sample was a synthetic water sample. The water quality indicators were the average concentration of pollutants in the initial runoff of road stormwater measured in Kunshan city (Table 1). For the analysis of water quality effect of the bioretention unit in the small-scale test, the rainfall intensity with rainfall return period of 0.5 year and rainfall duration of 120 min was calculated according to the heavy rain intensity formula of Kunshan city, and the influent area was calculated with total catchment area and integrated runoff coefficient. The peristaltic pump was controlled to ensure the stability of inlet water flow during the experiment. Water samples were collected from each outlet using 500 ml Polyvinyl chloride (PVC) sampling bottles after outflow was stable, and stored in a refrigerator at 4 °C to avoid any fluctuation in sample quality.
3. Results and Discussion
3.1. Hydrological Effects of Each Structural Layer
3.1.1. Runoff Control Effect under Different Rainfall Intensities
The runoff control effects of each bioretention system under different rainfall intensities were shown in Table 2. Results revealed that with the increase of rainfall intensity, the runoff contributing time and runoff control rate of A1, A2, and A3 decreased, and the runoff reduction rate showed an increasing trend. The change of runoff contributing time was less, respectively decreased by 2.5 min, 1 min, 30 s. The runoff control rate was changed, which was reduced by 41.7%, 42.8%, and 36.5%, respectively. The runoff reduction rate increased by 3.1%, 2.7%, and 3.3%, respectively. The decrease in the runoff contributing time was due to the increase of the rainfall intensity, which accelerates the increase of the temporary water depth on the surface of the bioretention system, which increases the hydrostatic pressure of the filler; thereby, increasing the runoff infiltration rate and finally shortening the time of runoff to the bottom perforated drainage pipe. The runoff control rate greatly reduced because the temporary water depth rise rate on the surface of the bioretention system increases with the increase of the rainfall intensity, resulting in a rapid shortening of the overflow start time and a large increase in the overflow, lead to increase in the proportion of overflow in the total amount of runoff, and the runoff control rate is reduced. The runoff reduction rate increased slightly with the increase of rainfall intensity, which is consistent with the previous studies [29,30]. However, the reduction of runoff in the whole bioretention system was limited, and the runoff reduction rate of the three systems A1, A2, and A3 varied between 17.8% and 30.9%. In practical engineering, after the completion and operation of bioretention system, runoff reduction will also depend on the evapotranspiration of plants and the evaporation of fillers during the interval of two rainfall periods, while the evapotranspiration of bioretention system has a greater relationship with season and temperature [31,32].
Comparing the results of A2 and A3 with A1, it can be seen that A1 was better than A2 and A3 in terms of outflow start time, overflow start time, runoff control rate, and runoff reduction rate, indicating that the role of the transition layer and drainage layer in runoff control cannot be ignored. The runoff contributing time of A1 was the longest, due to the larger total height of the filler layer of A1 and the longest time for the runoff to reach the bottom. The runoff contributing time of A3 was 2–4 min, which was less than A1, because A3 has 200 mm less drainage layer than A1, and the runoff has less drainage layer and shorter infiltration distance, which shortens the runoff contributing time. The runoff contributing time of A2 is 6.5–8 min, which was less than A1 and A3 (4–4.5 min). It is because the particle size of the filter layer and the transition layer filler was small when the runoff was infiltrated, which provides more resistance, and the thickness of A2 after deducting the drainage layer was 500 mm, which was smaller than 600 mm of A3. There was a layer of permeable geotextile between the filter layer and the drainage layer of A2. During the operation of the bioretention system, the fine particle filler moving with the runoff cannot pass through the permeable geotextile and remains on the upper surface of the permeable geotextile, forming a structure in which the upper half of the gap was large and the lower half it was very less [33], so that the runoff can be infiltrated faster. The permeable geotextile can increase the moisture content of the filter layer filler after the end of the outflow, shortening both the internal wetting phase of the bioretention system and outflow start time.
Unit A1 has the largest runoff reduction and control rate, followed by A2 and A3, with lack of a transition layer (A2) and drainage layer (A3). To some extent, it can be concluded that the 200 mm drainage layer plays a better role in the runoff control than the 100 mm transition layer. Under different rainfall intensities (0.5a, 2a, 10a, 50a), the runoff reduction rate of A2 was 6%, 6.5%, 6.5%, and 6.4%, which are lower than A1, respectively. The runoff control rate of A2 was 2.1%, 1.6%, 0.9%, and 3.2% are lower than that of A1, indicating that the transition layer plays a role in runoff control under different rainfall intensities. The runoff reduction rate of A3 was reduced by 10.0%, 8.2%, 8.3%, and 7.8%, respectively compared with A1. The runoff control rate of A3 was reduced by 9.7%, 9.7%, 7.3%, and 4.5%, respectively compared with A1, indicating that the drainage layer plays a major role in controlling runoff under different rainfall intensities. As the rainfall intensity increases, the difference of the runoff reduction rate between A1, A2, and A3 minimized, indicating that the runoff control effect of the transition layer and the drainage layer becomes smaller when the rainfall intensity increased. Under different rainfall intensities, structural layers of conventional bioretention significantly contribute to runoff control, but the role of transition layer and drainage layer cannot be ignored.
3.1.2. Runoff Control Effect under Different Rainfall Durations
The runoff control effects of each bioretention system under different rainfall durations are shown in Table 3. It can be seen that, with the decrease of rainfall duration, the runoff control rate and runoff reduction rate increased, and the runoff control rate reached 100% in the 30 min and 15 min rainfall durations. The rainfall duration would not change the runoff contributing time of A2. With the decrease of rainfall duration, the runoff control rate and runoff reduction rate increased; the runoff control rate reached 100% in the 15 min rainfall durations and there was no overflow. The rainfall duration would not change the runoff contributing time of A3.
As the rainfall duration decreased, the runoff reduction rate and the runoff control rate became larger, because when the rainfall intensity was constant, the runoff that A1, A2, and A3 could absorb was nearly constant, and the increase of rainfall duration was bound to the increase of the total amount of runoff. The runoff reduction rate and runoff control rate increased with the decrease of rainfall duration. However, there was no relationship between runoff production and rain duration, because when the rainfall intensity was constant, the hydrostatic pressure on the surface of the bioretention system was constant, and the runoff infiltration rate was also constant.
Results revealed that performance of unit A1 was superior to A2 and A3 in terms of outflow start time, runoff reduction rate and runoff control rate. It also shows that the transition layer and drainage layer was slightly control the runoff. The rainfall duration has no absolute impact on the outflow start time, and the reason for the different outflow start time could be the structural difference of the three bioretention systems. The runoff control rate and runoff reduction rate of A2 was better than A3. It can be showed that the 200 mm drainage layer has a slightly larger effect on the hydrological effect than the 100 mm transition layer. Under different rainfall durations, the different runoff control effects of A1, A2 and A3 are obviously different, indicating that the transition layer and the drainage layer play a crucial role in prolonging the runoff time, reducing runoff control and reducing overflow.
3.1.3. Runoff Control Effect under Different Rainfall Intermittent Periods
The control effect of the runoff of each bioretention system under different rainfall intermittent periods is shown in Table 4. With extension of the intermittent period of rainfall, the runoff control rate, and runoff reduction rate of A1, A2, and A3 were estimated as an increasing trend, because the evaporation of the bioretention system filler increased with the extension of the rainfall interval, so that the filler layer absorbed more runoff. At the same time, the combined water inside the filler evaporated to make the gap of the filler larger, and the infiltration velocity of the runoff increased, which was better for the runoff control effect. The outflow start times were not changed regularly with the intermittent period of rainfall, and it cannot be explained that there was a correlation between the intermittent period of rainfall and outflow start times. Similarly, A1 was better than A2 and A3 in terms of outflow start time, runoff reduction rate, and runoff control rate. Under different rainfall intermittent conditions, the drainage layer and the transition layer played their own role in the runoff control. Considering the hydrological effect, the drainage layer and the transition layer cannot be directly eliminated when the bioretention filler layer structure is optimized.
3.2. Water Quality Effect of Each Structural Layer
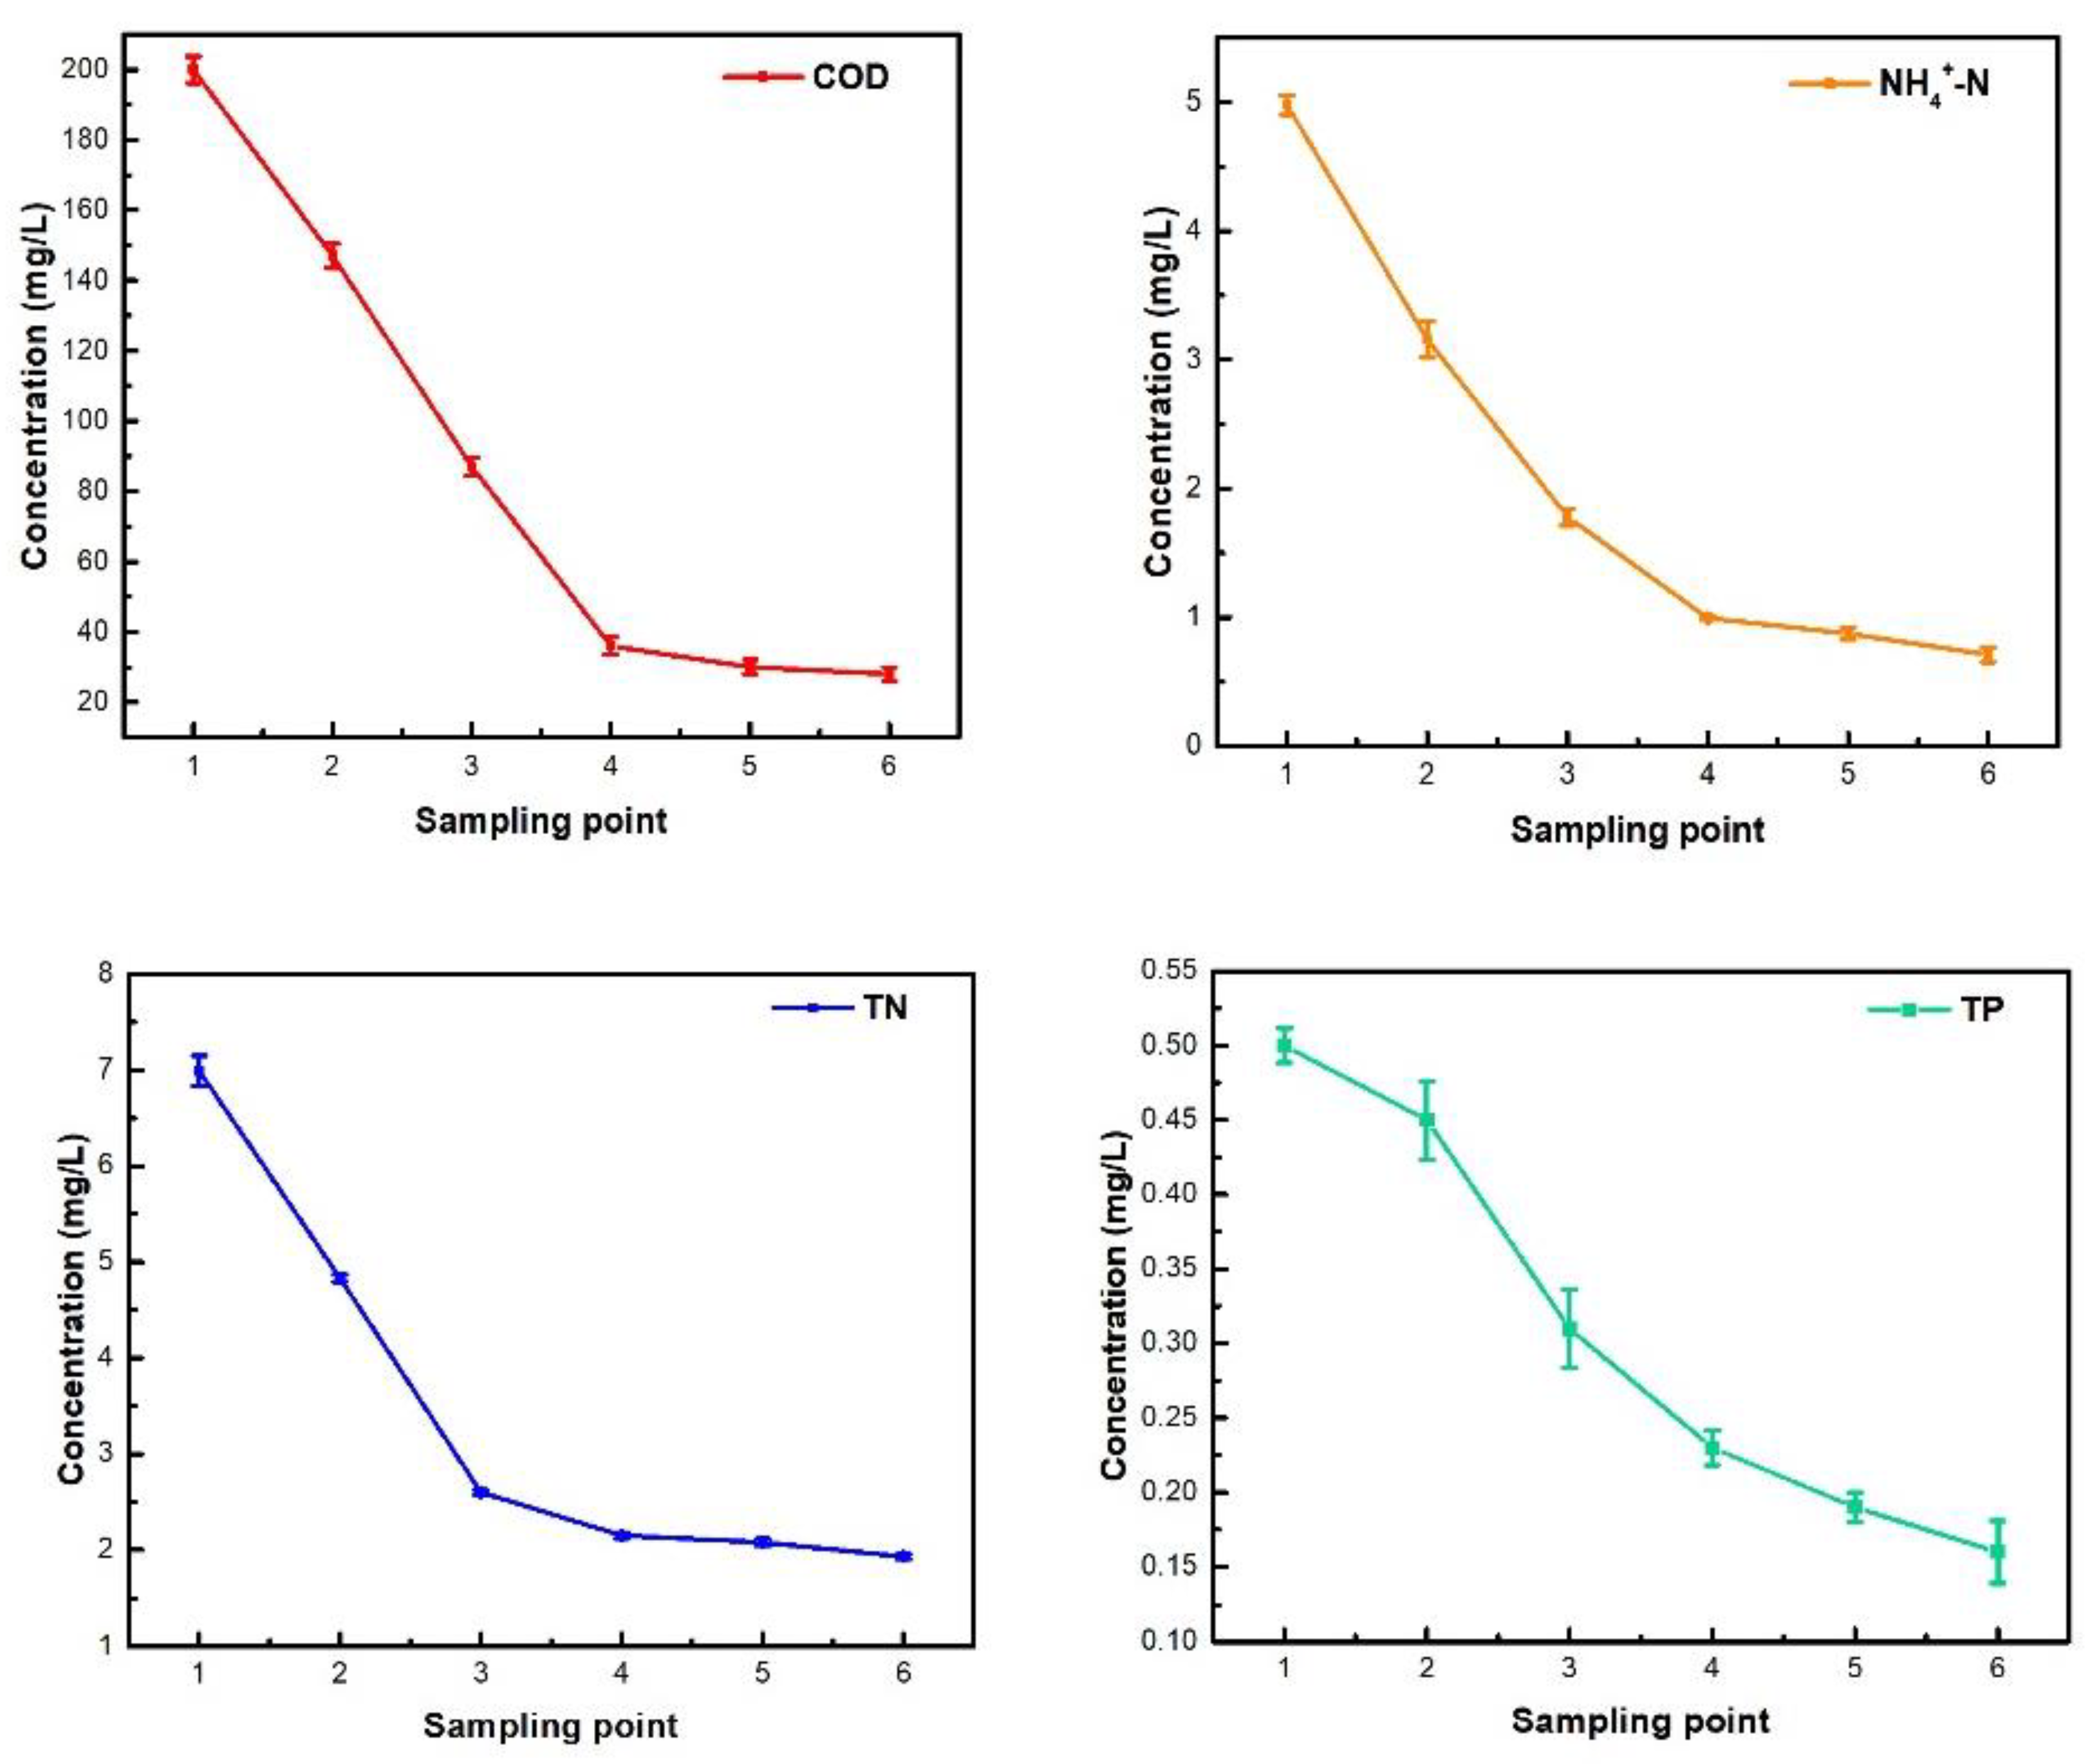
The effluent concentrations of the outlet at different heights of the bioretention system and pollutant removal rate are presented in Table 5 and Figure 3. Results revealed that the highest removal rates among the four pollutants were estimated high in CODcr, followed by NH4+-N, TN, and TP. Current findings for NH4+-N and TP are showing the similar trend with the results of Singh et al. [34] who demonstrated that NH4+-N and TP have good removal effects. Davis et al. [35] used sand as a filler to remove nitrogen and phosphorus pollutants from runoff by bioretention systems, which was a stated better removal rate of TP. In addition, another previous study [29] revealed that bioretention facilities had a poor effect on TN removal due to the lack of oxygenation conditions required for the survival of denitrifying bacteria in the bioretention system. After consumption of NH4+-N, a large amount of NO3−-N was produced, but NO3−-N was not removed, which is the reason for low removal of TN compared to NH4+-N. Current findings are consistent with this. In addition, the removal rate of TP in the current study was lower due to the low influent concentration of TP (0.5 mg/L). Moreover, the average removal rate of each pollutant after passing through the transition and the drainage layer was limited, and the pollutants have been effectively removed after passing through the 500 mm filter layer. It shows that the filter layer is very crucial for the water quality effect of the bioretention system.
3.3. Particle Size Distribution of Each Structural Layer Filler during Operation
3.3.1. Changes in Particle Size Distribution in Filler Layer
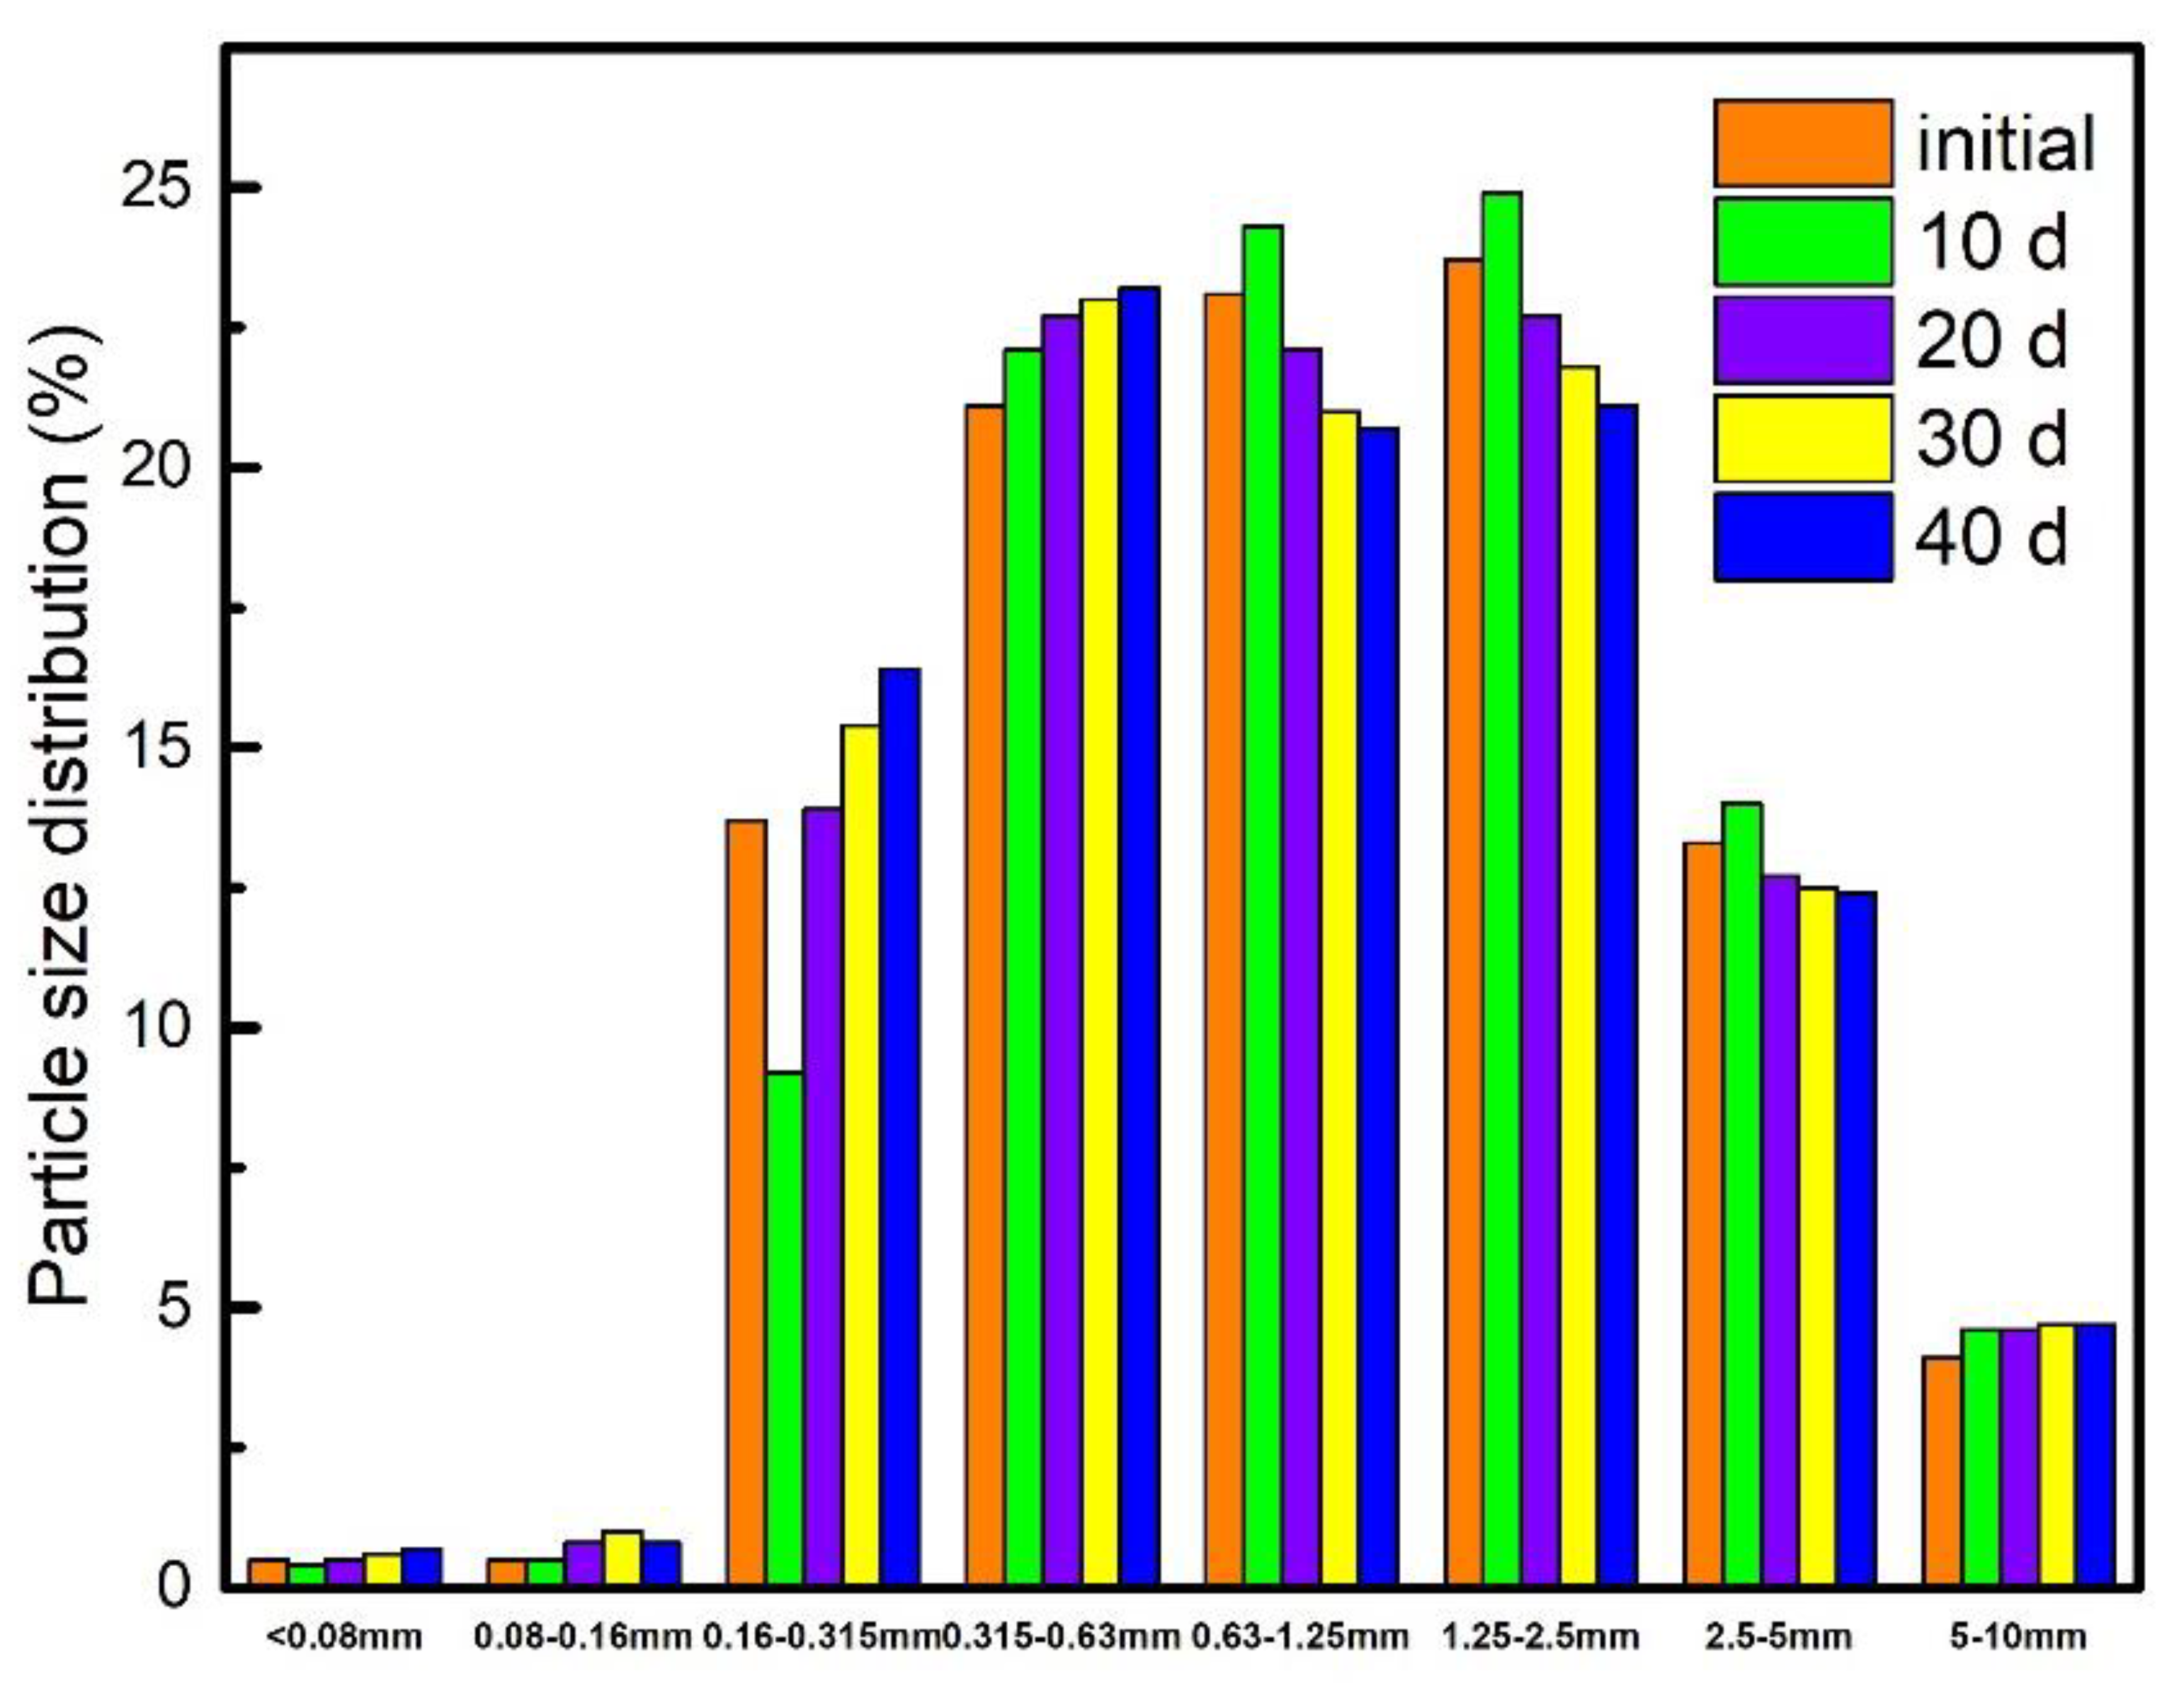
The particle size distribution of the filter layer (0–50 mm) during the operation of the bioretention is shown in Figure 4. It could be seen that the proportion of fillers in the particle size range of 5–10 mm, 2.5–5 mm, 1.25–2.5 mm, and 0.63–1.25 mm showed an increasing trend, and the increase was larger in the initial stage of operation. The proportion of fillers in the particle size range of 0.315–0.63 mm, 0.16–0.315 mm, 0.08–0.16 mm, and <0.08 mm showed a gradual decline. During operation, the proportion of filler in the filter layer below 0.63 mm decreased, and mainly concentrated in the range of 0.16–0.63 mm. The magnitude of the change in particle size distribution from 0–10 days was greater than the change in particle size distribution over the same period of time after 10 days of operation.
The reason behind this particle size distribution trend in the filter layer is that the internal structure of the bioretention system was unstable in the initial stage of operation (0–10 days), and the amount of the filler moves down with the runoff. After 10 days of operation, the internal structure tends to be stable, and the amount of filler that migrates under the same influent load becomes smaller. The filler with particle size less than 0.63 mm is easy to move downward with the runoff. The filler with larger particle size has stronger stability and is not easy to move down with the runoff. Therefore, the filler with the particle size range below 0.63 mm moves downward during the operation of the bioretention system. The amount of the shifting of the filler in the particle size range of 0.16–0.63 mm was large, which changes the internal microstructure of the retaining system.
3.3.2. Change of Particle Size Distribution of Transition Layer Filler
The particle size distribution of the transition layer filler during the operation of the bioretention system is shown in Figure 5. It could be seen that the proportion of the filler in the particle size range of 5–10 mm was basically unchanged after the first increase, and the operation of 10 days increased by 0.5% compared with that before the operation, while the proportion of the operation of 40 days and the operation of 10 days only increased by 0.1%. The fillers in the 2.5–5 mm, 1.25–2.5 mm, and 0.63–125 mm particle size ranges increased from the pre-operation to the 10 days stage of operation, and then the proportion decreased, and the decrease gradually decreased. The fillers in the range of 0.315–0.63 mm and 0.16–0.315 mm showed a gradual increase, and the amount of increase gradually decreased. The fillers in the 0.08–0.16 mm and <0.08 mm particle size range showed a tendency to decrease at first and then increase.
The possible reason for the change of the particle size distribution of the transition layer filler could be that the internal structure of the bioretention system was unstable at the initial stage of operation, and the fillers of each particle size range in the filter layer and the transition layer moved down. The fillers with the particle sizes of 5–10 mm, 2.5–5 mm, 1.25–2.5 mm, 0.63–125 mm, and 0.315–0.63 mm showed an upward trend at the initial stage (0–10 days). The filler of transition layer, especially with a particle size of <0.315 mm, moved down to the drainage layer, resulting in a decrease in the proportion of fillers in the ranges of 0.16–0.315 mm, 0.08–0.16 mm, and <0.08 mm. After running for a period of time (0–10 days), the internal structure of the bioretention system was stable, the transition layer filler no longer moved down to the drainage layer, while the filter layer filler moved down, and the particle size distribution was below 0.63 mm. The downward moving filter layer filler was intercepted by the transition layer, so that the proportion of fillers in the particle size ranges of 5–10 mm, 2.5–5 mm, 1.25–2.5 mm, and 0.63–1.25 mm were reduced. The proportion of fillers in the particle size ranges of 0.315–0.63 mm, 0.16–0.315 mm, 0.08–0.16 mm, and <0.08 mm increased (Figure 5). As the running time increases, the internal structure of the bioretention system becomes more stable, and the change in the particle size distribution of the transition layer gets smaller.
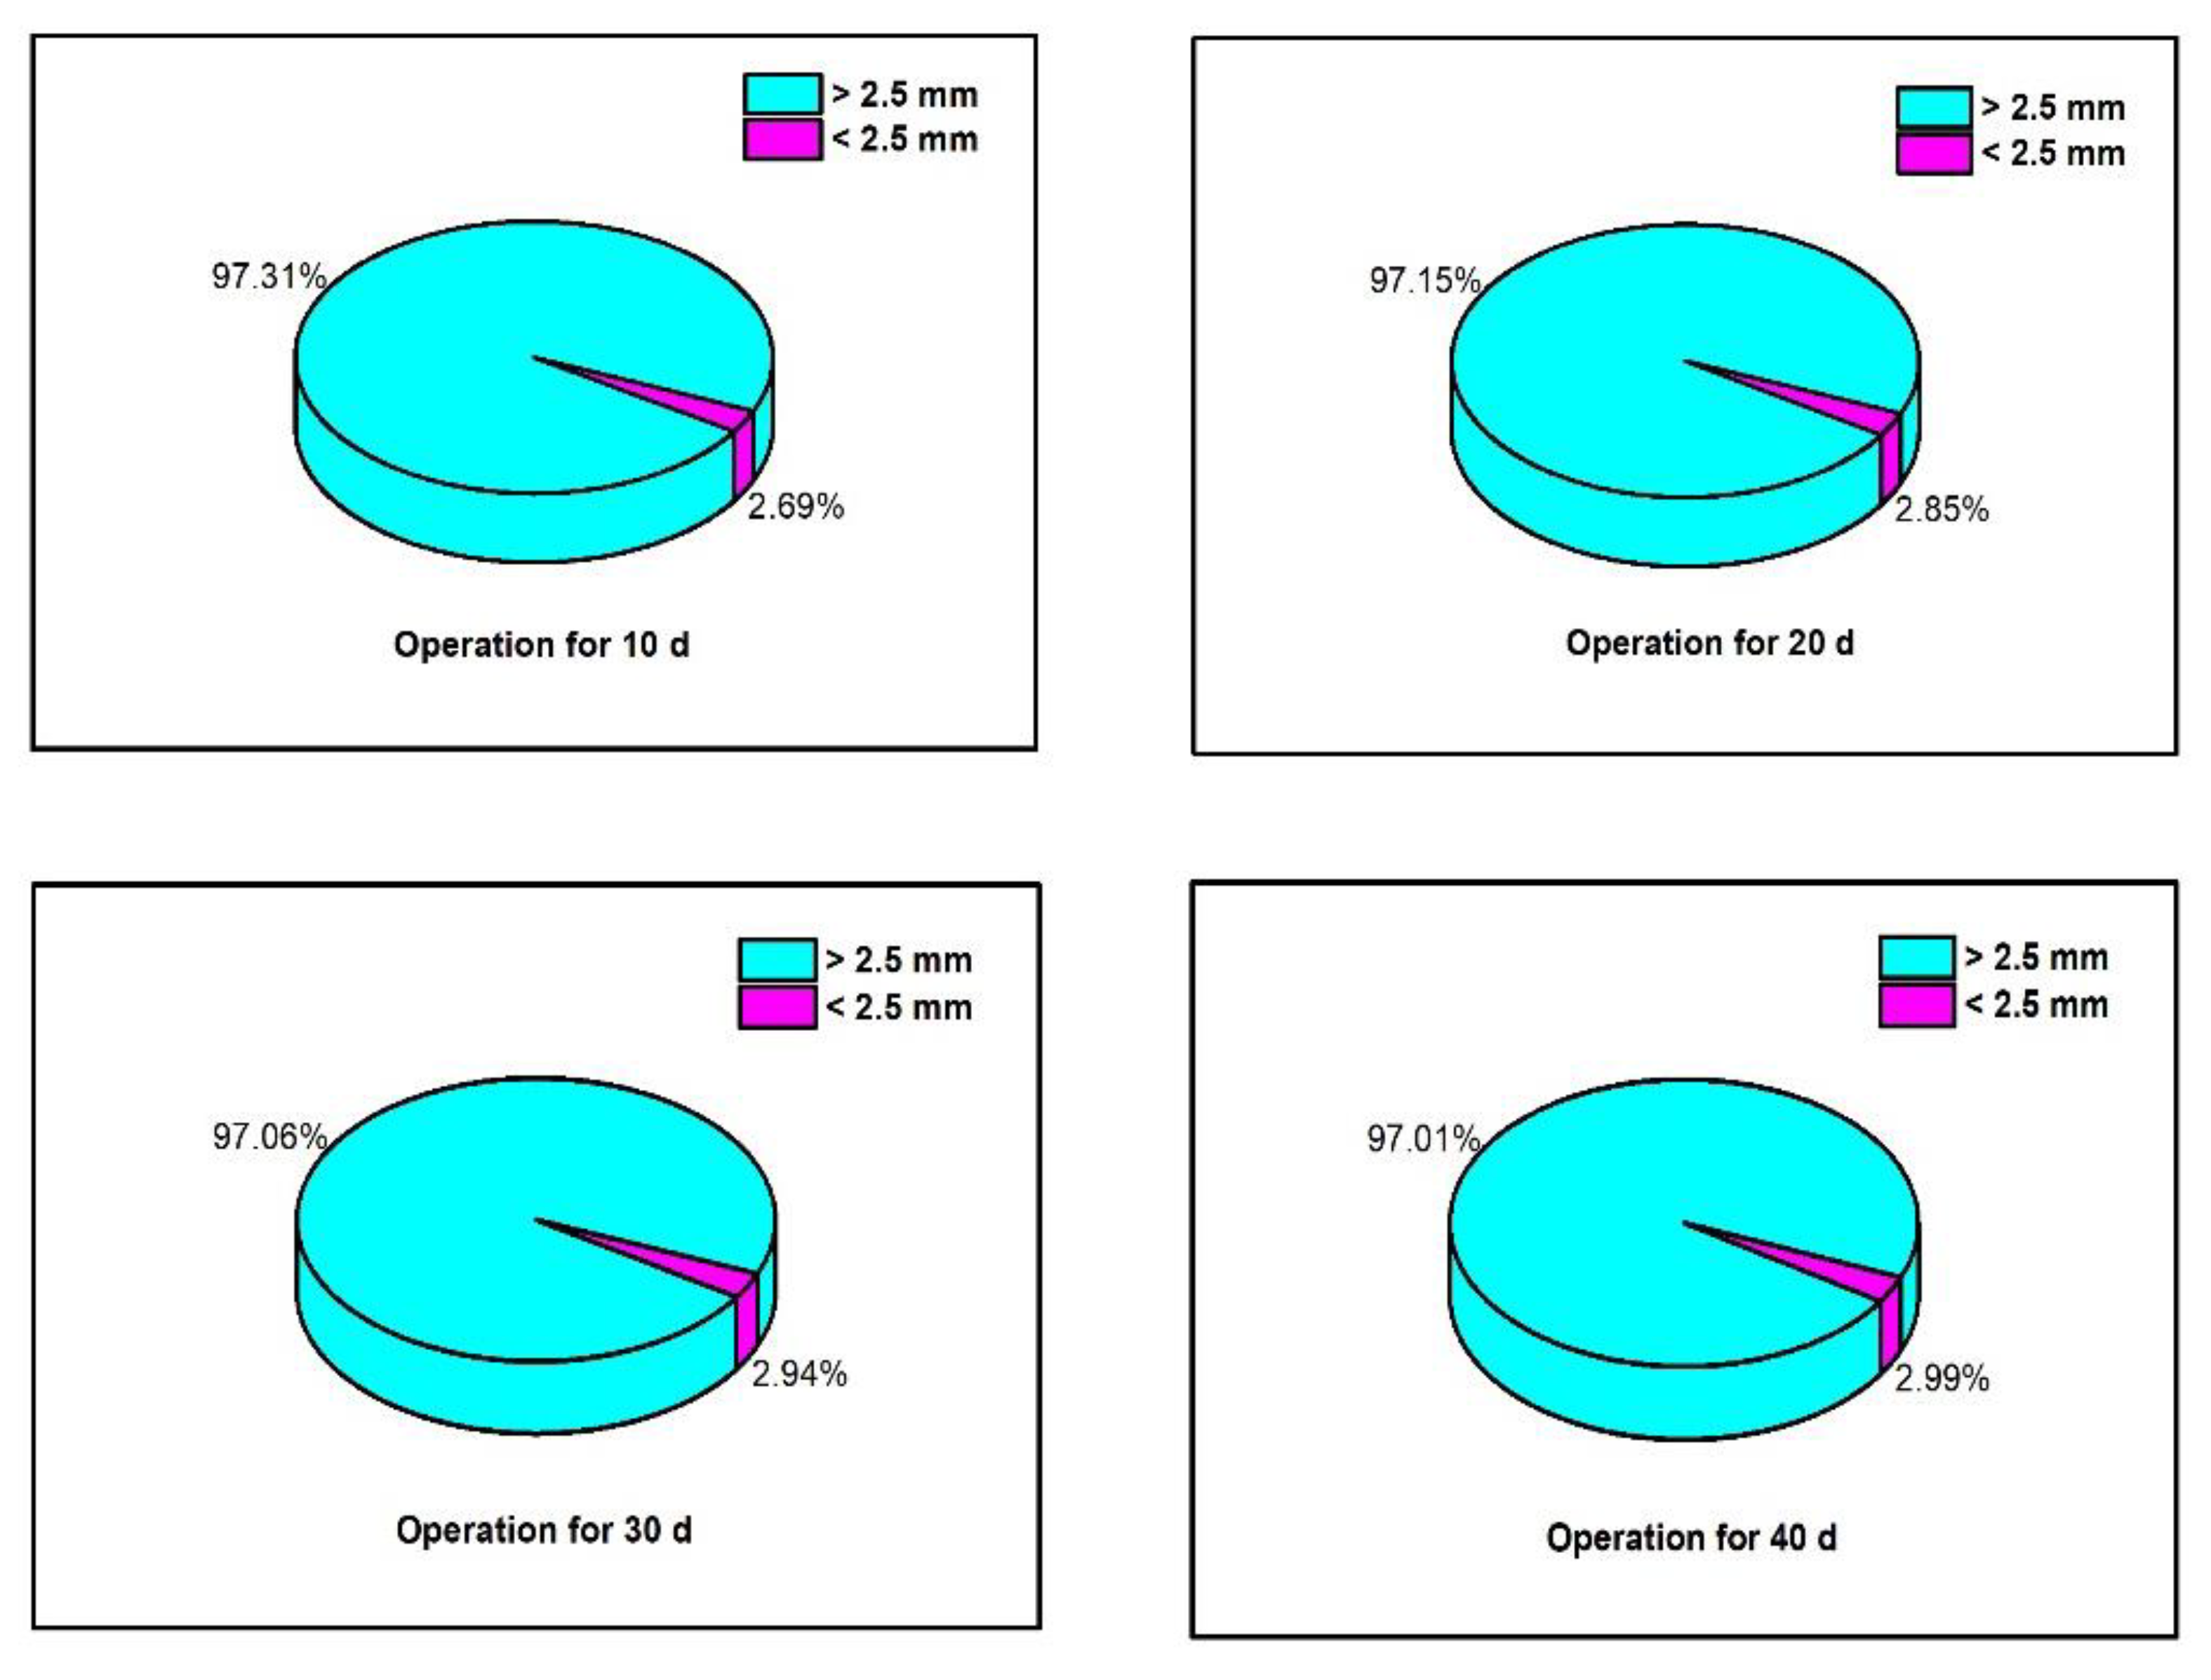
The particle size distribution of the drainage layer filler during the operation of the bioretention system was shown in Table 6 and Figure 6. It could be seen that the particle size distribution of the drainage layer varied greatly in the initial stage of operation. The specific filler with particle size >2.5 mm decreased by 2.69%, while it decreased by 0.30% during the operation period of 10–40 days. The fillers with particle size <2.5 mm increased after 10 days, but they did not exceed 0.80%, and then fluctuated within 0.05%. The change of pattern in the particle size distribution in drainage layer filler occurs due to the unstable internal structure of the bioretention system at the initial stage of operation, and the filler with the transition layer particle size <2.5 mm moves down with the runoff, resulting in an increase in the proportion of filler in the particle size range of the drainage layer. After a stable operation, the transition layer can effectively intercept the filter layer and move the filler downward, but filler material might not move substantially. Therefore, the filler with a small particle size in the drainage layer has a slight increase. During the operation of the bioretention cell, the filler with a particle size distribution of 0.16–0.63 mm moved down with the runoff. After 40 days of operation, the proportion of filler in the particle size range increased by 5.0%. The transition layer can effectively intercept the fine particle filler moving down in the filter layer, prevent the filler from entering the drainage layer, and then flow out with the perforated drainage pipe, or blocking the perforated drainage pipe, to ensure long-term stable operation of the bioretention system.
Findings in this study revealed that the role of all three layers of bioretention systems have great importance in selection of the filler layer structure in the bioretention systems. Based on these findings, future research could be focused on simplifying the bioretention structure and reducing the construction costs, while ensuring long-term performance. However, the influence of plant and temperature was not taken into consideration in the current study, and needs further research.
4. Conclusions
The current study shows that the transition layer and drainage layer play an important role in runoff control. Results reveal that if the filler materials and dimensions of these two layers need to be changed during structural optimization, the total height of the filler layer should not be < 800 mm. The filter layer plays a vital role in reducing runoff pollution. The thickness of the filter layer should not be less than 500 mm when optimizing the structure. Whereas, the transition layer has the function of preventing the filler loss of the filter layer. The filter material, with particle size, mainly within 0.16–0.63 mm, moved down to the transition layer, and the particle size distribution of the drainage layer changed slightly after prolonged operation.
Author Contributions
Conceptualization, D.F., F.Y., S.L., C.Z., and R.P.S.; methodology, D.F., F.Y., and S.L.; software, F.Y., S.L.; validation, F.Y., S.L., and R.P.S.; formal analysis, F.Y., S.L.; investigation, F.Y., S.L.; resources, D.F.; data curation, F.Y., S.L., and R.P.S.; writing—original draft preparation, R.P.S., F.Y.; writing—review and editing, R.P.S., F.Y., and C.Z.; visualization, R.P.S., F.Y.; supervision, D.F., R.P.S., and C.Z.; project administration, D.F.; funding acquisition, D.F. All authors have read and agreed to the published version of the manuscript.
Funding
This work was financially supported by the National Key Research & Development Program of China (Grant No. 2018YFC0809900).
Acknowledgments
Authors would like to thank Southeast University and Kunshan Construction Engineering Quality Testing Center, Kunshan, China, for providing necessary facilities and support.
Conflicts of Interest
The authors declare no conflict of interest.
References
- Wu, X.J.; Li, H.E.; Li, J.K.; Li, Q.K.; Dong, W. Study on water quality monitoring scheme based on non-point source pollution. Environ. Sci. 2013, 34, 2146–2150. [Google Scholar]
- US Environmental Protection Agency (US EPA). National Water Quality Inventory, Report to Congress Executive Summary; US EPA: Washington, DC, USA, 1995.
- Guan, D.B.; Hubacek, K.; Tillotson, M.; Zhao, H.Y.; Liu, W.D.; Liu, Z.; Liang, S. Lifting China’s Water Spell. Environ. Sci. Technol. 2014, 48, 11048–11056. [Google Scholar] [CrossRef] [PubMed] [Green Version]
- Li, Z.Z.; Dong, M.J.; Tony, W.; Wang, J.B.; Kumar, A.J.; Singh, R.P. Objectives and indexes for implementation of Sponge Cities—A case study of Changzhou City, China. Water 2018, 10, 623. [Google Scholar] [CrossRef] [Green Version]
- Monash University. Adoption Guidelines of Sormwater Biofiltration Systems; Facility for Water Biofiltration; Monash University: Melbourne, Australia, 2009. [Google Scholar]
- Zhang, J.Y.; Fu, D.F.; Wang, Y.J.; Singh, R.P. Detailed Sponge City planning based on hierarchical fuzzy decision-making: A case study on Yangchen Lake. Water 2017, 9, 903. [Google Scholar] [CrossRef] [Green Version]
- Muthanna, T.M.; Viklander, M.; Gjesdahl, N.; Thorolfsson, S. Heavy metal removal in cold climate bioretention. Water Air Soil Pollut. 2007, 183, 391–402. [Google Scholar] [CrossRef]
- Blecken, G.T.; Zinger, Y.; Muthanna, T.M.; Deletic, A.; Fletcher, T.D.; Viklander, M. The influence of temperature on nutrient treatment efficiency in stormwater biofilter systems. Water Sci. Technol. 2007, 56, 83–91. [Google Scholar] [CrossRef]
- Davis, A.P.; Hunt, W.F.; Traver, R.; Clar, M. Bioretention technology: Overview of current practice and future needs. J. Environ. Eng. 2009, 135, 109–117. [Google Scholar] [CrossRef]
- Roy-Poirier, A.; Champagne, P.; Filion, Y. Bioretenton processes for phosphorus pollution control. Environ. Rev. 2010, 18, 159–173. [Google Scholar] [CrossRef]
- Battini, F.; Gronlund, M.; Agnolucci, M.; Giovannetti, M.; Jakobsen, I. Facilitation of phosphorus uptake in maize plants by mycorrhizosphere bacteria. Sci. Rep. 2017, 7, 4686. [Google Scholar] [CrossRef]
- Reddy, K.R.; Xie, T.; Dastgheibi, S. Removal of heavy metals from urban stormwater runoff using different filter materials. J. Environ. Chem. Eng. 2014, 2, 282–292. [Google Scholar] [CrossRef]
- Wu, X.; Cui, P. Research of Campus Landscape Design Based on The Rainwater Collection and Utilization—A case study of Changan Campus of Northwest University. Ground Water 2015, 05, 168–171. (In Chinese) [Google Scholar]
- Davis, A.P. Field performance of bioretention: Hydrology impacts. J. Hydrol. Eng. 2008, 13, 90–95. [Google Scholar] [CrossRef] [Green Version]
- Brown, R.A.; Hunt, W.F. Bioretention performance in the upper coastal plain of North Carolina. In Proceedings of the International Workshop on Middleware for Grid Computing, Leuven, Belgium, 1–5 December 2008. [Google Scholar]
- Jiang, C.B.; Li, J.K.; Zhang, B.H.; Ruan, T.S.; Li, H.E.; Dong, W. Design parameters and treatment efficiency of a retrofit bioretention system on runoff nitrogen removal. Environ. Sci. Pollut. Res. 2018, 25, 33298–33308. [Google Scholar] [CrossRef] [PubMed]
- Poor, C.J.; Conkle, K.; Macdonald, A.; Duncan, K. Water Treatment Residuals in Bioretention Planters to Reduce Phosphorus Levels in Stormwater. Environ. Eng. Sci. 2019, 36, 265–272. [Google Scholar] [CrossRef]
- Jiang, C.B.; Li, J.K.; Zhang, B.H.; Li, H.E. Phosphorus removal of retrofit bioretention systems on urban surface runoff. Desalin. Water Treat. 2018, 126, 239–247. [Google Scholar] [CrossRef]
- Sezar, G.; Lmaz-Alhan, C.M. Hydrological Model of LID with Rainfall-Watershed-Bioretention System. Water Resour. Manag. 2017, 31, 1931–1946. [Google Scholar]
- Subramaniam, D.N.; Mather, P.B. Preliminary stabilisation of stormwater biofilters and loss of filter material. Water Sci. Technol. 2016, 74, 787–795. [Google Scholar] [CrossRef] [PubMed] [Green Version]
- Ayers, E.M.; Kangas, P. Soil Layer Development and Biota in Bioretention. Water 2018, 10, 1587. [Google Scholar] [CrossRef] [Green Version]
- Gao, J.P.; Pan, J.K.; Xie, Y.C. Effects of bioretention structural layer parameters on detention and retention for road runoff. Adv. Water Sci. 2017, 28, 702–711. (In Chinese) [Google Scholar]
- Pan, G.Y.; Xia, J.; Zhang, X.; Wang, H.P.; Liu, E.M. Research on simulation test of hydrological effect of bio-retention units. Water Resour. Power 2012, 30, 13–15. (In Chinese) [Google Scholar]
- Zhang, J.; Zhang, S.; Bai, S.Y.; Hua, J.; Nie, Y.S. Study on hydrological effects and pollutant removal of bioretention systems. Environ. Eng. 2015, 33, 17–21. (In Chinese) [Google Scholar]
- Li, H.; Davis, A.P. Urban Particle Capture in Bioretention Media. I: Laboratory and Field Studies. J. Environ. Eng. 2008, 134, 409–418. [Google Scholar] [CrossRef]
- Li, H.; Davis, A.P. Urban Particle Capture in Bioretention Media. II: Theory and Model Development. J. Environ. Eng. 2008, 134, 419–432. [Google Scholar] [CrossRef]
- William, R.; Gardoni, P.; Stillwell, A.S. Reliability-Based Approach to Investigating Long-Term Clogging in Green Stormwater Infrastructure. J. Sustain. Water Built Environ. 2019, 5, 04018015. [Google Scholar] [CrossRef]
- Hwang, Y.; Seo, Y.; Kim, H.; Roh, K.; Kim, D. Evaluation of solids removal and optimization of backwashing for an upflow stormwater filtration system utilizing novel floating fibrous media. Environ. Technol. 2019. [Google Scholar] [CrossRef]
- Gulbaz, S.; Kazezyilmaz-Alhan, C.M. Experimental Investigation on Hydrologic Performance of LID with Rainfall-Watershed-Bioretention System. J. Hydrol. Eng. 2017, 22, D4016003. [Google Scholar] [CrossRef]
- Wang, M.; Zhang, D.Q.; Lou, S.W. Assessing Hydrological Effects of Bioretention Cells for Urban Stormwater Runoff in Response to Climatic Changes. Water 2019, 11, 997. [Google Scholar] [CrossRef] [Green Version]
- Hunt, W.F.; Jarrett, A.R.; Smith, J.T.; Sharkey, J. Evaluating bioretention hydrology and nutrient removal at three field sites in North Carolina. J. Irrig. Drain. Eng. ASCE 2006, 132, 600–608. [Google Scholar] [CrossRef]
- Ding, B.; Rezanezhad, F.; Gharedaghloo, B.; Cappellen, P.V.; Passeport, E. Bioretention cells under cold climate conditions: Effects of freezing and thawing on water infiltration, soil structure, and nutrient removal. Sci. Total Environ. 2019, 649, 749–759. [Google Scholar] [CrossRef]
- Keller, G.R. Application of Geosynthetics on Low-Volume Roads. Transp. Geotech. 2016, 8, 119–131. [Google Scholar] [CrossRef]
- Singh, R.P.; Zhao, F.; Ji, Q.; Saravanan, J.; Fu, D.F. Design and Performance Characterization of Roadside Bioretention Systems. Sustainability 2019, 11, 2040. [Google Scholar] [CrossRef] [Green Version]
- Davis, A.P.; Shokouhian, M.; Sharma, H.; Minami, C. Water quality improvement through bioretention media: Nitrogen and phosphorus removal. Water Environ. Res. 2006, 78, 284–293. [Google Scholar] [CrossRef] [PubMed]
Figure 1.
Schematic of bioretention units for hydrologic performance experiments.

Figure 2.
Schematic of bioretention units for water quality performance experiments.

Figure 3.
Concentration of CODcr, NH4+-N, TN, and TP from different outlets of the same bioretention system.
Figure 3.
Concentration of CODcr, NH4+-N, TN, and TP from different outlets of the same bioretention system.

Figure 4.
Change in particle size distribution of filter layer (0–50 mm) during operation.

Figure 5.
Change in particle size distribution of transition layer filler during operation.

Figure 6.
Change in particle size distribution of drainage layer filler during operation.


Table 1.
Simulated water sample preparation method and index determination method.
| Pollutants | Chemicals/Reagents | Concentration (mg/L) | Methods |
|---|---|---|---|
| CODcr | Glucose | 200 | Dichromate method |
| TP | Potassium dihydrogen phosphate | 0.5 | Potassium persulfate digestion-molybdenum and antimony anti-spectrophotometry |
| TN | 7 | Potassium persulfate oxidation-Ultraviolet spectrophotometry | |
| NH4+-N | Ammonium chloride | 5 | Nessler reagent photometry |
| NO3−-N | Potassium nitrate | 2 | - |
Table 2.
Runoff control effects of each bioretention units under different rainfall intensities.
| A1 | Outflow Start Time | Overflow Start Time | Runoff Control Rate | Runoff Reduction Rate |
| 0.5 a, 60 min | 14 min | 38.5 min | 85.1% | 27.8% |
| 2 a, 60 min | 14 min | 24 min | 71.6% | 29.3% |
| 10 a, 60 min | 12 min | 17 min | 61.5% | 30.2% |
| 50 a, 60 min | 11.5 min | 11 min | 43.4% | 30.9% |
| A2 | Outflow Start Time | Overflow Start Time | Runoff Control Rate | Runoff Reduction Rate |
| 0.5 a, 60 min | 6 min | 35 min | 83.0% | 21.8% |
| 2 a, 60 min | 6 min | 23 min | 70.0% | 22.8% |
| 10 a, 60 min | 5.5 min | 16.5 min | 60.6% | 23.7% |
| 50 a, 60 min | 5 min | 10 min | 40.2% | 24.5% |
| A3 | Outflow Start Time | Overflow Start Time | Runoff Control Rate | Runoff Reduction Rate |
| 0.5 a, 60 min | 10 min | 28 min | 75.4% | 17.8% |
| 2 a, 60 min | 10 min | 16.5 min | 61.9% | 21.1% |
| 10 a, 60 min | 10 min | 12 min | 54.2% | 21.9% |
| 50 a, 60 min | 9.5 min | 8.5 min | 38.9% | 23.1% |
Table 3.
Runoff control effects of each bioretention units under different rainfall durations.
| A1 | Outflow Start Time | Overflow Start Time | Runoff Control Rate | Runoff Reduction Rate |
| 60 min | 12.5 min | 39 min | 87.2% | 29.1% |
| 30 min | 13.5 min | 100% | 36.5% | |
| 15 min | 13 min | 100% | 43.0% | |
| A2 | Outflow Start Time | Overflow Start Time | Runoff Control Rate | Runoff Reduction Rate |
| 60 min | 6 min | 36.5 min | 83.9% | 22.1% |
| 30 min | 6 min | 100% | 30.3% | |
| 15 min | 6 min | 100% | 33.2% | |
| A3 | Outflow Start Time | Overflow Start Time | Runoff Control Rate | Runoff Reduction Rate |
| 60 min | 11 min | 27 min | 77.1% | 18.7% |
| 30 min | 11 min | 28 min | 97.9% | 24.8% |
| 15 min | 11 min | 100% | 30.1% |
Table 4.
Control effects of runoff of each bioretention system under different rainfall intermittent periods.
Table 4.
Control effects of runoff of each bioretention system under different rainfall intermittent periods.
| A1 | Outflow StartTime | Overflow Start Time | Runoff Control Rate | Runoff reduction Rate |
| 1 day | 14 min | 42 min | 87.2% | 29.1% |
| 3 days | 13 min | 46 min | 90.8% | 30.4% |
| 7 days | 13 min | 100% | 32.7% | |
| A2 | Outflow StartTime | Overflow Start Time | Runoff Control Rate | Runoff Reduction Rate |
| 1 day | 6 min | 36.5 min | 83.9% | 22.1% |
| 3 days | 6 min | 42.5 min | 87.8% | 23.5% |
| 7 days | 6 min | 53 min | 97.3% | 25.3% |
| A3 | Outflow StartTime | Overflow Start Time | Runoff Control Rate | Runoff Reduction Rate |
| 1 day | 11 min | 27.5 min | 72.4% | 17.1% |
| 3 days | 11 min | 29 min | 75.6% | 20.5% |
| 7 days | 11.5 min | 35 min | 84.5% | 22.9% |
Table 5.
Concentration of effluent pollutants at different depths of bioretention system (unit: mg/L).
Table 5.
Concentration of effluent pollutants at different depths of bioretention system (unit: mg/L).
| 2 (100 mm) | 3 (300 mm) | 4 (500 mm) | 5 (600 mm) | 6 (800 mm) | ||||||
|---|---|---|---|---|---|---|---|---|---|---|
| Conc. | Removal Rate | Conc. | Removal Rate | Conc. | Removal Rate | Conc. | Removal Rate | Conc. | Removal Rate | |
| CODcr | 147 ± 3.46 | 26.5% | 87 ± 2.65 | 56.5% | 36 ± 2.52 | 82.0% | 30 ± 2.00 | 85.0% | 28 ± 2.00 | 86.0% |
| NH4+-N | 3.16 ± 0.14 | 35.0% | 1.78 ± 0.07 | 63.4% | 1.00 ± 0.01 | 79.4% | 0.88 + 0.05 | 81.9% | 0.71 ± 0.06 | 85.4% |
| TN | 4.83 ± 0.04 | 29.4% | 2.60 ± 0.03 | 62.0% | 2.15 ± 0.03 | 68.6% | 2.08 ± 0.03 | 69.6% | 1.93 ± 0.03 | 71.8% |
| TP | 0.44 ± 0.03 | 12.0% | 0.31 ± 0.03 | 38.0% | 0.23 ± 0.01 | 54.0% | 0.19 ± 0.01 | 62.0% | 0.16 ± 0.02 | 68.0% |
Table 6.
Change in particle size distribution of drainage layer filler during operation.
| Initial | Run 10 Days | Run 20 Days | Run 30 Days | Run 40 Days | |
|---|---|---|---|---|---|
| <0.08 mm | - | 0.03% | 0.04% | 0.05% | 0.07% |
| 0.08–0.16 mm | 0.03% | 0.04% | 0.04% | 0.07% | |
| 0.16–0.315 mm | 0.52% | 0.56% | 0.58% | 0.58% | |
| 0.315–0.63 mm | 0.69% | 0.75% | 0.78% | 0.71% | |
| 0.63–1.25 mm | 0.64% | 0.72% | 0.76% | 0.78% | |
| 1.25–2.5 mm | 0.77% | 0.74% | 0.73% | 0.77% | |
| 2.5–10 mm | 100% | 97.31% | 97.15% | 97.06% | 97.01% |
© 2020 by the authors. Licensee MDPI, Basel, Switzerland. This article is an open access article distributed under the terms and conditions of the Creative Commons Attribution (CC BY) license (http://creativecommons.org/licenses/by/4.0/).
Share and Cite
MDPI and ACS Style
Yang, F.; Fu, D.; Liu, S.; Zevenbergen, C.; Singh, R.P. Hydrologic and Pollutant Removal Performance of Media Layers in Bioretention. Water 2020, 12, 921. https://doi.org/10.3390/w12030921
AMA Style
Yang F, Fu D, Liu S, Zevenbergen C, Singh RP. Hydrologic and Pollutant Removal Performance of Media Layers in Bioretention. Water. 2020; 12(3):921. https://doi.org/10.3390/w12030921
Chicago/Turabian StyleYang, Feikai, Dafang Fu, Shuang Liu, Chris Zevenbergen, and Rajendra Prasad Singh. 2020. "Hydrologic and Pollutant Removal Performance of Media Layers in Bioretention" Water 12, no. 3: 921. https://doi.org/10.3390/w12030921
Note that from the first issue of 2016, this journal uses article numbers instead of page numbers. See further details here.