Optimal Planning of Low-Impact Development for TSS Control in the Upper Area of the Cau Bay River Basin, Vietnam


Faculty of Water Resources Engineering, Thuyloi University, 175 Tay Son Street, Dong Da District, Ha Noi 116705, Vietnam
Water 2020, 12(2), 533; https://doi.org/10.3390/w12020533
Submission received: 25 December 2019
/
Revised: 5 February 2020
/
Accepted: 11 February 2020
/
Published: 14 February 2020
(This article belongs to the Special Issue Case Studies of Green Infrastructure Adoption)
Abstract
:Recently, an increase in impervious area induced by the process of urbanization has significantly affected the quantity and quality of urban surface runoff. Among the pollutants of the storm flow, total suspended solids (TSS) are an extremely important cause of water quality deterioration. This paper aims to use the integrated nondominated sorting genetic algorithm (NSGA II)–Storm Water Management Model (SWMM) method to find optimal Low-Impact Development (LID) plans which ensure maximum TSS load reduction and minimum total relative cost. Green roofs, permeable pavements, and tree boxes with fixed parameters and unit costs were considered for seeking optimal planning alternatives in the Cau Bay river basin. The optimization process yielded a cost–effectiveness curve, which relates cost of LID implementation with its corresponding TSS reduction efficiencies. The advantage of the optimization approach was clarified when, with a defined cost of LID implementation, there was a significant difference in TSS reduction efficiencies between the optimal and non-optimal alternatives. The increase in return periods of rainfall patterns not only resulted in a reduction in the TSS removal efficiencies of LID practices at the outfall of the study area, but also spatially changed in terms of the TSS removal efficiencies of the sub-catchments. The return period of the rainfall patterns utilized for LID design should not exceed 2 years. The simulation–multi-optimization approach facilitates integration of LID practice plans into the urban infrastructure master plans in Vietnam.
1. Introduction
In recent decades, an increase in impervious area induced by the process of urbanization has significantly affected the quantity and quality of urban surface runoff. The increased impervious area results in increased peak flow and reduced concentration time. During the dry weather period, pollutants such as sediments, nutrients, heavy metals, trace elements, and pathogens are built up on the watershed. When storms occur, the surface runoff washes off a significant amount of the pollutant loads from impervious areas, deteriorating the receiving water body at local and regional scales. Most of the pollutant load from urban areas is carried from events with a return period of less than 2 years [1]. Among the pollutants of the storm flow, Total Suspended Solids (TSS) are an extremely important cause of water quality deterioration, leading to esthetic issues, higher costs of water treatment, a decline in fishery resources, and serious ecological degradation of aquatic environments [2].
To deal with such an environmental issue, low impact development (LID) implementation has been considered an effective tool to remove pollutants of stormwater flow through detention, filtration, chemical adsorption, and biological processes [3]. LID is a green approach for managing both the quantity and quality of stormwater at a given site using decentralized micro-scale control measures [4,5]. Many studies have been conducted to evaluate the effectiveness of LID implementation for removing the TSS of the storm flow by using the experimental approach. Through doing an experiment with different media scenarios, Hsieh and Davis [6] proposed two media profiles for bioretention design to achieve TSS removal efficiency of more than 96%. Field research conducted by Hunt et al. [7] showed that bioretention could gain 60% TSS reduction efficiency, which is lower than results of previous experimental research. Hatt et al. [8] investigated the TSS removal efficiency of three field-scale biofiltration systems in two different climates, and concluded that TSS was effectively removed with load reductions generally in excess of more than 90%. Braswell et al. [9] indicated that the TSS removal efficiency of a series consisting of permeable interlocking concrete pavement and a proprietary box filter reached 96%. Abdollahian and Kazemi [10] pointed out that the TSS removal efficiency of permeable pavement was in the range of 47–69%. The event mean concentration reduction rate of suspended solids (SS) of all types of extensive green roofs ranged from 64.3–73.1% [11]. During the 16 months of the study, which included nine storm events, planted green roofs reduced TSS up to 83% [12]. Baek et al. [13] conducted a numerical assessment of LID effectiveness on TSS load reduction at a commercial site in Korea. The studies mentioned above were separately implemented at the site scale. However, it is challenging to evaluate the TSS removal efficiency of a combination of LID configurations at the basin scale. Therefore, it is necessary to establish a comprehensive approach which supports the identification of optimal LID alternatives at the basin scale.
Simulation–optimization approaches have previously been applied to evaluate the performance of LID implementation on controlling stormwater quantity and quality at the basin scale without spending significant effort in the design [5,13,14,15,16]. Multi-objective optimization yields trade-off solutions, which are the basis for stormwater professionals to conduct public consultation prior to choosing a final solution. Recently, a multi-objective optimization approach was coupled with the Storm Water Management Model (SWMM) for evaluating the performance of LID scenarios. Zare et al. [17] developed a multi-objective optimization method for urban runoff quality and quantity control using the nondominated sorting genetic algorithm (NSGA II) and SWMM in an urban watershed, with mixed green infrastructure types (rain barrel, porous pavement area, bioretention) and different land use areas as decision variables. Wu et al. [18] used NSGA II coupled with SWMM to find near-optimal combinations of GIs (bioretention, infiltration trench, and permeable pavement) that maximize PCB load reduction and minimize total relative cost at the watershed scale. However, the performance of various combinations of LID practices on TSS removal efficiency has not yet been sufficiently considered at the basin scale. Therefore, the NSGA II–SWMM method deserves to be applied to find optimal LID plans that maximize the TSS load reduction and minimize total relative cost at the basin scale.
In Vietnam, rapid urbanization without the corresponding sufficient installation of drainage facilities has resulted in serious degradation of receiving water bodies [19]. The water quality characteristics of almost all receiving water sources exceed the allowable limits, especially in the TSS parameter. Much effort has been made to mitigate pollution of water bodies, but LID practices have not yet been accounted for as a promising strategy to overcome such a problem. Several studies on LID implementation to control stormwater flow at the watershed scale have been conducted [20,21]. However, LID practices for water quality improvement have not yet been considered at either the site or the basin scale.
To fill in these gaps, this paper aims to (1) develop the integrated NSGA II-SWMM model to find optimal LID planning alternatives in urban basins that ensure maximum TSS load reduction and minimum total relative cost; and (2) evaluate optimal planning alternatives for the TSS control of a wide range of designed storm events for the Cau Bay river basin. The outcomes of the study facilitate the integration of LID practice plan into the urban infrastructure master plan in Vietnam.
2. Methods
2.1. Study Area
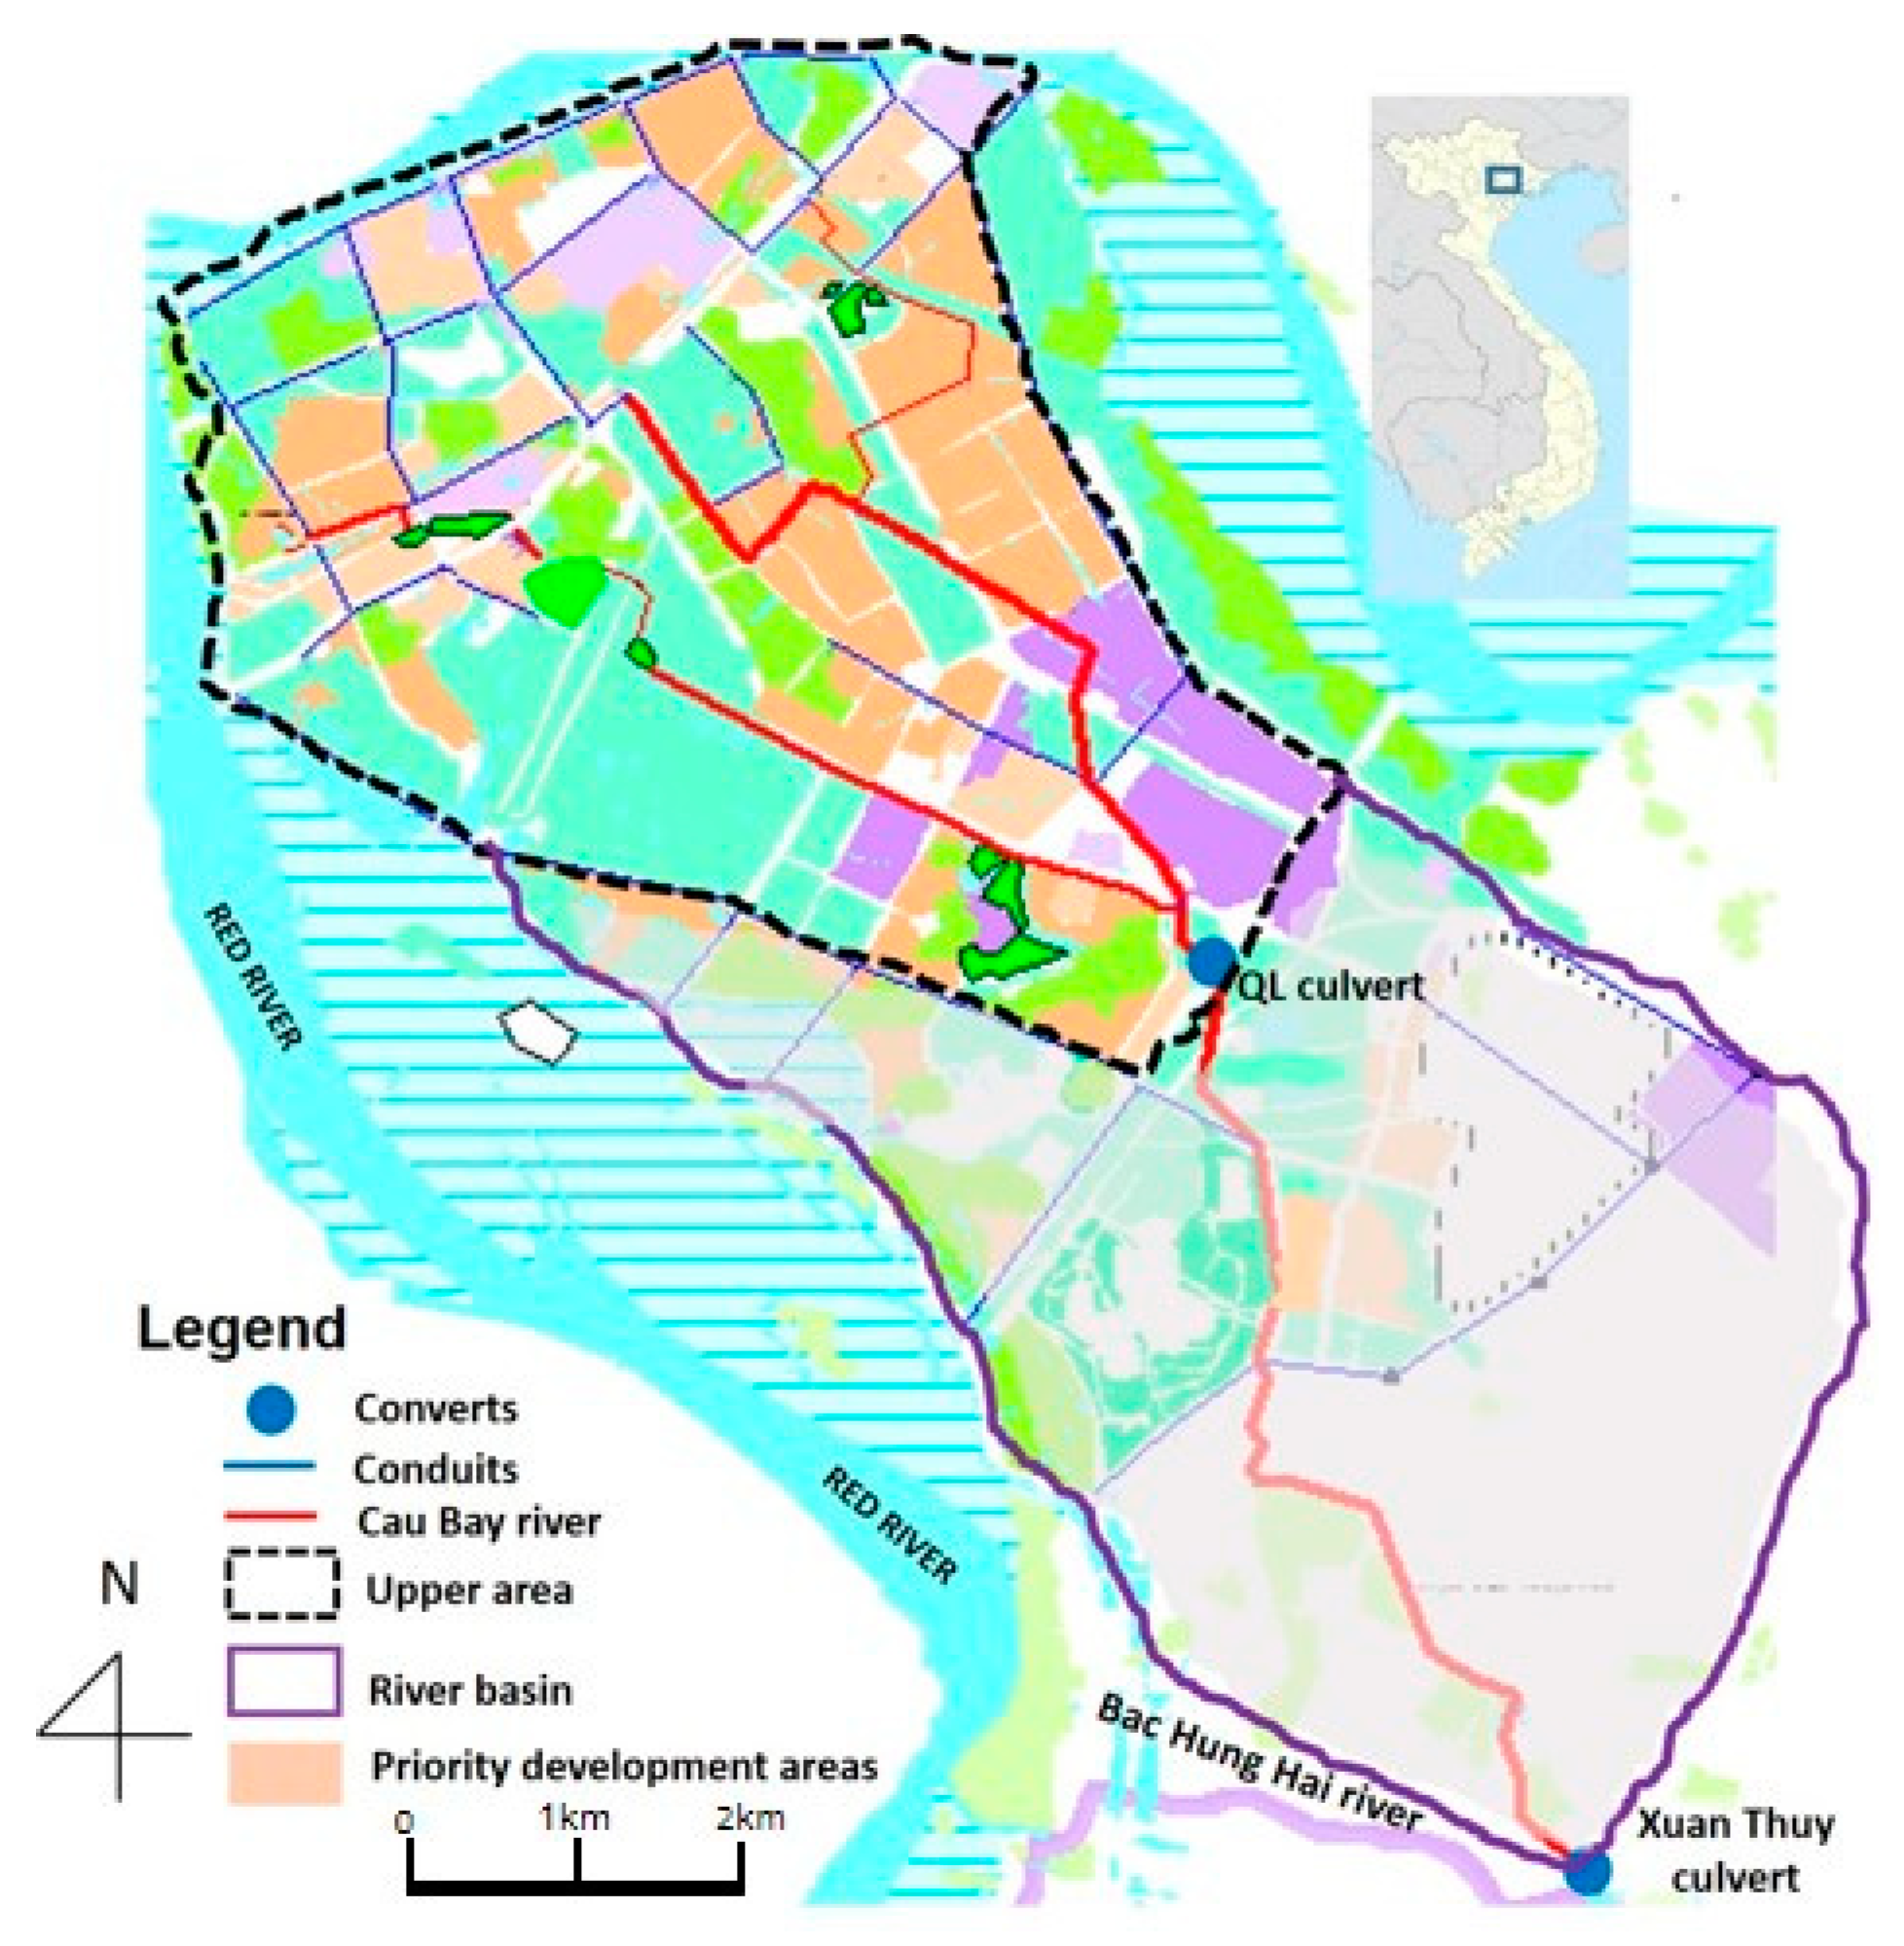
The Cau Bay river basin is located in the Long Bien and Gia Lam Districts, Ha Noi and drains to the Bac Hung Hai river at Xuan Thuy culvert (Figure 1). The drainage area of the basin is 5553 ha, and the gradient of the topography is from the Northwest to the Southeast. The ground elevation varies from +7.5 to +3.2 m (above sea level). Most of the soil in the study area comprises sand and silt, and the groundwater level is at least 7 m below the ground’s surface. The Cau Bay basin has a tropical monsoon climate; rainfall follows a seasonal pattern with a pronounced wet season that generally begins in May and can last until October, during which a mean of >80% of the annual rainfall occurs. In recent years, a significant amount of pervious area has been transformed into impervious area because of rapid urbanization. The land use includes residency (29.1%), commerce (11.8%), agriculture (42.4%), and recreational land (16.7%). The percentage of impervious sub-catchments ranges from 35% to 80%, which has induced an increase in both storm runoff and pollution concentration flushing into the Cau Bay river basin.
2.2. Hydrological Modeling
2.2.1. Baseline Condition Setup
This paper utilized SWMM 5.1 to evaluate variations in TSS removal efficiency versus change in LID scenarios and/or various storm events for the Cau Bay river basin. SWMM 5.1 is a dynamic rainfall–runoff model for continuous and single event simulation of runoff quantity and quality [22]. Surface runoff generated from a sub-catchment was calculated by using Manning’s equation. The Horton model was employed to quantify infiltration into the unsaturated soil zone of pervious sub-catchment areas. The TSS load of a sub-catchment was defined based on build-up and wash-off processes. The load of build-up was calculated as an exponential function, which depended on the number of preceding dry weather days and approached a maximum limit asymptotically. The amount of TSS wash-off from a given land use type during wet weather periods was expressed as an exponential function proportional to the product of runoff raised to some power and to the amount of build-up remaining. The dynamic wave method was selected as the routing method because of its ability to account for channel storage, backwater effects, entrance/exit losses, flow reversal, and pressurized flow. The designed rainfall patterns with different return periods were defined according to the Vietnamese standard of TCVN 7957 and the alternative block method [23]. Here, the rainfall duration was set as 3 h and the peak coefficient was set as 0.5.
Based on the land use and elevation planning maps, the study area was delineated into 122 non-uniform sub-catchments. The main parameters for sub-catchments were area, percentage of impervious area, width, slope, infiltration parameters, Manning’s roughness coefficients for overland flow for pervious and impervious surfaces, depression storage depth for pervious and impervious surfaces, percent zero, and internal routing parameters. Firstly, the sub-catchment properties were determined through GIS data, satellite imagery, the SWMM user’s manual, and site inspection, and the network of links and nodes was created based on sewer maps obtained from the Gia Lam District. Subsequently, these parameters were adjusted through a calibration process.
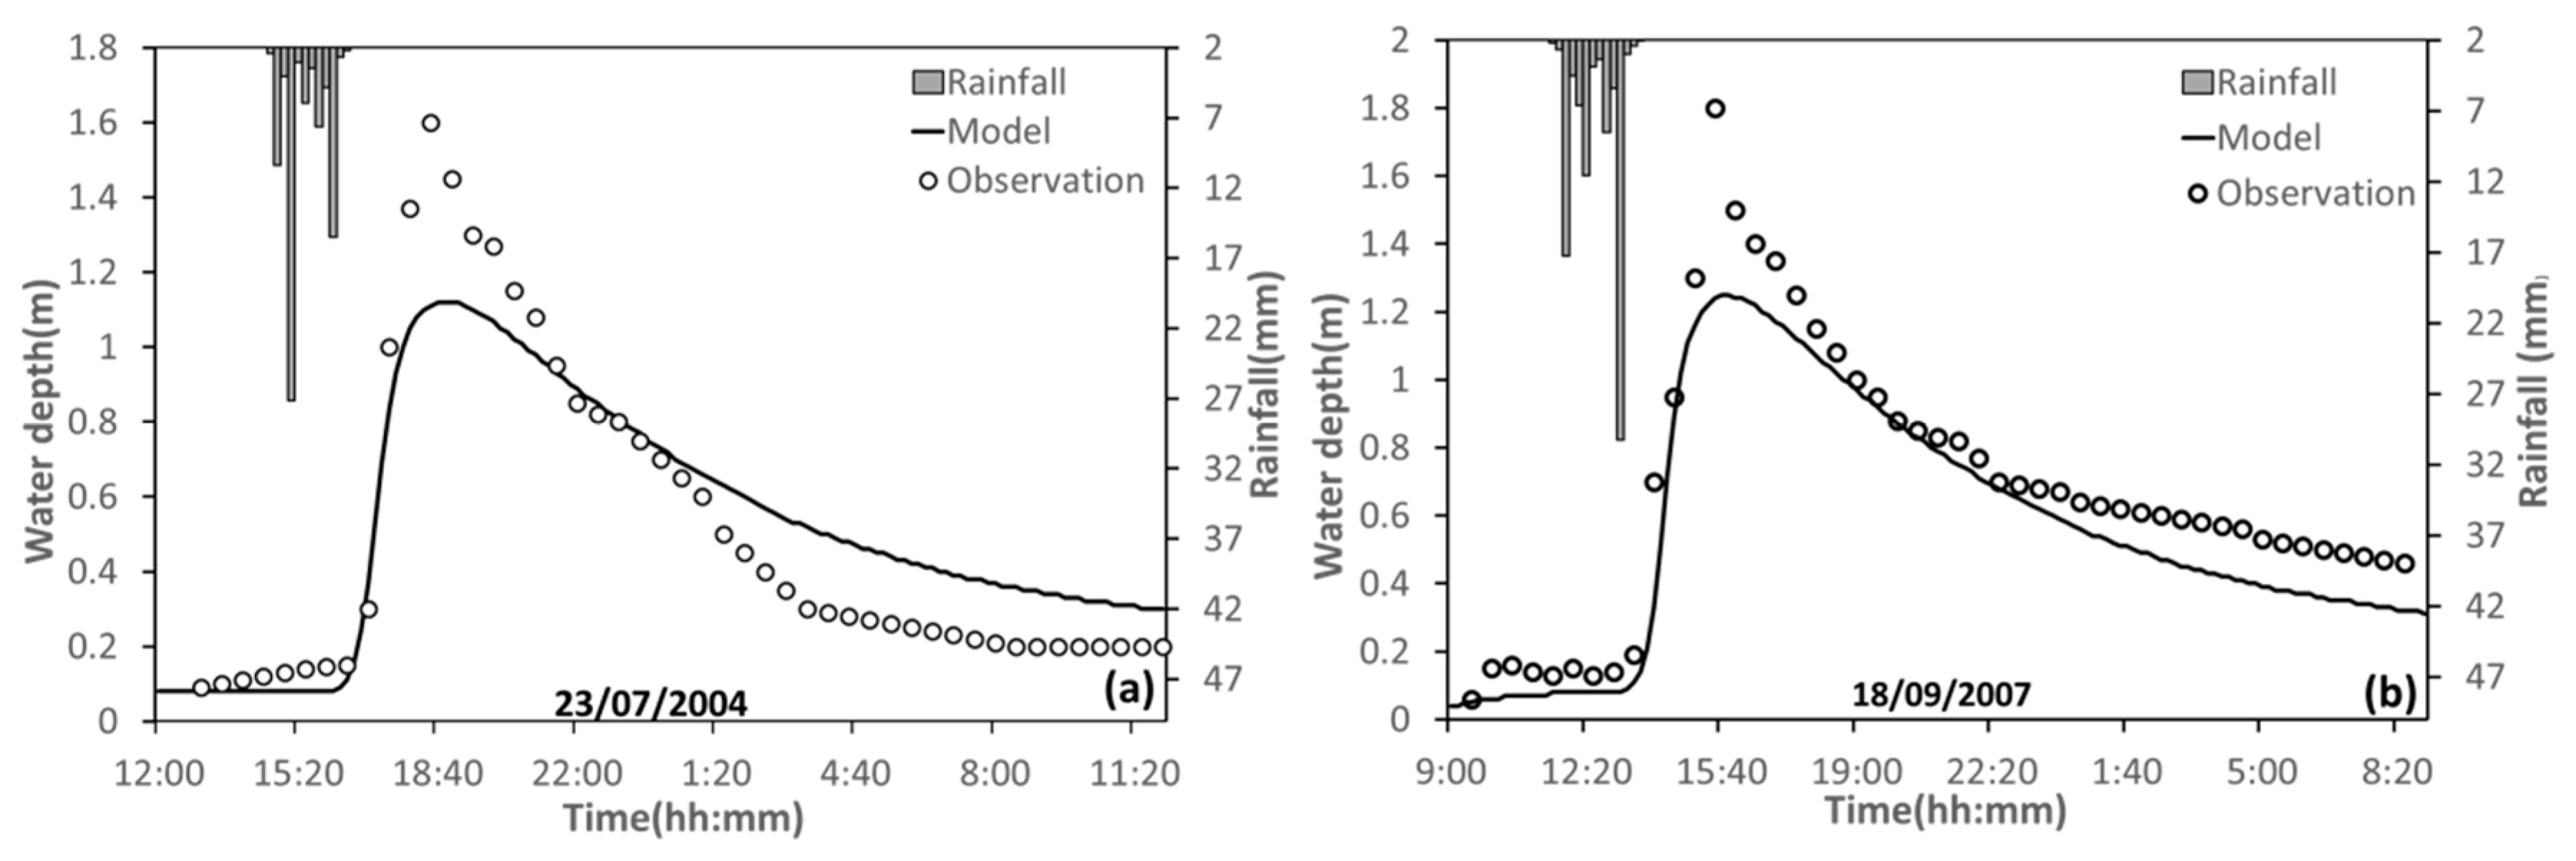
In this study, the calibration and validation processes were conducted by matching the simulated and observed water depths upstream of the Xuan Thuy culvert for two historical storm events of Trau Quy station (Figure 2). The storm events selected for the calibration and validation correspond to the availability of the observed water depth upstream of the Xuan Thuy culvert. Accordingly, rainfalls of 100.7 mm (occurred on 23 July 2004) and 112 mm (occurred on 18 September 2007) were used for the calibration and validation, respectively. Previous studies have used Manning’s roughness coefficient, depression storage depth, infiltration parameters, sub-catchment width, sub-catchments percent imperviousness, sub-catchment slope, percentage of impervious surfaces with no depression storage, and channel roughness values as calibration parameters [13,24,25]. The parameters of the model, including Manning’s roughness for both pervious areas, Manning’s roughness for conduits, and depth of depression storage on both impervious and pervious areas (Table 1), were calibrated through using the “trial and error” method, which adjusts the model parameters manually and evaluates the goodness of fit based on statistical criteria. The Nash–Sutcliffe efficiency, or NASH (Equation (1)) [26], was used for the assessment of the goodness of fit.
where Ho,i and Hm,i (m) are the observed and modeled depth values, respectively, and (m) is the observed mean depth value.
Accordingly, the NASH coefficiency values gained for calibration and validation were 0.86 and 0.81, respectively, both in the range of acceptable criteria.
Because the observed TSS concentration was unavailable, the calibration process for TSS concentration was impossible. The parameters set for the simulation of TSS load were the same as in the study of Tu and Smith [27]. The calibrated SWMM was used to generate flow and TSS loads under a 2-year, 3-h storm of 9.0 cm to utilize as the baseline, from which the effectiveness of any LID planning scenario was estimated. Although the model was validated for the Cau Bay River Basin, only the upper area was selected for optimization because of its rapid urbanization. The selected area included 95 of the 122 sub-catchments, with a total area of 3048 ha (Figure 1).
2.2.2. LID Controls
Through analysis of the urban plan, field survey, and public consultation, three LID types—including green roofs, tree boxes, and permeable pavements—were considered for implementation in the upper area of the Cau Bay river basin. Green roofs have a soil layer laying atop a special drainage material that conveys excess percolated rainfall off of the roof; permeable pavement systems are excavated areas filled with gravel and paved over with a porous concrete or asphalt mix; and tree boxes are small bio-retention systems that consist of a mix of functional components, each performing different functions in the removal of pollutants and in the attenuation of stormwater runoff installed beneath trees, especially when distributed throughout the site [22]. The green roofs were selected for the residential and commercial zones. The parking spaces and road could be replaced with permeable pavement. The sidewalks were installed with tree boxes. The design variables that affect the hydrologic performance of LID controls include the properties of the media (soil and gravel) contained within the unit, the vertical depth of its media layers, the hydraulic capacity of any underdrain system used, and the surface area of the unit itself. Although some LID practices can also provide significant pollutant reduction benefits [28,29], at present, SWMM only captures the reduction in runoff mass load resulting from the reduction in runoff flow volume. TSS removal by these three LID types is primarily through filtration and retaining and infiltrating water volume, and therefore, the reduction in TSS load can be estimated as a result of changes in flow, thereby providing the water quality performance of LID options. The key configuration parameters for each LID feature are summarized in Table 2. For this study, in order to simplify the optimization process, each LID type was assigned a typical size and design configuration that remained unchanged during the optimization process.
2.3. Optimization
2.3.1. NSGA II
A multi-objective optimization approach was conducted to define a set of optimal LID planning alternatives for the upper area of the Cau Bay River basin. Recently, evolutionary optimization techniques have been widely used in optimal planning. As a member of the evolutionary optimization techniques family, NSGA II is capable of producing optimal or near-optimal solutions that describe trade-offs among competing objectives [30]. A non-dominating sorting approach, together with a crowded comparison operator, make NSGA II faster than any other multi-objective algorithm and can maintain diversity along the Pareto optimal front. In NSGA II, an initial population of potential solutions is randomly generated. In the population, a solution dominates another solution when it performs no worse than the other solution in all objectives, and better than the other solution in at least one objective. At the end of the sorting, each solution is assigned a fitness (or rank) equal to its non-dominant level, with a smaller rank indicating that the solution is dominated by fewer other solutions. On the basis of dominance level, the population is classified into several dominance classes. In addition, a crowding distance, defined as the size of the largest cuboid enclosing a solution without including any other solution in the population, is calculated for each individual solution as a measure to maintain solution diversity. A large average crowding distance results in better diversity in the population. Here, the key NSGA II parameters followed the study of Wu et al. [18] with number of generations = 200, population size = 100, crossover probability = 0.9, and mutation probability = 0.1.
2.3.2. Objectives and Decision Variables
An alternative consists of a combination of green roofs, permeable pavements, and tree boxes, which is implemented for sub-catchments in the upper area of the Cau Bay River basin. The optimal process aims to find a set of optimal alternatives that trade-off between minimizing the total relative cost of LID implementation and maximizing the TSS reduction at the outlet of the upper area of the Cau Bay river basin. Overall, the objective of the optimization process is to find the most effective combinations of LID controls at various cost levels. In other words, the primary goal of the optimization process is to generate cost–benefit curves. Two objective functions were utilized as fitness criteria for the optimization process, as follows.
The first objective was to minimize the total relative cost of LID implementation:
where:
CL is the total relative cost of the Lth alternative of LID implementation;
i subscript is the ith sub-catchment;
j subscript is the jth LID type;
Fij is unit area of the jth LID type;
nij is the number of the jth LID type in the ith sub-catchment, considered as a decision;
k is the number of sub-catchments in which LID was implemented LID, k = 53;
m is the number of LID configuration types, m = 4; and
nijmax is the maximum number of the feasible sites in the ith sub-catchment where the jth LID type could be applied. nijmax depends on physical constraints and sub-catchment characteristics, and is defined as the total area of feasible sites for each LID type divided by the surface area of each LID type. Through referring to the local authorities, the ratio between LID surface area and its drainage area for each LID type was assigned: 4% for green roofs and tree boxes, and 50% for permeable pavements. As stated by Wu et al. [18], during the optimization process, the number of LID units were adjusted when their combined treatment areas exceeded the available area for treatment within each sub-catchment.
The second objective was to maximize the TSS reduction at the outfall of the upper area:
where EL is the TSS removal reduction efficiency of the Lth scenario (%), CL is the TSS load upstream of the QL culvert of the Lth scenario with LID implementation (kg), and Cb is the TSS load upstream of the QL culvert of the baseline scenario (kg).
This study conducted the simulation and optimization procedures based on the program of Wu et al. [18].
3. Results and Discussion
3.1. Cost–Benefit Curves
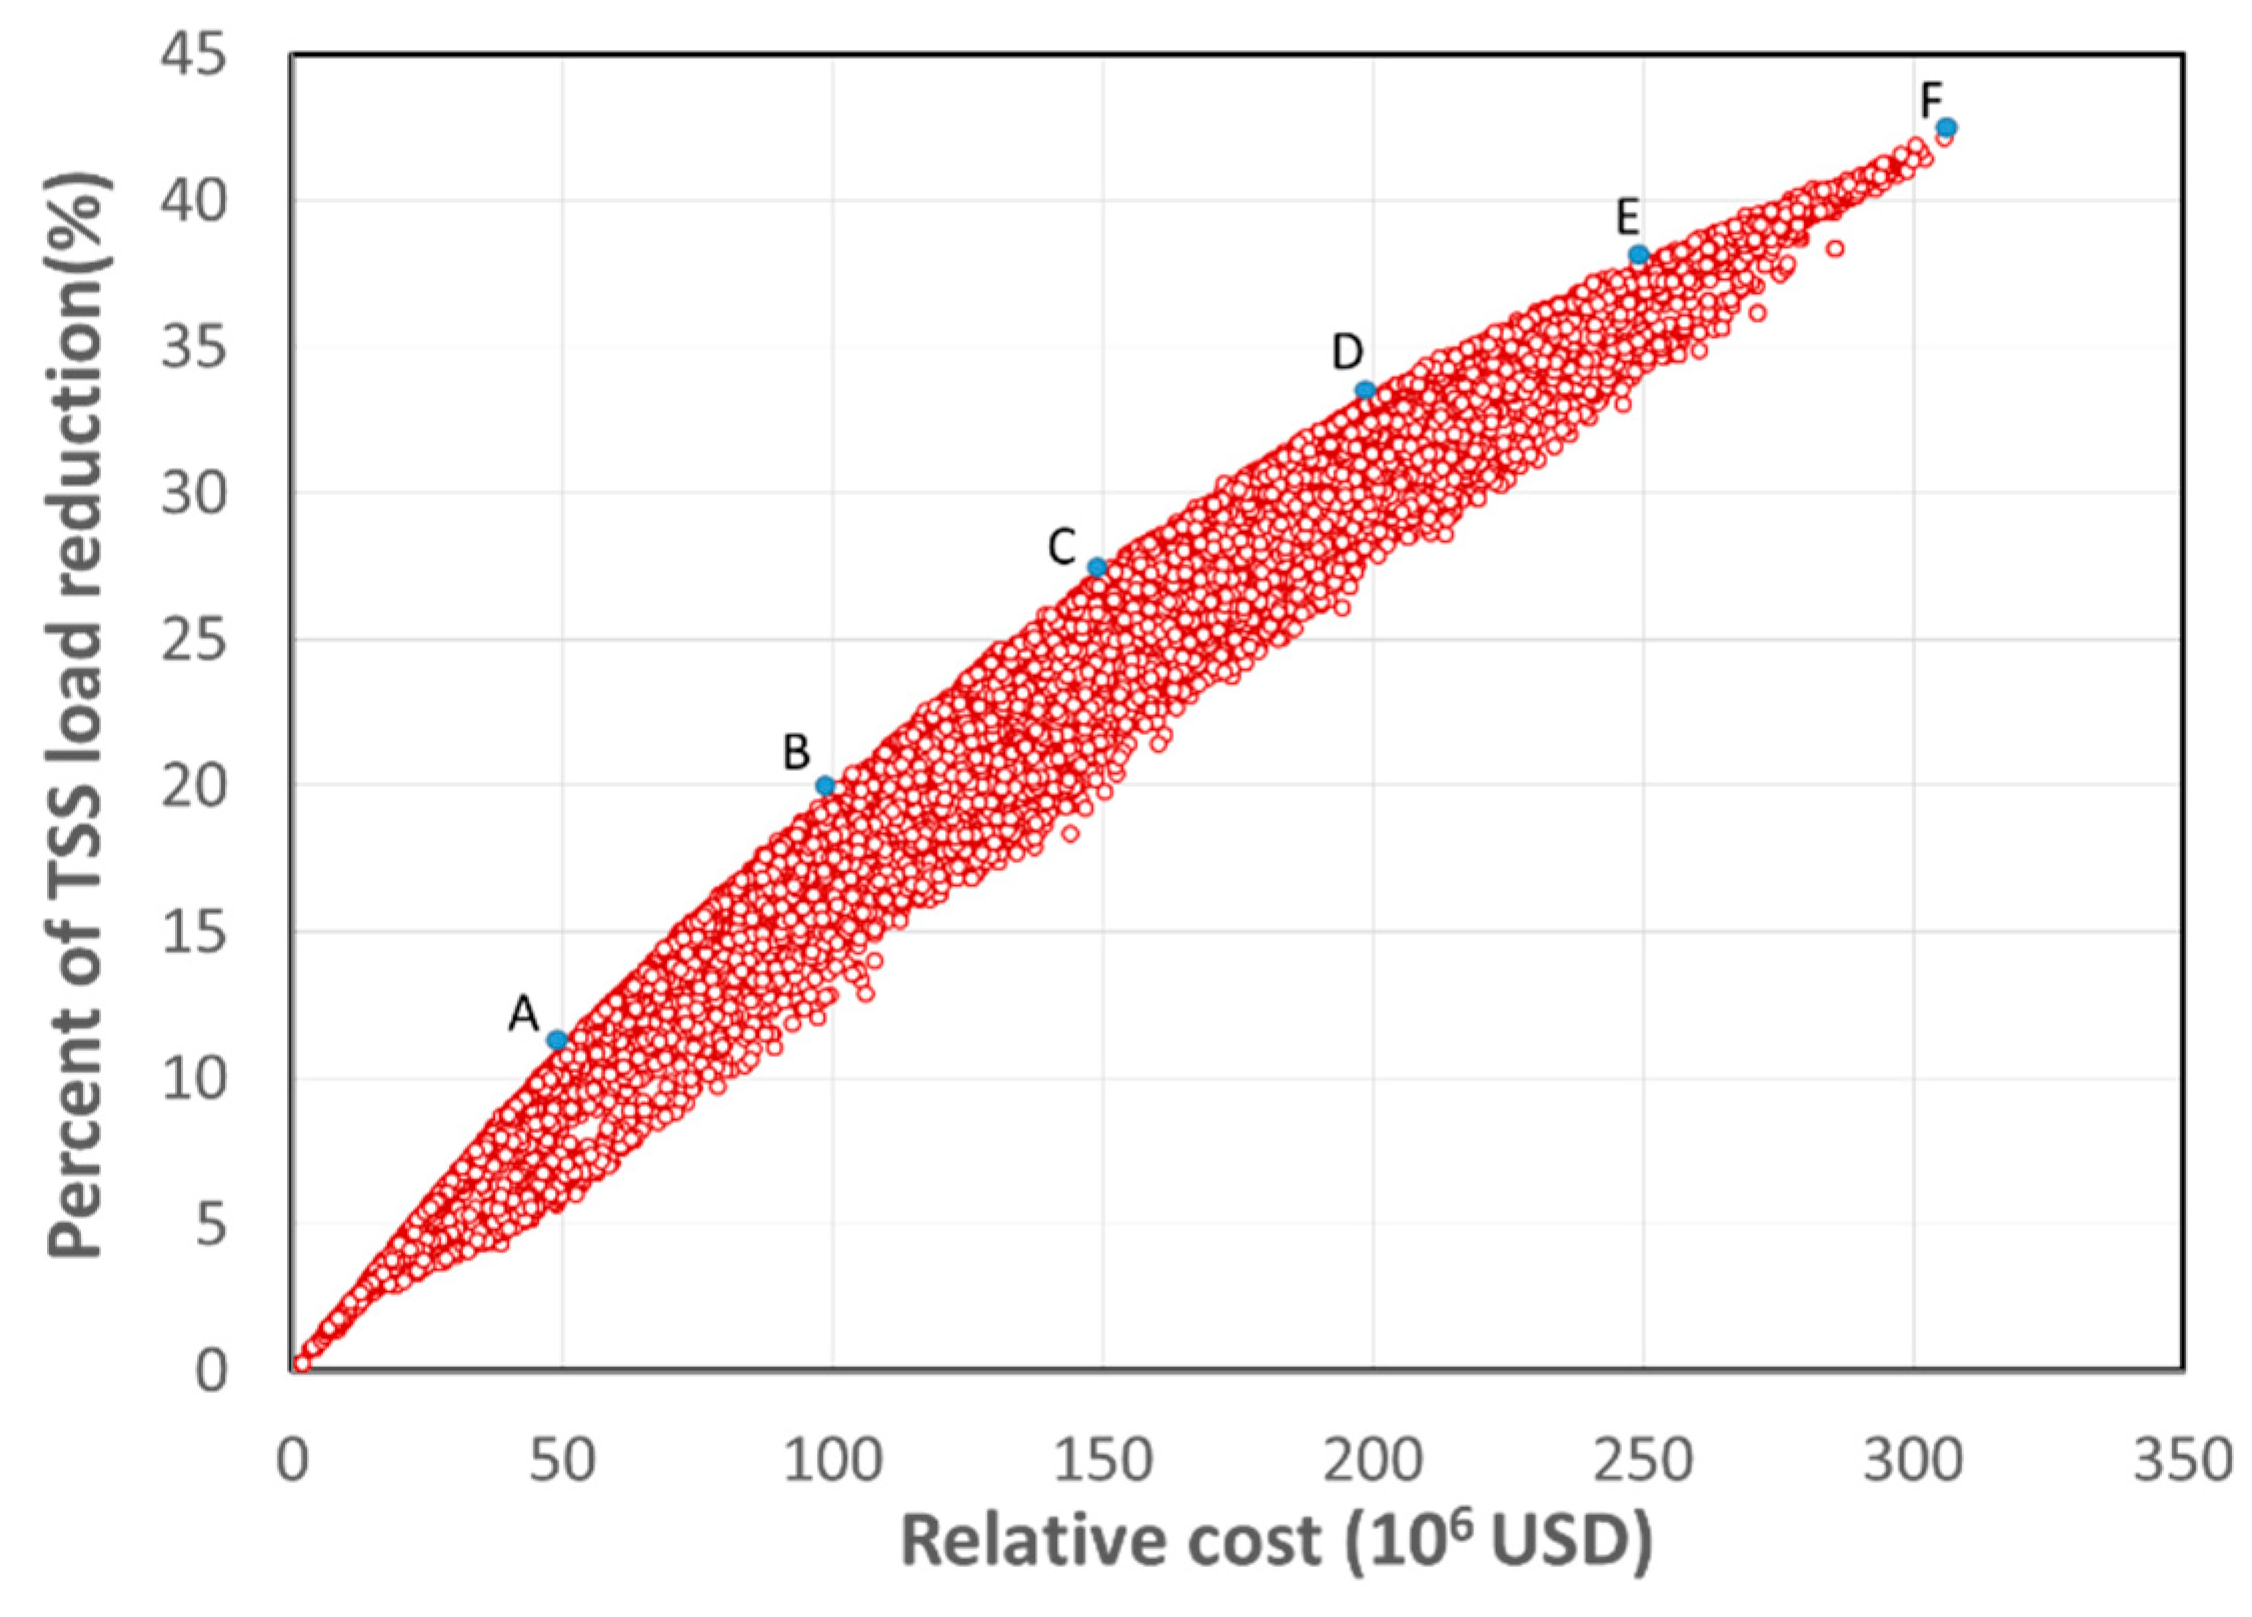
Figure 3 describes the optimal trade-off between implementation cost and TSS removal efficiency. Each point along the cost–effectiveness curve represents a solution of the number of green roofs, permeable pavements, and tree boxes in the study area. When all solutions are simultaneously plotted, the optimal solutions lie on the left and upmost margin of the search space. The results indicate that with the same relative cost, the TSS reduction efficiency of an optimal solution could be nearly 8% higher than that of a non-optimal solution, while for the same TSS reduction efficiency, the relative cost of an optimal solution could be nearly USD 50 million lower than that of a non-optimal solution. The TSS reduction efficiency of the optimal solution is in the range of 0–43%. The TSS reduction efficiency reaches the maximum value of 40%, corresponding to an installation cost of USD 310 million. This means that the optimization approach could facilitate decision-makers in identifying the most cost-effective solution that yields the possible highest TSS removal within a defined budget. The increased TSS reduction efficiencies corresponding to the sequential added relative costs of USD 50 million are significantly decreased. The TSS reduction efficiency increases by 11% with the initial USD 50 million investment (O-A in Figure 3), but only increases by 4.4% with the last USD 50 million investment (E, F in Figure 3). The reduction in the slope of the frontier of the cost–effectiveness curve against increase in the investment budget is attributed to spatial variation in TSS-released sources in the whole study area. As a result of this, the sub-catchments that produce high TSS loads are given higher priorities to install LIDs for TSS removal. The TSS removal efficiency–implementation cost curve is different from the PCB removal efficiency–implementation cost curve [18], even though both curves were yielded by the same method. Namely, the maximum TSS removal efficiency (40%) is lower than the maximum PCB removal efficiency (70%), and the level-off of removal efficiency that appears in the curve of PCB removal efficiency–implementation cost is not observed in the curve of TSS removal efficiency–implementation cost. This could be attributed to both the different types and designs of LID units was used for seeking the optimal planning alternatives of LID implementation, as well as less heterogeneous distribution of TSS in the landscape.
3.2. LID Utilization and Spatial Distribution
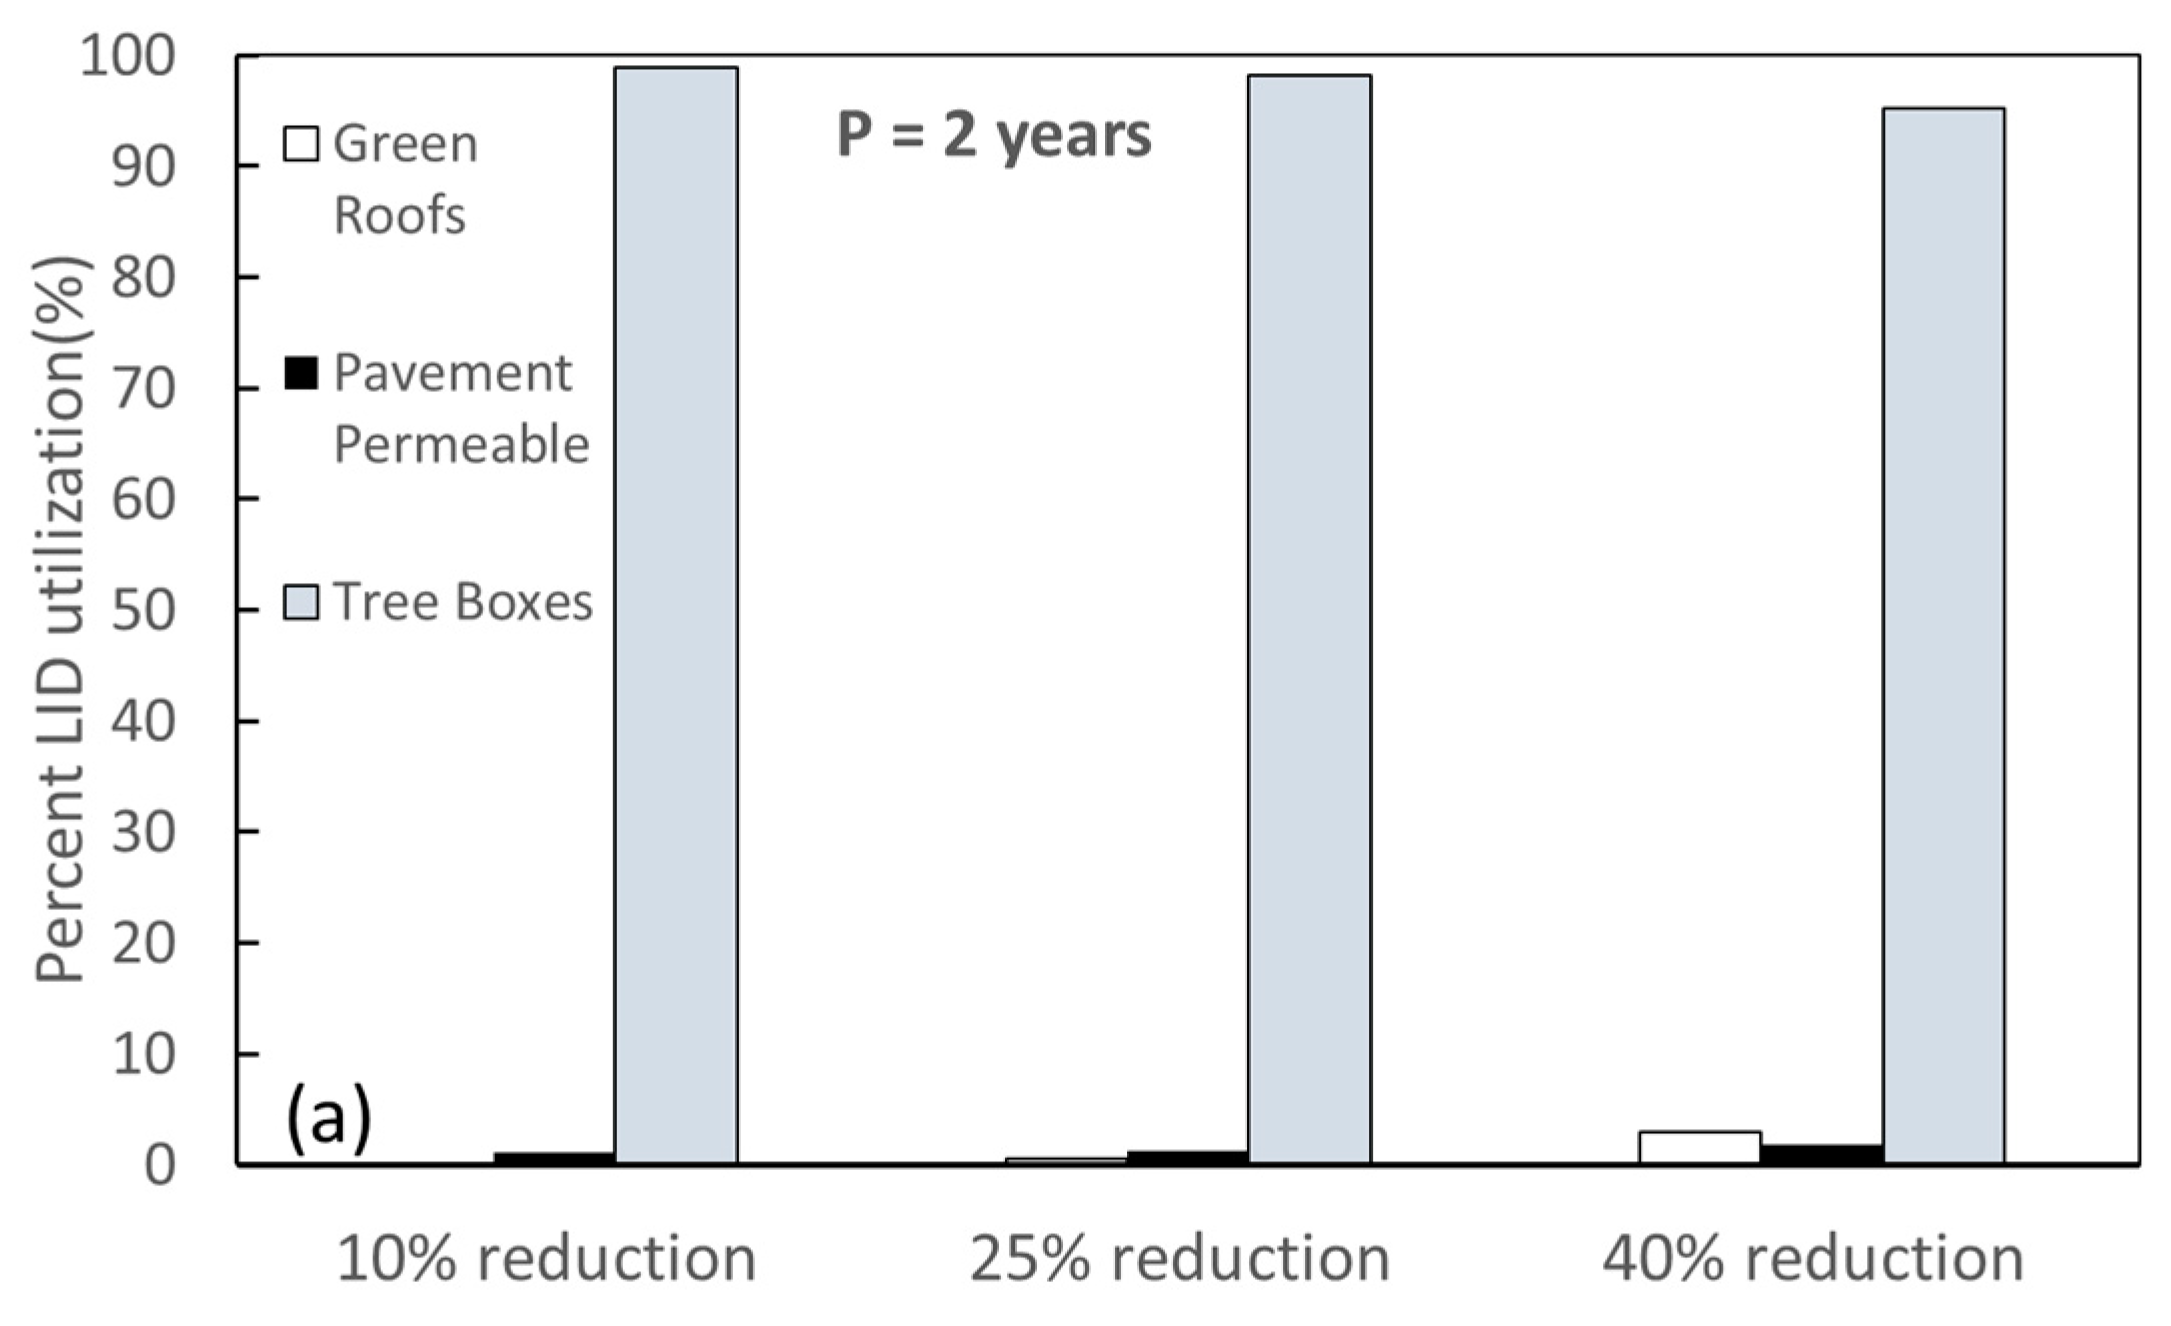
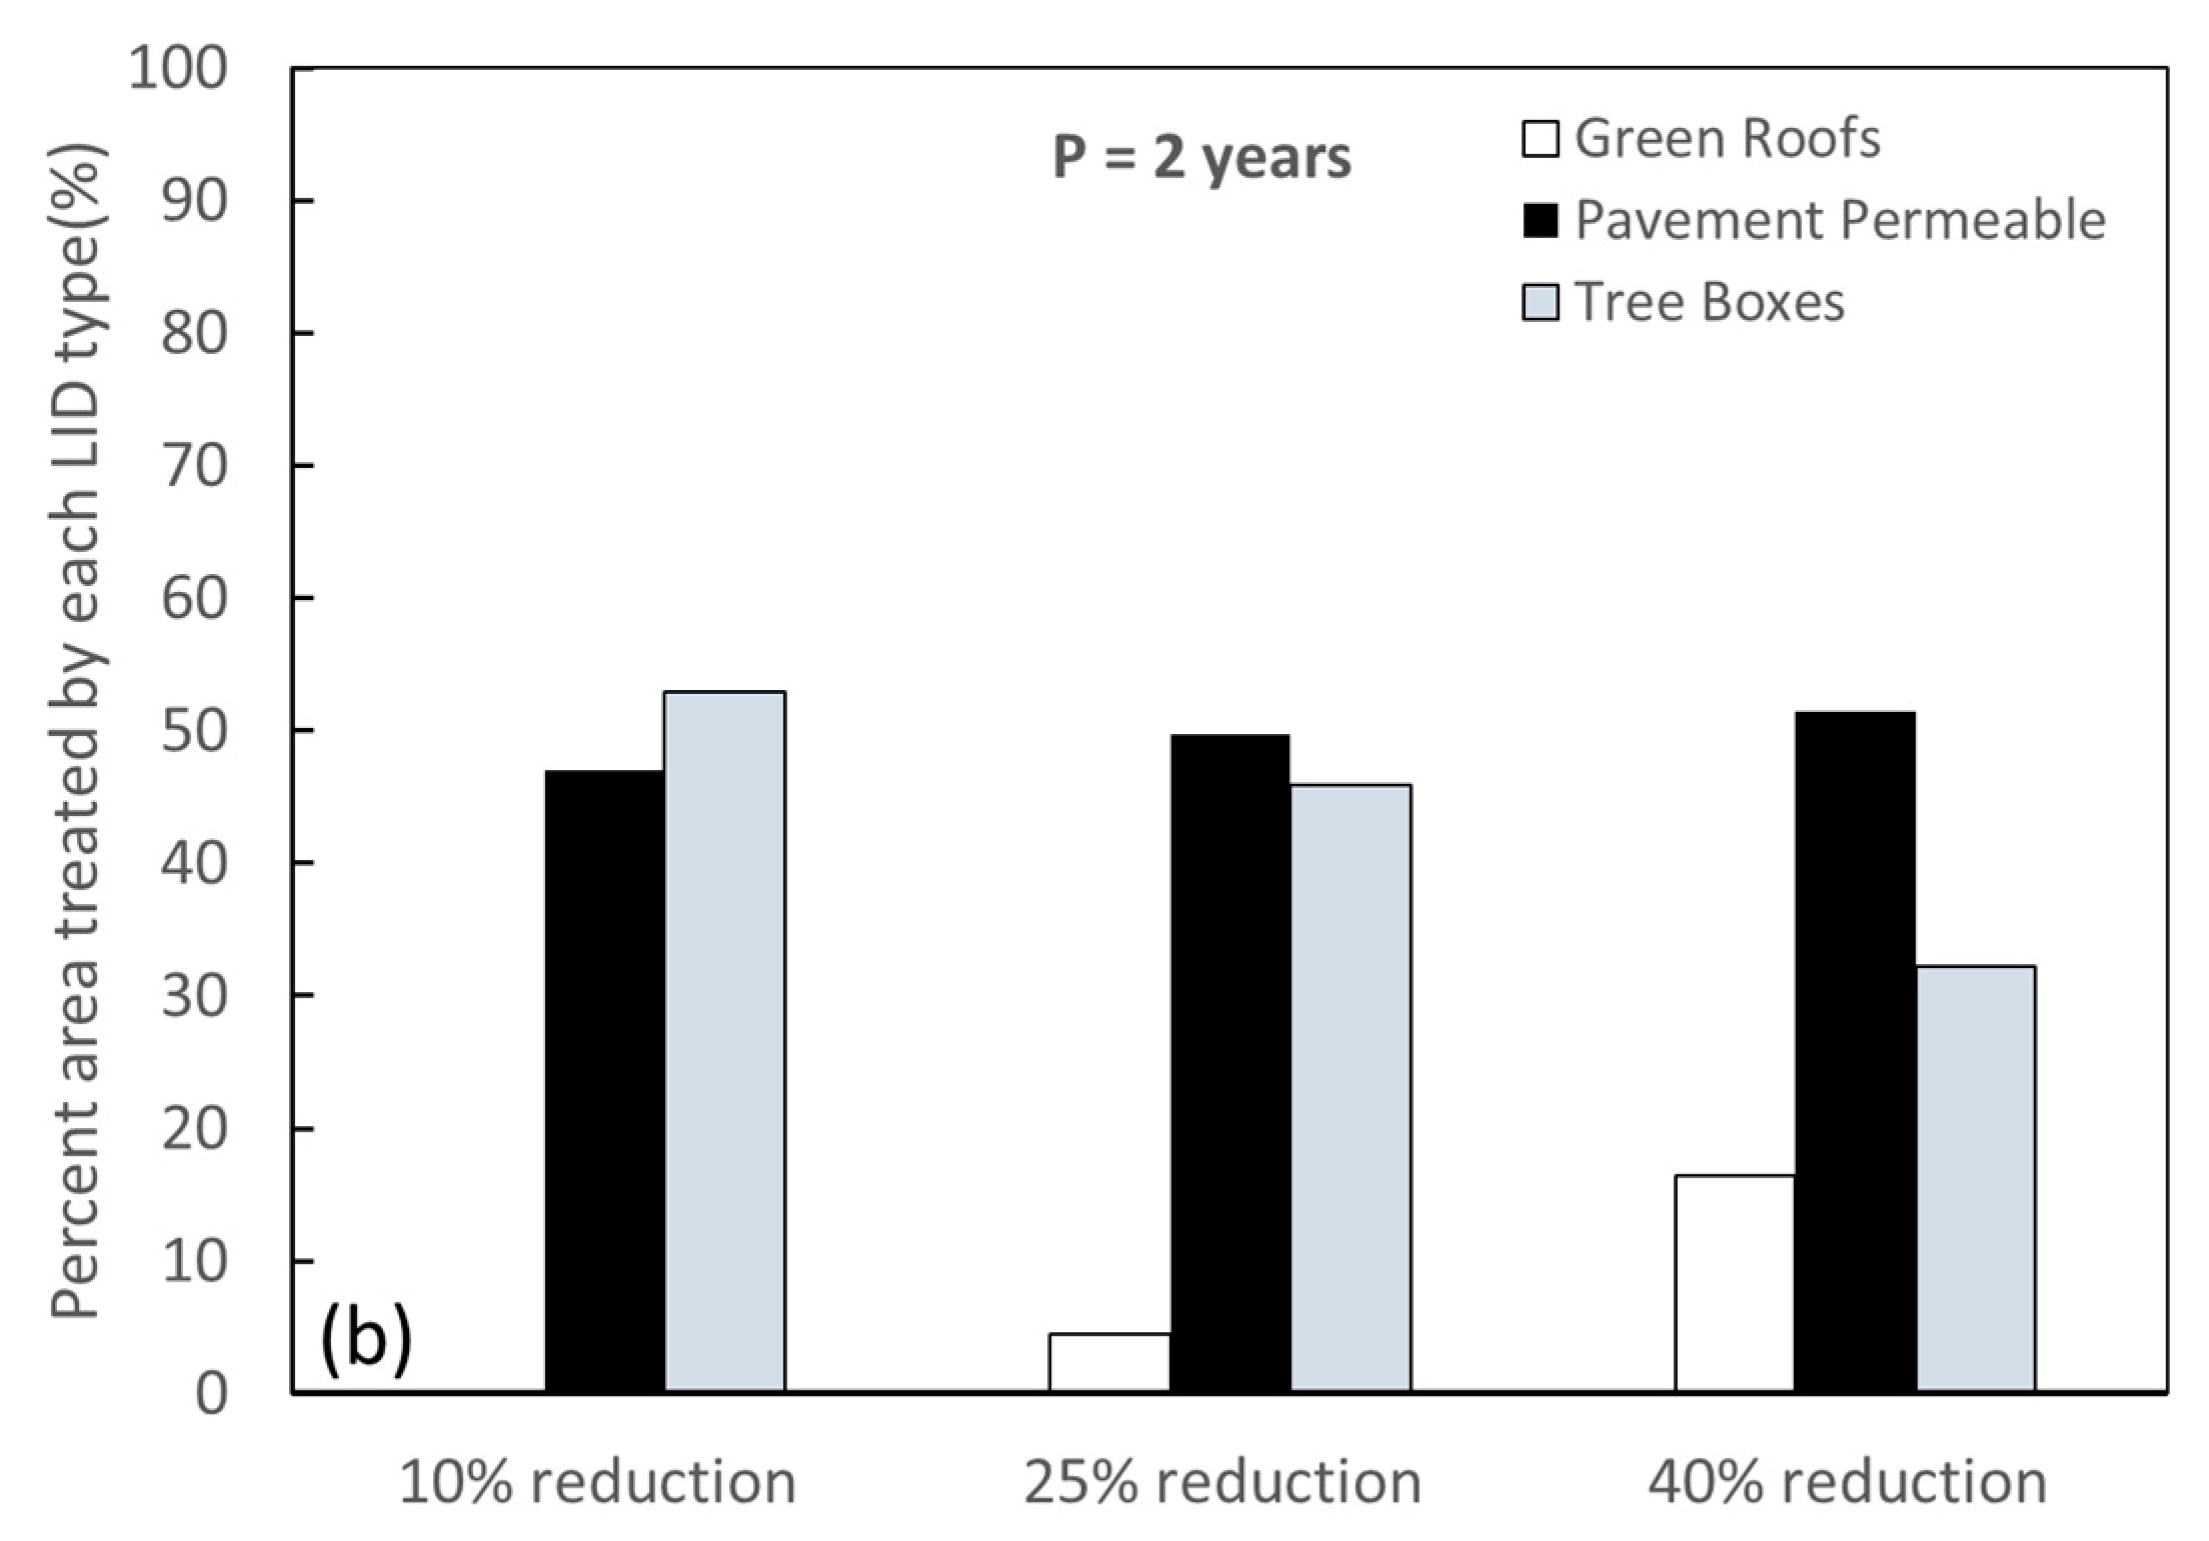
A planning of LID facilities was featured by both the number of each LID and the spatial distribution of LIDs over the study area. Each point, along with the curve of cost–effectiveness, is representative of an optimal planning alternative of LID, consisting of a unique combination of LID configurations. Three optimal planning alternatives of LID configuration with TSS removal efficiencies of 10%, 25%, and 40% were analyzed in more detail (Figure 4). Figure 4a indicates that the number of tree boxes is much greater than that of the remaining LIDs. This could be attributed to their advantage of small surface area, high treatment ratio, and unit cost. Although the number of permeable pavements are small, their treated area is more than 40% in the 10% reduction alternatives and becomes the highest in the 25% and 40% reduction alternatives (Figure 4b). Permeable pavements with a large surface area could be considered as a reason for such a phenomenon. Conversely, a decreasing tendency in the area treated by tree boxes in relation to an increasing trend in TSS removal efficiency is observed. In all three scenarios, the percentage of green roofs area is the smallest in comparison with those of permeable pavement and tree boxes. Green roofs are almost unutilized in the 10% TSS reduction alternative, and account for 4.5% and 16.4% in the 25% and 40% TSS reduction alternatives, respectively. This proves that permeable pavements are the most cost-effective and green roofs are the least cost-effective among the three LIDs. It is realized that the number of each LID resulting from the optimization process is sensitive to its parameters (Table 2) and unit cost. A slight change in LID characteristics could induce significant changes in the number of LIDs of each alternative. When planning a new development, these LID practices could possibly be incorporated into shared spaces, such that they do not require each member of the community to individually adopt them.
To shed light on the spatial distribution of LIDs throughout the study area, variations in LID usage of each sub-catchment were analyzed for three optimal planning alternatives (Figure 5). Considering the 10% TSS removal reduction scenario, LID facilities were prioritized to install in the upstream sub-catchments where the TSS concentration is higher than that of the remaining area. All percentages of LID usage of sub-catchments are less than 8%. With the 25% reduction scenario, the number of sub-catchments with more than 8% LID usage account for 17%. When TSS removal efficiency increases to 40%, 89% of sub-catchments become red in color due to their LID usage being greater than 8%. Spatially optimal planning of LID configuration facilitates decision-makers in setting priorities to install LID configurations within a limited budget in order to archive a defined TSS removal efficiency.
3.3. Effect of Designed Rainfall Patterns on Optimal Planning Alternatives
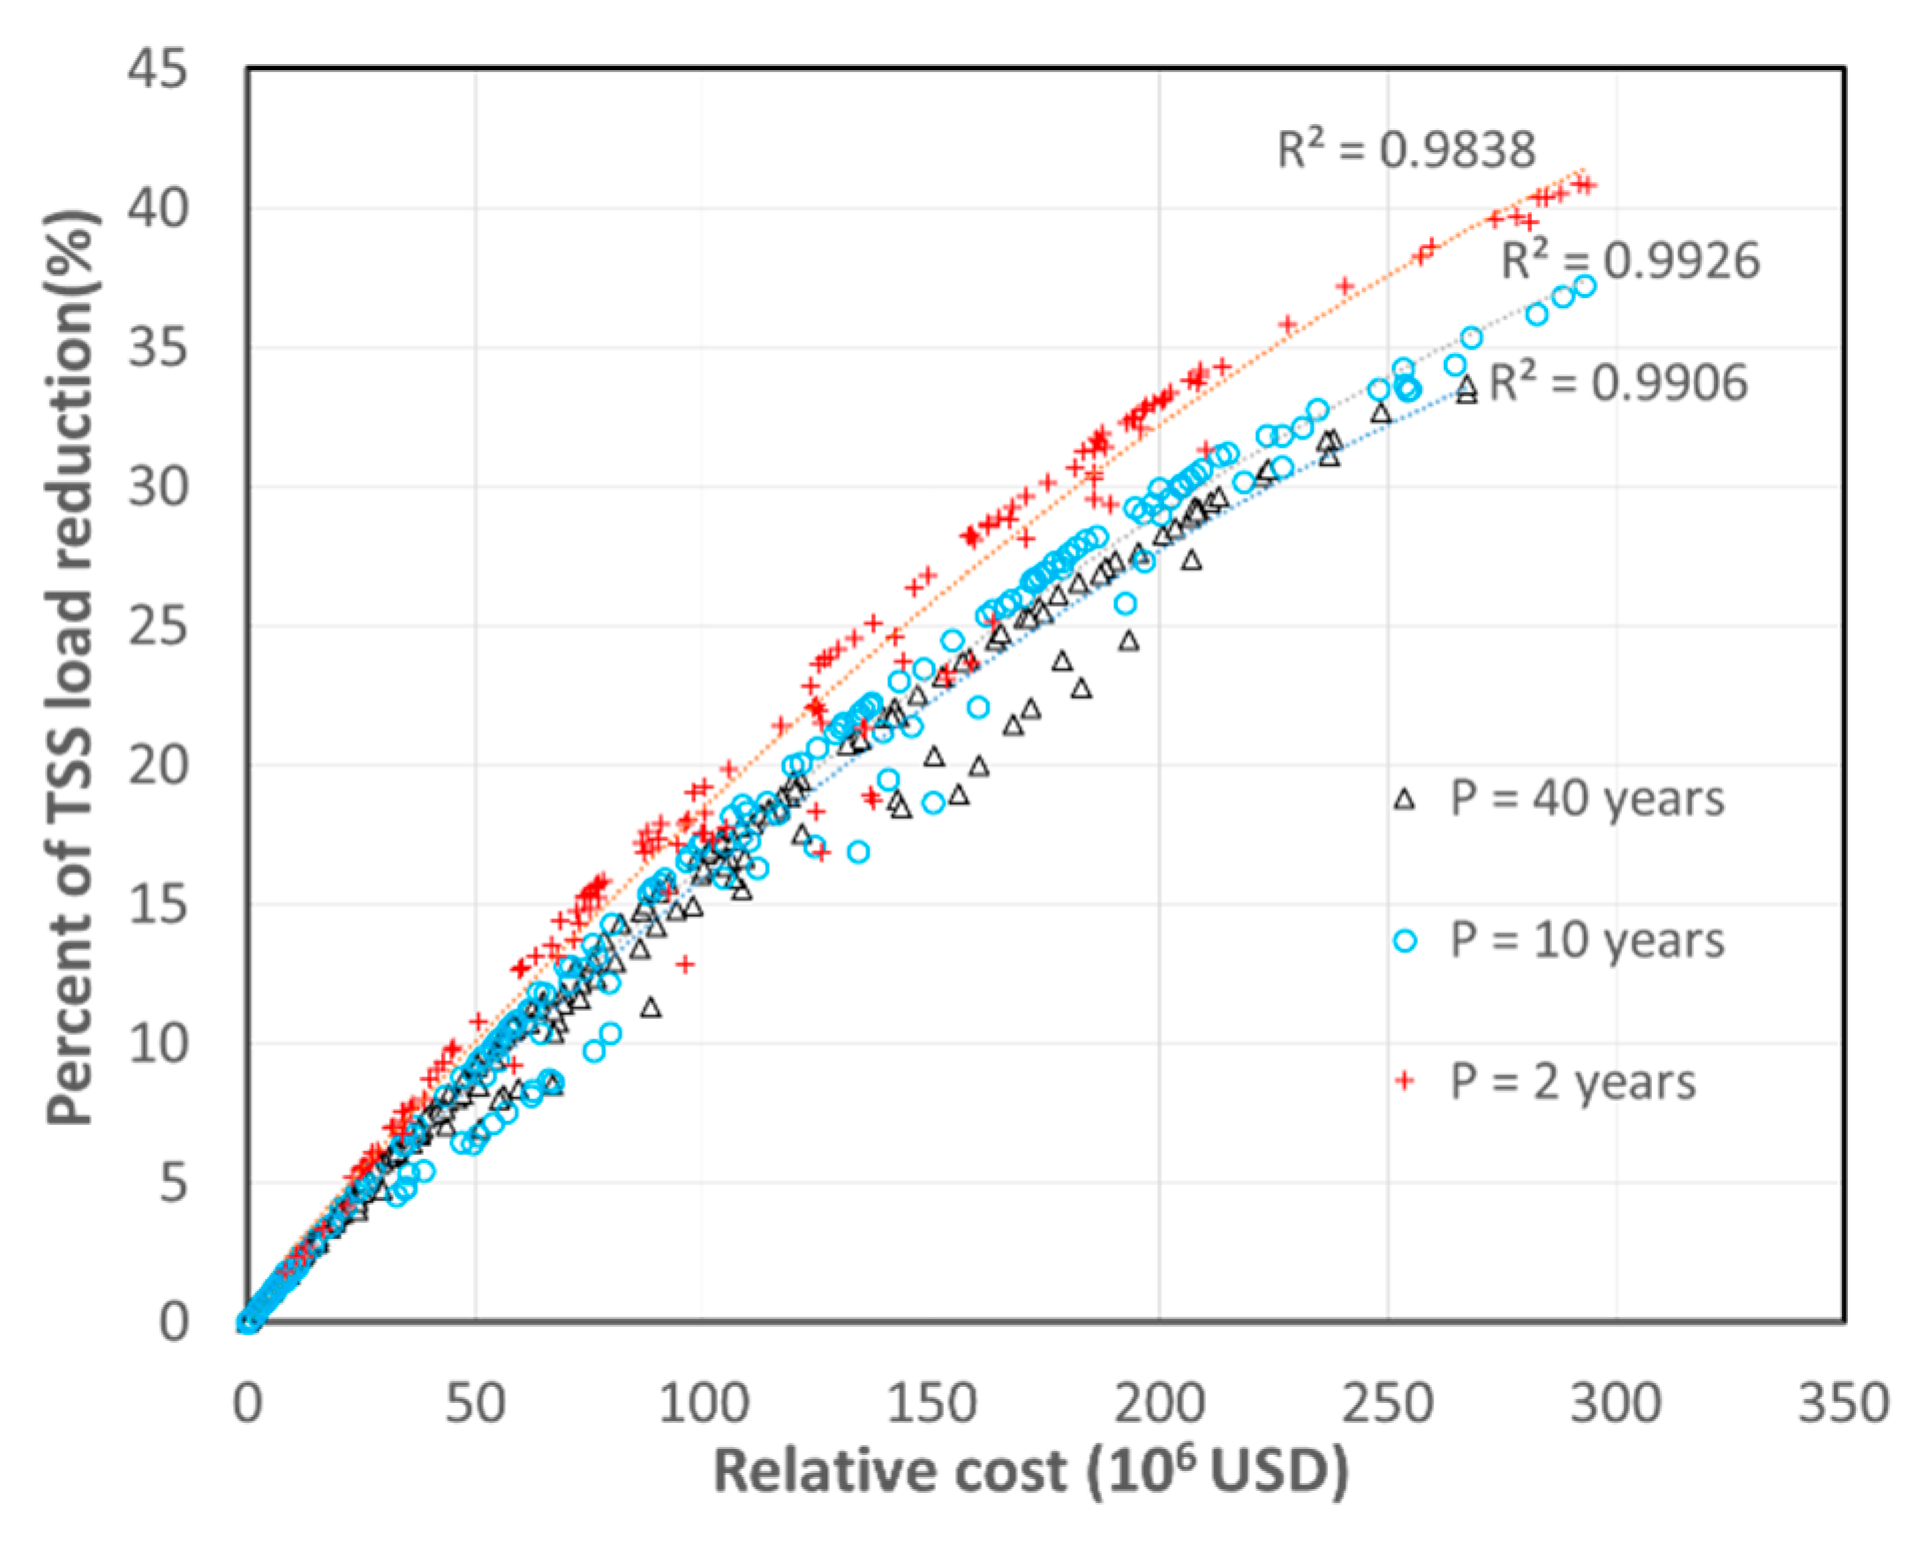
To evaluate the effect of the designed rainfall patterns on the variation in the cost–effectiveness curve, optimal processes were conducted for three designed rainfall patterns with return periods of 2 years, 10 years, and 40 years. Figure 6 indicates that the three curves of cost–effectiveness were well expressed by parabolic curves. At the same level of TSS reduction, an increase in the return period of rainfall resulted in an increase in the relative cost, together with change in LID plan. For instance, at the 20% TSS reduction efficiency, the total relative cost was estimated at around USD 105.3 million with the 2-year return period, and increased to USD 160.4 million with the 40-year return period. At the same relative cost, an increase in rainfall intensity induced a decrease in the TSS reduction efficiency. For example, with a USD 200 million investment, the TSS reduction efficiency could reach 33% for 2-year rainfall and achieve 26% for 40-year rainfall. Correspondingly, LID optimal planning also changed. This could be attributed to the infiltration-based mechanism of LID, which cannot effectively control large stormwater volumes. TSS removal by LID was mainly implemented through filtration and retaining and infiltrating water volume. It was realized that the number of optimal planning alternatives for the 40-year rainfall were less than those for the 2-year and 10-year rainfalls. The cost of optimal planning alternatives for the 40-year rainfall was in the range of USD 0–267.4 million, while the maximum relative cost of the optimal planning alternatives for the remaining rainfalls were able to reach around USD 293 million. With a certain TSS removal efficiency, the significant increase in total relative cost against the increase in the return periods of the designed rainfall patterns reaffirmed that the return period of the rainfall patterns which were utilized for the design of LID installment should not exceed 2 years. The 2-year period is coincidental with the return period of the rainfall patterns which were used for the design of lower conduits.
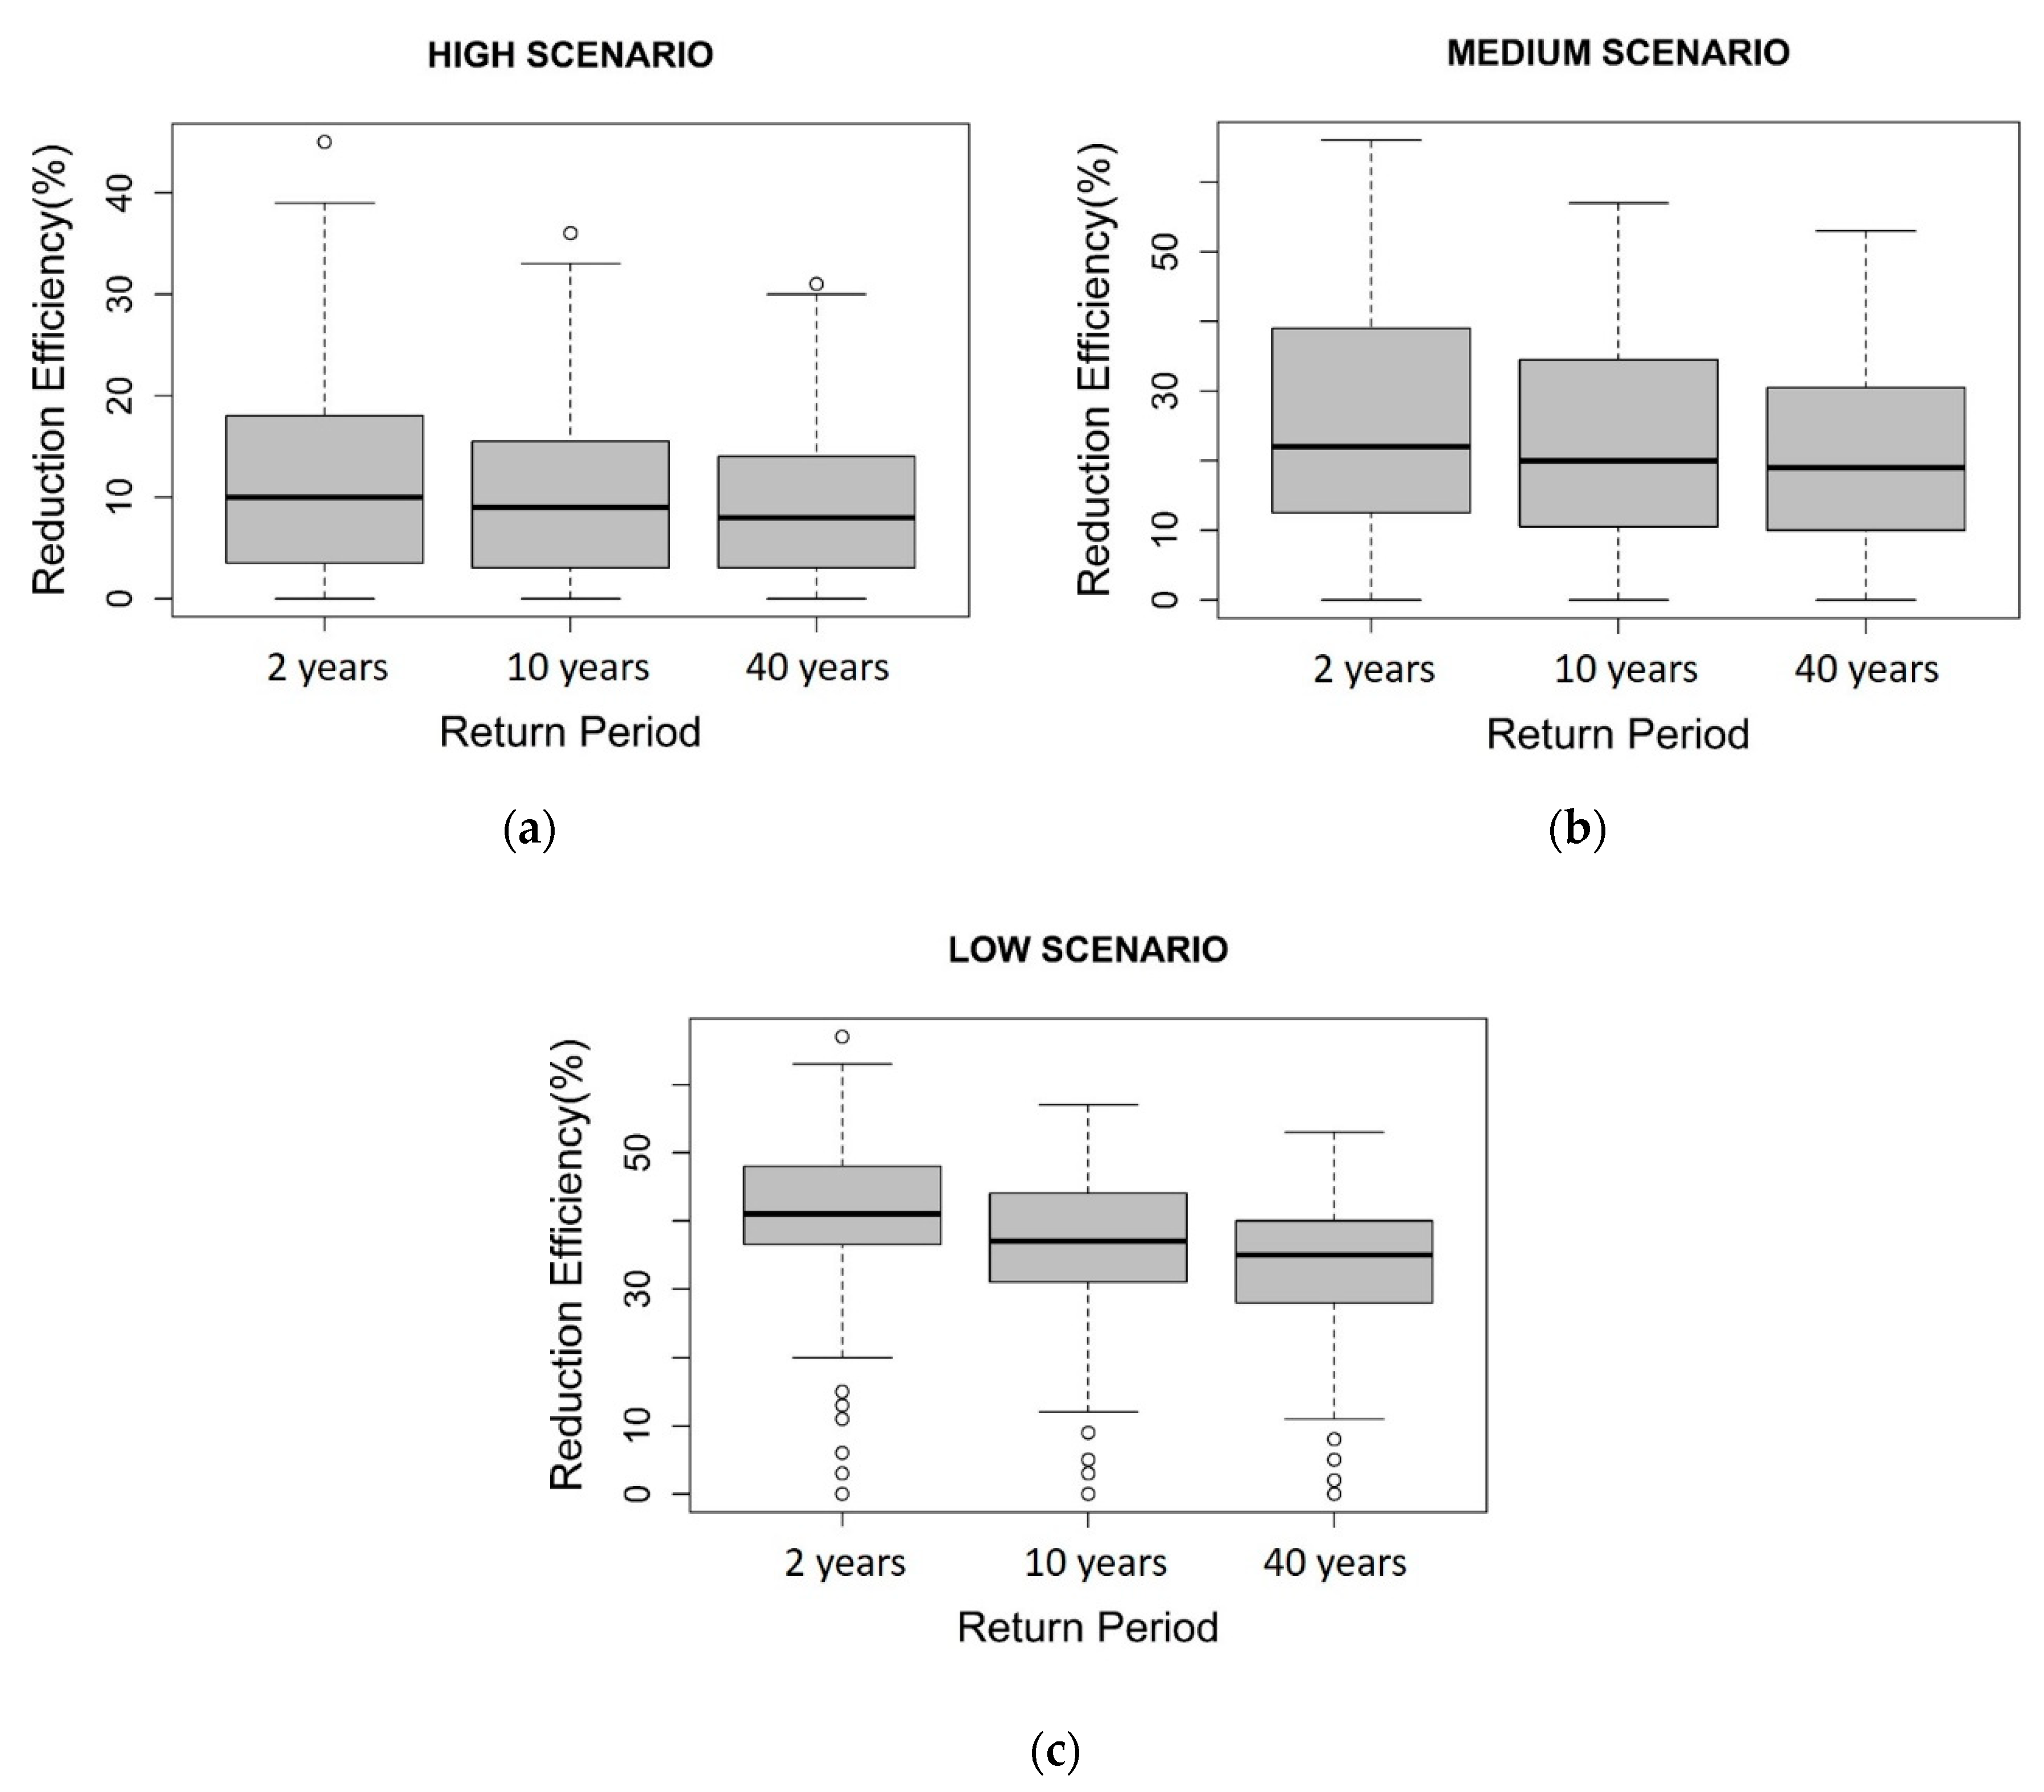
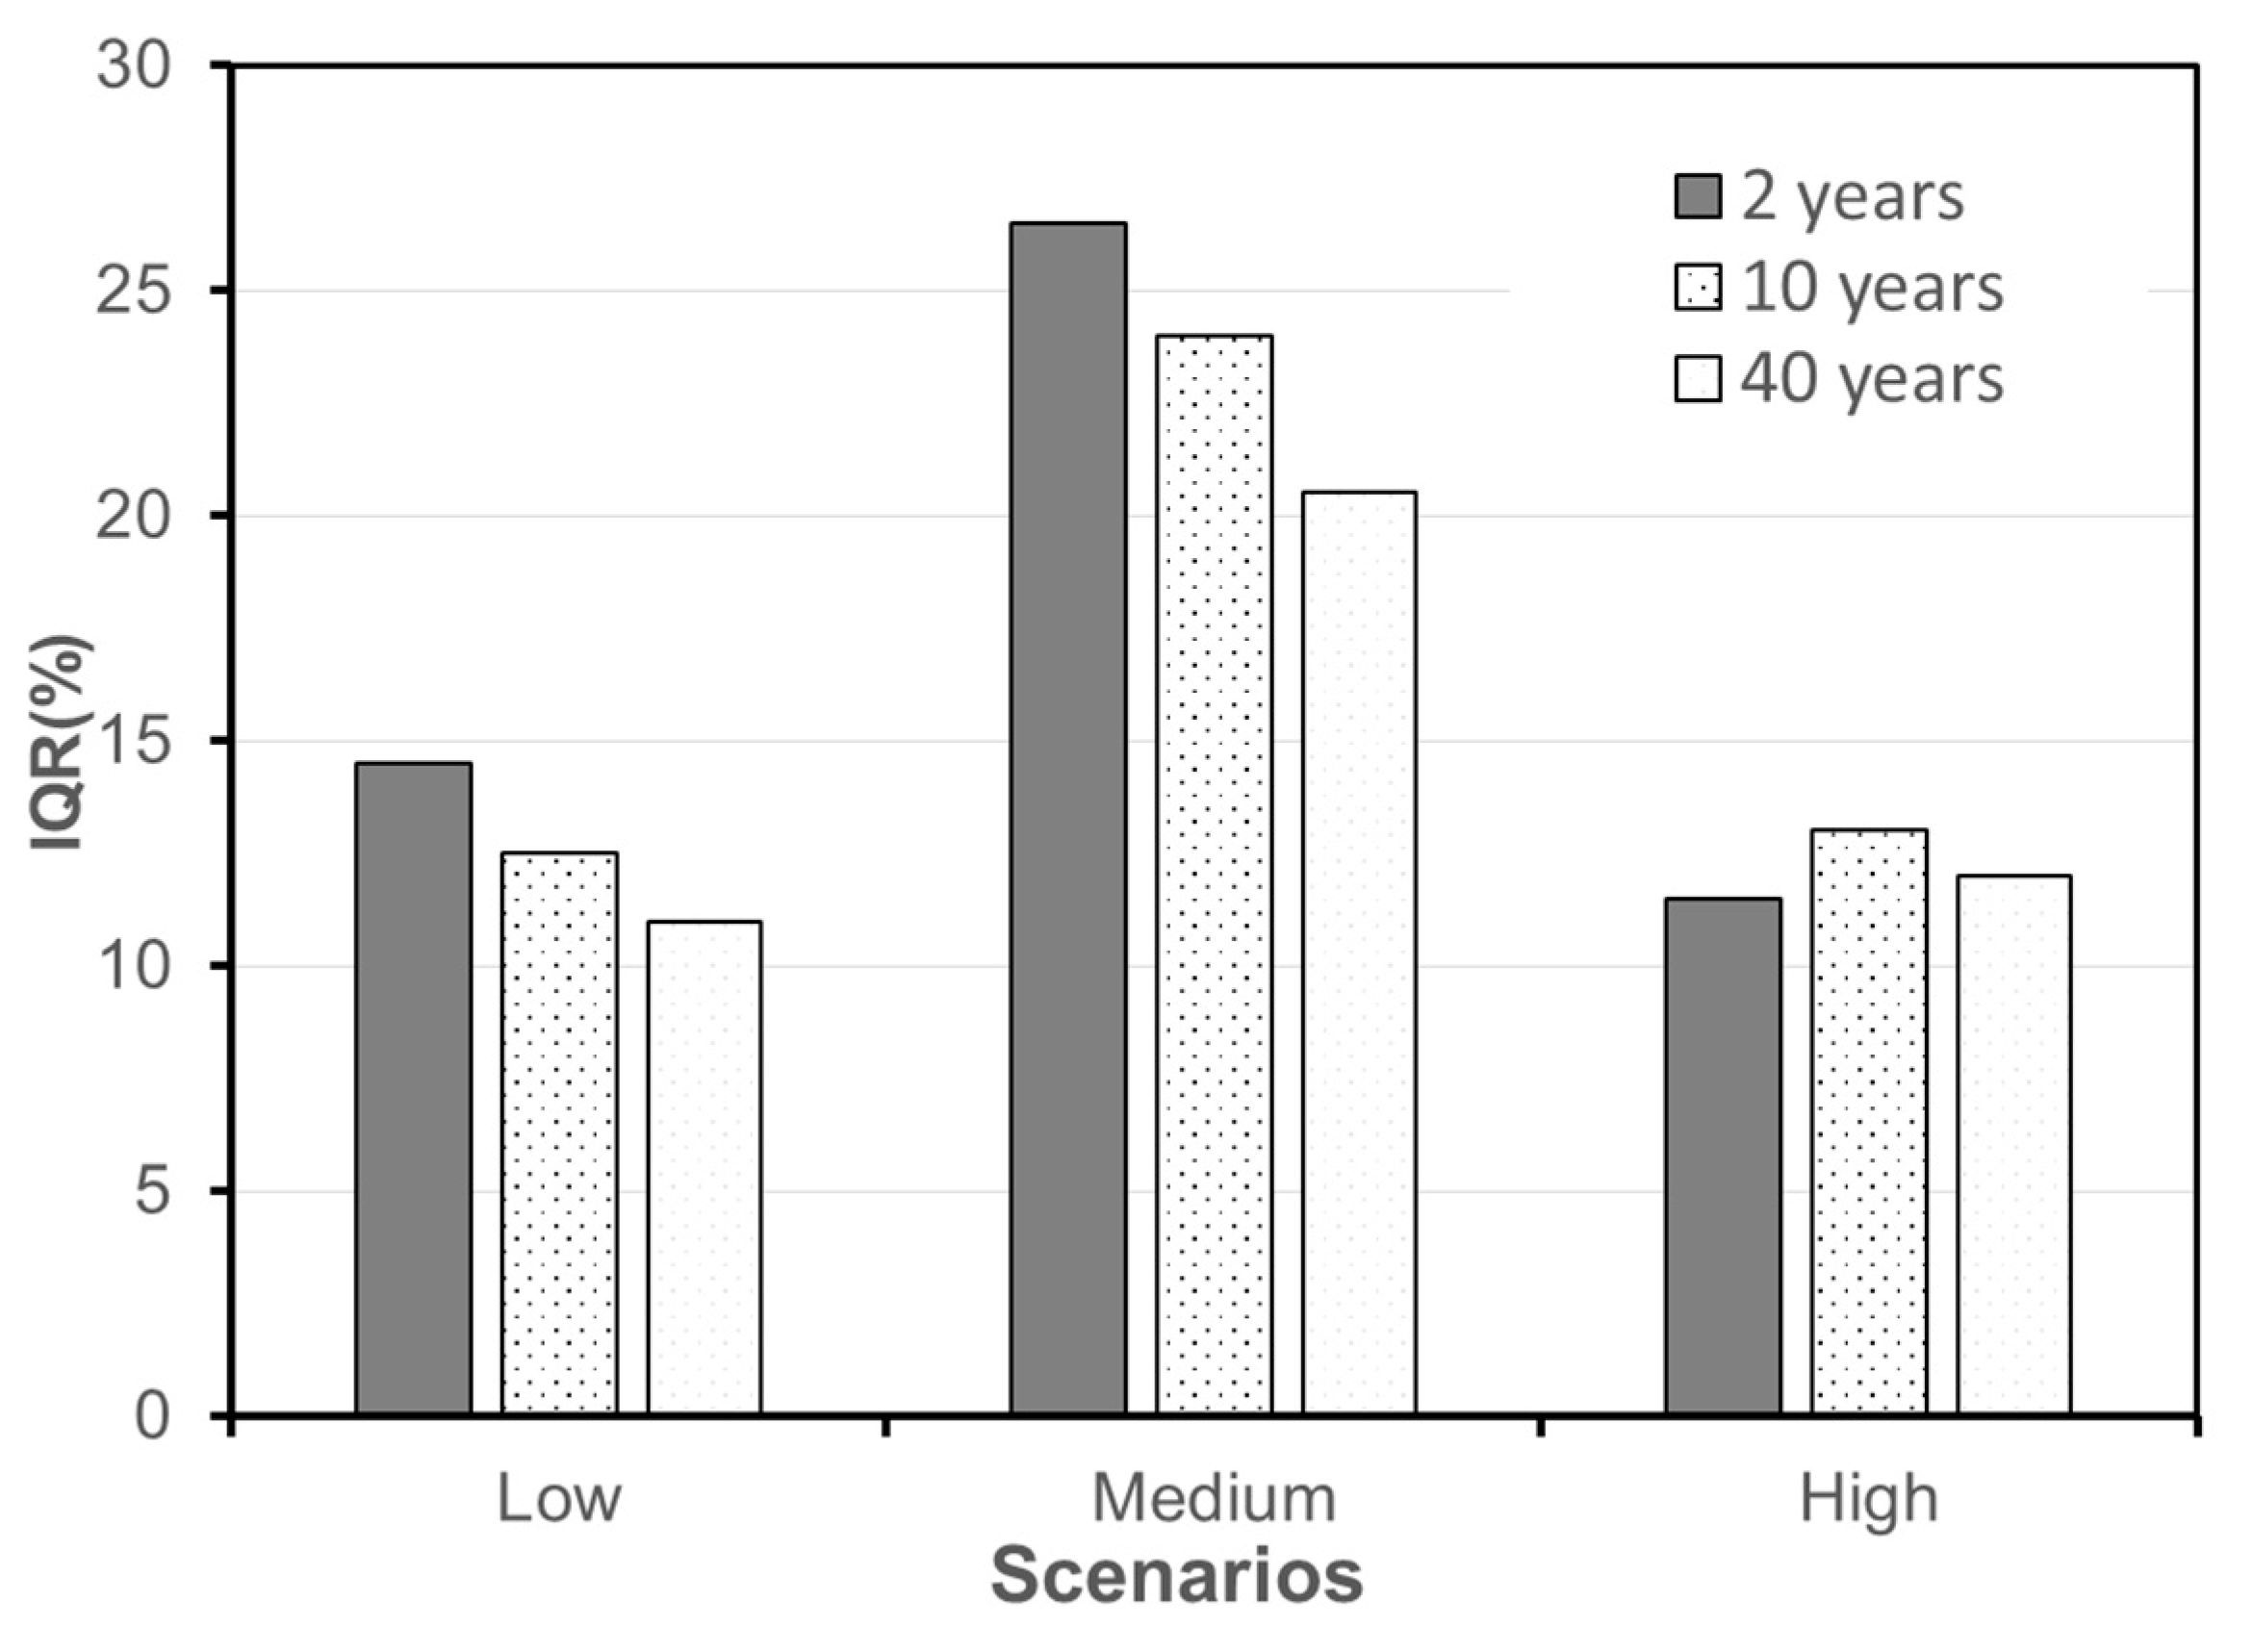
In order to quantify the deviation and median of the TSS removal efficiency of sub-catchments with three return period rainfalls for three scenarios, we used box plots (Figure 7). The box plots indicate lower quartile, median, upper quartile, and interquartile range (IQR) of TSS removal efficiency. Whiskers from each end of the box show the data range or, if smaller, the most extreme values within 1.5 times the interquartile range from the ends of the box. Outliers beyond the ends of the whiskers are marked with “o”. Here, the median of a box plot is considered to represent the nonlinear rate of the TSS removal efficiency of a scenario, and IQR (Figure 8) as a measure of the strength of deviation of the TSS removal efficiency in each scenario. The low, medium, and high scenarios correspond to optimal planning alternatives with respect to 10%, 20%, and 30% TSS removal efficiencies at the outfall for the 2-year rainfall period. For all three scenarios, the median gradually declined when the return periods of the rainfalls increased from 2 to 40 years. The amount of reduction in the median induced by the increase in the return period of rainfall grew from low to high scenarios. Similarly, the trend of variation in the IQR against the increasing return periods of rainfalls was observed in low and medium scenarios as well. The IQR nearly kept at a stable level in the high scenario. Note that the IQR of the medium scenario reached the highest values among the three scenarios (Figure 8). Asymmetric distribution of the medium scenario could prove that higher priority of LID installation was given for sub-catchments with low TSS load. Conversely, symmetric distribution was observed for both the low and high scenarios, although several low outliers appeared in the high scenario.
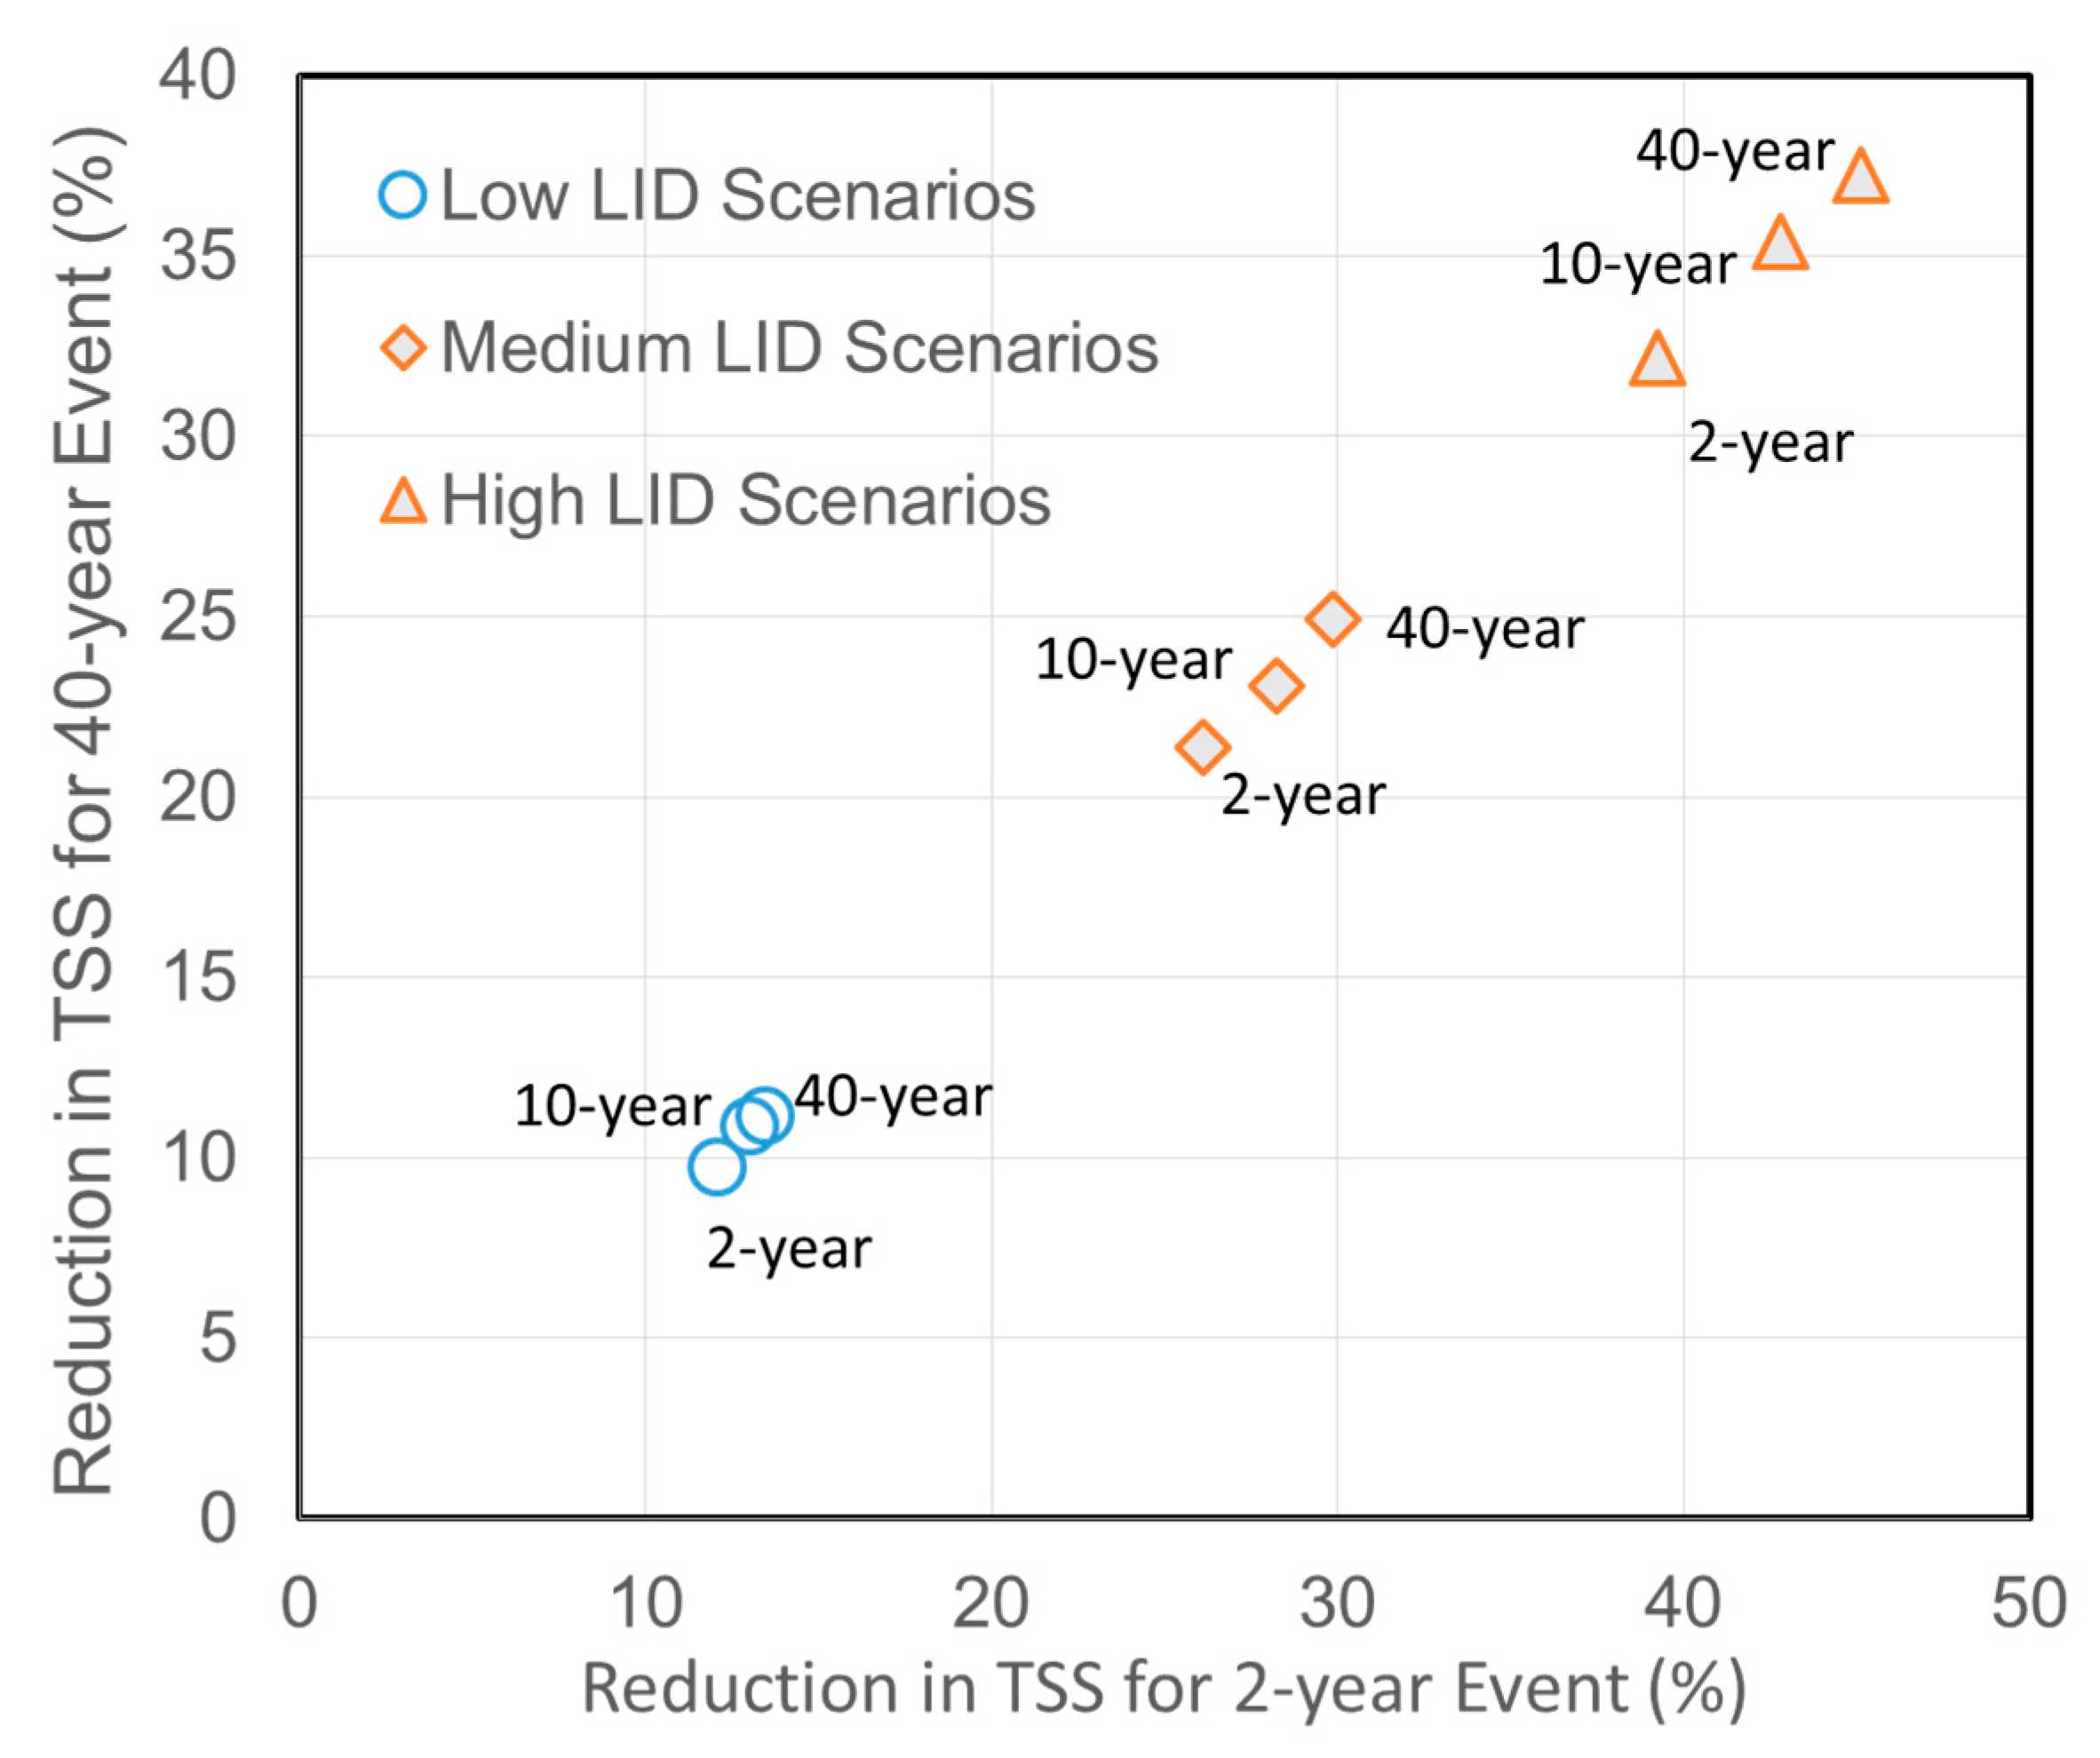
To determine the TSS reduction efficiency of the optimal LID planning alternatives for all rainfalls, the trade-off between performances for the 2- and 40-year rainfalls for each alternative is shown in Figure 9. Note that the TSS reduction efficiency of an optimal LID planning alternative mentioned here was averaged from the reduction efficiencies of TSS wash-off loads of all sub-catchments in the study area. One alternative was optimized for one storm and was evaluated for the remaining two storms for which it was not designed to control TSS. The results indicate that the optimized alternative for a rainfall with a smaller return period yielded a lower TSS reduction efficiency. For the medium LID scenario, for example, the alternative that was optimized for the 2-year rainfall reduced TSS to a smaller degree than the alternative that was optimized for the 10- and 40-year rainfalls. A similar trend was observed when the 40-year rainfall was utilized to evaluate TSS reduction efficiencies of the three optimal LID planning alternatives which were optimized for the 2-, 10-, and 40-year rainfalls. In addition, deviation in TSS reduction efficiencies between the corresponding two alternatives of each scenario went up from low to high scenarios. It was realized that the trade-off for the TSS wash-off reduction efficiency was reverse to that for the peak flow reduction efficiency analyzed by [14].
Overall, the paper adds novel findings to prior studies dealing with optimal LID implementation plans in urban area, accounting for a combination of green roofs, permeable pavements, and tree boxes for TSS control at the basin scale, and using a comparative analysis to evaluate optimal LID planning alternatives for TSS control of a wide range of designed storm events, including frequent, less intensity (2-year), and less frequent, more intensity (10-year, 40-year).
3.4. Limitations
There are some limitations to both the simulation and optimization processes, including the simulated TSS loads, the LID unit performance, the unit LID cost, and the maximum number of each type of LID unit at a sub-catchment. Firstly, inaccuracy of the simulated TSS loads could emerge from the parameters of build-up and wash-off processes, which were not calibrated. However, the amount of the inaccuracy of the baseline scenario simulation could be approximately equal to those of the scenario simulations with LID practices, and therefore, the inaccuracy of the TSS reduction efficiencies could be canceled out. Secondly, the decline in LID unit performance induced by clogging of the substrate in LIDs was not accounted for in the simulation processes, possibly leading to incorrect results of the TSS reduction efficiencies. Thirdly, variation in unit LID cost resulted in large variations in the combination of LID practices, as well as subsequent variation in the total relative cost of the scenarios. The unit LID cost should be sufficiently calculated based on the specific design of each LID type and local norms. Note that the total relative cost of a scenario with LID practices is purely the basis to define the optimal scenarios and does not accurately reflect the true cost of an optimum solution of such a scenario. After the optimal LID planning alternative for a basin is chosen, a precise estimation of its total cost should be conducted to facilitate LID implementation. Finally, the maximum number of each type of LID unit at a sub-catchment was defined here based on the fixed ratio between LID surface area and its drainage area. In fact, this ratio—which strongly depends on the specific condition of each sub-catchment—varied from sub-catchment to sub-catchment, partly affecting the accuracy of the cost–effectiveness curves.
4. Conclusions
Optimal LID planning alternatives for TSS reduction at the basin scale were identified using an integrated approach that coupled NSGA II with SWMM 5. Green roofs, permeable pavements, and tree boxes with fixed parameters and unit costs were considered for seeking optimal planning alternatives in the Cau Bay river basin.
The optimization process yielded a cost–effectiveness curve, which related cost of LID implementation with its corresponding TSS reduction efficiencies. The main conclusion were as follows.
- (1)
- The advantage of the optimization approach was clarified when, with a defined cost of LID implementation, there was a significant difference in the TSS reduction efficiencies between the optimal and non-optimal alternatives. In addition, the decrease in additional TSS removal efficiencies against the increase in LID installation on the pareto curve provides important information for decision-makers when regarding future stormwater management investment. Areas with high TSS loads were given priority for LID implement.
- (2)
- The increase in return periods of rainfall patterns not only resulted in a reduction in TSS removal efficiencies of LID practices at the outfall of the study area, but also spatially changed in TSS removal efficiencies of the sub-catchments.
- (3)
- The return period of the rainfall patterns utilized for LID design should not exceed 2 years.
To disseminate the simulation–multi-optimization approach for LID practices at the basin scale in Vietnam, the availability of the observed data of the water quality, as well as the precise estimation of unit cost of various LID types, should be improved to increase the accuracy of the results. The accurately optimized alternatives can aid the authorities in making a final decision.
Funding
The study was partially supported by a Grant-in-Aid for Scientific Research from Thuyloi University, Vietnam.
Acknowledgments
The author is grateful to Jing Wu at Clean Water Program, San Francisco Estuary Institute for providing his program.
Conflicts of Interest
The author declare no conflict of interest.
References
- Guo, J.C.Y.; Urbonas, B. Maximized Detention Volume Determined by Runoff Capture Ratio. J. Water Resour. Plan. Manag. 1996, 22, 33–39. [Google Scholar] [CrossRef]
- Bilotta, G.S.; Brazier, R.E. Understanding the influence of suspended solids on water quality and aquatic biota. Water Res. 2008, 42, 2849–2861. [Google Scholar] [CrossRef] [PubMed]
- Hunt, W.F.; Traver, R.G.; Davis, A.P.; Emerson, C.H.; Collins, K.A.; Stagge, J.H. Low impact development practices: Designing to infiltrate in urban environments. In Effects of Urbanization on Groundwater; Chang, N., Ed.; American Society of Civil Engineering (ASCE): Reston, VA, USA, 2010; pp. 308–343. [Google Scholar]
- Coffman, L.S.; Goo, R.; Frederick, R. Low-Impact Development: An Innovative Alternative Approach to Stormwater Management. In Proceedings of the 29th Annual Water Resources Planning and Management Conference, Tempe, AZ, USA, 6–9 June 1999; pp. 1–10. [Google Scholar]
- Baek, S.S.; Choi, D.H.; Jung, J.W.; Lee, H.J.; Lee, H.; Yoon, K.S.; Cho, K.H. Optimizing low impact development (LID) for stormwater runoff treatment in urban area, Korea: Experimental and modeling approach. Water Res. 2015, 86, 122–131. [Google Scholar] [CrossRef]
- Hsieh, C.; Davis, A.P. Evaluation and Optimization of Bioretention Media for Treatment of Urban Storm Water Runoff. J. Environ. Eng. 2006, 131, 1521–1531. [Google Scholar] [CrossRef] [Green Version]
- Hunt, W.F.; Smith, J.T.; Jadlocki, S.J.; Hathaway, J.M.; Eubanks, P.R. Pollutant Removal and Peak Flow Mitigation by a Bioretention Cell in Urban Charlotte, N.C. J. Environ. Eng. 2008, 134, 403–408. [Google Scholar] [CrossRef]
- Hatt, B.E.; Fletcher, T.D.; Deletic, A. Hydrologic and pollutant removal performance of stormwater biofiltration systems at the field scale. J. Hydrol. 2009, 36, 310–321. [Google Scholar] [CrossRef]
- Braswell, A.S.; Anderson, A.R.; Hunt, W.F. Hydrologic and Water Quality Evaluation of a Permeable Pavement and Biofiltration Device in Series. Water 2018, 10, 33. [Google Scholar] [CrossRef] [Green Version]
- Abdollahian, S.; Kazemi, H.; Thomas, R.; Gullapalli, V. Stormwater Quality Benefits of Permeable Pavement Systems with Deep Aggregate Layers. Environments 2018, 5, 68. [Google Scholar] [CrossRef] [Green Version]
- Gong, Y.; Yin, D.; Li, J.; Zhang, X.; Wang, W.; Fang, X.; Shi, H.; Wang, Q. Science of the Total Environment Performance assessment of extensive green roof runoff flow and quality control capacity based on pilot experiments. Sci. Total Environ. 2019, 687, 505–515. [Google Scholar] [CrossRef]
- Macavoy, S.E.; Plank, K.; Mucha, S.; Williamson, G. Effectiveness of foam-based green surfaces in reducing nitrogen and suspended solids in an urban installation. Ecol. Eng. 2016, 91, 257–264. [Google Scholar] [CrossRef]
- Eckart, K.; McPhee, Z.; Bolisetti, T. Multiobjective optimization of low impact development stormwater controls. J. Hydrol. 2018, 562, 564–576. [Google Scholar] [CrossRef]
- Duan, H.; Fei, L.; Yan, H. Multi-Objective Optimal Design of Detention Tanks in the Urban Stormwater Drainage System: LID Implementation and Analysis. Water Resour. Manag. 2016, 30, 4635–4648. [Google Scholar] [CrossRef]
- Liu, Y.; Theller, L.O.; Pijanowski, B.C.; Engel, B.A. Optimal Selection and Placement of Green Infrastructure to Reduce Impacts of Land Use Change and Climate Change on Hydrology and Water Quality: An Application to the Trail Creek Watershed, Indiana. Sci. Total Environ. 2016, 553, 149–163. [Google Scholar] [CrossRef] [PubMed]
- Damodaram, C.; Zechman, E.M. Simulation-Optimization Approach to Design Low Impact Development for Managing Peak Flow Alterations in Urbanizing Watersheds. J. Water Resour. Plan. Manag. 2013, 139, 290–298. [Google Scholar] [CrossRef]
- Zare, S.O.; Saghafian, B.; Shamsai, A. Multi-objective optimization for combined quality-quantity urban runoff control. Hydrol. Earth Syst. Sci. 2012, 16, 4531–4542. [Google Scholar] [CrossRef] [Green Version]
- Wu, J.; Kauhanen, P.G.; Hunt, J.A.; Senn, D.B.; Hale, T.; McKee, L.J. Optimal Selection and Placement of Green Infrastructure in Urban Watersheds for PCB Control. J. Sustain. Water Built Environ. 2018, 5, 04018019. [Google Scholar] [CrossRef]
- MONRE. National Environmental Report in 2018: Water Environment of River Basins; Natural Resources, Environment and Cartography: Ha Noi, Vietnam, 2018; pp. 1–158. [Google Scholar]
- Loc, H.; Babel, M.; Weesakul, S.; Irvine, K.; Duyen, P. Exploratory Assessment of SUDS Feasibility in Nhieu Loc-Thi Nghe Basin, Ho Chi Minh City, Vietnam. Br. J. Environ. Clim. Chang. 2015, 5, 91–103. [Google Scholar] [CrossRef]
- Hai, D.M. Selection and Palacement of Low Impact Development for Cau Bay River Basin, Ha Noi. J. Water Resour. Environ. Eng. 2019, 3, 29–36. [Google Scholar]
- Rossman, L.A. Storm Water Management Model User’s Manual, Version 5.0; EPA/600/R; United States Environment Protection Agency: Washington, DC, USA, 2010; p. 285.
- Chow, V.T.; Maidment, D.R.; Mays, L.W. Applied Hydrology; Mc Graw-Hill: New York, NY, USA, 1988. [Google Scholar]
- Krebs, G.; Kokkonen, T.; Valtanen, M.; Koivusalo, H.; Setälä, H. A high resolution application of a stormwater management model (SWMM) using genetic parameter optimization. Urban Water J. 2013, 10, 394–410. [Google Scholar] [CrossRef]
- Zhang, G. Development of A Multi-Objective Optimization Framework for Implementing Low Impact Development Scenarios in An Urbanizing Watershed; The Pennsylvania State University: State College, PA, USA, 2009. [Google Scholar]
- Nash, J.E.; Sutcliffe, J.V. River flow forecasting through conceptual models part I—A discussion of principles. J. Hydrol. 1970, 10, 282–290. [Google Scholar] [CrossRef]
- Tu, M.; Smith, P. Modeling Pollutant Buildup and Washoff Parameters for SWMM Based on Land Use in a Semiarid Urban Watershed. Water Air Soil Pollut. 2018, 229, 15. [Google Scholar] [CrossRef]
- Hunt, W.F.; Jarrett, A.R.; Smith, J.T.; Sharkey, L.J. Evaluating Bioretention Hydrology and Nutrient Removal at Three Field Sites in North Carolina. ASCE J. Irrig. Drain. Eng. 2006, 132, 600–608. [Google Scholar] [CrossRef]
- Li, H.; Davis, A. Water Quality Improvement through Reductions of Pollutant Loads using Bioretention. J. Environ. Eng. 2009, 135, 567–576. [Google Scholar] [CrossRef]
- Deb, K.; Pratap, A.; Agarwal, S.; Meyarivan, T. A fast and elitist multiobjective genetic algorithm: NSGA-II. IEEE Trans. Evol. Comput. 2002, 6, 182–197. [Google Scholar] [CrossRef] [Green Version]
Figure 1.
Map of the study area.

Figure 2.
Simulated and observed water depths in calibration (a) and validation (b).

Figure 3.
Total suspended solid (TSS) cost–effectiveness curve.

Figure 4.
Percentage of each LID configuration for the three optimal TSS load reduction solutions: 10%, 25%, and 40%: (a) percentage of the number of each LID; (b) percentage of the area treated by each LID.
Figure 4.
Percentage of each LID configuration for the three optimal TSS load reduction solutions: 10%, 25%, and 40%: (a) percentage of the number of each LID; (b) percentage of the area treated by each LID.


Figure 5.
Percentage of LID area identified for each sub-catchment with a 2-year return period for cases: (a) 10% reduction; (b) 25% reduction; (c) 40% reduction
Figure 5.
Percentage of LID area identified for each sub-catchment with a 2-year return period for cases: (a) 10% reduction; (b) 25% reduction; (c) 40% reduction

Figure 6.
Comparison of the cost–effectiveness curves with various designed storms.

Figure 7.
Variation in TSS reduction efficiency of sub-catchments with various design storms: (a) high scenario means 10% TSS removal efficiency at the outfall; (b) medium scenario means 20% TSS removal efficiency; (c) low scenario means 30% TSS removal efficiency.
Figure 7.
Variation in TSS reduction efficiency of sub-catchments with various design storms: (a) high scenario means 10% TSS removal efficiency at the outfall; (b) medium scenario means 20% TSS removal efficiency; (c) low scenario means 30% TSS removal efficiency.

Figure 8.
Variations in interquartile range of the TSS reduction efficiency of sub-catchments with various design storms.
Figure 8.
Variations in interquartile range of the TSS reduction efficiency of sub-catchments with various design storms.

Figure 9.
Trade-off between performance of LID strategies for 2- and 40-year events; label indicates the event that was used to optimize a solution.
Figure 9.
Trade-off between performance of LID strategies for 2- and 40-year events; label indicates the event that was used to optimize a solution.


Table 1.
Calibrated parameters of the Storm Water Management Model (SWMM) model.
| Parameter | Description | Calibration Interval | Value |
|---|---|---|---|
| n1 | Manning’s roughness for pervious area | 0.005–0.5 | 0.03 |
| n2 | Manning’s roughness for impervious area | 0.001–0.02 | 0.015 |
| n3 | Manning’s roughness for concrete conduits | 0.001–0.03 | 0.012 |
| n4 | Manning’s roughness for irregular conduits | 0.001–0.03 | 0.03 |
| D1 | Depth of depression storage on pervious area | 2.28–5.08 | 2.67 |
| D2 | Depth of depression storage on impervious area | 0.25–2.54 | 1.25 |
Table 2.
Parameters of low impact developments (LIDs) for optimization.
| Layer | Parameter | Green Roof | Tree Box | Permeable Pavement |
|---|---|---|---|---|
| Surface | Area (m2) | 50 | 6 | 400 |
| Growing media | Depth (cm) | 15 | 45.7 | N/A |
| Porosity (%) | 41 | 41 | ||
| Conductivity(cm/h) | 12.7 | 12.7 | ||
| Suction head (cm) | 6.1 | 6.1 | ||
| Pavement | Thickness (cm) | N/A | N/A | 10.2 |
| Void ratio | 0.18 | |||
| Permeability (cm/h) | 12.7 | |||
| Storage | Height (cm) | 12 | 30.5 | 30.5 |
| Void ratio | 0.54 | 0.54 | 0.67 | |
| Conductivity (cm/h) | 2.5 | 2.5 | 2.5 | |
| Underdrain | Drain coefficient (cm/h) | 1.3 | 1.3 | 1.3 |
| Drain exponent | 0.5 | 0.5 | 0.5 |
Table 3.
Unit cost of LID types.
| No. | LID Types | Unit | Unit Cost | Remarks |
|---|---|---|---|---|
| 1 | Green Roof | $USD/m2 | 150 | The unit cost of each LID type was estimated based on the typical design and the local norms |
| 2 | Permeable Pavement | $USD/m2 | 60 | |
| 3 | Tree Box | $USD/m2 | 120 |
© 2020 by the author. Licensee MDPI, Basel, Switzerland. This article is an open access article distributed under the terms and conditions of the Creative Commons Attribution (CC BY) license (http://creativecommons.org/licenses/by/4.0/).
Share and Cite
MDPI and ACS Style
Minh Hai, D. Optimal Planning of Low-Impact Development for TSS Control in the Upper Area of the Cau Bay River Basin, Vietnam. Water 2020, 12, 533. https://doi.org/10.3390/w12020533
AMA Style
Minh Hai D. Optimal Planning of Low-Impact Development for TSS Control in the Upper Area of the Cau Bay River Basin, Vietnam. Water. 2020; 12(2):533. https://doi.org/10.3390/w12020533
Chicago/Turabian StyleMinh Hai, Dang. 2020. "Optimal Planning of Low-Impact Development for TSS Control in the Upper Area of the Cau Bay River Basin, Vietnam" Water 12, no. 2: 533. https://doi.org/10.3390/w12020533
Note that from the first issue of 2016, this journal uses article numbers instead of page numbers. See further details here.