Genetic Variability of HIV-1 for Drug Resistance Assay Development


Abstract
:1. Introduction
2. Materials and Methods
2.1. Sequence Selection
2.2. Analysis of Codons
2.3. Analysis of Flanking Segments
3. Results
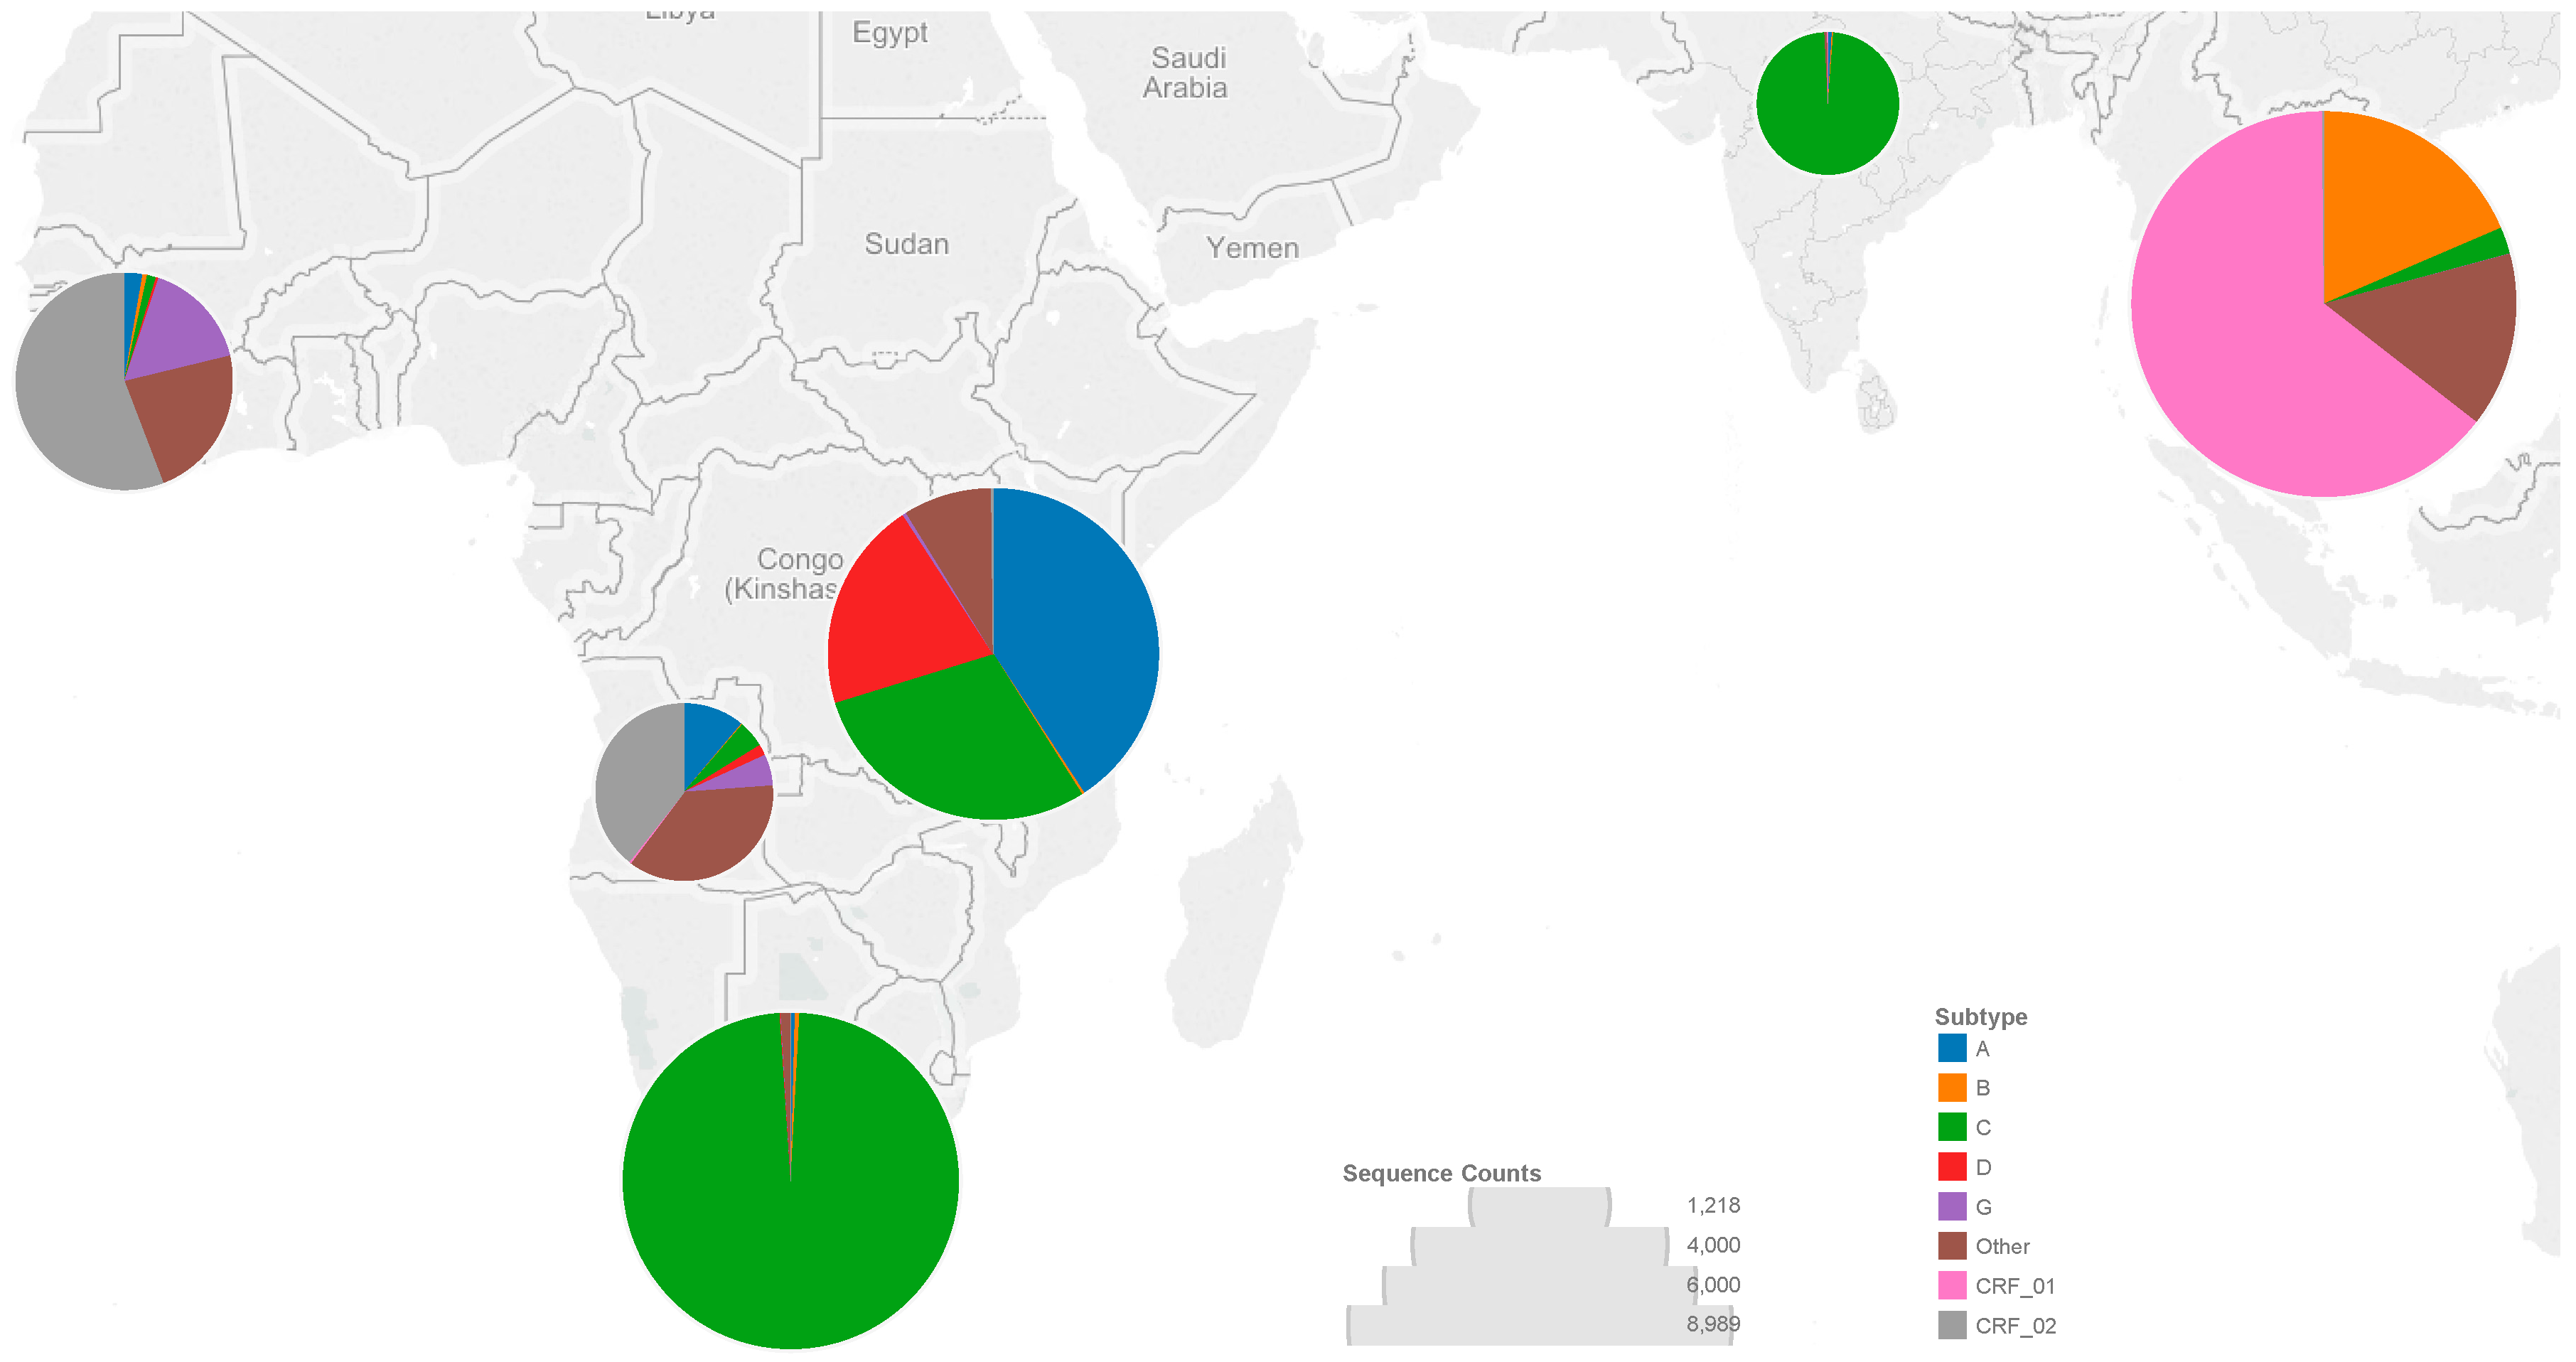
3.1. Sequences

3.2. Codons

| DRM Position | Codon | AA | A n = 2968 | B n = 1725 | C n = 9405 | D n = 1355 | G n = 597 | CRF_01 n = 5590 | CRF_02 n = 2342 |
|---|---|---|---|---|---|---|---|---|---|
| 65 | WT (23,365; 98.1) | ||||||||
| AAA | K | 96.7 | 97.8 | 0.9 | 97.6 | 98.8 | 98.9 | 97.7 | |
| AAG | K | 3.3 | 2.2 | 99.1 | 2.4 | 1.2 | 1.1 | 2.4 | |
| Mutant (446; 1.9) | |||||||||
| AGA | R | 84.6 | 100 | 3.7 | 100 | 100 | 85.9 | 93.1 | |
| AGG | R | 7.7 | 0 | 95.6 | 0 | 0 | 1.9 | 3.5 | |
| AAT | N | 7.7 | 0 | 0.7 | 0 | 0 | 2.8 | 0 | |
| AAC | N | 0 | 0 | 0 | 0 | 0 | 9.4 | 3.5 | |
| Total coverage | 100.0 | 100.0 | 100.0 | 100.0 | 100.0 | 100.0 | 100.0 | ||
| 103 | WT (20,748; 89.8) | ||||||||
| AAA | K | 95.6 | 95.7 | 91.6 | 96.5 | 92.2 | 95.7 | 98.0 | |
| AAG | K | 4.2 | 2.1 | 6.4 | 3.2 | 6.8 | 3.8 | 1.7 | |
| AGA | R | 0.3 | 2.3 | 2.0 | 0.2 | 1.0 | 0.6 | 0.2 | |
| Mutant (2369; 10.3) | |||||||||
| AAC | N | 84.1 | 77.8 | 77.3 | 75.5 | 80.8 | 77.6 | 82.6 | |
| AAT | N | 11.2 | 17.8 | 18.5 | 20.4 | 19.2 | 19.2 | 16.9 | |
| AGC | S | 4.7 | 4.3 | 4.3 | 2.0 | 0 | 2.5 | 0.5 | |
| ACA | T | 0 | 0 | 0 | 2.0 | 0 | 0.7 | 0 | |
| Total coverage | 99.83 | 99.58 | 99.65 | 99.92 | 99.28 | 99.64 | 99.96 | ||
| 106 | WT (22,427; 96.0) | ||||||||
| GTA | V | 97.51 | 90.1 | 13.3 | 95.4 | 96.2 | 86.4 | 97.4 | |
| GTG | V | 1.7 | 2.6 | 86.6 | 4.0 | 1.2 | 8.5 | 1.9 | |
| ATA | I | 0.8 | 7.4 | 0.2 | 0.6 | 2.6 | 5.2 | 0.7 | |
| Mutant (926; 3.4) | |||||||||
| GCA | A | 85.7 | 70.8 | 0.4 | 80.0 | 90.9 | 37.5 | 75.0 | |
| GCG | A | 0 | 0 | 2.4 | 0 | 0 | 0 | 0 | |
| ATG | M | 14.3 | 29.2 | 97.2 | 20.0 | 9.1 | 62.5 | 25.0 | |
| Total coverage | 99.49 | 99.64 | 99.34 | 99.55 | 100 | 99.48 | 99.66 | ||
| 181 | WT (21,972; 93.5) | ||||||||
| TAT | Y | 95.7 | 97.5 | 96.3 | 95.5 | 10.0 | 98.4 | 8.6 | |
| TAC | Y | 4.3 | 2.5 | 3.8 | 4.5 | 90.0 | 1.6 | 91.4 | |
| Mutant (1541; 6.6) | |||||||||
| TGT | C | 81.8 | 96.4 | 88.3 | 88.4 | 9.4 | 86.5 | 8.5 | |
| TGC | C | 7.3 | 0.9 | 4.3 | 4.7 | 87.1 | 3.0 | 87.3 | |
| ATT | I | 5.5 | 0.9 | 3.9 | 0 | 0 | 4.8 | 0 | |
| ATC | I | 0 | 0.9 | 0.2 | 0 | 2.4 | 0.2 | 2.1 | |
| GTT | V | 5.5 | 0.9 | 3.2 | 7.0 | 0 | 5.5 | 0.7 | |
| GTC | V | 0 | 0 | 0 | 0 | 1.2 | 0.2 | 1.4 | |
| Total coverage | 100.0 | 99.9 | 100.0 | 100.0 | 99.8 | 100.0 | 100.0 | ||
| 184 | WT (19,231; 81.0) | ||||||||
| ATG | M | 100.0 | 100.0 | 100.0 | 100.0 | 100.0 | 100.0 | 100.0 | |
| Mutant (4498; 19.0) | |||||||||
| GTG | V | 90.3 | 78.1 | 90.2 | 89.4 | 83.3 | 81.5 | 87.6 | |
| GTA | V | 9.7 | 7.3 | 6.9 | 9.6 | 15.4 | 14.7 | 10.4 | |
| ATA | I | 0 | 14.6 | 3.0 | 1.0 | 1.3 | 3.8 | 2.0 | |
| Total coverage | 100.0 | 99.5 | 99.9 | 99.9 | 99.8 | 99.8 | 99.9 | ||
| 190 | WT (22,097; 94.7) | ||||||||
| GGA | G | 95.2 | 95.3 | 95.4 | 96.4 | 90.1 | 94.6 | 92.8 | |
| GGC | G | 1.5 | 3.2 | 1.3 | 0.5 | 1.3 | 3.4 | 1.6 | |
| GGG | G | 3.3 | 1.5 | 3.3 | 3.1 | 8.6 | 2.0 | 5.7 | |
| Mutant (1243; 5.3) | |||||||||
| GCA | A | 92.9 | 70.7 | 83.4 | 89.7 | 92.3 | 87.9 | 89.0 | |
| GCG | A | 0 | 1.2 | 1.7 | 3.5 | 2.6 | 2.2 | 1.4 | |
| GCC | A | 0 | 2.4 | 0.8 | 0 | 0 | 1.2 | 0 | |
| AGC | S | 2.9 | 24.4 | 3.9 | 3.5 | 2.6 | 2.7 | 2.7 | |
| AGT | S | 0 | 1.2 | 1.9 | 0 | 2.6 | 1.9 | 2.7 | |
| TCA | S | 1.4 | 0 | 0.9 | 0 | 0 | 1.5 | 1.4 | |
| GAA | E | 2.9 | 0 | 4.5 | 0 | 0 | 1.7 | 2.7 | |
| CAA | Q | 0 | 0 | 3.0 | 3.5 | 0 | 1.0 | 0 | |
| Total coverage | 99.7 | 99.9 | 99.5 | 99.6 | 99.1 | 99.8 | 99.8 |
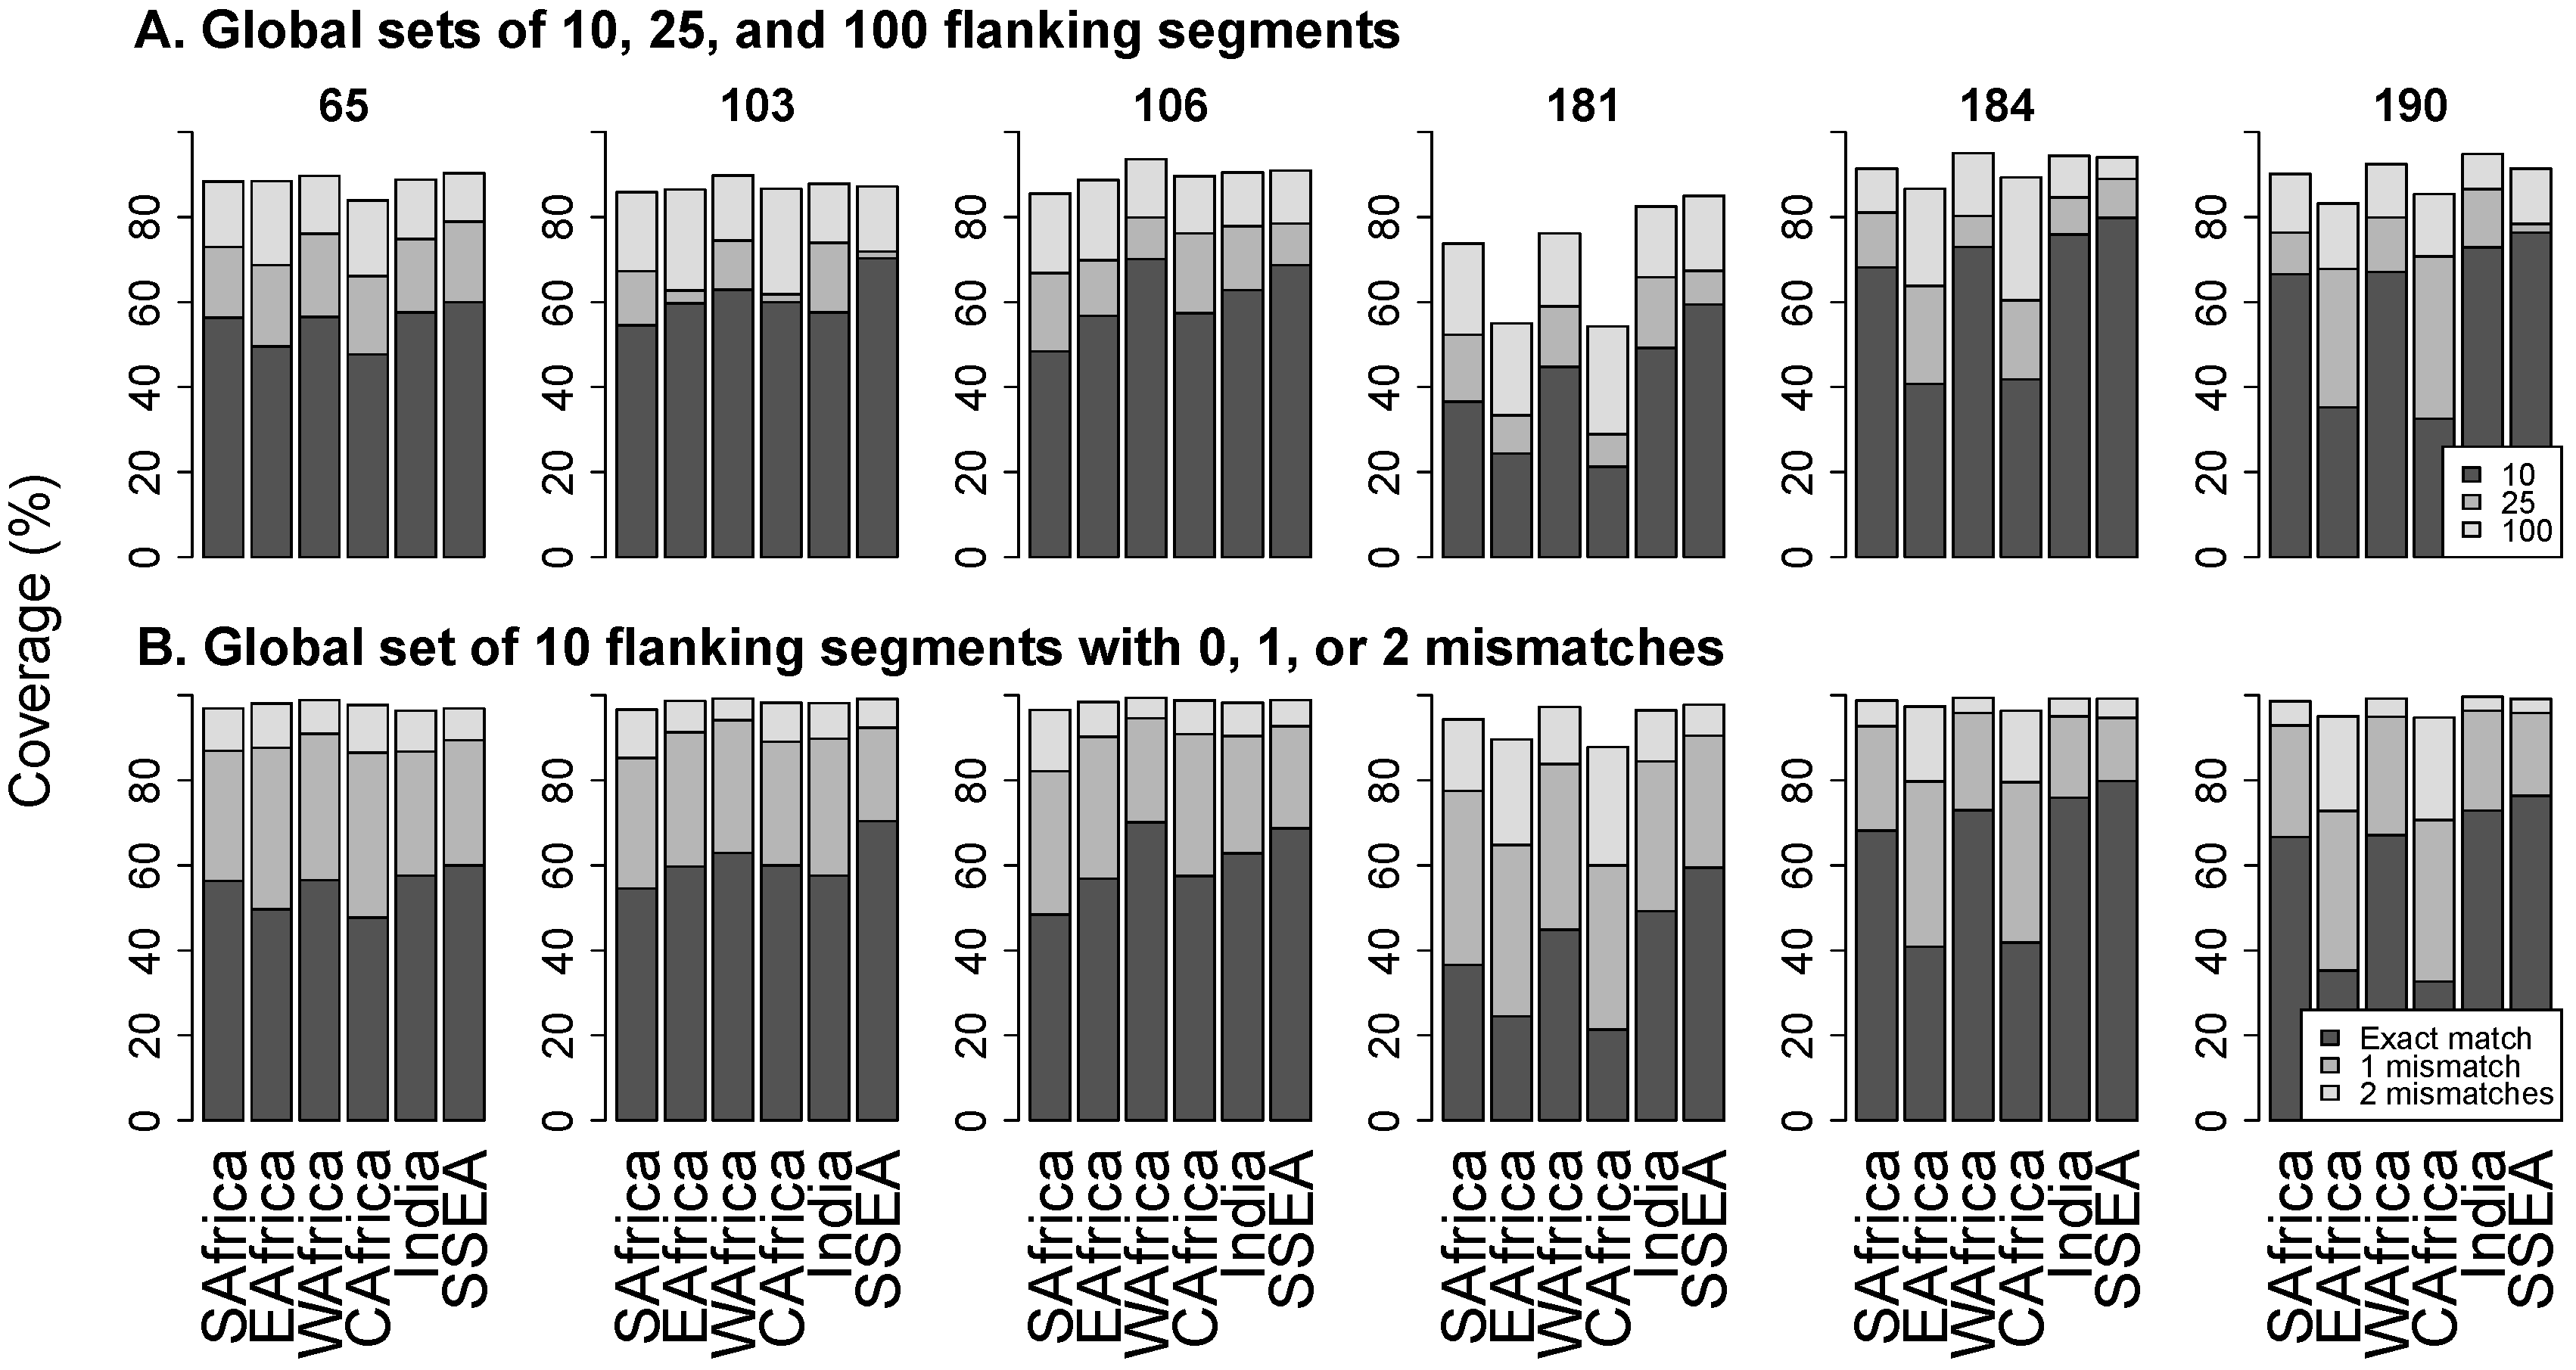
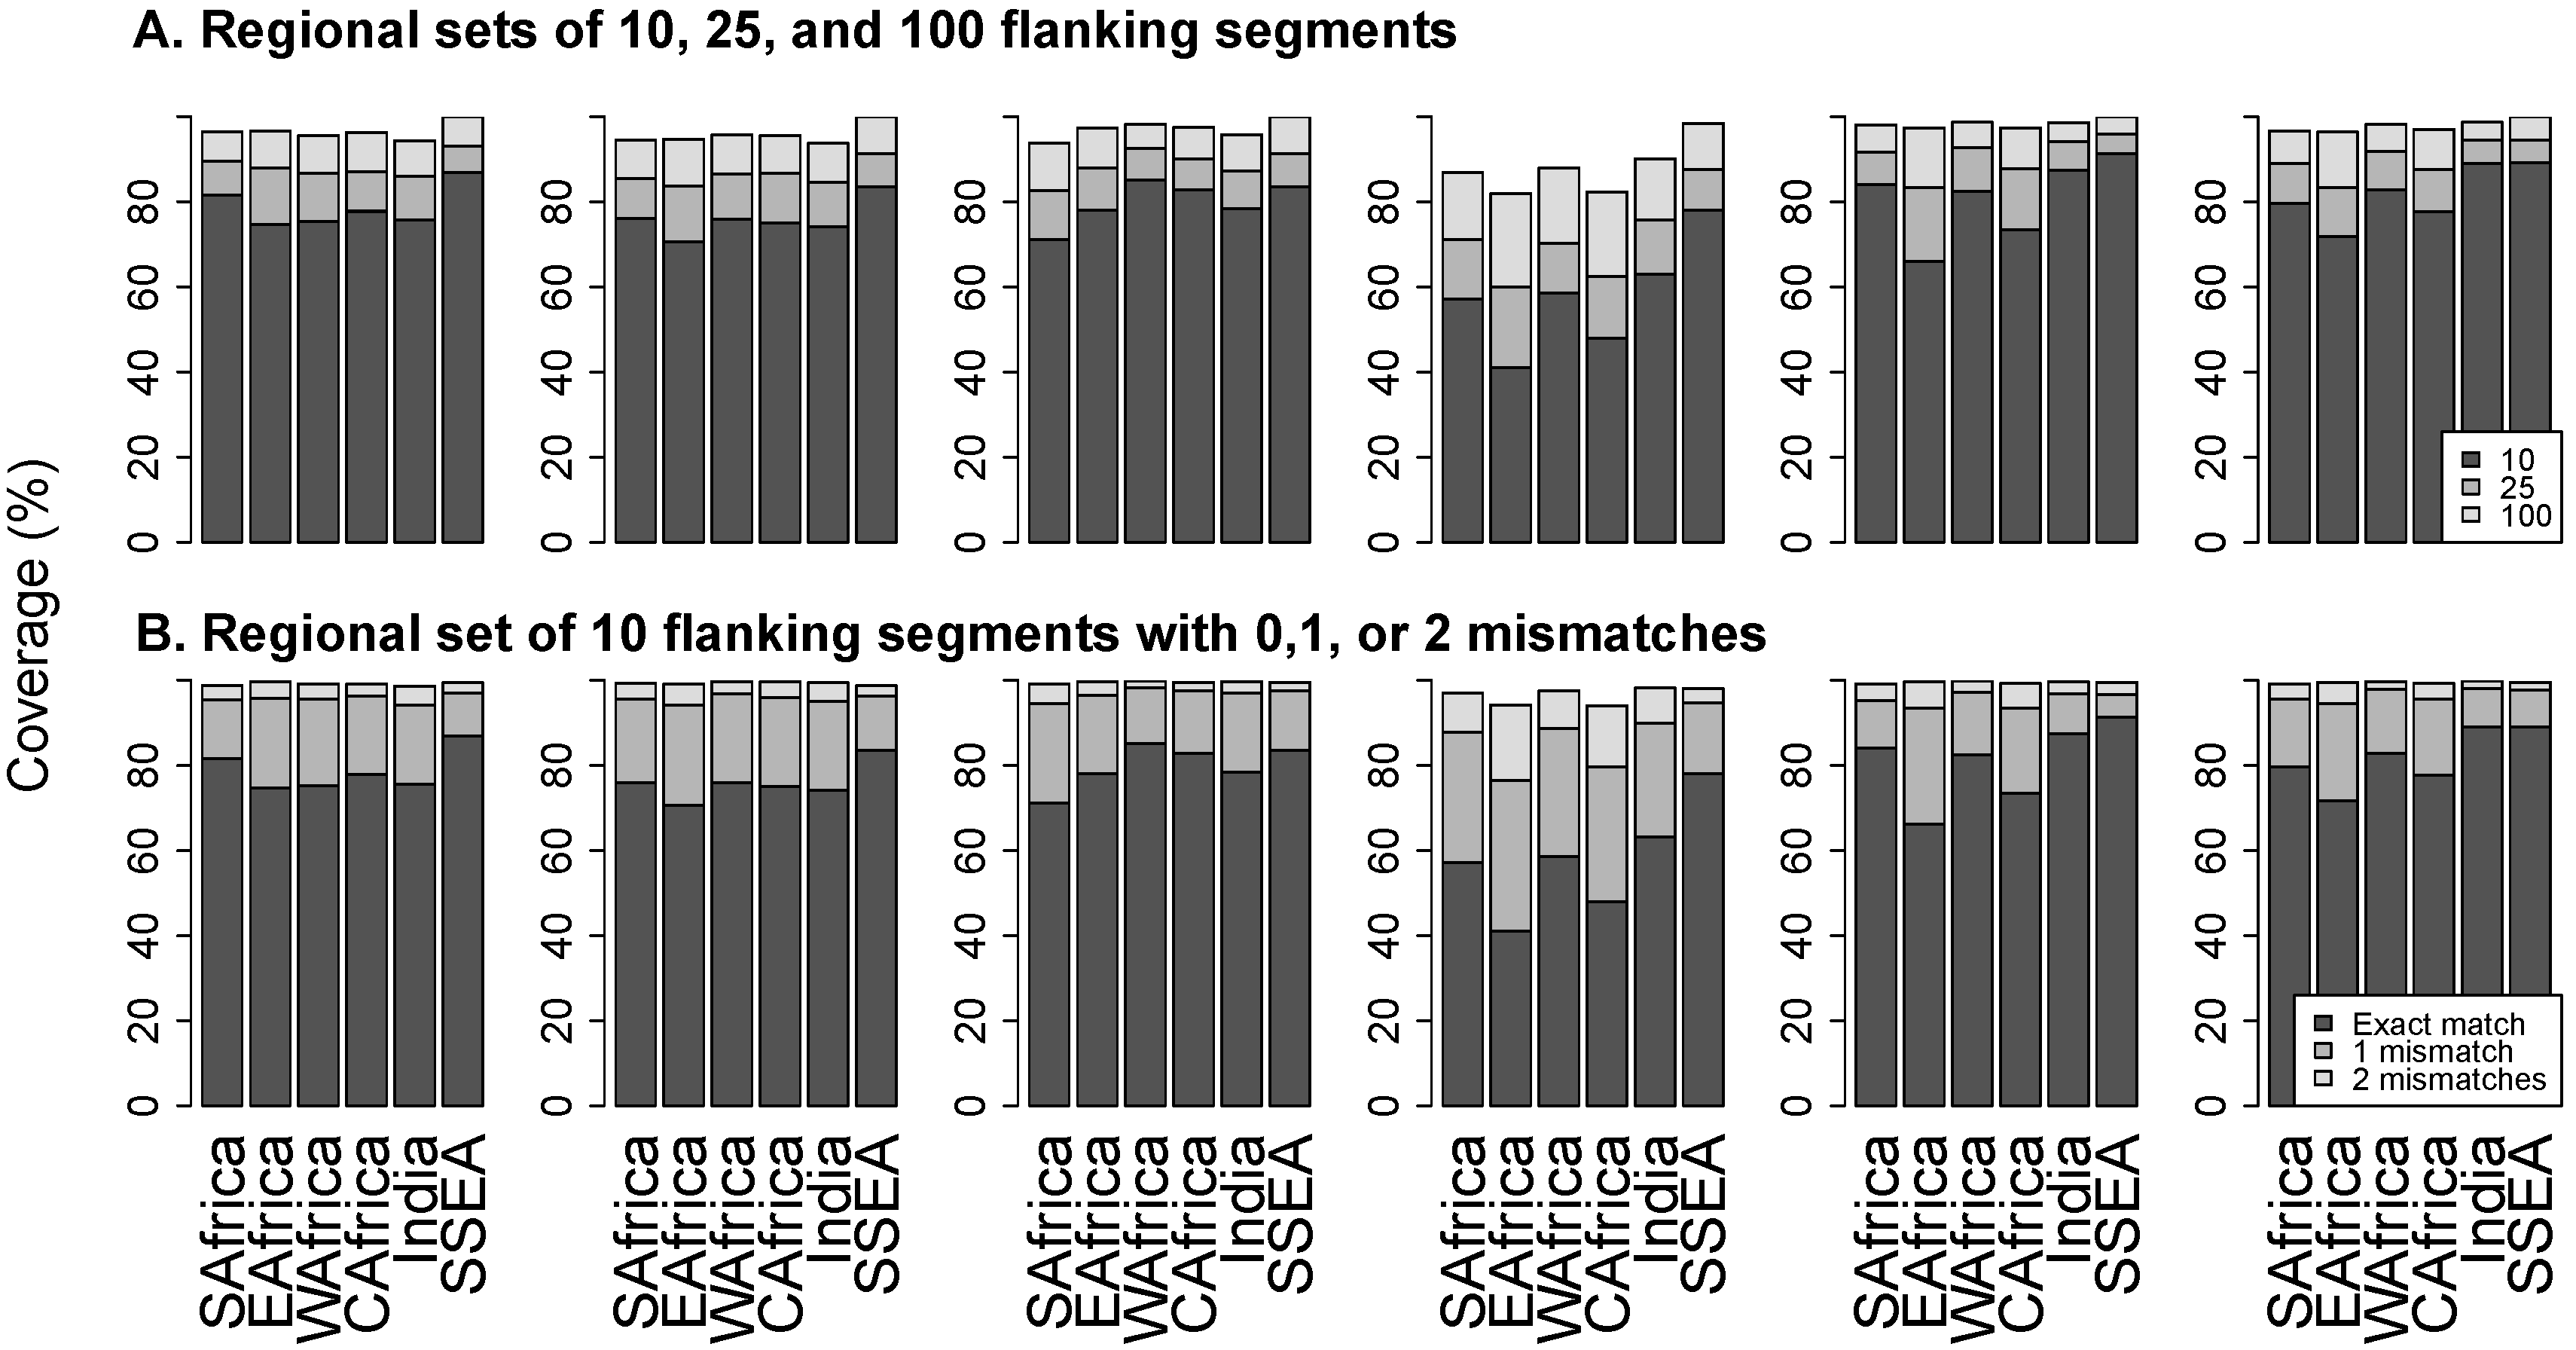
3.3. Flanking Segments


3.4. Online Program
4. Discussion
5. Conclusions
Acknowledgments
Author Contributions
Conflicts of Interest
References
- Rhee, S.Y.; Blanco, J.L.; Jordan, M.R.; Taylor, J.; Lemey, P.; Varghese, V.; Hamers, R.L.; Bertagnolio, S.; de Wit, T.F.; Aghokeng, A.F.; et al. Geographic and temporal trends in the molecular epidemiology and genetic mechanisms of transmitted HIV-1 drug resistance: An individual-patient- and sequence-level meta-analysis. PLoS Med. 2015, 12, e1001810. [Google Scholar]
- Bronze, M.; Aitken, S.C.; Wallis, C.L.; Steegen, K.; Stuyver, L.J.; de Wit, T.F.; Stevens, W. Evaluation of an affordable HIV-1 virological failure assay and antiretroviral drug resistance genotyping protocol. J. Virol. Methods 2013, 194, 300–307. [Google Scholar] [CrossRef] [PubMed]
- Aitken, S.C.; Bronze, M.; Wallis, C.L.; Stuyver, L.; Steegen, K.; Balinda, S.; Kityo, C.; Stevens, W.; Rinke de Wit, T.F.; Schuurman, R. A pragmatic approach to HIV-1 drug resistance determination in resource-limited settings by use of a novel genotyping assay targeting the reverse transcriptase-encoding region only. J. Clin. Microbiol. 2013, 51, 1757–1761. [Google Scholar] [CrossRef] [PubMed]
- Lapointe, H.R.; Dong, W.; Lee, G.Q.; Bangsberg, D.R.; Martin, J.N.; Mocello, A.R.; Boum, Y.; Karakas, A.; Kirkby, D.; Poon, A.F.; et al. HIV drug resistance testing by high-multiplex “wide” sequencing on the MiSeq instrument. Antimicrob. Agents Chemother. 2015, 59, 6824–6833. [Google Scholar] [CrossRef] [PubMed]
- Ritchie, A.V.; Ushiro-Lumb, I.; Edemaga, D.; Joshi, H.A.; de Ruiter, A.; Szumilin, E.; Jendrulek, I.; McGuire, M.; Goel, N.; Sharma, P.I.; et al. Samba HIV semiquantitative test, a new point-of-care viral-load-monitoring assay for resource-limited settings. J. Clin. Microbiol. 2014, 52, 3377–3383. [Google Scholar] [CrossRef] [PubMed]
- Scott, L.; Gous, N.; Carmona, S.; Stevens, W. Laboratory evaluation of the liat HIV Quant (IQuum) whole-blood and plasma HIV-1 viral load assays for point-of-care testing in South Africa. J. Clin. Microbiol. 2015, 53, 1616–1621. [Google Scholar] [CrossRef] [PubMed]
- Haleyur Giri Setty, M.K.; Hewlett, I.K. Point of care technologies for HIV. AIDS Res. Treat. 2014, 2014. [Google Scholar] [CrossRef] [PubMed]
- Panpradist, N.; Beck, I.; Chung, M.; Kiarie, J.; Frenkel, L.M.; Lutz, B.R. Simplified paper format for detecting HIV drug resistance in clinical specimines by oligonucleotide ligation assay (OLA). In Proceedings of the 2015 International HIV Drug Resistance Workshop, Seattle, WA, USA, 21–22 February 2015; IHL Press: Seattle, WA, USA, 2015. [Google Scholar]
- MacLeod, I.J.; Rowley, C.F.; Essex, M. Pan degenerate amplification and adaptation for highly sensitive detection of ARV drug resistance. In Proceedings of the 2014 Conference on Retroviruses and Opportunistic Infections, Boston, MA, USA, 3–6 March 2014; IAS-USA: Boston, MA, USA, 2014. Abstract Number 606. [Google Scholar]
- Morabito, K.; Kantor, R.; Tai, W.; Schreier, L.; Tripathi, A. Detection of HIV-1 minority variants containing the K103N drug-resistance mutation using a simple method to amplify RNA targets (SMART). J. Mol. Diagn. 2013, 15, 401–412. [Google Scholar] [CrossRef] [PubMed]
- Zhang, G.; Cai, F.; Zhou, Z.; DeVos, J.; Wagar, N.; Diallo, K.; Zulu, I.; Wadonda-Kabondo, N.; Stringer, J.S.; Weidle, P.J.; et al. Simultaneous detection of major drug resistance mutations in the protease and reverse transcriptase genes for HIV-1 subtype C by use of a multiplex allele-specific assay. J. Clin. Microbiol. 2013, 51, 3666–3674. [Google Scholar] [CrossRef] [PubMed]
- Rhee, S.Y.; Jordan, M.R.; Raizes, E.; Chua, A.; Parkin, N.; Kantor, R.; van Zyl, G.U.; Mukui, I.; Hosseinipour, M.C.; Frenkel, L.M.; et al. HIV-1 drug resistance mutations: Potential applications for point-of-care genotypic resistance testing. PLoS ONE 2015, 10, e0145772. [Google Scholar] [CrossRef] [PubMed]
- Lal, R.B.; Chakrabarti, S.; Yang, C. Impact of genetic diversity of HIV-1 on diagnosis, antiretroviral therapy & vaccine development. Indian J. Med. Res. 2005, 121, 287–314. [Google Scholar] [PubMed]
- Rhee, S.Y.; Gonzales, M.J.; Kantor, R.; Betts, B.J.; Ravela, J.; Shafer, R.W. Human immunodeficiency virus reverse transcriptase and protease sequence database. Nucleic Acids Res. 2003, 31, 298–303. [Google Scholar] [CrossRef] [PubMed]
- United Nations Geoscheme. Available online: https://en.wikipedia.org/wiki/United_Nations_geoscheme (accessed on 30 September 2015).
- Martinez-Cajas, J.L.; Pai, N.P.; Klein, M.B.; Wainberg, M.A. Differences in resistance mutations among HIV-1 non-subtype B infections: A systematic review of evidence (1996–2008). J. Int. AIDS Soc. 2009, 12. [Google Scholar] [CrossRef] [PubMed]
- Beck, I.A.; Crowell, C.; Kittoe, R.; Bredell, H.; Machaba, M.; Willamson, C.; Janssens, W.; Jallow, S.; van der Groen, G.; Shao, Y.; et al. Optimization of the oligonucleotide ligation assay, a rapid and inexpensive test for detection of HIV-1 drug resistance mutations, for non-north american variants. J. Acquir. Immune Defic. Syndr. 2008, 48, 418–427. [Google Scholar] [CrossRef] [PubMed]
- Hadiwikarta, W.W.; van Dorst, B.; Hollanders, K.; Stuyver, L.; Carlon, E.; Hooyberghs, J. Targeted resequencing of HIV variants by microarray thermodynamics. Nucleic Acids Res. 2013, 41. [Google Scholar] [CrossRef] [PubMed]
- Schneider, T.D.; Stephens, R.M. Sequence logos: A new way to display consensus sequences. Nucleic Acids Res. 1990, 18, 6097–6100. [Google Scholar] [CrossRef] [PubMed]
- Brenner, B.; Turner, D.; Oliveira, M.; Moisi, D.; Detorio, M.; Carobene, M.; Marlink, R.G.; Schapiro, J.; Roger, M.; Wainberg, M.A. A V106M mutation in HIV-1 clade C viruses exposed to efavirenz confers cross-resistance to non-nucleoside reverse transcriptase inhibitors. AIDS 2003, 17, F1–F5. [Google Scholar] [CrossRef] [PubMed]
- Melikian, G.L.; Rhee, S.Y.; Varghese, V.; Porter, D.; White, K.; Taylor, J.; Towner, W.; Troia, P.; Burack, J.; Dejesus, E.; et al. Non-nucleoside reverse transcriptase inhibitor (NNRTI) cross-resistance: Implications for preclinical evaluation of novel NNRTIs and clinical genotypic resistance testing. J. Antimicrob. Chemother. 2014, 69, 12–20. [Google Scholar] [CrossRef] [PubMed]
- Piao, X.; Sun, L.; Zhang, T.; Gan, Y.; Guan, Y. Effects of mismatches and insertions on discrimination accuracy of nucleic acid probes. Acta Biochim. Pol. 2008, 55, 713–720. [Google Scholar] [PubMed]
- Stadhouders, R.; Pas, S.D.; Anber, J.; Voermans, J.; Mes, T.H.; Schutten, M. The effect of primer-template mismatches on the detection and quantification of nucleic acids using the 5' nuclease assay. J. Mol. Diagn. 2010, 12, 109–117. [Google Scholar] [CrossRef] [PubMed]
- Clutter, D.S.; Sánchez, P.R.; Rhee, S.Y.; Shafer, R.W. Variability in HIV-1 Sequences from Low & Middle Income Countries (LMICs). Available online: http://hivdb.stanford.edu/cgi-bin/Probe.cgi (accessed on 9 February 2016).
- Servais, J.; Lambert, C.; Fontaine, E.; Plesseria, J.M.; Robert, I.; Arendt, V.; Staub, T.; Schneider, F.; Hemmer, R.; Burtonboy, G.; et al. Comparison of DNA sequencing and a line probe assay for detection of human immunodeficiency virus type 1 drug resistance mutations in patients failing highly active antiretroviral therapy. J. Clin. Microbiol. 2001, 39, 454–459. [Google Scholar] [CrossRef] [PubMed]
- Vahey, M.; Nau, M.E.; Barrick, S.; Cooley, J.D.; Sawyer, R.; Sleeker, A.A.; Vickerman, P.; Bloor, S.; Larder, B.; Michael, N.L.; et al. Performance of the Affymetrix GeneChip HIV PRT 440 platform for antiretroviral drug resistance genotyping of human immunodeficiency virus type 1 clades and viral isolates with length polymorphisms. J. Clin. Microbiol. 1999, 37, 2533–2537. [Google Scholar] [PubMed]
- Basson, A.E.; Rhee, S.Y.; Parry, C.M.; El-Khatib, Z.; Charalambous, S.; de Oliveira, T.; Pillay, D.; Hoffmann, C.; Katzenstein, D.; Shafer, R.W.; et al. Impact of drug resistance-associated amino acid changes in HIV-1 subtype C on susceptibility to newer nonnucleoside reverse transcriptase inhibitors. Antimicrob. Agents Chemother. 2015, 59, 960–971. [Google Scholar] [CrossRef] [PubMed]
- Orum, H.; Wengel, J. Locked nucleic acids: A promising molecular family for gene-function analysis and antisense drug development. Cur. Opin. Mol. Ther. 2001, 3, 239–243. [Google Scholar]
- Kumar, T.S.; Myznikova, A.; Samokhina, E.; Astakhova, I.K. Rapid genotyping using pyrene-perylene locked nucleic acid complexes. Artif. DNA PNA XNA 2013, 4, 58–68. [Google Scholar] [CrossRef] [PubMed]
© 2016 by the authors; licensee MDPI, Basel, Switzerland. This article is an open access article distributed under the terms and conditions of the Creative Commons by Attribution (CC-BY) license (http://creativecommons.org/licenses/by/4.0/).
Share and Cite
Clutter, D.S.; Sánchez, P.R.; Rhee, S.-Y.; Shafer, R.W. Genetic Variability of HIV-1 for Drug Resistance Assay Development. Viruses 2016, 8, 48. https://doi.org/10.3390/v8020048
Clutter DS, Sánchez PR, Rhee S-Y, Shafer RW. Genetic Variability of HIV-1 for Drug Resistance Assay Development. Viruses. 2016; 8(2):48. https://doi.org/10.3390/v8020048
Chicago/Turabian StyleClutter, Dana S., Patricia Rojas Sánchez, Soo-Yon Rhee, and Robert W. Shafer. 2016. "Genetic Variability of HIV-1 for Drug Resistance Assay Development" Viruses 8, no. 2: 48. https://doi.org/10.3390/v8020048